 Sarah S. Wiener1*
 Renate Bush2Amy Nathanson3Kristen Pelz4Marin Palmer5
 Mara L. Alexander1
 David Anderson6Emrys Treasure3Joanne Baggs3Ray Sheffield7
- 1Ecosystem Management Coordination, USDA Forest Service, Washington, DC, United States
- 2Northern Region, USDA Forest Service, Missoula, MT, United States
- 3Southern Region, USDA Forest Service, Atlanta, GA, United States
- 4Rocky Mountain Research Station, USDA Forest Service, Santa Fe, NM, United States
- 5Pacific Northwest Region, USDA Forest Service, Portland, OR, United States
- 6Southwestern Region, USDA Forest Service, Albuquerque, NM, United States
- 7Retired, USDA Forest Service, Hendersonville, NC, United States
Forest Inventory and Analysis (FIA) data provides robust information for the United States Forest Service’s (USFS) mid-to-broad-scale planning and assessments, but ecological challenges (i.e., climate change, wildfire) necessitate increasingly strategic information without significantly increasing field sampling. Small area estimation (SAE) techniques could provide more precision supported by a rapidly growing suite of landscape-scale datasets. We present three Regional case studies demonstrating current FIA uses, how SAE techniques could enhance existing uses, and steps FIA could take to enable SAE applications that are user-friendly, comprehensive, and statistically appropriate. The Northern Region uses FIA data for planning and assessments, but SAE techniques could provide more specificity to guide vegetation management activities. State and transition simulation models (STSM) are run with FIA data in the Southwestern Region to predict effects of treatments and disturbances, but SAE could support model validation and more precision to identify treatable areas. The Southern Region used FIA to identify existing longleaf pine stands and evaluate condition, but SAE techniques within FIA tools would streamline analyses. Each case study demonstrates a desire to have FIA data on non-forested conditions and non-tree variables. Additional tools to measure statistical confidence would help maximize utility. FIA’s SAE techniques could add value to a widely used data set, if FIA can support key supplements to basic data and functionality.
Introduction
The United States Forest Service’s (USFS) National Forest System (NFS) manages 78 million hectares of National Forests and Grasslands. NFS is legally bound to a multiple-use mandate (i.e., timber, recreation, watersheds, and wildlife), which creates complex decision-making environments and diverse information needs. With a vast land base challenged by climate change and increasing wildfire intensity, and a proportionally limited ability to actively manage forest area, collect vegetation data, and analyze and interpret data due to budget and staffing constraints, NFS has a critical need for strategic information that can support adaptive management at the scale of the challenge without greatly increasing data collection and analyses.
Small area estimation (SAE) is a statistical technique used to enhance data in a specific area (i.e., geographic, demographic) with data not confined to that area (Rao, 2003; Jiang and Rao, 2020). SAE borrows strength from larger areas and uses auxiliary information to establish relationships with the response. With National Forest Inventories (NFIs), SAE can integrate auxiliary data (i.e., remote sensing, climate layers, and landscape-scale geospatial data) with field-sampled data. For example, NFIs in Scandinavia were combined with satellite and other geospatial data to parameterize image data and perform pre-processing, enabling enhancement of various monitoring applications (Tomppo et al., 2008). Models improve with more highly correlated auxiliary information and response data, and with higher resolution auxiliary information. For more information on SAE, see Ghosh and Rao (1994); Rao (2003), Pfeffermann (2013); Jiang and Rao (2020). Given NFS’ limited capacity for additional field sampled vegetation data and increased availability of landscape scale data, SAE using NFI data could support land management planning for NFS.
The Forest Inventory and Analysis (FIA) program (the NFI for NFS) is the most comprehensive and consistent national vegetation data set for the agency, delivering a unique set of field-measured data and accompanying analysis tools that provide baseline information and the ability to monitor current vegetation conditions through repeated measurement of permanent plots. FIA operates across all United States land the program defines as “forested” (generally, 10% tree canopy cover) (USFS, 2021b) and uses an annualized, repeated sampling system designed to make estimates of forested land vegetation conditions across multiple scales. FIA plots are on a semisystematic sampling grid. Locations are unbiased geographically, with approximately one plot per 2,428 hectares of forested land, and plot data are collected according to the FIA protocol (USFS, 2021b) in a largely nationally consistent way (Bechtold and Patterson, 2005). FIA forest-plot data are remeasured every 10 years in the western United States, and every 7 or 5 years in the eastern and southern United States (McRoberts et al., 2005). Data about trees and associated characteristics are collected on all inventoried plots (with some differences in tree data among the four FIA units (USFS, 2021c). Additional information about down-woody material, understory vegetation, and noxious weeds may be collected depending upon FIA unit.
Forest Inventory and Analysis data are useful for NFS to assess vegetation conditions at the national to Regional scale. NFS contains nine Regions that each manage approximately 9 to 14 million hectares (USFS, 2020). At this scale, with approximately 1 plot per 2,428 hectares of forested land, plot numbers are sufficient for estimates to have small errors, even when broken into multiple sub-categories (such as forest land area, with large trees present, by forest type). Most individual National Forests or Grasslands (hereafter referred to as Units) are at least 100 thousand hectares, with most western Units over 300 thousand hectares, and up to 1.7 million hectares (USFS, 2020). Statistical analysis suggest that estimates are unbiased when there are 10 forested plots per land ownership type, such as on NFS land with over 24 thousand forested hectares (Westfall et al., 2011). At the Unit scale, plot numbers are usually sufficient (Units with 100 thousand forested hectares should have about 40 plots) for small errors and confident estimates, particularly for uncomplicated queries (i.e., total forest land area, forest land area by major forest type), but errors increase for more complicated queries. If users can interpret and judge levels of uncertainty acceptable around estimates, FIA data are appropriate for a variety of mid- to broad-scale needs for Regional and Unit monitoring, Forest Plan revision, and assessments. Core FIA data using standard estimation procedures are sufficient for many information needs, though data users may require increased precision (more plots) for certain estimates and scales, where SAE could assist.
Forest Inventory and Analysis SAE techniques are under development and not used programmatically by NFS. However, opportunities exist to enhance NFS’ ability to monitor ecosystems with SAE, particularly by integrating remote sensing data (Lister et al., 2020). SAE techniques would expand the utility of FIA information for NFS, and could in certain circumstances replace the need for adding FIA plots within a geographic area (known as intensification), by providing better estimates at smaller scales. Having reliable estimates with precision information, that are spatially and temporally appropriate for management questions, would help land managers understand current condition and monitor trends. SAE techniques would expand the ability of NFS to make informed decisions on where, for example, specific wildlife habitat is located, the condition of the habitat, and habitat changes through time. SAE could provide estimates based on NFS classifications or algorithms about specific small areas with smaller error than currently possible using FIA’s plot data, which would support Regional and Unit-based monitoring and allow FIA data application with enhanced confidence to inform management.
Because NFS SAE techniques are under development, we provide three Regional case studies of FIA uses without SAE, which demonstrate varied data applications and analysis techniques. Case studies include descriptions of how SAE could improve these applications and how specific enhancements to FIA data could better support SAE from the perspective of NFS FIA users.
Case Studies
Northern Region (R1): Using Forest Inventory and Analysis Data for Land Management Assessments and Biennial Monitoring
Forest Inventory and Analysis data are used for assessments, planning and implementation of management, and monitoring extensively in R1. To evaluate current vegetation condition, R1 developed a hierarchical existing vegetation classification system (R1 ExVeg Classification; Barber et al., 2011) to attribute lifeform, alliance, cover type, and dominance types groups (DTG) from FIA data. This system aligns with USFS technical guidance through the Existing Vegetation Classification, Mapping, and Inventory Technical Guide (Nelson et al., 2015). Applying the R1 ExVeg Classification algorithms to FIA data allows Units to derive estimates, with confidence intervals, of DTG distribution to understand vegetation composition across a Unit. Current condition can then be compared to natural ranges of variability to develop desired conditions for ecological integrity and guide vegetation management. Figure 1 displays estimates of Dominance Types for the 970-thousand-hectare Flathead National Forest from the Unit’s most recent Land Management Plan, compared to desired conditions. The Flathead National Forest seeks to increase ponderosa pine (PP) and western larch (WL) DTGs while decreasing spruce-subalpine fir. Since FIA plots are remeasured every 10-years in R1, Dominance Type algorithms will be applied longitudinally to monitor progress toward desired conditions.
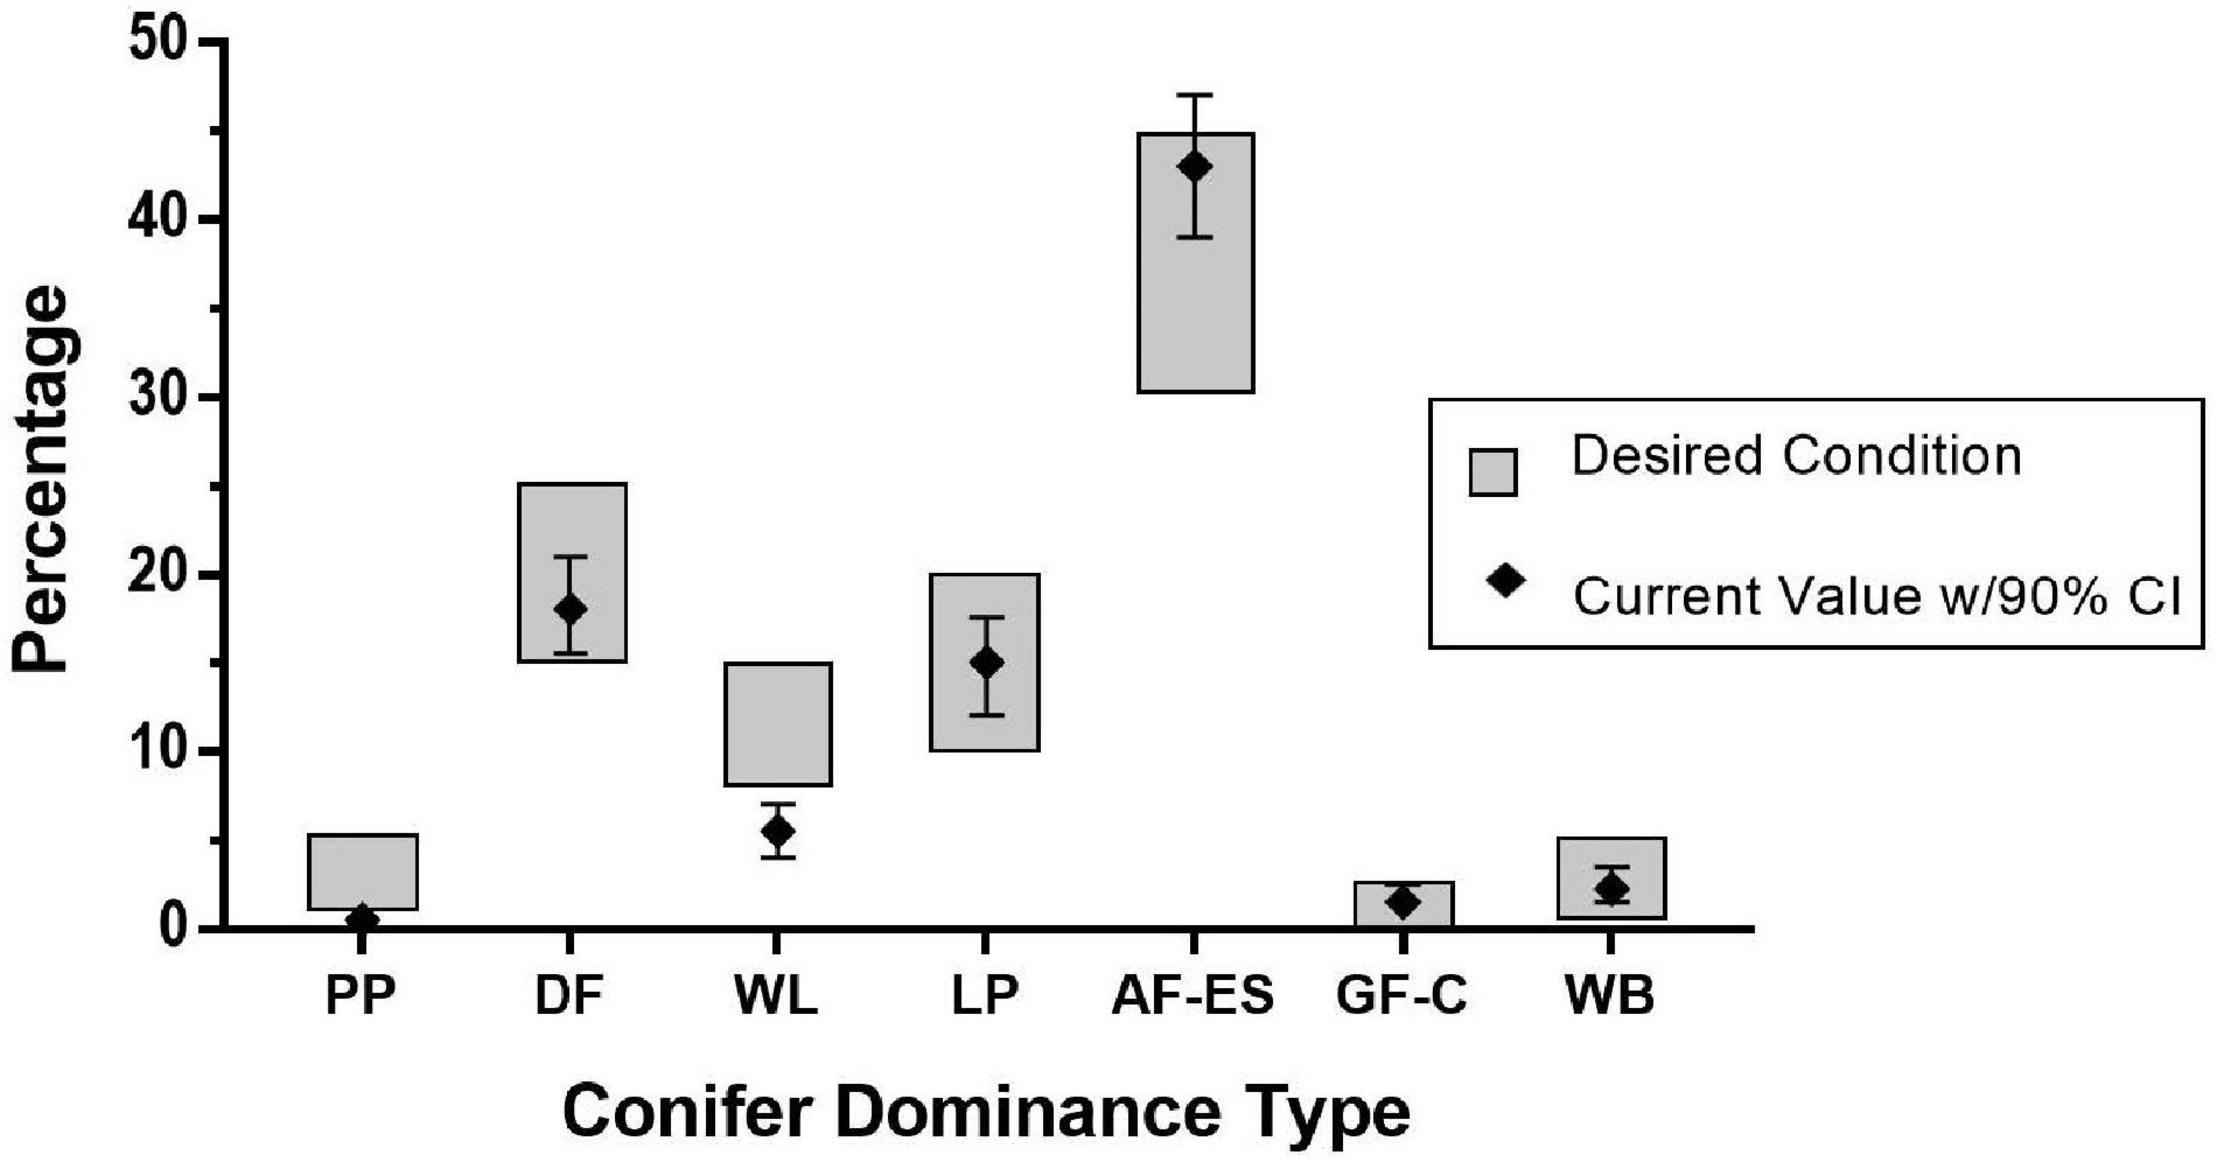
Figure 1. Comparison of existing condition to desired conditions (rectangles) for ponderosa pine (PP), western larch (WL), and spruce-subalpine fir (AF-ES) Dominance Type Groups for the Flathead National Forest. Existing condition (diamond) and the 90% confidence interval (whiskers) of estimates of Dominance Types using Forest Inventory and Analysis (FIA) inventory data.
R1 partnered with FIA to collect information across the entire FIA plot footprint, not just the “forested condition” portion to enable expanding Dominance Type classifications and algorithms for non-tree dominated systems. Having consistent sampling protocols across the entire plot allows estimates and confidence intervals to be derived regardless of the presence of trees. This allows R1 to use FIA data to inform assessments, analysis, and monitoring across all NFS land types managed by the Region.
Small area estimation techniques could enhance use of FIA data in R1 for assessments and planning activities by deriving more precise estimates of DTGs within the biophysical setting and geographic areas used for goals and objectives in Forest Plans. Estimates of DTGs could also be monitored at a finer geographic scale, allowing the Unit to better understand current condition, prioritize vegetation management, and monitor trends. Using SAE, these goals could be accomplished by relying more on remote sensing and other auxiliary data and less on costly field data collection. For SAE to be meaningful to NFS, Existing Vegetation Classification algorithms should be used in SAE techniques, and all data collected nationally by FIA (i.e., including non-forested condition and non-tree data) should be utilized in the estimates. This would allow more accurate estimates and monitoring of attributes derived from FIA data such as distribution of old growth, large-tree and snag densities, and wildlife species habitat models. Precise estimates for smaller geographic areas could alleviate the need for plot intensification but cannot entirely replace field data collection within project areas.
To enable monitoring trends within non-forested areas, all data that is consistently collected by FIA across the Unit should be available within FIA products and tools and utilized for SAE techniques, including non-tree centric protocols that support algorithms for non-tree dominated systems. This would allow Units to understand vegetation composition as it changes over time, and monitor the extent of sagebrush cover, fuel loadings, potential fire behavior, and tree encroachment onto non-forested areas.
Finally, for SAE to be useful to R1, we also desire information on when the reliability of the estimates deteriorates. NFS should work with FIA to explore which attributes can be estimated at which resolution.
Southwestern Region (R3): Using Forest Inventory and Analysis Data to Estimate State and Transition Model Parameters and Inform Vegetation Mapping
R3 has used FIA data for nearly two decades to inform forest planning decisions. Around 2005 R3 began to revise the Region’s eleven Forest Plans due to concerns about Mexican Spotted Owl and Northern Goshawk habitat sustainability. To ease the analytical burden on national forest staff, be regionally consistent, and utilize the best available scientific information, R3 uses state and transition simulation models (STSM; Daniel et al., 2016) to assess future vegetation conditions under a range of management actions. STSM’s classify a landscape into a set of distinct states. Probabilistic transitions describe the change from one state to another due to succession and disturbance, both human and natural. FIA data was a primary source to parameterize the STSMs. Parameters consist of a set of probabilities that describe the transition from one state to another for natural successional processes and a suite of disturbance regimes such as wildfire, insect and disease, silvicultural prescriptions, and prescribed burning.
Regionally consistent vegetation modeling processes require all models to start with the same initial vegetation conditions. In cooperation with the Oregon State Institute of Natural Resources, R3 completed a mid-scale vegetation database covering Arizona and New Mexico. Gradient nearest neighbor (GNN) techniques (Ohmann and Gregory, 2002) and random forest classification were used for attribute imputation. Forest attributes came from FIA plots. Additional processing of FIA plot data using the Forest Vegetation Simulator (FVS, a forest growth simulation model) (USFS, 2021d) to produce the stand-level outputs provided additional information for forested polygons. GNN techniques used several auxiliary geospatial datasets to assign FIA plots to landscape location, including National Elevation Data, soils data, and texture metrics derived from National Agriculture Imagery Program data.
Forest Inventory and Analysis plots were stratified into states by potential vegetation type, size class, canopy cover percentage, and number of stories. After stratification FIA plots were used as the tree list inputs into FVS. FVS outputs were classified into states using the stratification criteria. The number of FIA plots that changed from one state to a different state in each time step divided by the number of plots in the initial state determined the transition probabilities, which help determine which management activities will steer the forest toward desired conditions. For a complete description of the analytical techniques consult Weisz et al. (2010) or Weisz and Vandendriesche (2012).
With the imminent completion of all eleven Forest Plans, the analytical framework developed using FIA data with FVS processing is being adapted to run landscape level vegetation management projects at the 40 thousand-hectare scale. Preliminary work is favorable for the continued use of FIA data at this project size.
Small area estimation could enhance these techniques with more precise estimates of delineations for identifying short-term treatable areas, particularly Northern Goshawk and Mexican Spotted Owl habitat. SAE shows promise in modeling wildlife habitat more precisely than regional models (Wilson et al., 2009), but more research is needed to support these applications. SAE could also support identifying locations and quantities for old growth forest and large trees, which are preferred by these two species. Finally, STSM validation could utilize SAE by examining effects of small treatment areas and small disturbances to determine if treatment effectiveness and direction of disturbance levels align with model output.
Providing data that is more readily accessible for automated analyses would facilitate SAE applications. About seventy distinct ecosystem types occur in R3 (USFS, 2014) ranging from semi-desert grasslands to alpine tundra. Having FIA data on these ecosystem types, and integrating these data with similar data collected by the Natural Resources Conservation Service and Bureau of Land Management, would support more comprehensive analyses. Providing those data in a format compatible with the Range Vegetation Simulator [RVS; Reeves (2016)], similar to the FVS ready data currently provided with FIA databases, would simplify processes.
Southern Region (R8): Evaluating Existing Longleaf Pine Ecosystem Condition With Forest Inventory and Analysis
Longleaf pine ecosystems in the Southern Region have declined to 3% of their original distribution (America’s Longleaf Regional Working Group, 2009). There is high interest from the USFS and partners in maintaining and restoring these forest types due to their high biological diversity and importance as wildlife habitat. Understanding location and current condition of these ecosystems is vital to restoration efforts. Estimates of existing area of longleaf pine ecosystems derived from FIA frequently rely on composition criteria (forest type) that do not capture key characteristics of these ecosystems, particularly forest structure.
The Range-Wide Conservation Plan for Longleaf Pine (America’s Longleaf Regional Working Group, 2009) established condition-based restoration goals for 2025. When the Plan was published, analysis techniques for estimating condition classes were not available. The 2009 estimate of 1.4 million existing hectares came from a combination of FIA data for non-NFS lands and local inventory data for NFS lands. The latter primarily came from the FSVeg (USFS, 2021a) database, which contains the agency’s Common Stand Exam data. The split between “good condition/maintain” and “poor condition/restore” was based on professional judgment, informed by understanding local fire regimes with limited field sampling. Recently, NatureServe (a non-profit organization that assembles data on species and ecosystems) led an interagency effort to develop improved definitions of condition classes for longleaf pine ecosystems (NatureServe, 2016; Nordman et al., 2016). There are 13 Open Pine Metrics: 5 canopy, 4 midstory/shrub, and 4 ground layer. Each Metric has designated thresholds for each condition class (excellent, good, fair, or poor), which are combined to produce an overall condition score. A simplified version of the Open Pine Metrics was adopted in R8’s strategic direction regarding longleaf restoration.
To advance our understanding of existing longleaf pine ecosystem conditions across R8, we applied the Open Pine Metrics to FIA data. We selected all FIA plots that contained at least one longleaf pine, and used the relevant FIA plot measurements (height, species, basal area, etc.) to assign a score. Note that the FIA protocols (USFS, 2021b) for R8 only collect sufficient data to score 7 of the 13 metrics. We also scored factors such as fire tolerance, that are not included in the FIA protocols.
Figure 2 shows preliminary results. This approach allowed us to assess longleaf extent and condition regardless of assigned forest type, and we estimated considerably more area occupied by longleaf pine ecosystems than previous estimates derived from FIA based on forest-type alone. Note that the current method is likely overestimating area in each condition class by including plots where moving toward longleaf pine-dominated systems is not desired. Also, because this analysis was conducted by a contractor outside of standard FIA analysis tools that provide statistical error information, and it was not part of the contract request, statistical confidence intervals were not part of this analysis.
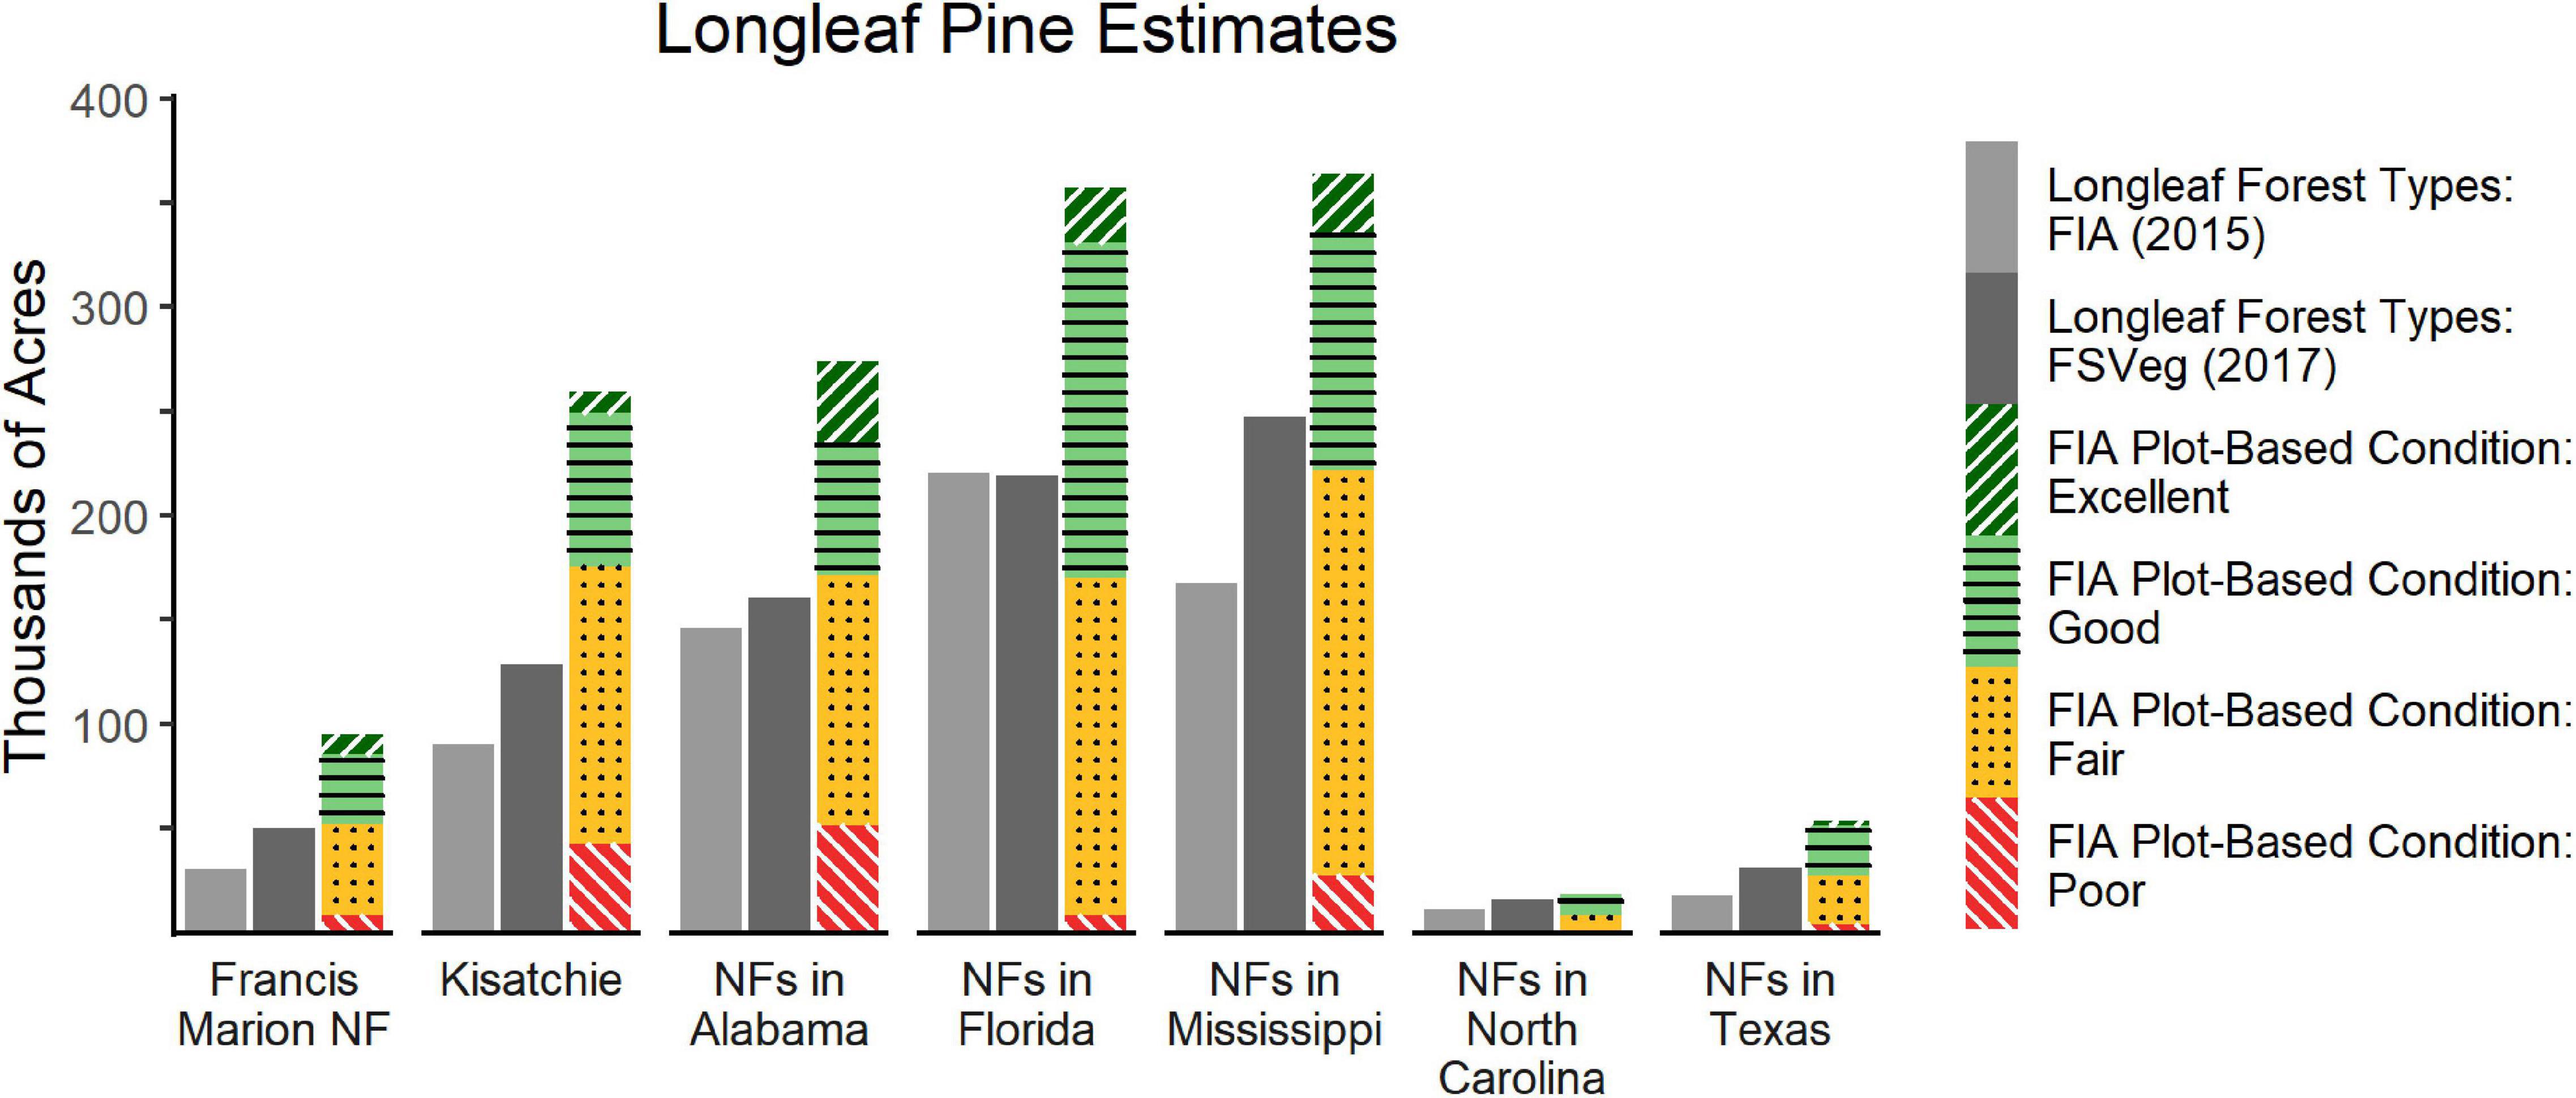
Figure 2. Longleaf pine estimates for Southern Region (R8) National Forests. Longleaf extent based on forest type [FIA/field sampled vegetation (FSVeg)] does not include any measure for condition and may miss areas that have a longleaf component but were not classified as a longleaf forest type. FIA plot-based condition estimates include any FIA plot that contained at least a single longleaf pine, and therefore may overestimate the extent of longleaf ecosystems in places where longleaf is a minor ecosystem component.
Still, this preliminary analysis shows promising results in characterizing existing condition. Results have strategic value, are firmly rooted in current best available science, and use the most robust inventory data available (FIA). However, the challenges with calculating measures of statistical confidence using this methodology are a hindrance, especially when the estimates are calculated for smaller scales. If SAE techniques were integrated within existing FIA tools that include integrated calculations of statistical confidence, these types of analyses could be simplified, streamlined, and performed consistently across R8 and the agency.
The addition of non-tree variables such as shrub, grass, forb, and invasive plant cover would enable a more accurate analysis with all 13 Open Pine Metrics. The ability to easily combine FIA data with local inventory data, including using metrics that span scales and inventory systems, could further enhance these analyses. Finally, enhanced functionality of FIA tools would simplify similar analyses – R8 had to hire a contractor with specialized skills to implement the longleaf condition assessment outside of standard FIA analysis tools.
Recommendations and Conclusion
These three case studies demonstrate how SAE techniques could enhance and expand existing applications of FIA data for NFS users to meet planning and management information needs. SAE using FIA data, coupled with auxiliary data such as remote sensing, would improve the ability to monitor key ecosystem components spatially while providing consistent confidence intervals to accompany estimates. More precise, comprehensive, and consistent vegetation information will support more strategic decision making by providing land managers information on current condition and trends over time. This enables tactically targeting areas for management actions, restoration strategies, and more intensive monitoring. In the face of climate change, understanding the impact of management activities is imperative to practicing adaptive management, and SAE with FIA data can improve our understanding without greatly increasing costly field data collection.
For FIA to most effectively support SAE techniques for NFS needs, baseline FIA data should comprehensively and consistently support the assessment of diverse forest and non-forest ecosystems managed by the agency and its multiple-use mandate. SAE techniques could ultimately reduce some of the need for field-sampled vegetation to meet information needs of NFS, but some initial expansions in the variables and locations of FIA data collected would best support widespread use of SAE. The data expansions proposed below would enable SAE across all NFS lands, supporting a multitude of information needs with improved consistency and scientific integrity.
Specifically, NFS desires information collected across the entire FIA plot, and not only on those portions that meet FIA’s definition of forested. This would allow monitoring of vegetation conditions across their entire land base. Without data from non-forest areas, it is difficult to disentangle FIA “forested” land definition changes from actual changes in tree densities and ecosystem shifts, such as those that may be occurring due to climate change. This is particularly important in the Western United States where non-forest land cover is common inside NFS boundaries. Standard FIA protocols for the “All Condition Inventory” (ACI) are available, and are collected on all plots with “non-forest” condition on certain NFS lands, including in Regions 1, 4, 6, and 10 (i.e., USFS, 2011). The ability to use “ACI” data should be available to all NFS Regions and available for analysis in the NFS analysis tools, allowing NFS classifications (i.e., wildlife habitat models and existing vegetation classifications) to be applied, stored, and used in estimations for all NFS land. This functionality would enable SAE applications within existing workflows and reduce training and workload required for NFS staff to apply SAE techniques.
Finally, NFS will desire information on the scale at which FIA-derived estimates become unreliable (and some estimates will be more robust than others given inherent variability in the attribute and modeling techniques). Reliability of SAE will vary depending upon how common or rare the attribute of interest is, and this potential limitation should be considered prior to reporting these estimates (Moisen et al., 2004). Guidance and assistance are also needed to integrate finer-scale spatial datasets in SAE products. Ultimately, FIA’s SAE techniques will not replace site-specific stand exam data, but will help NFS be more targeted in selecting sites for field reconnaissance and collection of site-specific information, further expanding the uses of FIA data.
Small area estimation techniques could broaden the applicability of a data set that is widely used by the NFS, and with certain additions and enhancements to FIA data and tools, NFS users can be more precise, accurate, consistent, and comprehensive in their analytical capabilities to inform good forest management across a complex 78-million-hectare land base.
Data Availability Statement
Publicly available datasets were analyzed in this study. This data can be found here: https://www.fia.fs.fed.us/tools-data/.
Author Contributions
SW coordinated the manuscript and was in charge of overall edits and writing of abstract and conclusion. RB wrote the R1 case study, contributed to the framing and introduction of the manuscript, and overall edits. AN was the lead on the R8 case study, developed Figure 2, and contributed to overall framing and edits. KP contributed to manuscript framing, introduction, and overall edits, and wrote the background information on FIA. MP contributed to framing of the manuscript and provided written contributions to introduction and background. MA contributed to framing of the manuscript and overall edits. ET contributed to overall framing and the R8 case study. JB and RS contributed to the R8 case study. All authors contributed to the article and approved the submitted version.
Conflict of Interest
The authors declare that the research was conducted in the absence of any commercial or financial relationships that could be construed as a potential conflict of interest.
Publisher’s Note
All claims expressed in this article are solely those of the authors and do not necessarily represent those of their affiliated organizations, or those of the publisher, the editors and the reviewers. Any product that may be evaluated in this article, or claim that may be made by its manufacturer, is not guaranteed or endorsed by the publisher.
Acknowledgments
The authors would like to thank Carl Nordman of NatureServe and Rickie White, formerly of NatureServe but currently at Ellerbe Creek Watershed Association, for contributions to the R8 case study.
References
America’s Longleaf Regional Working Group (2009). Range-Wide Conservation Plan for Longleaf Pine. Available online at: https://americaslongleaf.org/resources/conservation-plan/ (accessed January 15, 2021).
Barber, J., Berglund, D., and Bush, R. (2011). The Region 1 Existing Vegetation Classification System and its Relationship to Inventory Data and the Region 1 Existing Vegetation Map Products. Region 1 Vegetation Classification, Mapping, Inventory, and Analysis Report # 11-10. Missoula, MT: USDA Forest Service.
Bechtold, W. A., and Patterson, P. L. (2005). The Enhanced Forest Inventory and Analysis Program—National Sampling Design and Estimation Procedures. General Technical Report (GTR). SRS-80. Ashville, NC: U.S. Department of Agriculture.
Daniel, C. J., Frid, L., Sleeter, B., and Fortin, M. J. (2016). State-and-transition simulation models: a framework for forecasting landscape change. Methods Ecol. Evol. 7, 1413–1413. doi: 10.1111/2041-210X.12597
Ghosh, M., and Rao, J. (1994). Small area estimation: an appraisal. Stat. Sci. 9, 55–76. doi: 10.1214/ss/1177010647
Jiang, J., and Rao, J. (2020). Robust small area estimation: an overview. Annu. Rev. Stat. Appl. 7, 337–360. doi: 10.1146/annurev-statistics-031219-041212
Lister, A., Andersen, H., Frescino, T., Gatziolis, D., Healey, S., Heath, L., et al. (2020). Use of remote sensing data to improve the efficiency of national forest inventories: a case study from the united states national forest inventory. Forests 11:12. doi: 10.3390/f11121364
McRoberts, R., Bechtold, W., Patterson, P., Scott, C., and Reams, G. (2005). The enhanced forest inventory and analysis program of the USDA forest service: historical perspective and announcement of statistical documentation. J. For. 103, 304–308.
Moisen, G. G., Blackard, J. A., and Finco, M. (2004). “Small area estimation in forests affected by wildfire in the interior West,” in Proceedings of the 10th Forest Service Remote Sensing Applications; Remote Sensing for Field Users, ed. J. D. Greer (Salt Lake City, UT: American Society of Photogrammetry and Remote Sensing).
Nelson, M. L., Brewer, C. K., and Solem, S. J. (eds) (2015). Existing Vegetation Classification, Mapping, and Inventory Technical Guide, Version 2.0. Gen. Tech. Rep. WO–90. Washington, DC: U.S. Department of Agriculture.
Nordman, C., White, R., Wilson, R., Ware, C., Rideout, C., Pyne, M., et al. (2016). Rapid Assessment Metrics to Enhance Wildlife Habitat and Biodiversity within Southern Open Pine Ecosystems, Version 1.0. Washington, DC: U.S. Fish and Wildlife Service and NatureServe.
Ohmann, J. L., and Gregory, M. J. (2002). Predictive mapping of forest composition and structure with direct gradient analysis and nearest-neighbor imputation in coastal Oregon, U.S.A. Can. J. For. 32, 725–741. doi: 10.1139/x02-011
Pfeffermann, D. (2013). New important developments in small area estimation. Stat. Sci. 28, 40–68. doi: 10.1214/12-STS395
Rao, J. (2003). Some new developments in small area estimation. J. Iran. Stat. Soc. 2, 145–169. doi: 10.1002/0471722189
Reeves, M. C. (2016). Development of the Rangeland Vegetation Simulator: A Module of the Forest Vegetation Simulator. A Report to the Joint Fire Sciences Program. JFSP 14-S-01-01, 12-1-02-15, 12-1-02-15. Missoula, MT: Forestry Sciences Lab, 129.
Tomppo, E., Olsson, H., Ståhl, G., Nilsson, M., Hagner, O., and Katila, M. (2008). Combining national forest inventory field plots and remote sensing data for forest databases. Remote Sens. Environ. 112, 1982–1999. doi: 10.1016/j.rse.2007.03.032
USFS (2011). Interior West Forest Inventory and Analysis Region 4 All Condition Inventory Supplemental Field Guide. Available online at: https://www.fs.fed.us/rm/ogden/data-collection/pdf/r4_acp_manual_5162011_wo_markup.pdf (accessed January 15, 2021).
USFS (2020). Land Area Report. Available online at: https://www.fs.fed.us/land/staff/lar/LAR2020/FY2020_LAR_Book.pdf (accessed October 4, 2021).
USFS (2021b). Forest Inventory and Analysis National Core Field Guide, Version 9.1. Available online at: https://www.fia.fs.fed.us/library/field-guides-methods-proc/docs/2021/core_ver9-1_9_2021_final.pdf (accessed October 5, 2021).
USFS (2021c). Forest Inventory and Analysis National Program. Available online at: https://www.fia.fs.fed.us/about/about_us/index.php (accessed October 5, 2021).
USFS (2021d). Forest Vegetation Simulator. Available online at: https://www.fs.fed.us/fvs/ (accessed July 1, 2021).
USFS (2021a). Field Sampled Vegetation. Available online at: https://www.fs.fed.us/nrm/fsveg/ (accessed August 1, 2021).
USFS (2014). Ecological Response Units of the Southwestern United States. USDA Forest Service Technical Report. Available online at: https://www.fs.usda.gov/Internet/FSE_DOCUMENTS/fseprd609789.pdf (accessed November 15, 2018).
Weisz, R., Triepke, J., Vandendriesche, D., Manthei, M., Youtz, J., Simon, J., et al. (2010). “Evaluating the ecological sustainability of a pinyon-juniper grassland ecosystem in northern Arizona,” in Proceedings of the 2009 National Silviculture Workshop Integrated Management of Carbon Sequestration and Biomass Utilization Opportunities in a Changing Climate, eds T. B. Jain, R. T. Graham, and J. Sandquist (Boise, ID: U.S. Department of Agriculture), 321–336.
Weisz, R., and Vandendriesche, D. (2012). “Use of the forest vegetation simulator to quantify disturbance activities in state and transition models,” in Proceedings of the First Landscape State-and-Transition Simulation Modeling Conference, eds B. K. Kerns, A. J. Shlisky, and C. J. Daniel (Portland, OR: U.S. Department of Agriculture), 143–160.
Westfall, J. A., Patterson, P. L., and Coulston, J. W. (2011). Post-stratifed estimation: within-strata and total sample size recommendations. Can. J. For. Res. 41, 1130–1139. doi: 10.1139/x11-031
Keywords: small area estimation (SAE), Forest Inventory and Analysis (FIA), United States Forest Service, forest planning, forest assessment, National Forest System, forest management
Citation: Wiener SS, Bush R, Nathanson A, Pelz K, Palmer M, Alexander ML, Anderson D, Treasure E, Baggs J and Sheffield R (2021) United States Forest Service Use of Forest Inventory Data: Examples and Needs for Small Area Estimation. Front. For. Glob. Change 4:763487. doi: 10.3389/ffgc.2021.763487
Received: 24 August 2021; Accepted: 09 November 2021;
Published: 06 December 2021.
Edited by:
Philip Radtke, Virginia Tech, United StatesReviewed by:
Roque Rodríguez-Soalleiro, University of Santiago de Compostela, SpainMatija Klopčič, University of Ljubljana, Slovenia
Copyright © 2021 Wiener, Bush, Nathanson, Pelz, Palmer, Alexander, Anderson, Treasure, Baggs and Sheffield. This is an open-access article distributed under the terms of the Creative Commons Attribution License (CC BY). The use, distribution or reproduction in other forums is permitted, provided the original author(s) and the copyright owner(s) are credited and that the original publication in this journal is cited, in accordance with accepted academic practice. No use, distribution or reproduction is permitted which does not comply with these terms.
*Correspondence: Sarah S. Wiener, c2FyYWgucy53aWVuZXJAdXNkYS5nb3Y=