 Elix Hernández
 Elvira Cuevas
 Solimar Pinto-Pacheco
 Gloria Ortíz-Ramírez
- 1Department of Environmental Sciences, College of Natural Sciences, University of Puerto Rico - Río Piedras Campus, San Juan, PR, United States
- 2Department of Biology, College of Natural Sciences, University of Puerto Rico - Río Piedras Campus, San Juan, PR, United States
Tropical urban coastal wetland regeneration is complex. Wetland plant biodiversity varies due to past and present land use, nutrient inputs, hydrological conditions, and terrestrial/marine connectivity. The intensity of atmospheric disturbances, such as hurricanes, will determine these systems’ level of disturbance and regeneration capacity. On September 20, 2017, category 4 hurricane María passed over Puerto Rico, leaving behind a path of destruction across the entire island, especially in coastal ecosystems, from the combined effects of winds, severe storm surges, and urban runoff. Our question was: to what extent do human-influenced coastal urban wetlands regenerate after such a massive event. This study determines the spatio-temporal regeneration dynamics of plant cover and composition during the first 2 years after hurricane María in a coastal urban wetland, ciénaga Las Cucharillas, located in San Juan Bay. We assessed the distribution of plant functional types using small unmanned aerial vehicles (s-UAV) and monitored climate and environmental data (salinity, phreatic water levels, and precipitation). Wetland vegetation cover had a high recovery rate – 16 months after the hurricane, vegetation cover occupied 87% of the study area. We found a successional pattern of plant regeneration that seemed to be partly explained by the fast-slow continuum. Plants with high specific leaf area (SLA) colonized bare soil spaces first. Plant regeneration also varied according to changes in phreatic water conductivity and waterlogging. Isotopic analyses of plant species signaled high nutrient availability, increasing the system’s regeneration speed. After 2 years, the wetland’s plant cover and composition of functional plant types proved resilient to the initial hurricane effect and subsequent changes in conductivity and freshwater conditions. Further studies will expand how spatio-temporal conditions will affect long-term plant community dynamics.
Introduction
Coastal wetlands are transitional areas between terrestrial and marine ecosystems, with variable periods of water saturation (Cowardin et al., 1979). The presence and distribution of coastal wetlands result from eustatic sea-level rise and terrigenous sediment deposition and substrate development (Cohen et al., 2016). Plant species coexist in a dynamic state of change where ecophysiological adaptations to waterlogging and saline conditions predict wetland structure and function (Medina and Francisco, 1997). It is possible to predict regeneration processes by considering these adaptations (Buma, 2015). Determining post-disturbance regeneration in vegetation cover is necessary for coastal urban wetlands which undergo constant stresses yet can establish floral and faunal communities (Perillo et al., 2019). Long-term studies suggest different pathways of succession, where ecosystem recovery can take from a couple years by plant resprouting or decades with shifts in vegetation (Fickert, 2018). Little is known about the factors involved in regeneration in these ecosystems where disturbance effects can be seen even after 30 years (Ferwerda et al., 2007).
The level of vegetation cover loss in wetlands caused by hurricane impacts depends directly on hurricane intensity, duration, forward speed of the storm, and wetland distance over which the storm passes (Morton and Barras, 2011). Indirect effects from hurricanes are prolonged retention of storm-surge seawater, flooding, and adverse physiochemical plant reactions to waterlogging and salinization (Morton and Barras, 2011). On September 20, 2017, at 10:00 am, category 4 hurricane María, with sustained winds of 69 m/s, crossed the island of Puerto Rico diagonally in the SE-NW direction. NOAA simulations estimate maximum flood levels up to 1 meter above mean sea level for the metropolitan area (Pasch et al., 2019). A tide gauge in San Juan reported up to 1.2 meters of swell before going out of service, and a total rainfall of 406 mm was recorded for the metropolitan area (Pasch et al., 2019). In Cucharillas, according to rapid post-hurricane assessment, freshwater flooding, seawater storm surges, and squalls from hurricane María resulted in substantial tree fall, tree decapitation, and extensive defoliation. How has the wetland regenerated after this event? In Branoff et al. (2018), we observed that previous cover and composition of functional plant groups in the wetlands were altered due to initial and subsequent changes in salinity, tidal effects, and light regime in the wetland.
This study determines the spatio-temporal regeneration dynamics of plant cover and composition during the first 2 years after hurricane María by determining current land cover and plant composition and assessing plant regeneration and succession dynamics by means of ecophysiological traits of the vegetation.
Materials and Methods
Study Area
The Ciénaga Las Cucharillas natural reserve (18° 26′25.27″ N, 66° 08′08.39″ W) is an urban coastal palustrine-estuarine wetland dominated by freshwater herbaceous vegetation transitioning to mangroves. It is located on the western side of the San Juan Bay in the northern metropolitan area of Puerto Rico (Lugo et al., 2011; Figure 1). The current extent of Cucharillas covers 500 hectares which is all that remains of the historic wetland area. Studies suggest that as much as 90% of the historic mangrove area may have been lost in the 20th century from filling activity for urban and industrial use of the land (Martinuzzi et al., 2009; Lugo et al., 2011). Our study area covers 2 hectares of the wetland, which have been part of restoration efforts for the last 20 years by the community-based organization Corredor del Yaguazo.
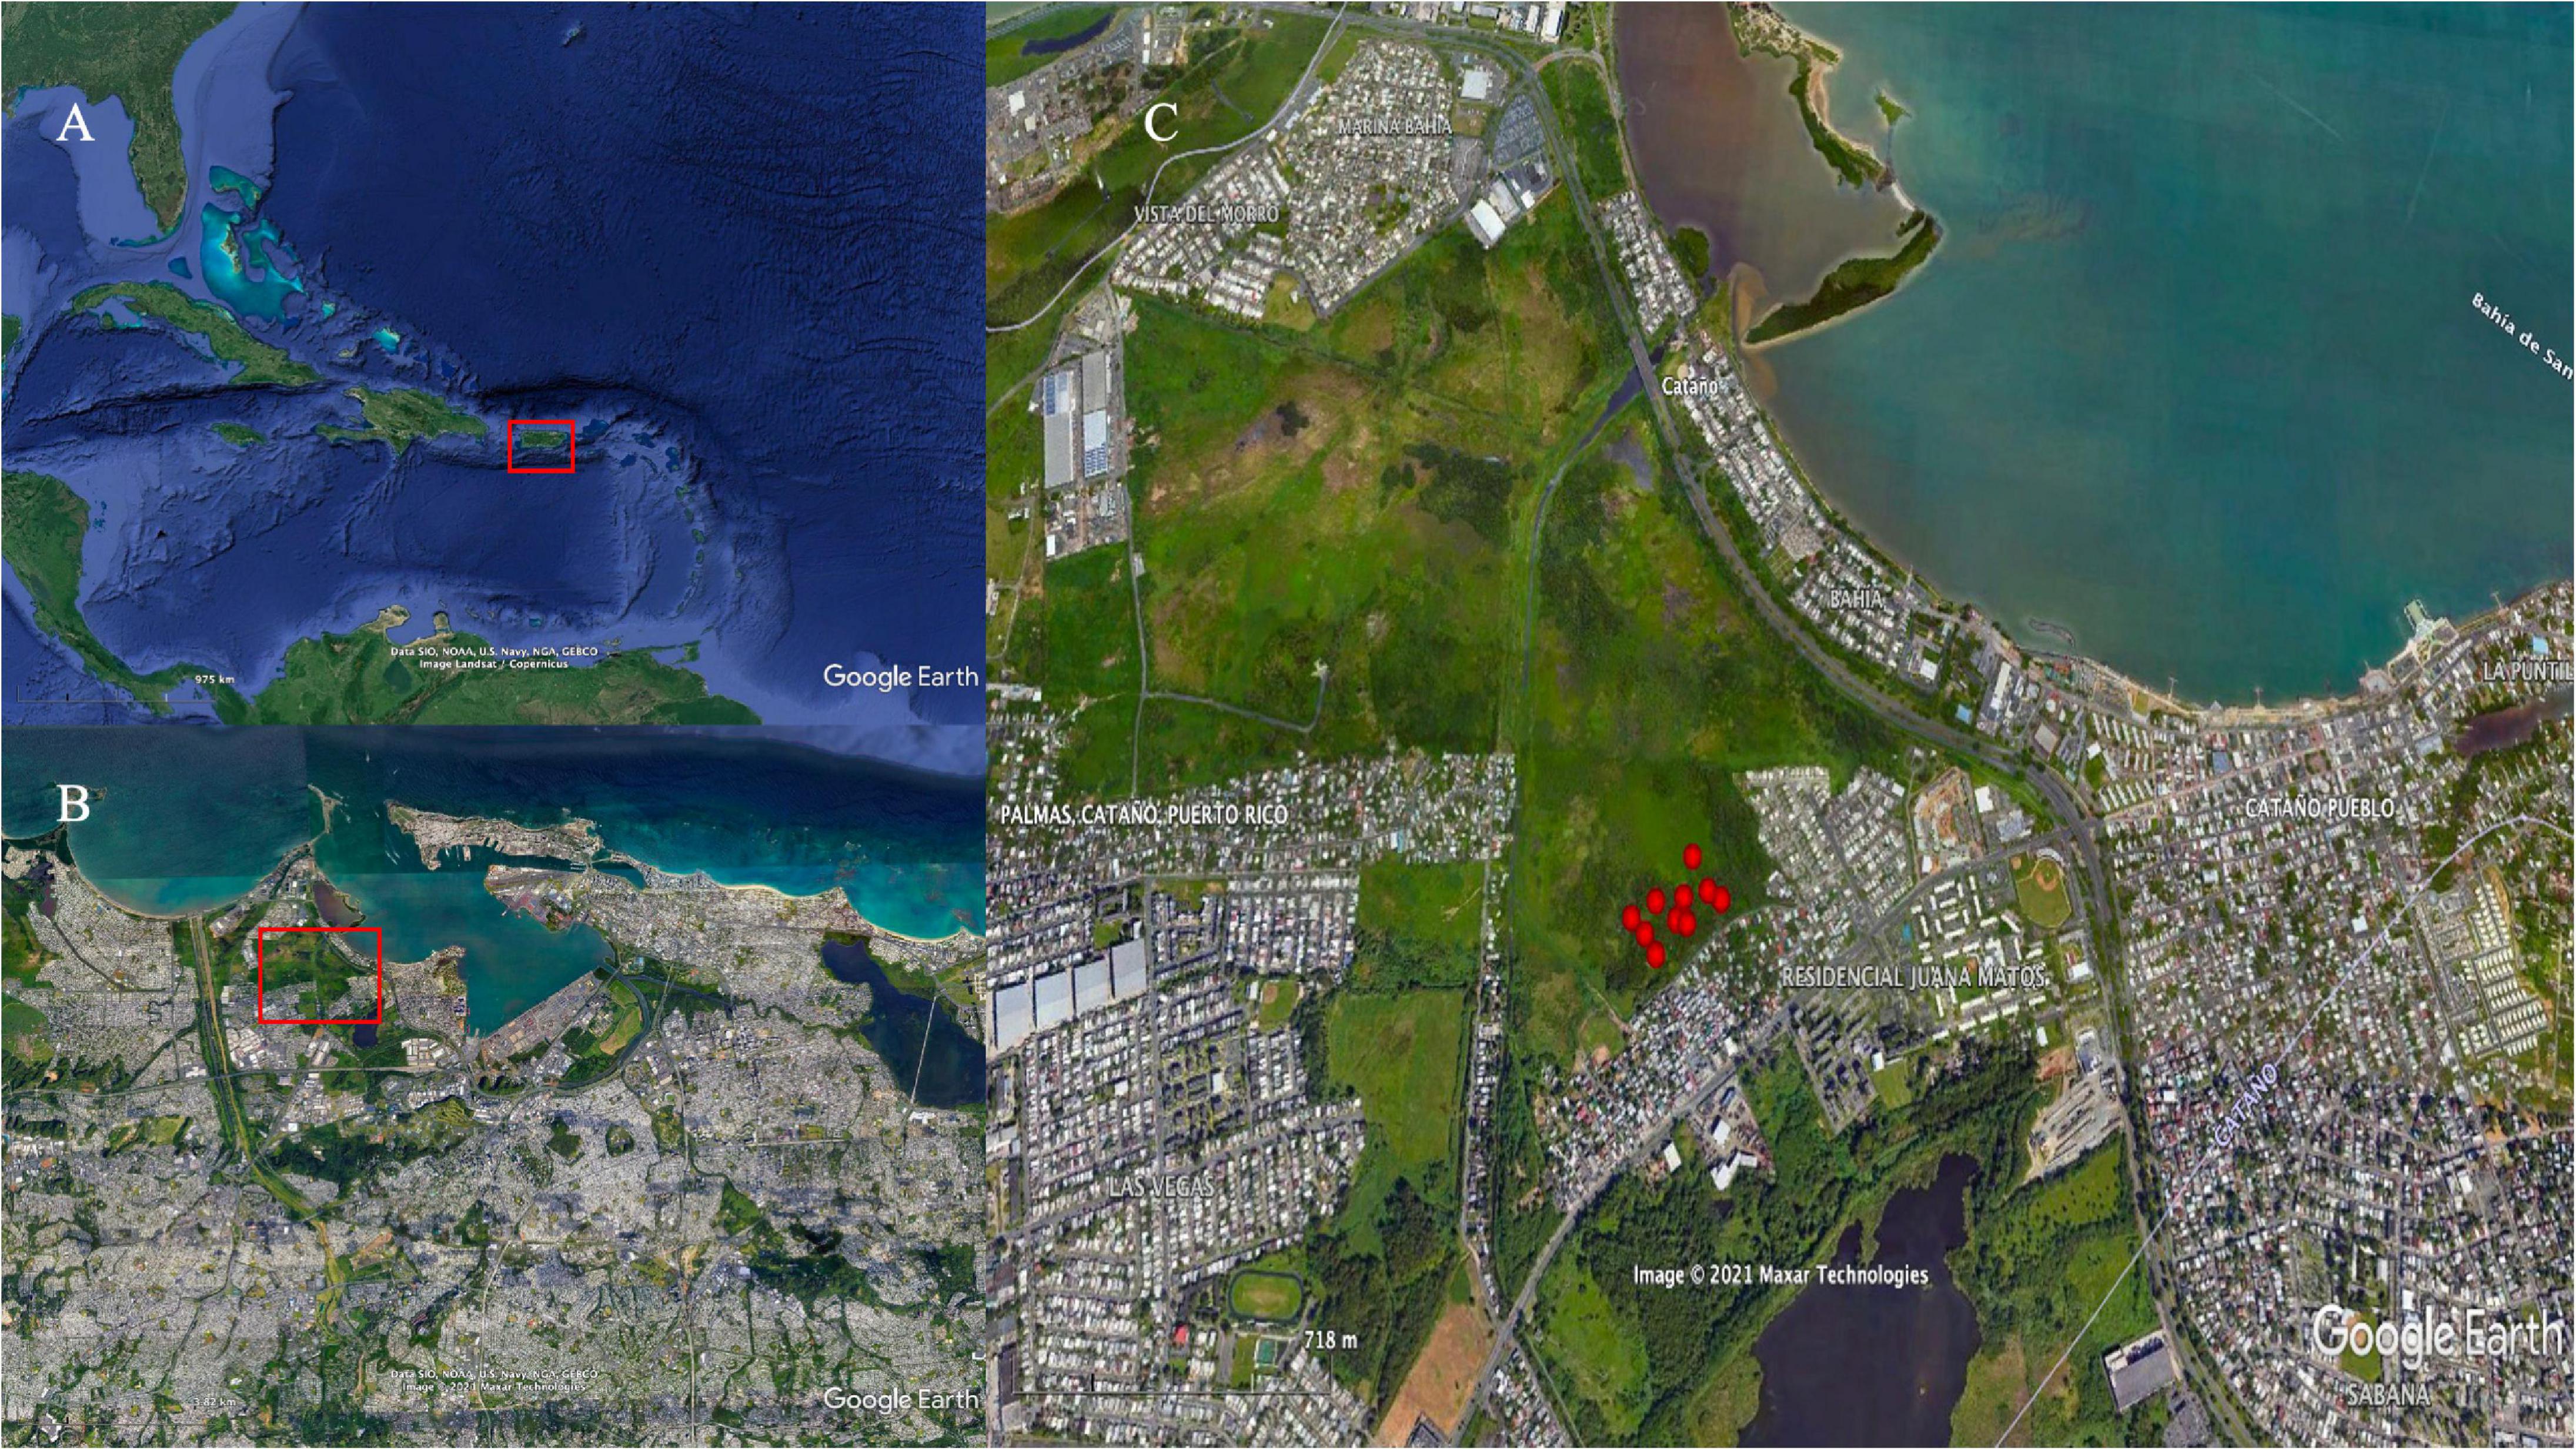
Figure 1. Maps showing the study area in panel (A) Puerto Rico (red polygon) in the Caribbean Region, within the (B) Metropolitan area of San Juan, and (C) the study site at ciénaga Las Cucharillas (sample area within red polygon) and monitoring wells (red dots). Maps Data: Google Earth, ©2021 SIO, NOAA, U.S. Navy, NGA, GEBCO Image Landsat/Copernicus, Maxar Technologies.
The wetland is part of the Cucharillas drainage basin, located between two large river basins that drain to the bay: the río Bayamón and the río Piedras basins. The present hydrological regime was modified from colonial times to the present, including (a) drainage channels for agricultural use from the 17th century until the mid-20th century (Kennaway and Helmer, 2007); (b) the construction of the Malaria channel in the 1940s, bringing a direct flow of fresh water to the wetland from the upper and middle parts of the basin (Pumarada-O’Neill et al., 1991); and (c) restricted seawater exchange due to the dike effect of an outflow water pump structure at the mouth of the channel (Webb and Gómez-Gómez, 1998). For the metropolitan area of San Juan, the mean annual temperature is 25.7°C, and the average annual precipitation is 1,755 mm (Walter, 1971). Rainfall in the northern Caribbean has a bimodal pattern (Taylor, 2002). Puerto Rico has two wet seasons: a peak in July-December, another in May-June, and a dry season from January to April (Torres-Valcárcel et al., 2014).
Hydrological Conditions
Monthly rainfall measurements were collected from daily values from the National Climate Data Center (NCDC) Toa Baja Station (RQC00669415) and a meteorological station located in the wetland. We gathered water level and conductivity measurements in ten (10) measuring wells installed in the study area in 2015, establishing a spatial gradient from the coast (800 meters from the open water coast) to inland (300 meters from the freshwater Malaria channel) (Figure 1). We recorded conductivity (mS) monthly at the water table and at 2.5 m depth with an EcoSense EC300A handheld conductivity meter. Water levels were measured monthly with a measuring tape at each well and deployed water level data loggers (Onset corp.). The results shown here are the monthly averages. We performed ANOVA and Tukey test if significant differences were found between conductivity, water levels, precipitation data, and monitoring wells. Microtopography analysis was done in ArcGIS Pro 2.8 using DEM data sources of elevation surfaces at a 10 m resolution from the USGS National Geospatial Program.
Post-hurricane Image Collection
To capture wet and dry season variability effects on the wetland changes in plant functional forms distribution throughout the 2,000 m2 study area, we used a Phantom 3 (UAV) electrically powered quadcopter (DJI Company) with a Red-Green-Blue (RGB) camera in April 2018, October 2018, and January 2019. Missions were planned around optimal weather conditions, including no rain and low wind speed (less than 5 m/s). Each mission was flown at an altitude of 50 meters (2.2 cm/pixel resolution) in compliance with FAA regulations, and each flight lasted 18–20 min.
Orthomosaic images were analyzed using the program ArcGIS Pro. The first analysis was to create a vegetation index using only the visible RGB bands. Spectral vegetation indices were used to monitor and analyze spatio-temporal variations in vegetation structure, commonly based on infrared bands. The VARI (Visible Atmospherically Resistant Index) allows the calculation of vegetation indices using the visible bands (Gitelson et al., 2002; Raoufat et al., 2020):
Vegetation cover types were identified manually, creating feature classes, rasterized (converted from vector to a raster image), and adapted to the exact spatial resolution for pixel-by-pixel comparison.
Drone flights in April 2018 produced less usable imagery than the other flight dates because low light and high wind conditions were causing blurry imagery. When these images were stitched together, the output orthomosaic image had empty pixels where the original images were too blurry to analyze. Although this resulted in a loss of 859 m2 of aerial imagery, this accounts for less than 4 % of the entire study area and results are still significant.
Land cover categories were trees, herbs, shrubs, grasses, water, managed areas, and bare soil. The four vegetation-based categories represented plant growth forms. Using these land cover categories, the description of vegetation types focuses on physiological characteristics in response to environmental factors and ecosystem processes (Chapin et al., 1996). We sampled representative species for three plant types for ecophysiological analyses: (a) trees (Laguncularia racemosa and Avicennia germinans), (b) shrubs (Dalbergia ecastaphyllum), and (c) herbs (Acrostichum danaeifolium) (Table 1).
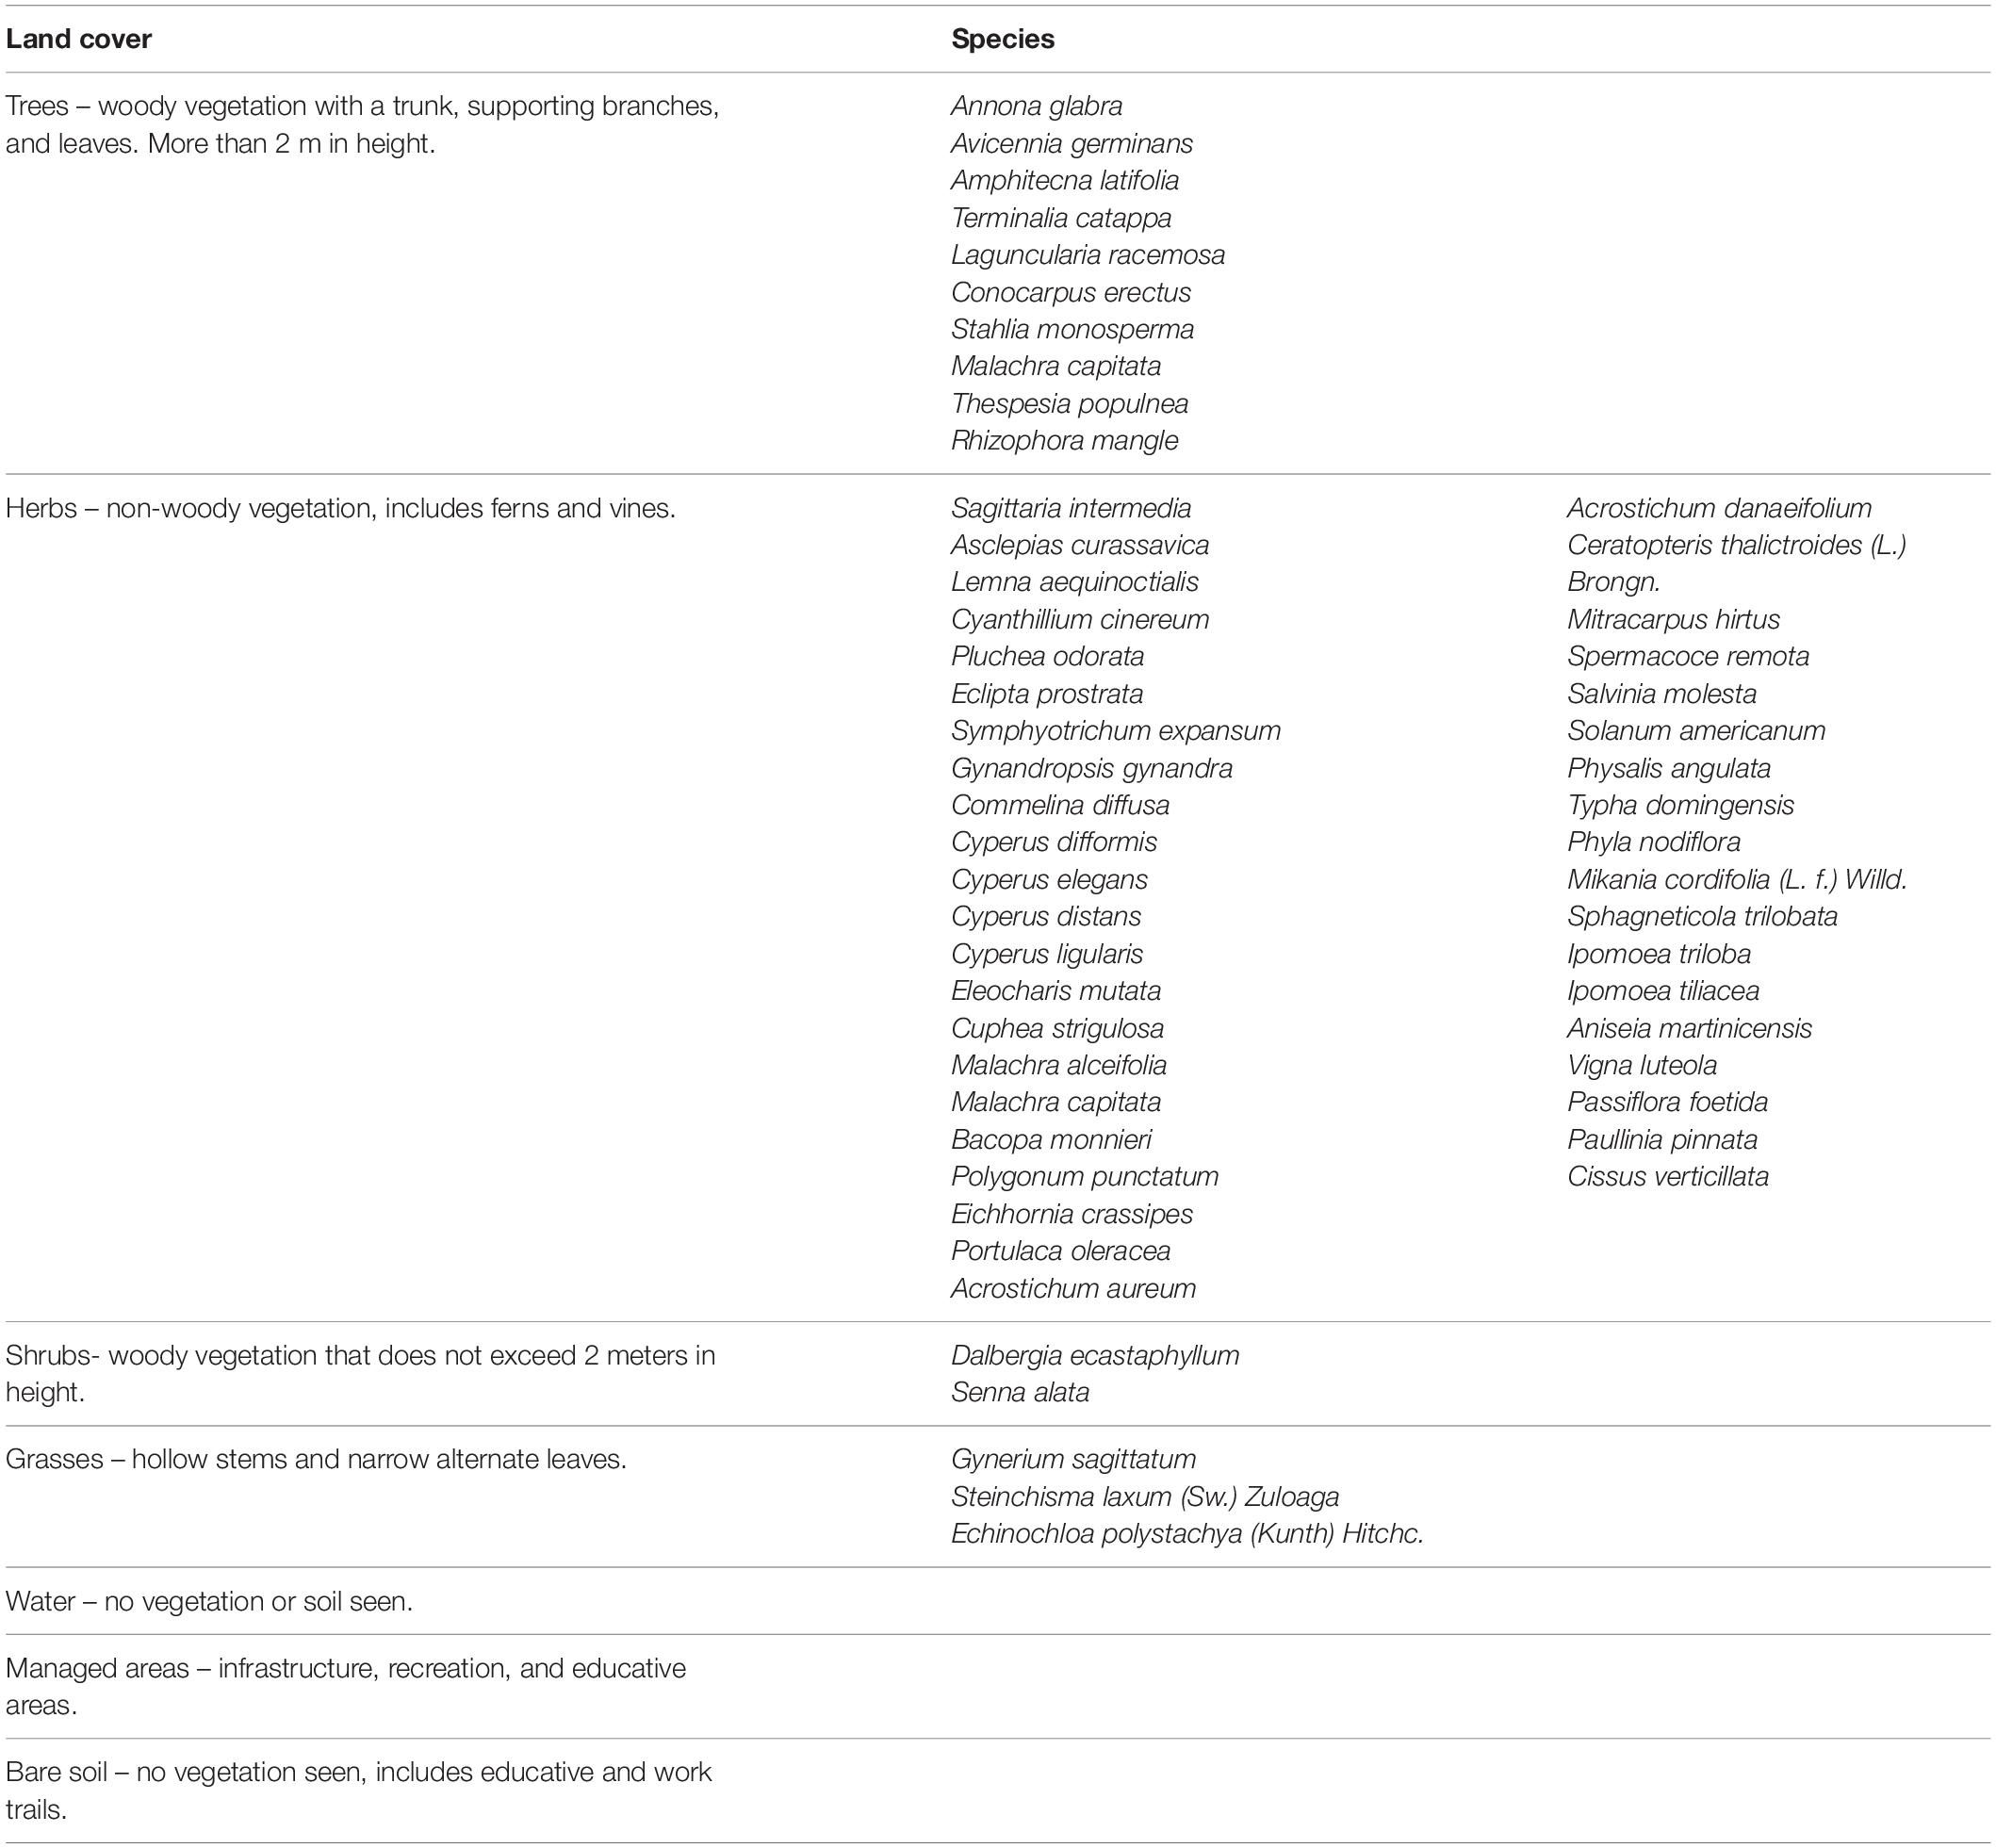
Table 1. Land cover categories, definitions for spatial assessment, and species for each plant cover.
Species Composition Assessment
From 2018 to 2019, we conducted a periodic collection of vegetation specimens for classification. Individuals were pressed, dried, identified, and grouped into functional groups based on life forms. We used literature and herbarium specimens from the New York Botanical Garden,1 University of Puerto Rico, Río Piedras2 and Mayaguez campus3 to compare post-hurricane species to the pre-hurricane wetland composition.
Leaf Traits
Fully expanded and exposed adult leaves (at a 2-meter height in trees) of the four plant species representative of plant growth forms present in the wetland (trees, shrubs, and herbs) were sampled and measured throughout the seasons. L. racemosa (L.) C.F. Gaertn. and A. germinans (L.) L. are both considered salt-tolerant trees (Parida and Jha, 2010). D. ecastaphyllum (L.) Taub. is a climbing decumbent shrub, reaching 1–5 m in length and grows in non-forested areas forming monospecific stands (Acevedo-Rodríguez, 2005). A. danaeifolium Langsd. & Fisch. Is an herbaceous, rhizomatous fern common in brackish swamps, tolerant to soil saline conditions up to 45–50 mS/cm but requires freshwater for establishment (Medina et al., 1990a). We sampled during 2018-2019 in the wet (May to October) and dry (November – April) periods. We assessed leaf area and dry mass at least once each dry and wet period for the three plant types representative of the plant growth form (Table 1). At the end of the study, we measured δ13C and δ15N isotopes in the leaf tissue for assessing long-term water use efficiency (WUE).
The leaves were stored in a cooler to prevent water loss until analysis. Leaf area was measured with an LI-3100C Area Meter and later dried in a forced-air circulation oven at 60°C for dry mass determination. Specific leaf area (SLA; the area of a fresh leaf divided by its oven-dry mass) was calculated as an index of the construction cost of leaves. SLA tends to relate positively to relative growth among species (Pérez-Harguindeguy et al., 2016). In the leaf economics spectrum, SLA indicates habitat preferences and plant productivity in environments under stress (Medina et al., 1990b). The SLA is also related to light conditions, where high values indicate shaded leaves and low values suggest high light or open canopies.
Carbon isotope analyses (δ13C) were performed in leaf samples to reveal plant long-term WUE which has been associated with salt tolerance (Ball and Passioura, 1995). Intracellular CO2 and plant WUE was calculated based on the Farquhar et al. (1989) equation: δ13Cleaf = δ13Cair – a – (b-a) Ci / Ca, where δ13Cair is the carbon isotope ratio of the CO2 in the air (around 8.2 ‰); a is the fractionation by slower diffusion of δ 13C to δ 12C (4.4 ‰); b is the fractionation by ribulose biphosphate carboxylase against 13C (27 ‰); and Ca is the atmospheric CO2 concentration which averaged 413 μmol/mol at the time of the study. Intrinsic WUE was derived from the Lambers et al. (2008) equation, where intrinsic WUE = (An/gs).
Shapiro Wilk test was used to test normality in distribution. Analysis of variance (ANOVA) was used when data fits normality; if not, a nonparametric Wilcoxon/Kruskal Wallis test was used with the statistical program JMP Pro version 13.
Results
Land Cover
Around 33% of the study area was devoid of standing vegetation (Figure 2), which decreased considerably in July 2018 and January 2019. In April, trees were the predominant cover with 8,221 m2, followed by grasses, 2,532 m2, shrubs, 1,545 m2, herbaceous vegetation, 1,368 m2, and managed areas with 778 m2 of the study area (Figure 3; Table 2).
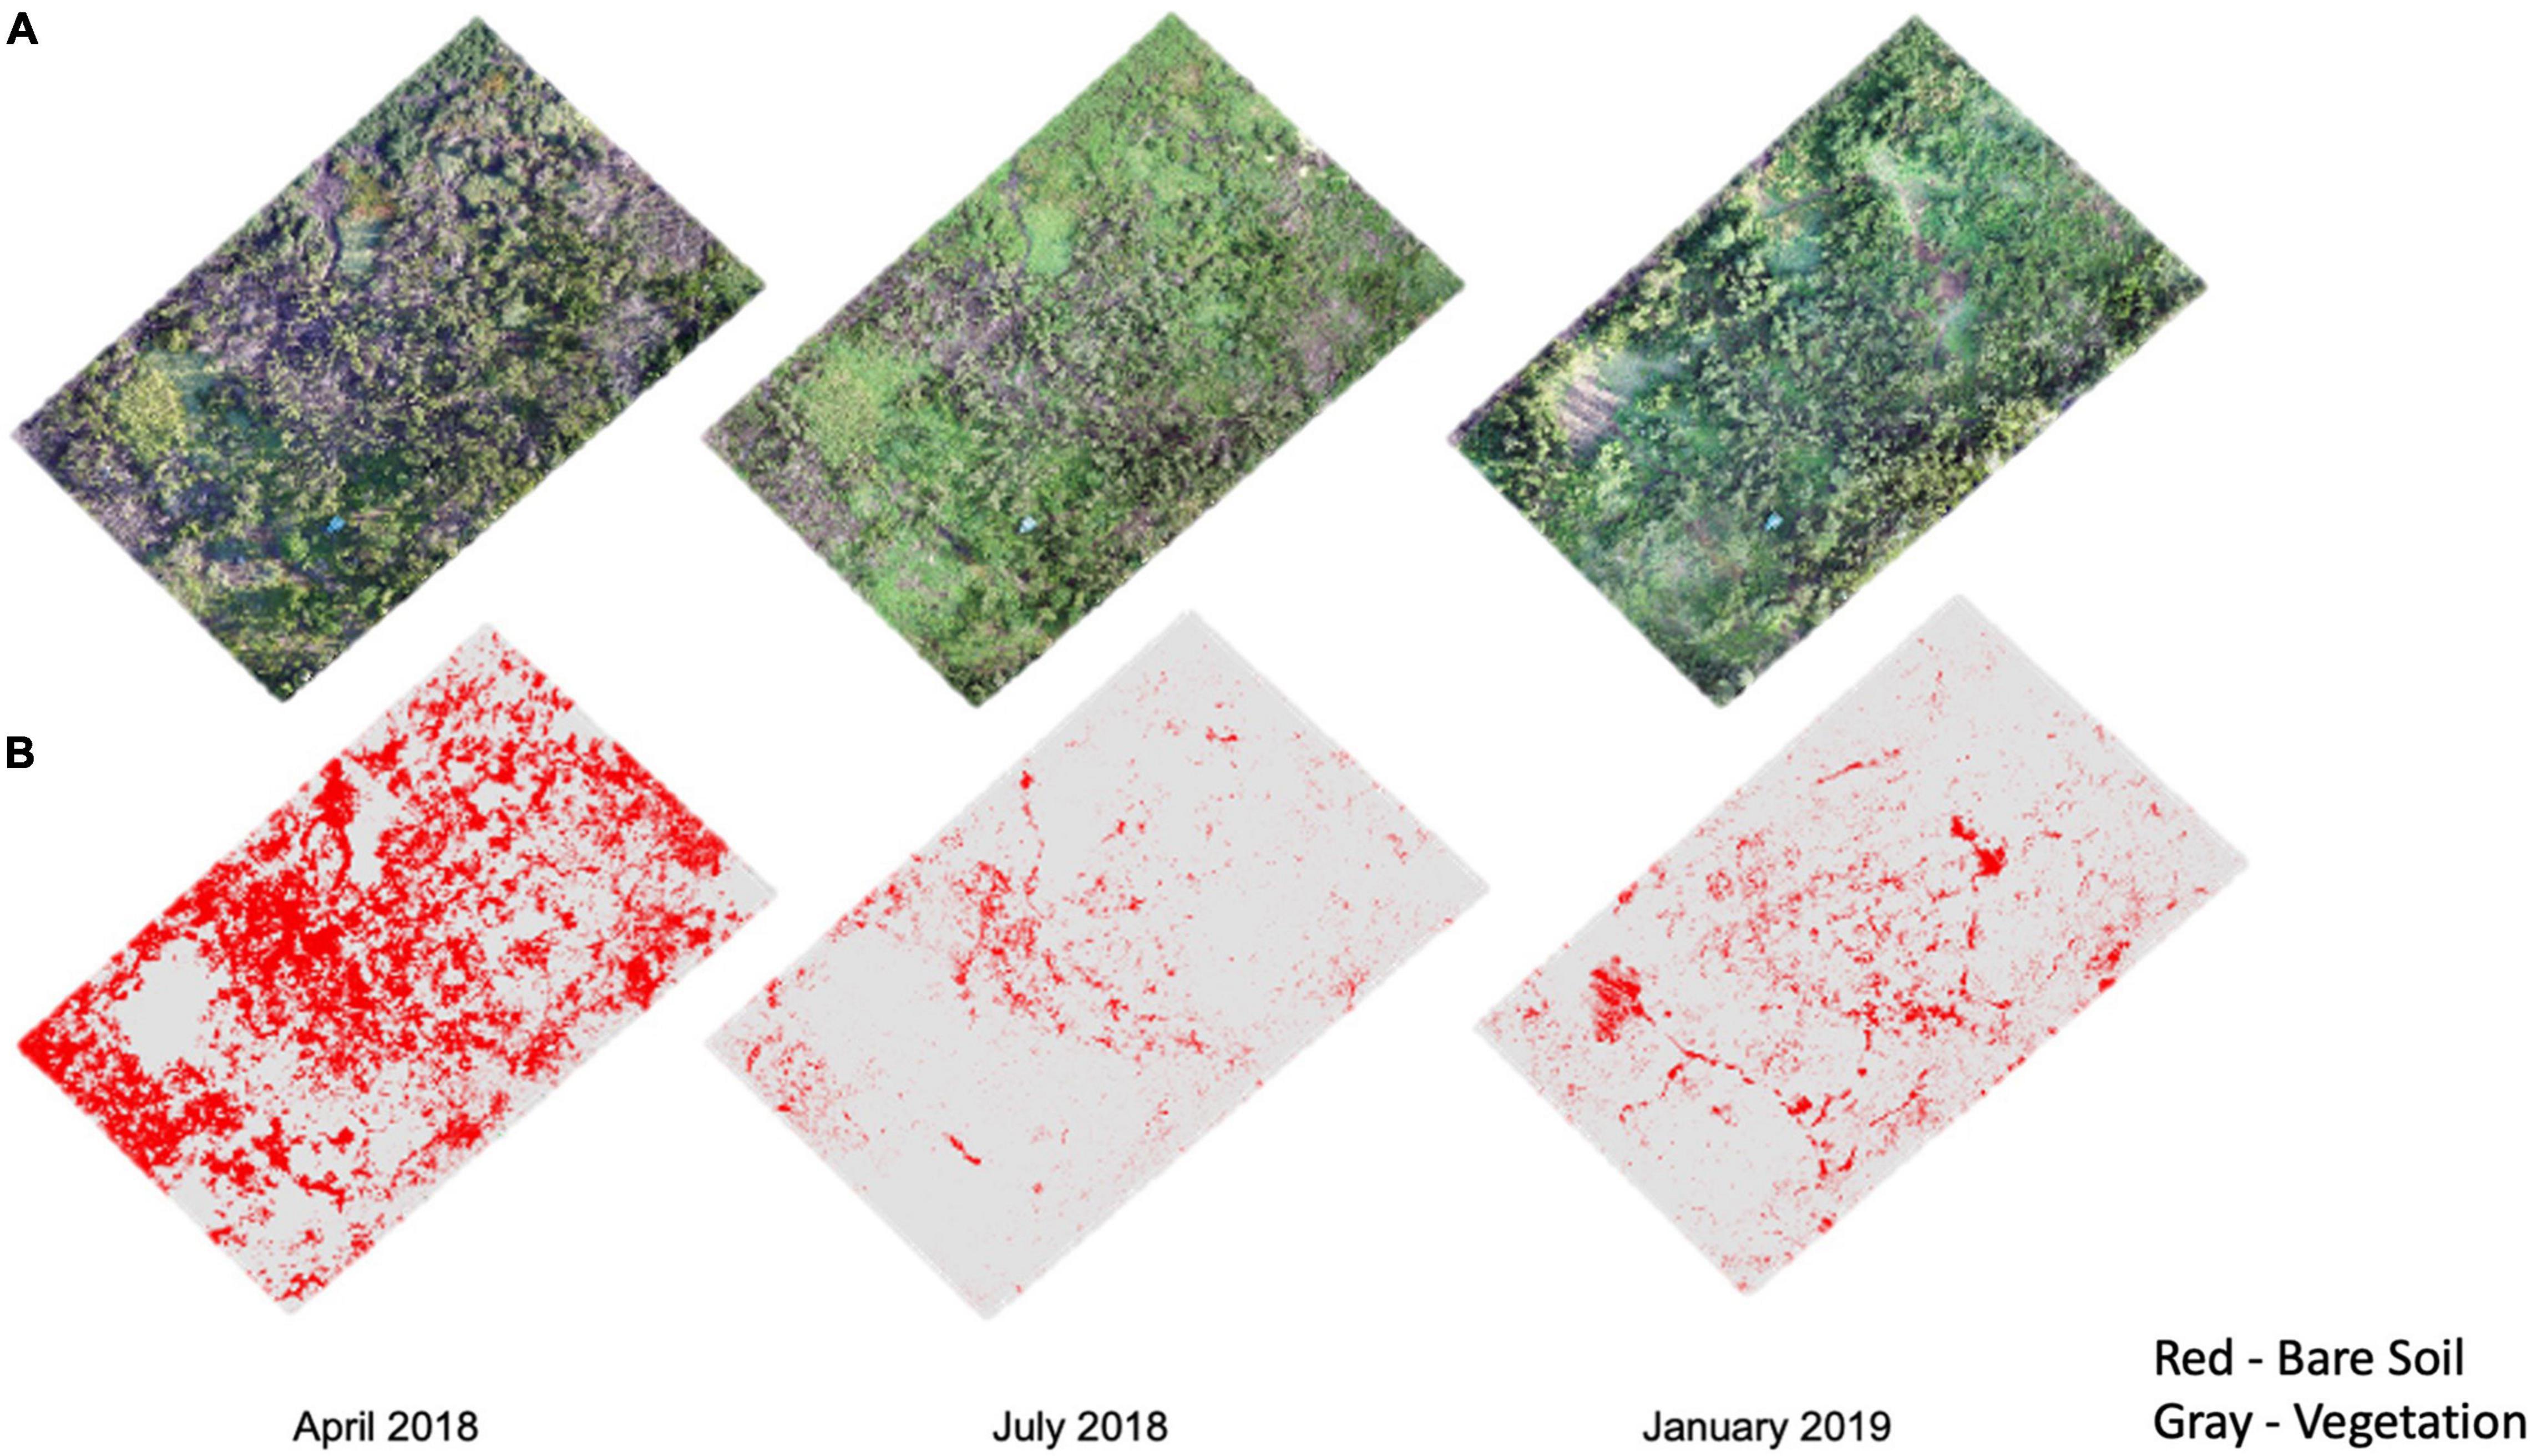
Figure 2. Aerial imagery of the study area. (A) Red-Green-Blue (RGB) drone images taken in April 2018, July 2018, and January 2019 are the raw images collected to determine (B) area of standing vegetation and bare soil within the study site in April 2018, July 2018, and January 2019; red color indicates bare soil and gray color indicates alive vegetation.
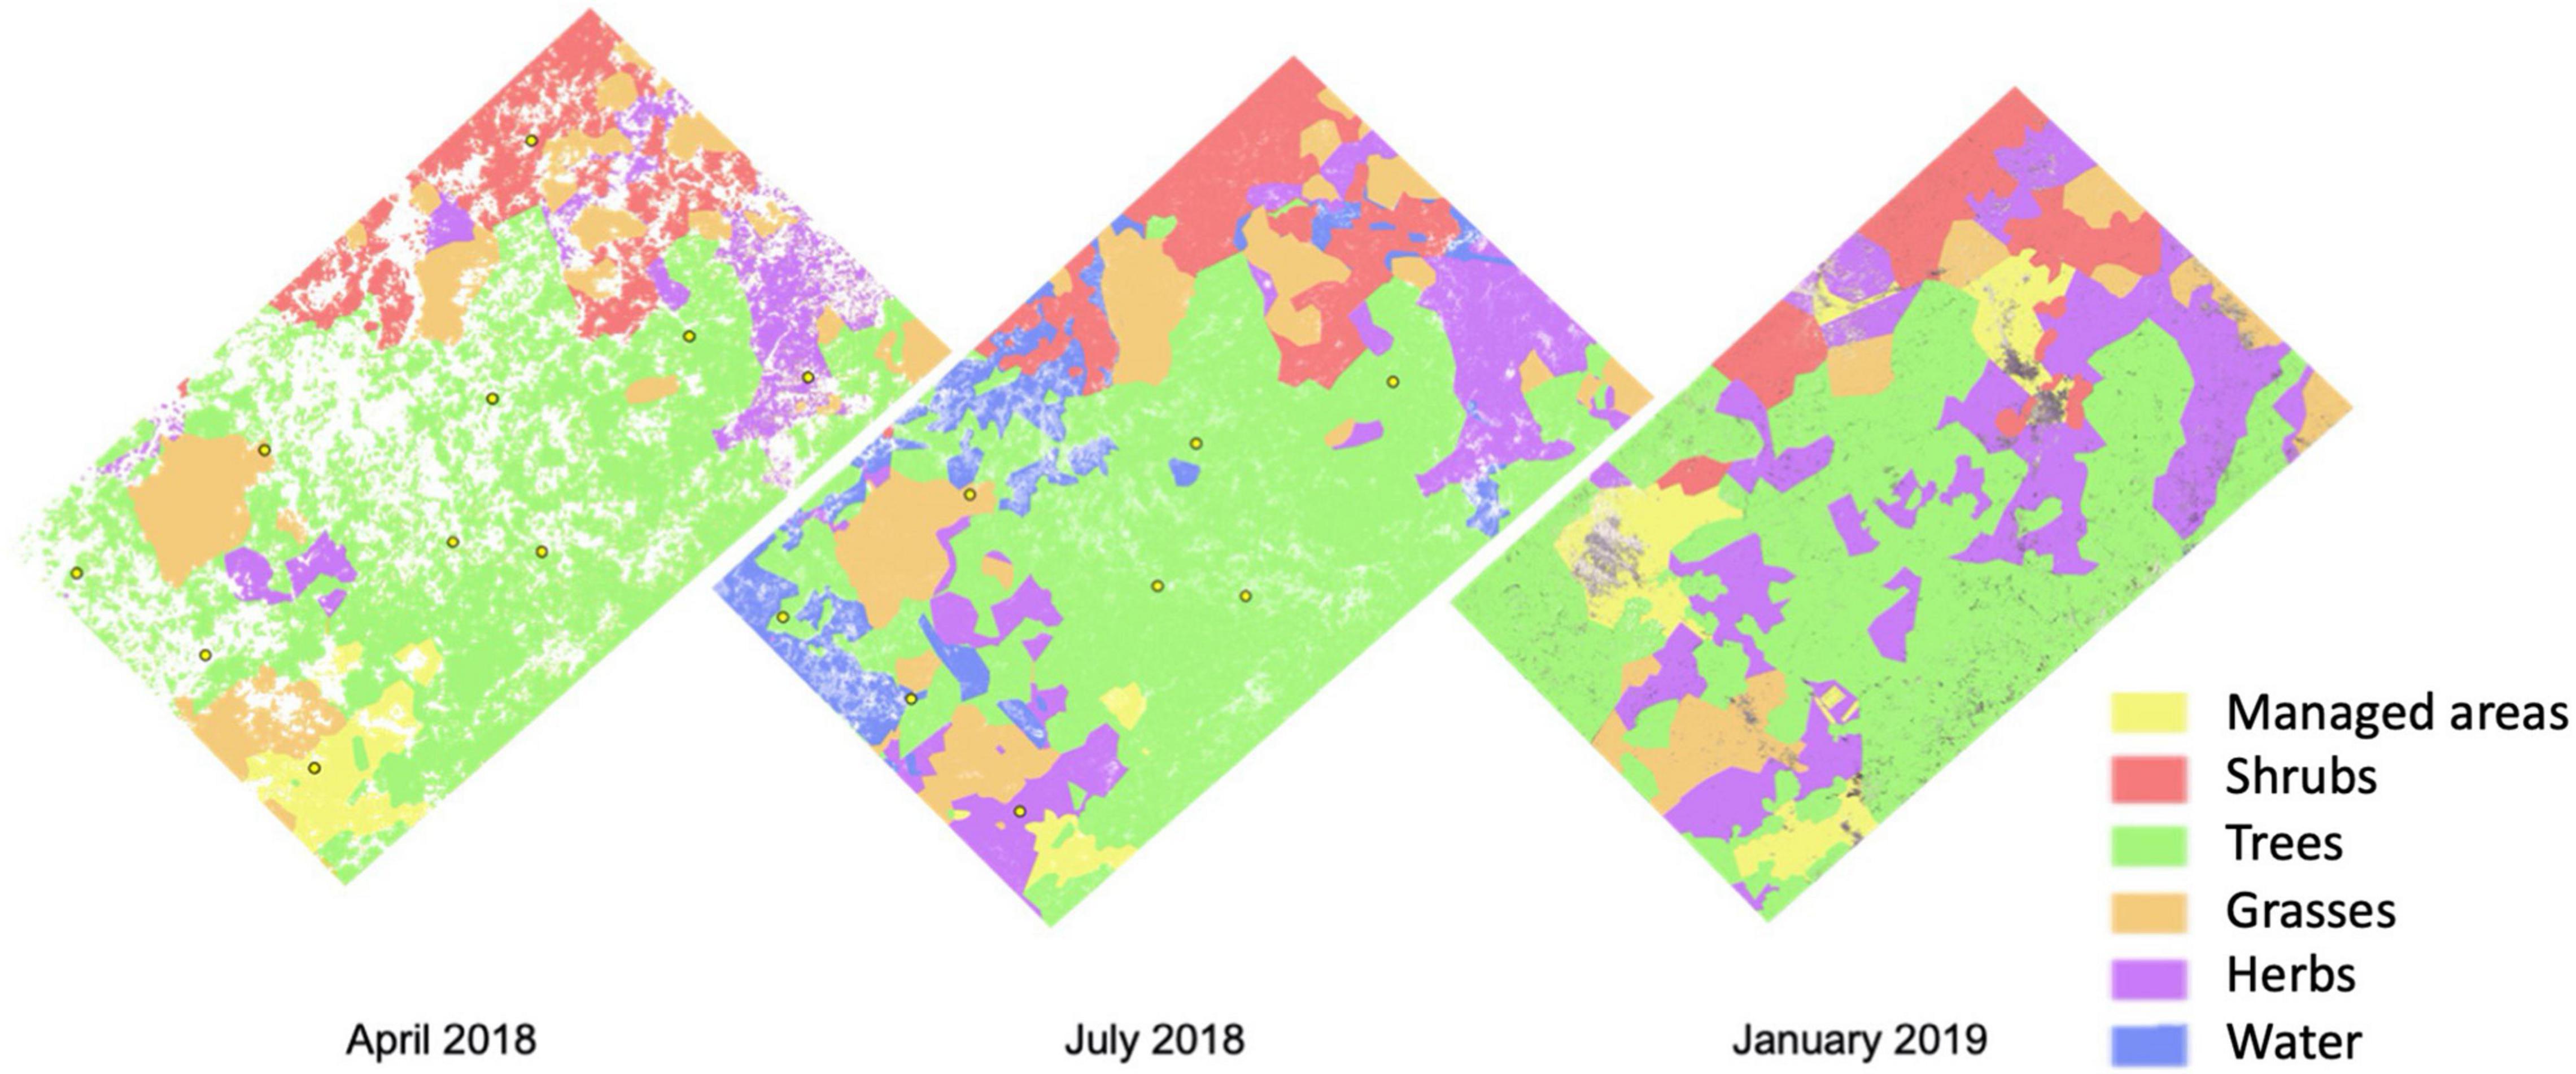
Figure 3. Spatial classification of land cover of each vegetation type in April 2018, July 2018, and January 2019. Yellow dots denote monitoring wells where phreatic water measurements were taken.
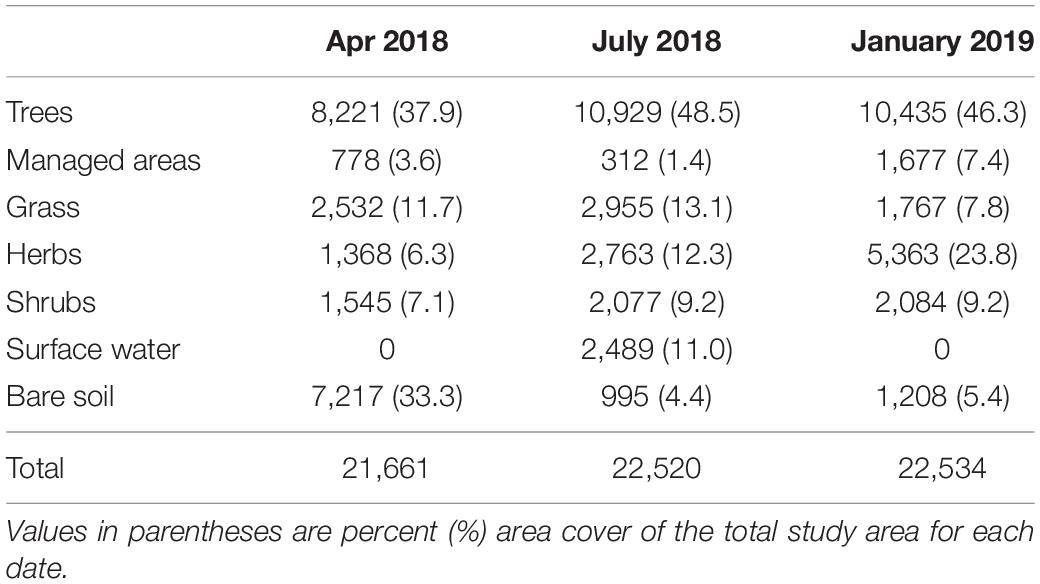
Table 2. Land cover area in m2.
In July 2018, trees continued as the dominant cover with 10,929 m2, followed by grasses, 2,955 m2, herbaceous cover 2,763 m2, shrubs 2,077, and managed spaces with 312 m2. In January 2019, trees occupied 10,345 m2, a decrease related to the removal of trees due to rehabilitation efforts, herbaceous cover 5,363 m2, shrubs 2,084 m2, grasses 1,767 m2, and managed areas 1,677 m2 within the study area.
Hydrological Conditions
Precipitation data exhibited the bimodal pattern for the island, June (316 mm) and August (281 mm) being the wettest months. The driest month was March (60.9 mm; Figure 4). At the phreatic level, we found higher conductivity values closer to the coastline with a sharp drop around 1 km inland, with conductivity values ranging spatially from 10 to 35 mS. We found marine intrusion at a depth of 2.5 meters in most of the wells (Figure 5). This trend prevailed through the wet period (September to November) and to the beginning of the dry period (January 2019; Figure 4). An elevation profile of the microtopography shows that most of the wetland is below sea level – 0.4 meters below sea level at its lowest point and only 0.14 meters above sea level at its highest elevation (Figure 6).
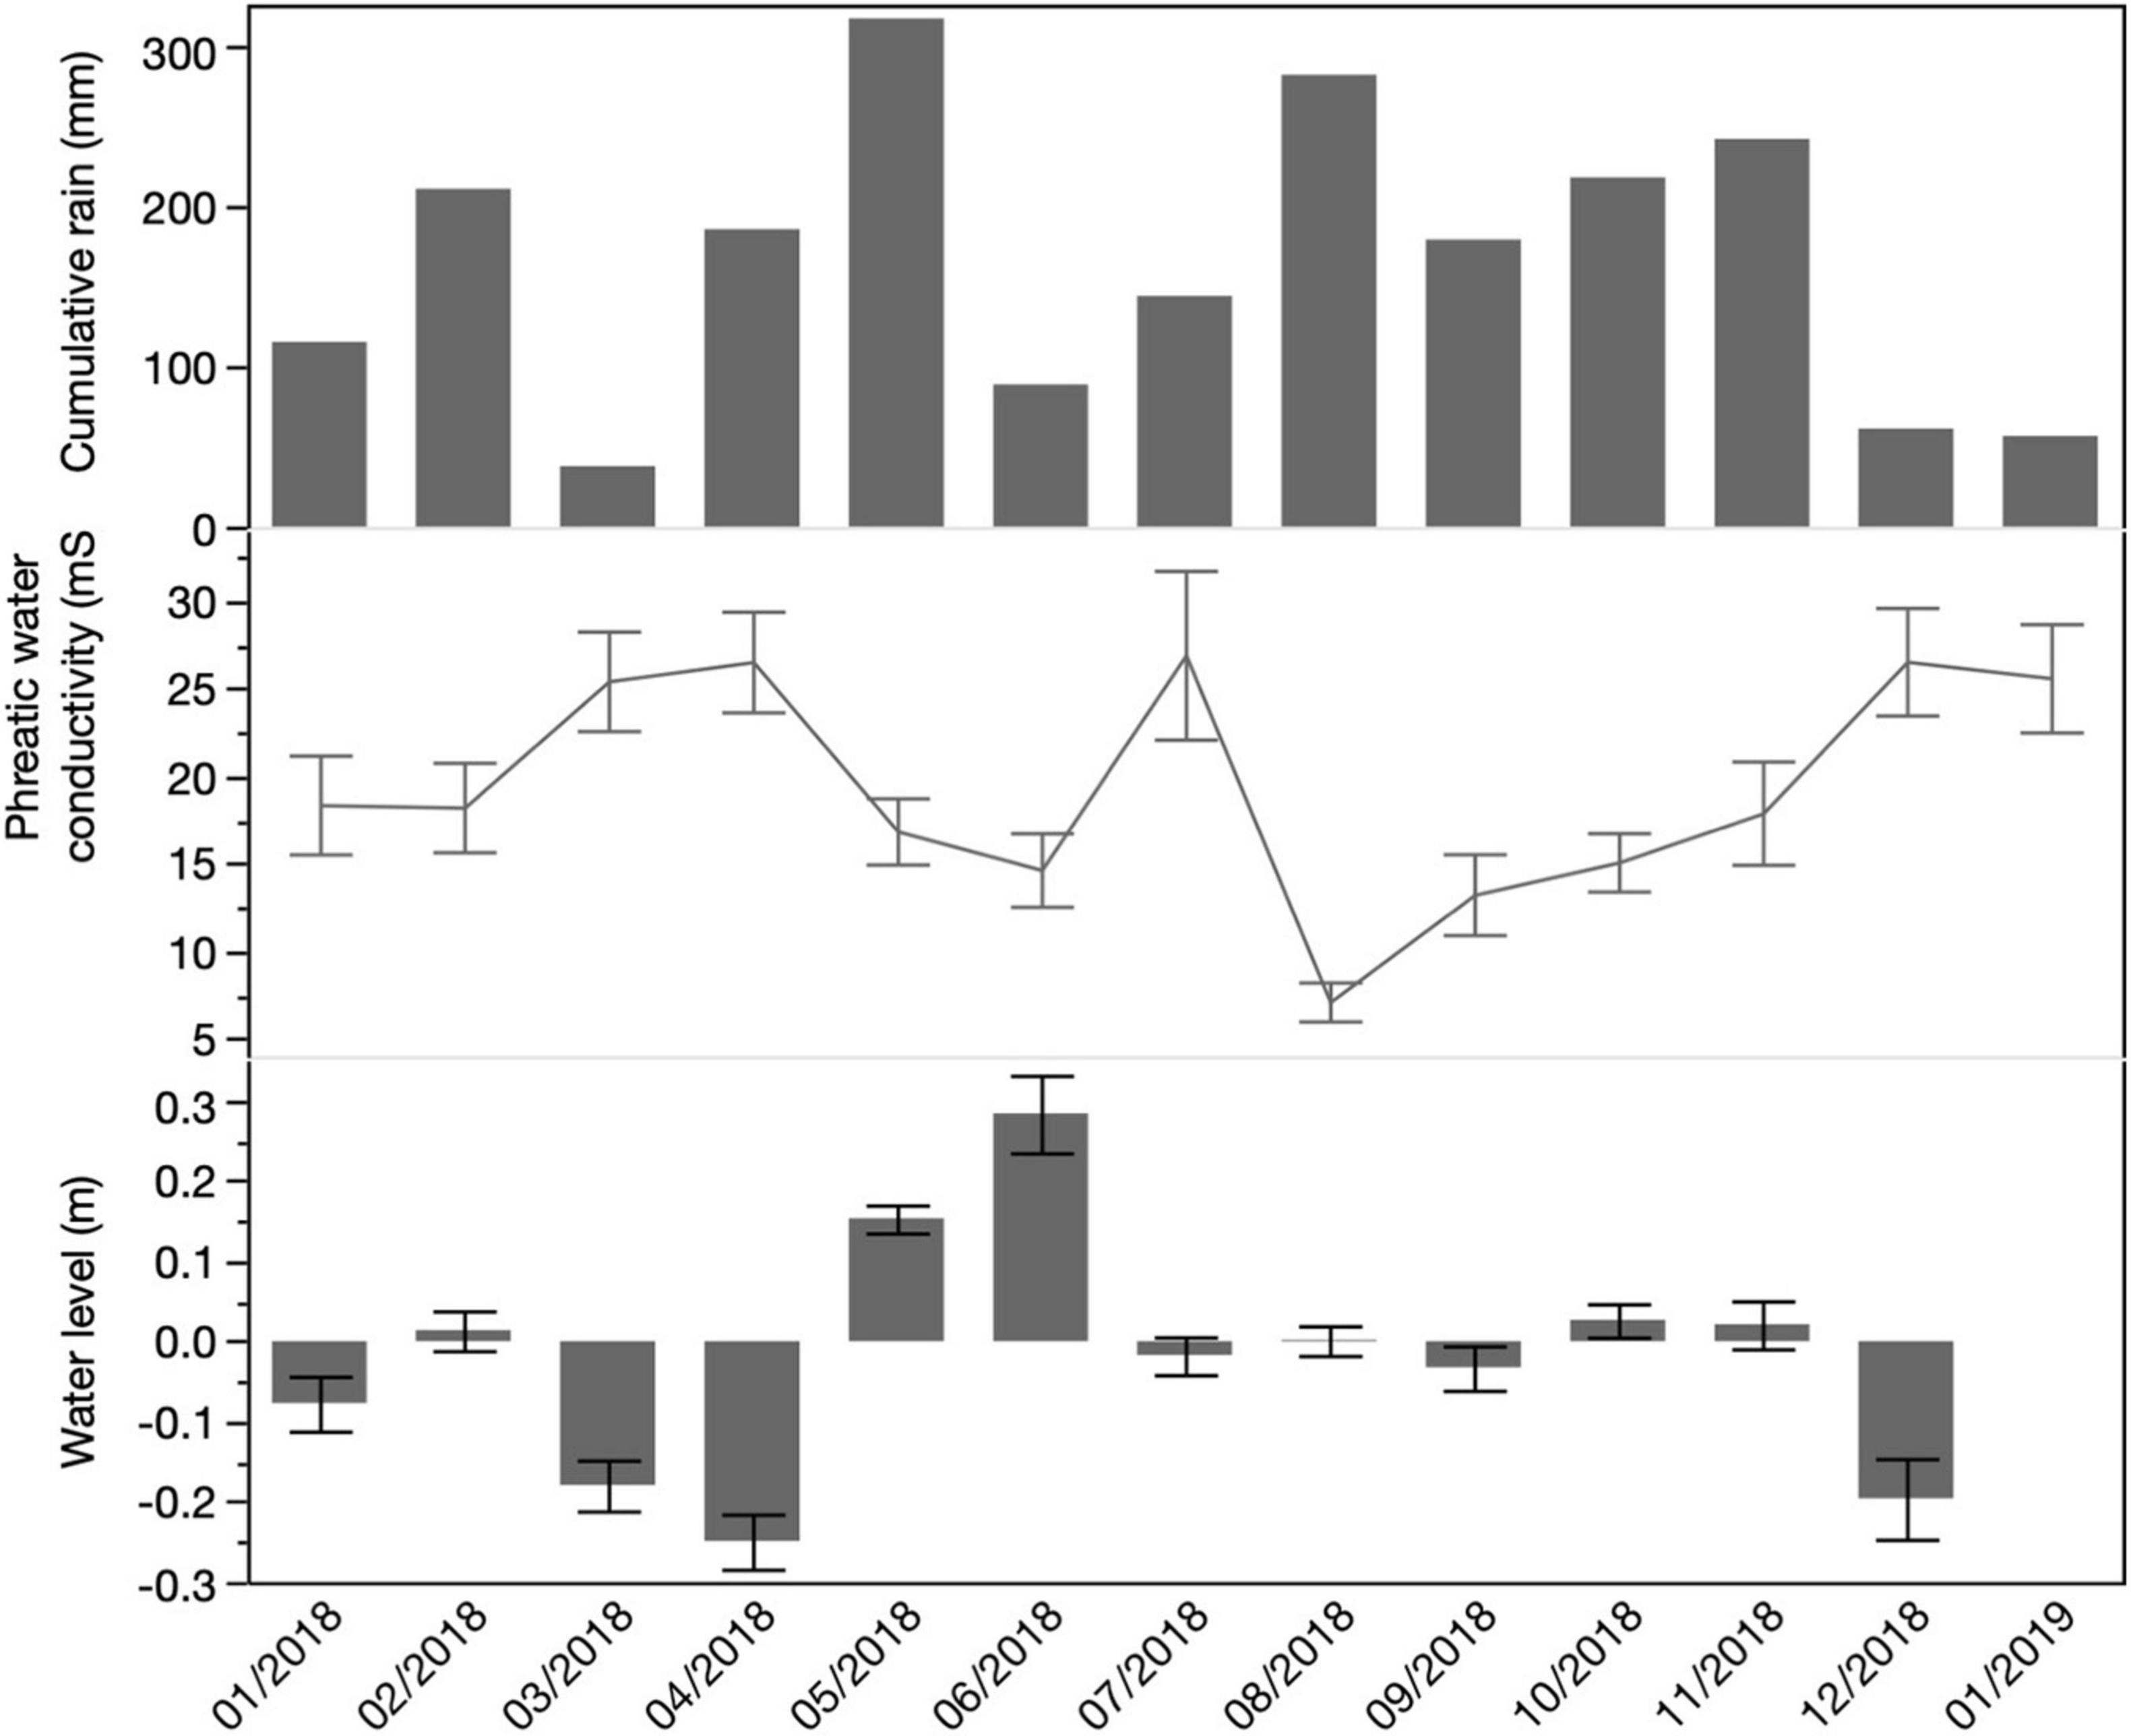
Figure 4. Total monthly rainfall accumulation (mm) and average monthly phreatic water conductivity (mS/cm) and water levels (negative values indicate below soil level, positive values are above soil level) in ciénaga Las Cucharillas. Error bars represent ± standard error.
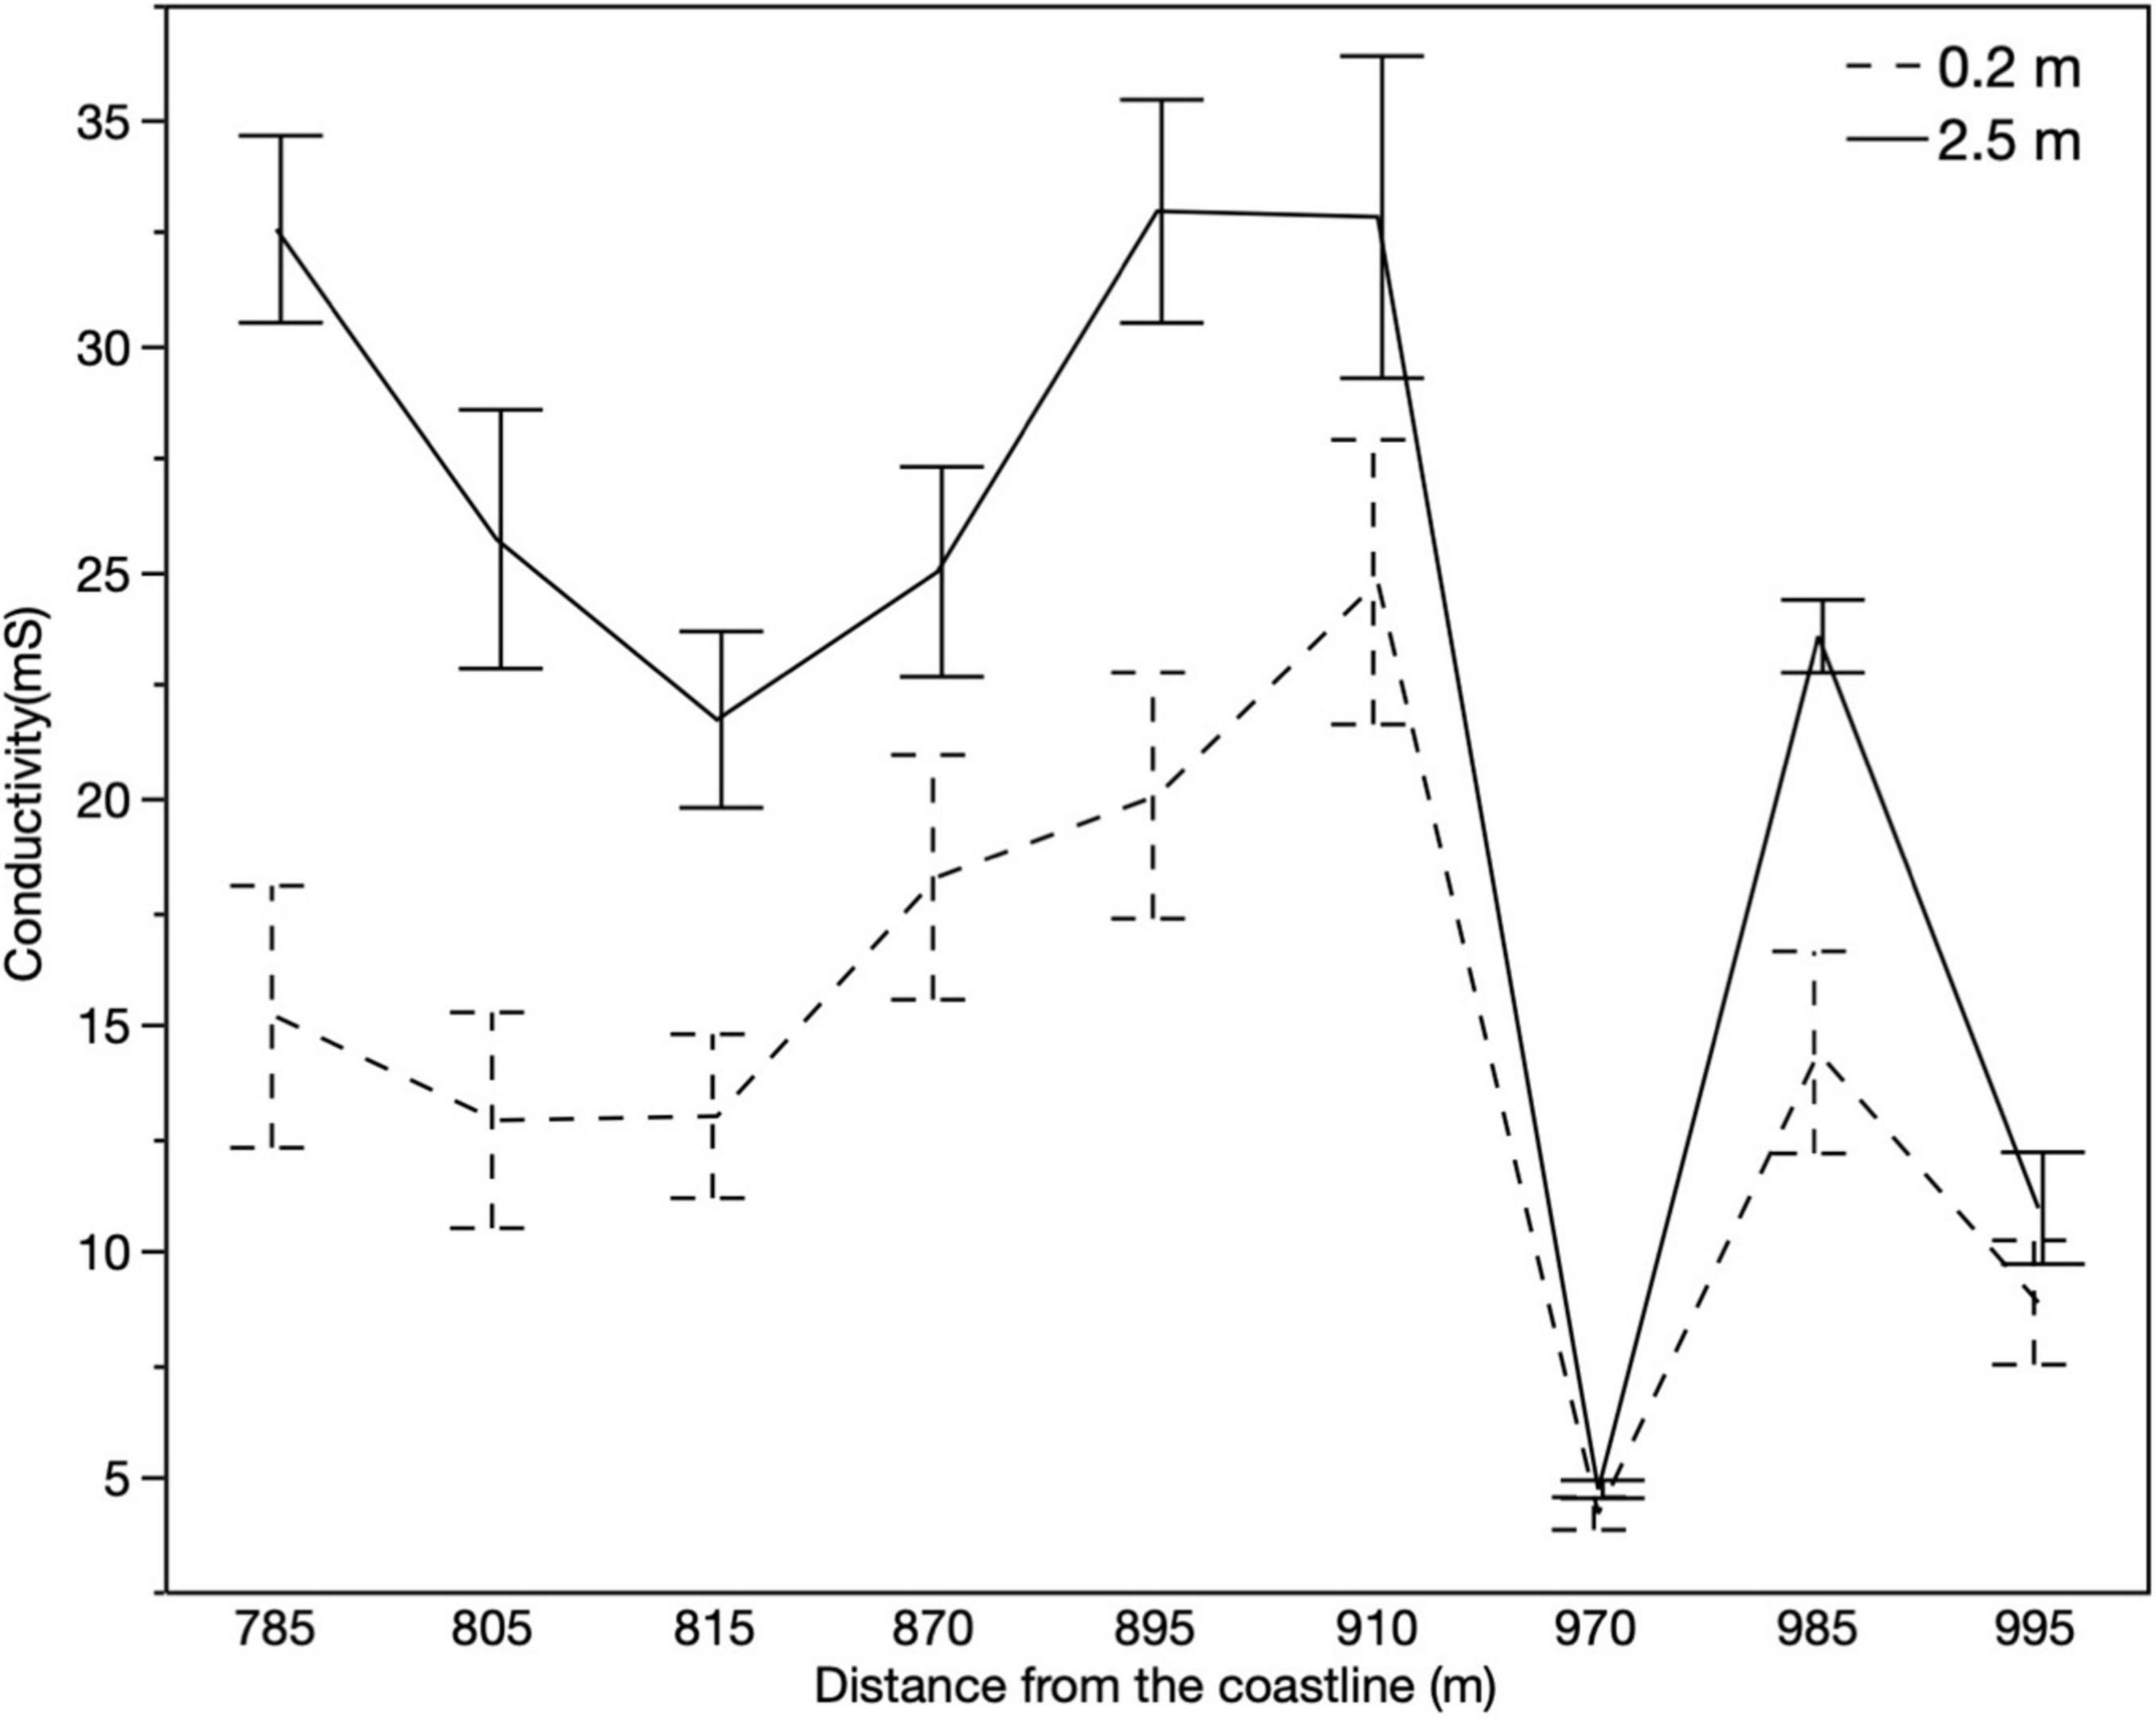
Figure 5. Average monthly water conductivity at the phreatic level (0.2 m) and 2.5-meter depth at specific distances from the coastline (n = 12). Error bars represent ± standard error.
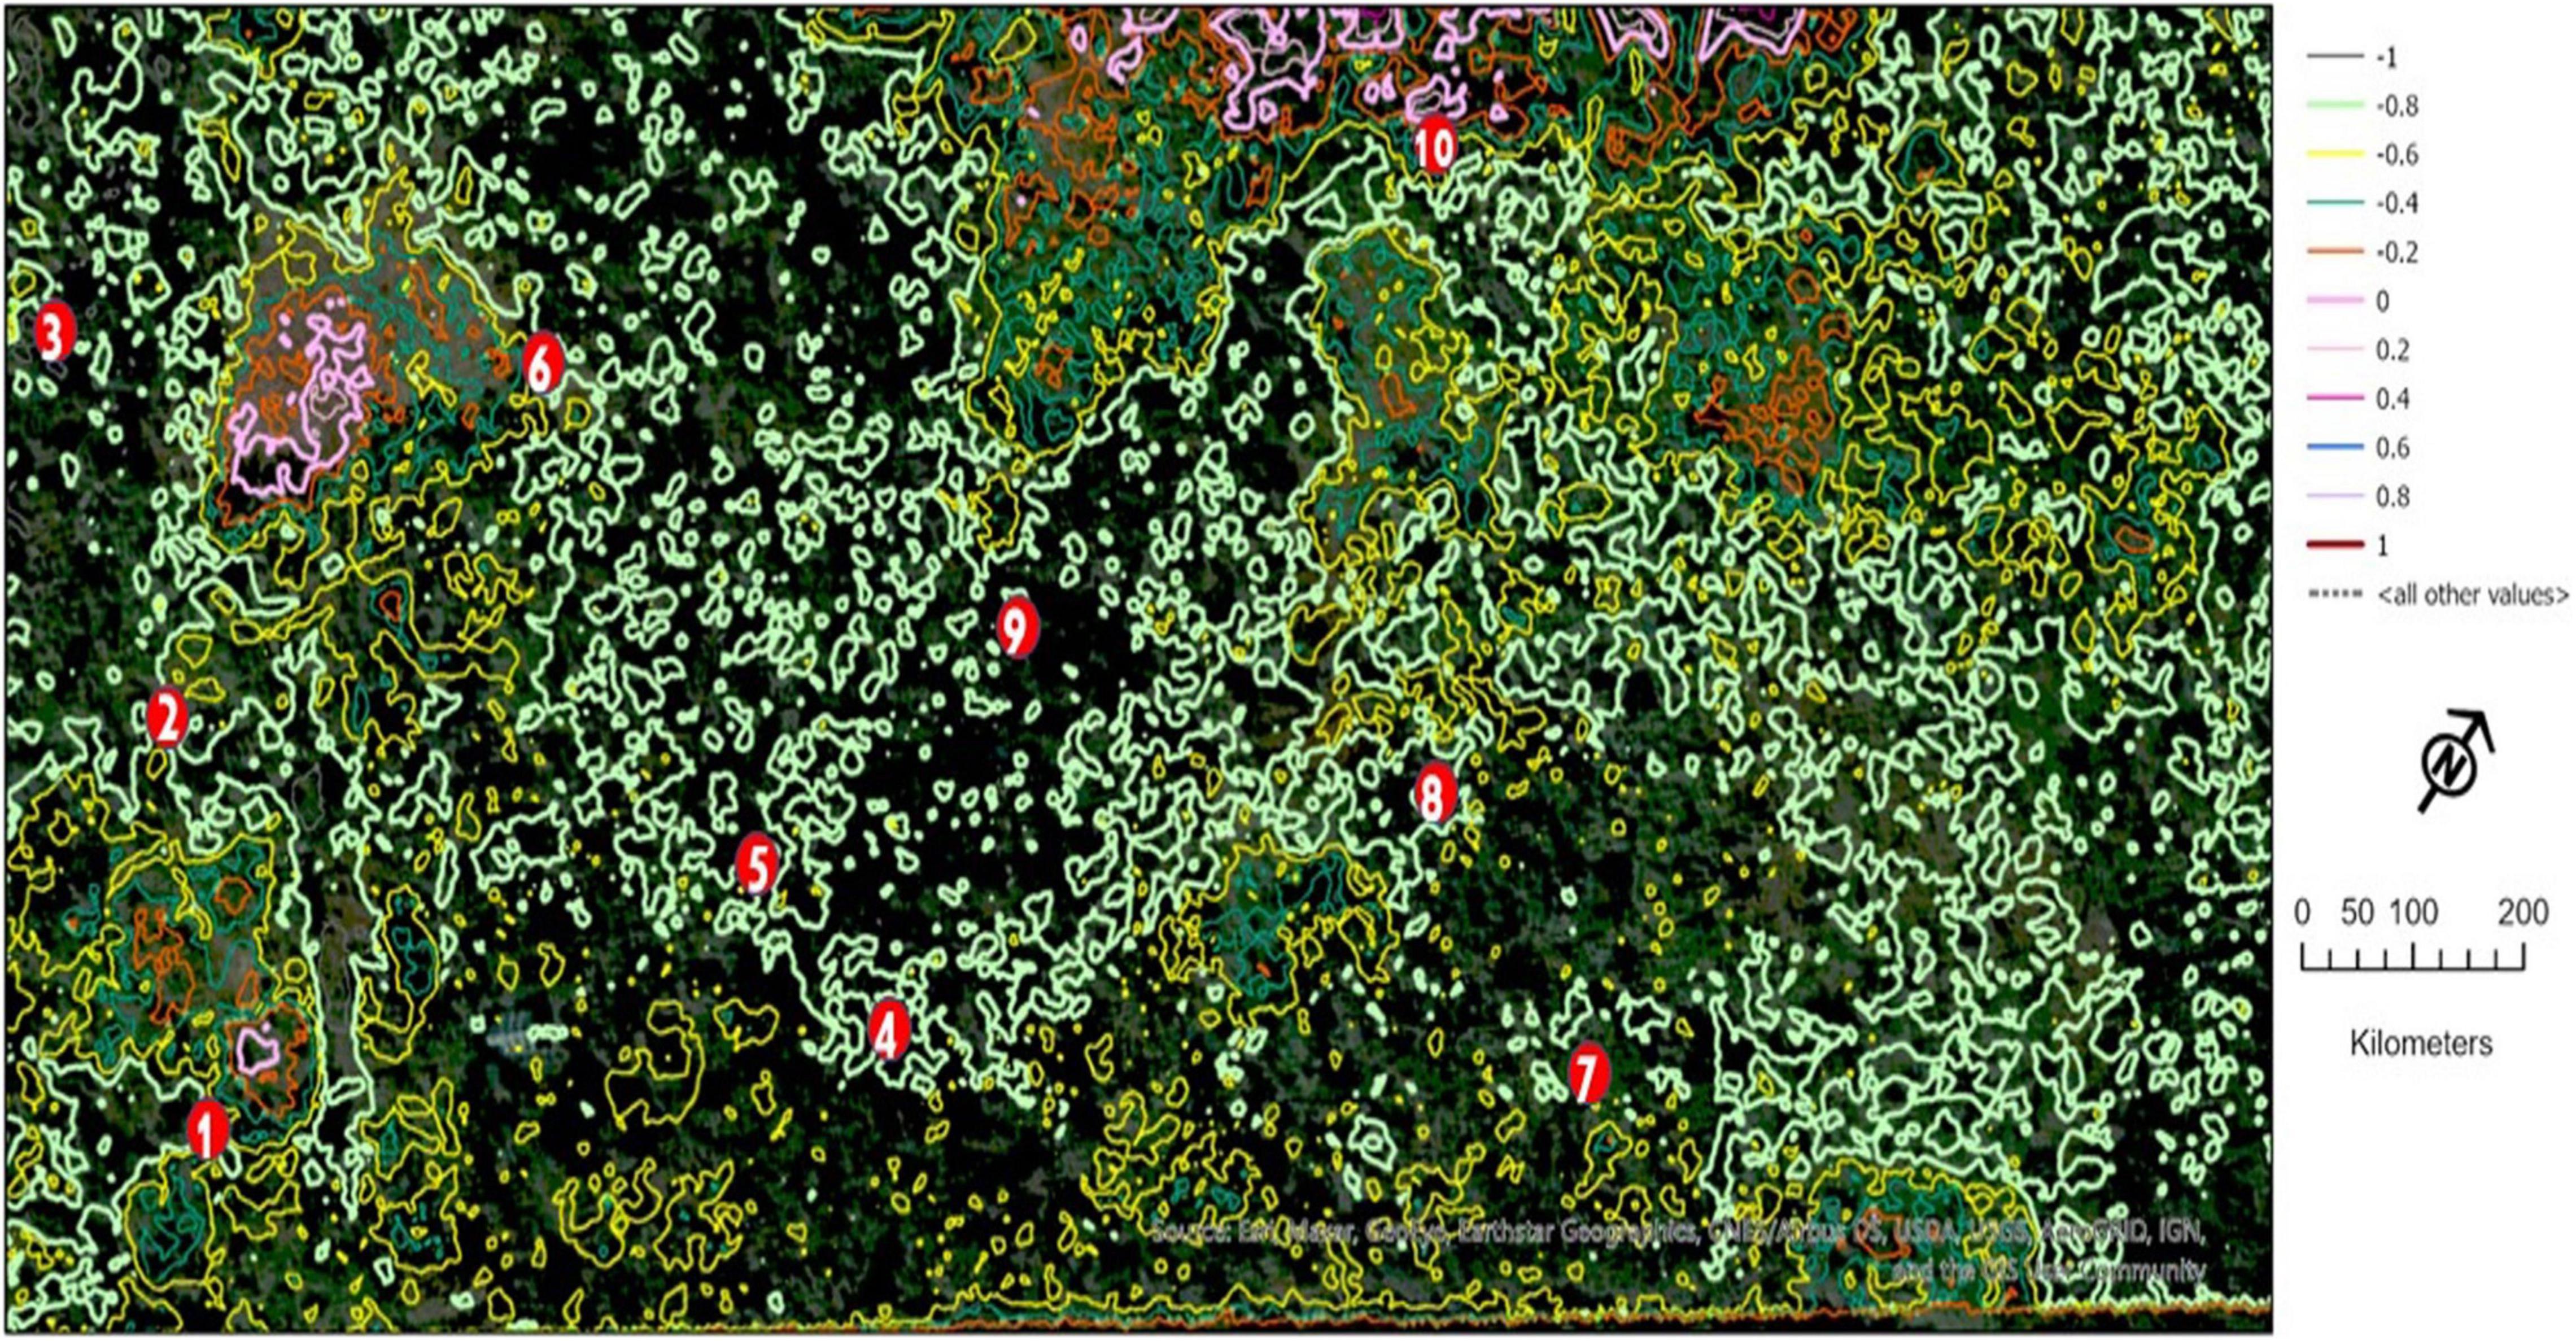
Figure 6. Soil profile elevation for the study area in ciénaga Las Cucharillas. Red dots denote monitoring wells. Contour lines are in meters.
Species Composition Assessment
From May 2018 to March 2019, we collected a total of 58 species which we categorized into 32 families. The predominant plant growth form was herbs with 34 species, followed by 10 species of trees, 10 vines, and 2 species of shrubs and 3 grasses. We found a proportion of 0.17 of woody species to non-woody (10 woody vs. 48 non-woody species), and 47 native species and 11 nonnatives (4.3 ratio). There were 42 dicotyledons and 12 monocotyledons. Of the collected species, 46 were perennial species, and 12 were annual (Table 3).
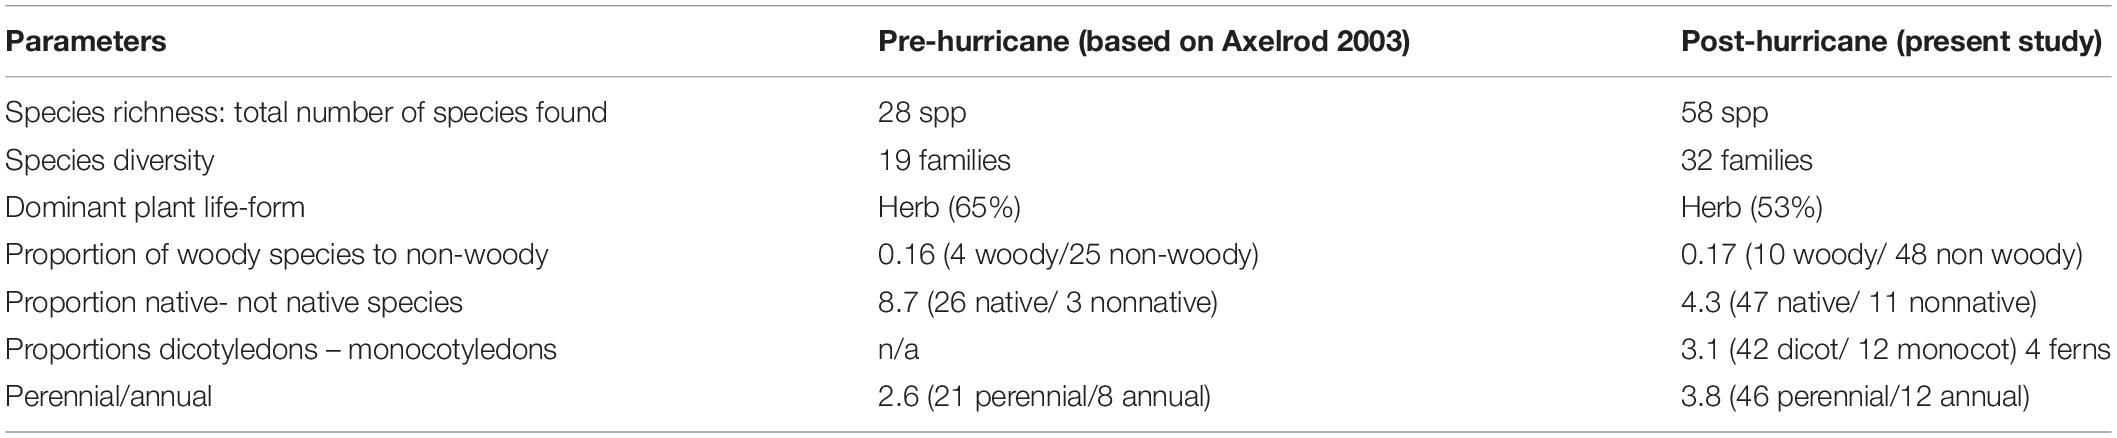
Table 3. Previous and post hurricane plant composition parameters comparison.
Leaf Traits
Trees had a lower leaf area than herbaceous and shrub species, where Avicennia and Laguncularia leaves were smaller than Acrostichum and Dalbergia (Table 4). The heaviest leaves were from Dalbergia; Laguncularia and Avicennia trees had similar foliar weights to each other. Leaves for all species followed the same weight area relationship, indicating a uniform sampling of adult leaves, allowing for comparison within dates (Figure 7). SLA for species varied significantly between dates, showing decreasing patterns post-hurricane in Avicennia, and increasing SLA values in Dalbergia. Laguncularia remained constant, except for June 2019 which SLA values decreased significantly from the rest of the dates (average 47.2 g/cm2). The pattern of SLA was Acrostichum > Dalbergia ≥ Avicennia > Laguncularia.
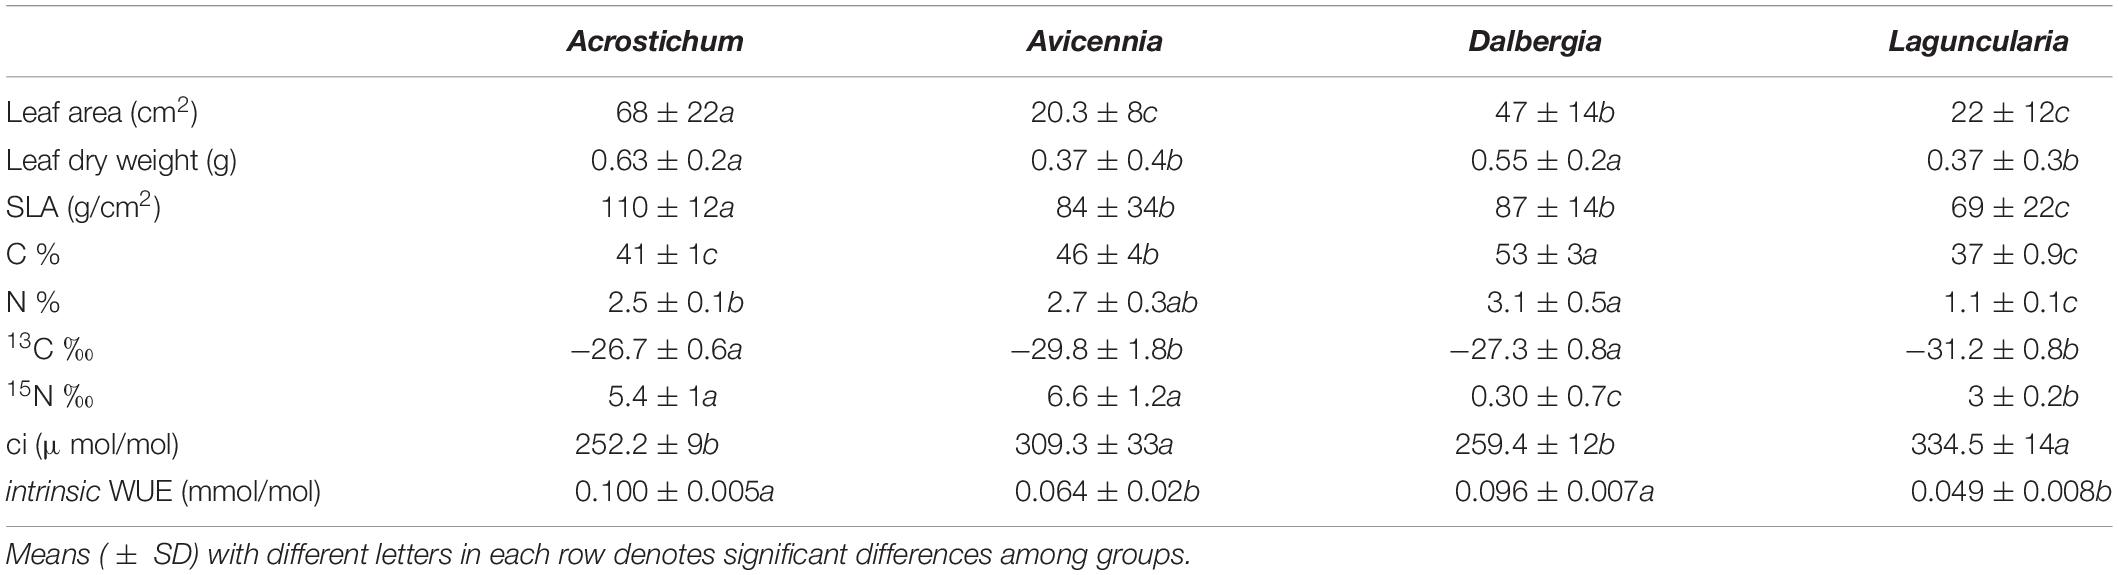
Table 4. Plant functional traits, carbon and nitrogen contents, isotopic signatures, intracellular CO2 concentrations (ci), and intrinsic water use efficiency (WUE) for the plant functional types.
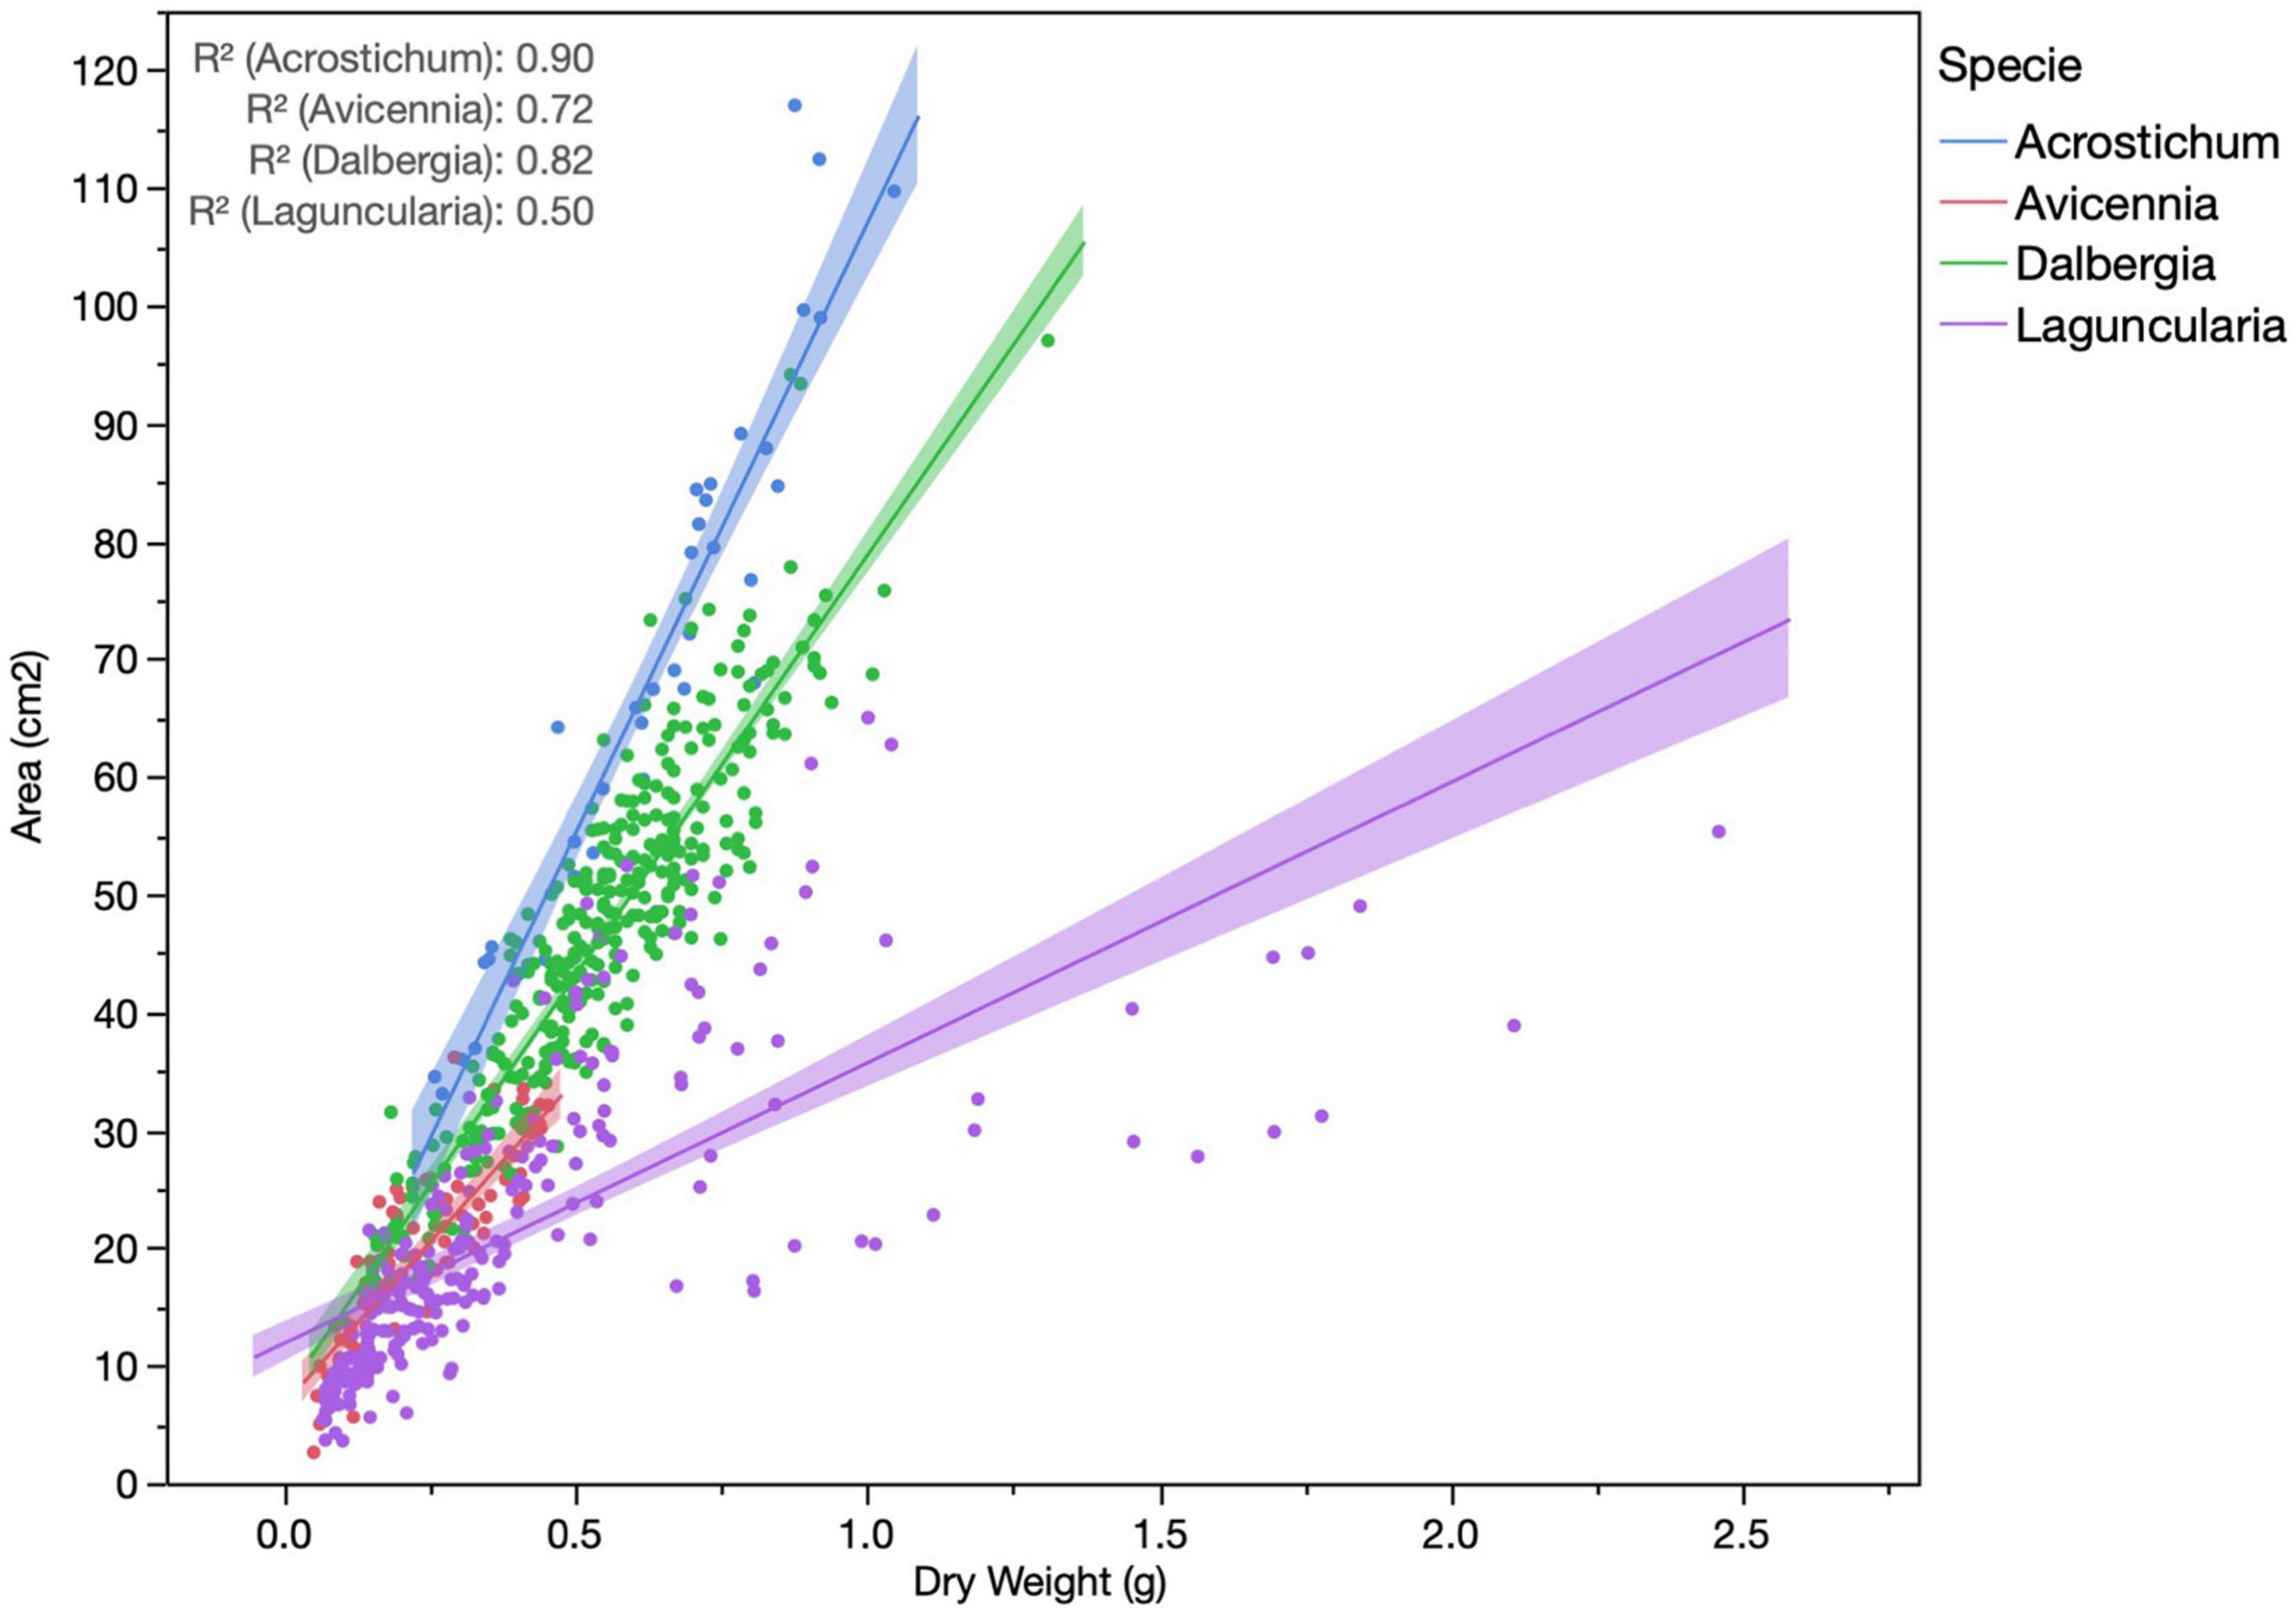
Figure 7. Area – weight relationship of the four species sampled.
Leaf carbon (C) concentration varied from 36 to 58%, with a mean of 45 ± 7 % in all species. Dalbergia had the highest C concentration with 53 ± 3 %, and Laguncularia had the least with 37 ± 0.8 %. Tukey-Kramer comparison showed significant differences between species, except between Acrostichum and Laguncularia. Leaf nitrogen (N) concentration ranged from 0.91 to 3.95 %, with a mean of 2.4 ± 0.8 %. Dalbergia had the highest N concentration with 3 ± 3.1%, and Laguncularia had the least with 1.1 ± 0.1 %.
Leaf C isotope ratios spanned a range of over 6 ‰ with a mean of −28.7 ± 2.1 ‰. Avicennia showed a large range of values from −32.2 to −28.2 ‰, (average −29.8 ± 1.9 ‰) while the rest of the species had smaller ranges (standard deviations <0.8 ‰). Acrostichum and Dalbergia C stable isotopes were similar and differed significantly from Laguncularia and Avicennia. N isotope ratios spanned a range of over 8 ‰ with a mean of 3.79 ± 2.7 ‰. Avicennia had the highest values with 6.6 ± 1.2 ‰ and Dalbergia the lowest with 0.3 ± 0.7 ‰. Plant WUE varied significantly among plant life-forms where trees had lower values than herbaceous species.
Discussion
This study evaluated plant successional dynamics in coastal urban wetlands after a hurricane. The fast-slow continuum can explain these dynamics, where fast-growing but short-lived leaves are on one side of the spectrum, and slow-growth long-lived leaves are on the other, as leaf traits results suggest. Changes in hydrological conditions to more freshwater conditions will favor the establishment of herbaceous, non-halophyte species; however, as conditions stabilize to more saline, woody vegetation will replace these species. High 15N values suggest that hurricanes possibly bring nutrient inputs to the ecosystem, increasing the speed of the ecosystem’s recovery. Hurricanes in coastal urban wetlands might initially affect plant cover but do not affect plant composition in the long term. Climate change, expressed as precipitation extremes, sea-level rise, and increased evapotranspiration due to increased temperatures resulting in an increase in dry days (PRCCC, 2014), establishes the stressor baseline for coastal wetland ecosystems dynamics.
Wetland vegetation cover had a high recovery rate – 16 months after the hurricane, vegetation cover occupied 87 % of the study area, a 20 % increase in a year and a half post-hurricane. Regeneration dynamics were seen 7 months after the hurricane as barren substrate was occupied by polyhaline tolerant plants characterized by high SLA, fast growth, and short-lived leaves (Poorter and Remkes, 1990). Non-flooded conditions facilitated recolonization.
Leaf economics spectrums correlate with the plant fast-slow continuum, where plants that live longer invest more resources in leaf construction, whereas short-lived plants usually have fast growth leaves but are shorter-lived (Salguero-Gómez, 2016). We found that to be the case in this study, as the plant cover succession is related to the leaf investment of dominant plant species. Herbaceous cover doubled during the first 10 months, in contrast to tree cover, which had a moderate increase. Of the dominant species we assessed, Acrostichum (herbs) had a significantly higher SLA than Laguncularia and Avicennia.
As the wet season started, changes favored herbaceous species such as A. danaeifolium, tolerant to waterlogging, which doubled their plant cover. Sharpe (2009) reported increases in biomass rates and fertile leaf production of A. danaeifolium 8 months after a hurricane and a five-time increase in biomass rates after 2 years. This shift in vegetation could be due to changes in hydrological conditions, as has been previously reported in other coastal wetlands, where changes from saltwater conditions to freshwater inputs will favor the establishment of herbaceous wetland instead of woody vegetation (Ball, 1980; Clark and Csiro, 1988). Changes in soil microtopography is another factor that can play a role in the establishment of vegetation in wetlands (Moser et al., 2009). Microtopographical changes at our site likely effected species composition and cover since we observed that the sites above sea level had no tree cover. The 20 % increase in tree cover observed in July 2018 can be explained as branching and canopy development of surviving trees. McKee et al. (2007) found positive interactions between herbaceous vegetation and mangroves, proposing the former as facilitators of mangrove recolonization in disturbed areas by trapping propagules and increasing survival and growth by possible enhancement of edaphic physiochemical factors. This proposed facilitation was not part of our study. Seedling distribution and survival should be included in future studies.
Hartman (1988) found that after disturbances in tidal saline wetlands, regeneration is controlled by vegetative propagation due to the scarcity of a seed bank. Based on field observations and image visual interpretation, the moderate increase in D. ecastaphyllum shrub cover in a saline area was due to vegetative propagation (Francis, 2004). Our results suggest the importance of vegetative propagation under constant salinity stress.
After 16 months, a shift in vegetation cover was observed where species with long-lived, slow growth and low N content leaves (as in Laguncularia) had larger plant cover. WUE analysis seems to support these observations as species with higher WUE have higher chances of surviving and regrowing despite waterlogging or dry periods that intensify after hurricanes. High 15N values in the sampled species point toward a eutrophic system where high nutrient availability increases the system’s regeneration speed. Dalbergia is an exception because of the symbiotic relationship with nitrogen-fixing bacteria (Saur et al., 2000). Another aspect to consider in urban coastal wetlands after disturbances is the arrival of non-indigenous species. Bhattarai and Cronin (2014) argued that hurricanes bring non-indigenous species to the ecosystem. We did not find this in our study area reserve, as native species present outnumbers non-indigenous species. This can be credited to several factors, such as biotic resistance or environmental factors in urban wetlands (Ehrenfeld, 2008; Ackerman et al., 2016).
Hurricanes are a stress test to ecosystems where vegetation response will vary according to their severity (Lugo, 2000). The dynamic nature of coastal wetlands allows for resilience to stressors of different intensities. Hurricane María, an acute catastrophic stressor, severely affected the coastal wetland. Our results show that although the wetland was observably greatly affected initially, it was resilient in the continuous recovery of the vegetation cover despite the severity of the disturbance. How chronically stressed wetlands respond to catastrophic stressors will test the resiliency of these systems.
Conclusion and Recommendations
• Plant functional types proved to be resilient to the initial hurricane effect and subsequent changes in conductivity and freshwater conditions. Fast-slow continuum traits could help explain plant regeneration dynamics after a hurricane.
• High 15N values in the sampled species point toward a eutrophic system where high nutrient availability increases the system’s regeneration speed.
• Wetland vegetation cover had a high recovery rate without rehabilitation intervention. The succession dynamics and the hydrological conditions described in this study can help wetland managers prioritize rehabilitation (if necessary) efforts after disturbances.
• Future studies will expand how spatio-temporal conditions in the wetlands, sea-level rise, and extremes of precipitations and the degree and intensity of further atmospheric disturbances will affect long-term community dynamics.
Data Availability Statement
The raw data supporting the conclusions of this article will be made available by the authors, without undue reservation.
Author Contributions
EC and EH conceived and designed the study, analyzed the data, and wrote the manuscript. EH, SP-P, and GO-R field sampling and analysis. All authors contributed to the article and approved the submitted version.
Funding
This research was funded by the NSF CREST - Center for Innovation Research and Education in Environmental Nanotechnology (CIRE2N) HRD 1736093, NSF HRD 1806129, and the Center for Applied Tropical Ecology and Conservation (CATEC) of the University of Puerto Rico.
Conflict of Interest
The authors declare that the research was conducted in the absence of any commercial or financial relationships that could be construed as a potential conflict of interest.
Publisher’s Note
All claims expressed in this article are solely those of the authors and do not necessarily represent those of their affiliated organizations, or those of the publisher, the editors and the reviewers. Any product that may be evaluated in this article, or claim that may be made by its manufacturer, is not guaranteed or endorsed by the publisher.
Acknowledgments
The authors acknowledge the Center for Applied Tropical Ecology and Conservation (CATEC) for technical assistance. Lab coordinator Larry Díaz, undergraduate students Georgianna Carmona, Joanne Rodríguez, and others from the Process and Functions Ecosystem Lab assisted with field and lab work. The authors thank Hector Ruiz and Jorge Sabater for image collection and processing. El Corredor Del Yaguazo Inc., Pedro Carrión and personnel who assisted with fieldwork, and the University of Puerto Rico’s Environmental Sciences Department GIS Lab, and reviewers that helped improve the manuscript.
Footnotes
- ^ http://sweetgum.nybg.org/science/vh/
- ^ http://herbario.uprrp.edu/bol/
- ^ http://herbaria.plants.ox.ac.uk/bol/mapr
References
Acevedo-Rodríguez, P. (2005). Vines and Climbing Plants of Puerto Rico and the Virgin Islands. Washington, DC: Department of Botany, National Museum of Natural History.
Ackerman, J. D., Tremblay, R. L., Rojas-Sandoval, J., and Hernández-Figueroa, E. (2016). Biotic resistance in the tropics: patterns of seed plant invasions within an Island. Biol. Invasions 19, 315–328. doi: 10.1007/s10530-016-1281-4
Ball, M. C. (1980). Patterns of secondary succession in a mangrove forest of southern Florida. Oecologia 44, 226–235. doi: 10.1007/bf00572684
Ball, M. C., and Passioura, J. B. (1995). “Carbon gain in relation to water use: photosynthesis in mangroves,” in Ecophysiology of Photosynthesis. Vol. 100, eds E. D. Schulze and M. M. Caldwell (Berlin: Springer Study Edition). doi: 10.1007/978-3-642-79354-7_12
Bhattarai, G. P., and Cronin, J. T. (2014). Hurricane activity and the large-scale pattern of spread of an invasive plant species. PLoS One 9:e98478. doi: 10.1371/journal.pone.0098478
Branoff, B., Cuevas, E., and Hernández, E. (2018). Assessment of Urban Coastal Wetlands Vulnerability to Hurricanes in Puerto Rico. San Juan: DRNA. Available online at: http://drna.pr.gov/wp-content/uploads/2018/09/FEMA-Wetlands-Report.pdf
Buma, B. (2015). Disturbance interactions: characterization, prediction, and the potential for cascading effects. Ecosphere 6, 1–15. doi: 10.1890/es15-00058.1
Chapin, F. S., Bret-Harte, M. S., Hobbie, S. E., and Zhong, H. (1996). Plant functional types as predictors of transient responses of Arctic vegetation to global change. J. Veg. Sci. 7, 347–358. doi: 10.2307/3236278
Clark, R. L., and Csiro, J. C. (1988). A transition from mangrove forest to freshwater wetland in the Monsoon Tropics of Australia. J. Biogeogr. 15:665. doi: 10.2307/2845444
Cohen, M. C., Lara, R. J., Cuevas, E., Oliveras, E. M., and Da Silveira Sternberg, L. (2016). Effects of sea-level rise and climatic changes on mangroves from southwestern littoral of Puerto Rico during the middle and late holocene. Catena 143, 187–200. doi: 10.1016/j.catena.2016.03.041
Cowardin, L. M., V. Carter, Golet, F. C., and LaRoe, E. T. (1979). Classification of Wetlands and Deepwater Habitats of the United States. Washington, DC: U.S. Department of the Interior, Fish and Wildlife Service, 131.
Ehrenfeld, J. G. (2008). Exotic invasive species in urban wetlands: environmental correlates and implications for wetland management. J. Appl. Ecol. 45, 1160–1169. doi: 10.1111/j.1365-2664.2008.01476.x
Farquhar, G. D., Hubick, K. T., Condon, A. G., and Richards, R. A. (1989). “Carbon isotope fractionation and plant water-use efficiency,” in Stable Isotopes in Ecological Research. Ecological Studies (Analysis and Synthesis) Vol. 68, eds P. W. Rundel, J. R. Ehleringer, and K. A. Nagy (New York, NY: Springer). doi: 10.1007/978-1-4612-3498-2_2
Ferwerda, J. G., Ketner, P., and McGuinness, K. A. (2007). Differences in regeneration between hurricane damaged and clear-cut mangrove stands 25 years after clearing. Hydrobiologia 591, 35–45. doi: 10.1007/s10750-007-0782-7
Fickert, T. (2018). Better resilient than resistant—regeneration dynamics of storm-disturbed mangrove forests on the Bay Island of Guanaja (Honduras) during the first two decades after Hurricane Mitch (October 1998). Diversity 10:8. doi: 10.3390/d10010008
Francis, J. K. (2004). Wildland Shrubs of the United States and its Territories: Thamnic Descriptions. San Juan, PR: U.S. Department of Agriculture, Forest Service, International Institute of Tropical Forestry. doi: 10.2737/iitf-gtr-26
Gitelson, A. A., Kaufman, Y. J., Stark, R., and Rundquist, D. (2002). Novel algorithms for remote estimation of vegetation fraction. Remote Sens. Environ. 80, 76–87. doi: 10.1007/s12237-018-0396-5
Hartman, J. M. (1988). Recolonization of small disturbance patches in a new england salt marsh. Am. J. Bot. 75, 1625–1631. doi: 10.1002/j.1537-2197.1988.tb11239.x
Kennaway, T., and Helmer, E. H. (2007). The forest types and ages cleared for land development in Puerto Rico. GIScience Remote Sens. 44, 356–382. doi: 10.2747/1548-1603.44.4.356
Lambers, H., Stuart, C. F., and Pons, T. L. (2008). Plant Physiological Ecology. New York, NY: Springer New York.
Lugo, A. E. (2000). Effects and outcomes of Caribbean Hurricanes in a climate change scenario. Sci. Total Environ. 262, 243–251. doi: 10.1016/s0048-9697(00)00526-x
Lugo, A. E., Ramos, O., and Rodríguez, C. (2011). The Río Piedras Watershed and Its Surrounding Environment. FS-980, Vol. 46. Riìo Piedras, P.R: US Department of Agriculture, Forest Service, International Institute of Tropical Forestry, 980.
Martinuzzi, S., Gould, W. A., Lugo, A. E., and Medina, E. (2009). Conversion and recovery of Puerto Rican mangroves: 200 years of change. For. Ecol. Manage. 257, 75–84. doi: 10.1016/j.foreco.2008.08.037
McKee, K. L., Rooth, J. E., and Feller, I. C. (2007). Mangrove recruitment after forest disturbance is facilitated by herbaceous species in the Caribbean. Ecol. Appl. 17, 1678–1693. doi: 10.1890/06-1614.1
Medina, E., Cuevas, E., Popp, M., and Lugo, A. E. (1990a). Soil Salinity, sun exposure, and growth of acrostichum aureum, the mangrove fern. Bot. Gazette 151, 41–49. doi: 10.1086/337803
Medina, E., and Francisco, M. (1997). Osmolality and Δ13C of leaf tissues of mangrove species from environments of contrasting rainfall and salinity. Estuarine Coast. Shelf Sci. 45, 337–344. doi: 10.1006/ecss.1996.0188
Medina, E., Garcia, V., and Cuevas, E. (1990b). Sclerophylly and oligotrophic environments: relationships between leaf structure, mineral nutrient content, and drought resistance in tropical rain forests of the Upper Rio Negro Region. Biotropica 22:51. doi: 10.2307/2388719
Morton, R. A., and Barras, J. A. (2011). Hurricane impacts on coastal wetlands: a half-century record of storm-generated features from southern Louisiana. J. Coastal Res. 275, 27–43. doi: 10.2112/jcoastres-d-10-00185.1
Moser, K. F., Ahn, C., and Noe, G. B. (2009). The influence of microtopography on soil nutrients in created mitigation wetlands. Restoration Ecol. 17, 641–651. doi: 10.1111/j.1526-100x.2008.00393.x
Parida, A. K., and Jha, B. (2010). Salt tolerance mechanisms in mangroves: a review. Trees 24, 199–217. doi: 10.1007/s00468-010-0417-x
Pasch, R. J., Penny, A. B., and Berg, R. (2019). National Hurricane Center Tropical Cyclone Report: Hurricane María (AL152017). National Weather Service. Washington, DC: National Oceanic and Atmospheric Administration.
Pérez-Harguindeguy, N., Díaz, S., Garnier, E., Lavorel, S., Poorter, H., Jaureguiberry, P., et al. (2016). Corrigendum to: new handbook for standardised measurement of plant functional traits worldwide. Aust. J. Bot. 64:715. doi: 10.1071/bt12225_co
Perillo, G., Wolanski, E., Cahoon, D. R., and Hopkinson, C. S. (eds). (2019). Coastal Wetlands: An Integrated Ecosystem Approach. Amsterdam: Elsevier.
Poorter, H., and Remkes, C. (1990). Leaf area ratio and net assimilation rate of 24 wild species differing in relative growth rate. Oecologia 83, 553–559. doi: 10.1007/bf00317209
PRCCC (2014). “Puerto Rico climate change council (PRCCC) Puerto Rico’s state of the climate 2010-2013: assessing Puerto Rico’s social-ecological vulnerabilities in a changing climate,” in Puerto Rico Coastal Zone Management Program, Department of Natural and Environmental Resources, NOAA Office of Ocean and Coastal Resource Management, (San Juan: PRCCC).
Pumarada-O’Neill, L. (1991). Los Puentes Históricos de Puerto Rico. Mayagüez: Centro de Investigación y Desarrollo, Recinto de Mayagüez, Universidad de Puerto Rico, 1991.
Raoufat, M. H., Dehghani, M., Abdolabbas, J., Seyed, A. K., and Nazemossadat, M. J. (2020). Feasibility of satellite and drone images for monitoring soil residue cover. J. Saudi Soc. Agric. Sci. 19, 56–64. doi: 10.1016/j.jssas.2018.06.001
Salguero-Gómez, R. (2016). Applications of the fast–slow continuum and reproductive strategy framework of Plant Life Histories. New Phytol. 213, 1618–1624. doi: 10.1111/nph.14289
Saur, E., Carcelle, S., Guezennec, S., and Rousteau, A. (2000). Nodulation of legume species in wetlands of Guadeloupe (Lesser Antilles). Wetlands 20, 730–734. doi: 10.1672/0277-5212(2000)020[0730:nolsiw]2.0.co;2
Sharpe, J. M. (2009). Responses of the mangrove fern Acrostichum Danaeifolium LANGSD. & Fisch. (Pteridaceae, Pteridophyta) to disturbances resulting from increased soil salinity and Hurricane Georges at the Jobos Bay National Estuarine Research Reserve, Puerto Rico. Wetlands Ecol. Manage. 18, 57–68. doi: 10.1007/s11273-009-9148-4
Taylor, M. A. (2002). Influence of the tropical Atlantic versus the Tropical Pacific on Caribbean rainfall. J. Geophys. Res. 107:3127. doi: 10.1029/2001jc001097
Torres-Valcárcel, Á, Harbor, J., González-Avilés, C., and Torres-Valcárcel, A. (2014). Impacts of urban development on precipitation in the tropical maritime climate of Puerto Rico. Climate 2, 47–77. doi: 10.3390/cli2020047
Walter, H. (1971). Ecology of Tropical and Subtropical Vegetation. New York, NY: Van Nostrand Reinhold Company.
Keywords: urban wetlands, hurricanes, plant functional types, SUAV, Puerto Rico, coastal wetlands
Citation: Hernández E, Cuevas E, Pinto-Pacheco S and Ortíz-Ramírez G (2021) You Can Bend Me but Can’t Break Me: Vegetation Regeneration After Hurricane María Passed Over an Urban Coastal Wetland in Northeastern Puerto Rico. Front. For. Glob. Change 4:752328. doi: 10.3389/ffgc.2021.752328
Received: 02 August 2021; Accepted: 25 October 2021;
Published: 19 November 2021.
Edited by:
Luiz Drude Lacerda, Federal University of Ceara, BrazilReviewed by:
Ariel Lugo, International Institute of Tropical Forestry, Forest Service, United States Department of Agriculture (USDA), United StatesLuis Ernesto Arruda Bezerra, Instituto de Ciências do Mar, Brazil
Copyright © 2021 Hernández, Cuevas, Pinto-Pacheco and Ortíz-Ramírez. This is an open-access article distributed under the terms of the Creative Commons Attribution License (CC BY). The use, distribution or reproduction in other forums is permitted, provided the original author(s) and the copyright owner(s) are credited and that the original publication in this journal is cited, in accordance with accepted academic practice. No use, distribution or reproduction is permitted which does not comply with these terms.
*Correspondence: Elix Hernández, ZWxpeC5oZXJuYW5kZXpAdXByLmVkdQ==