
94% of researchers rate our articles as excellent or good
Learn more about the work of our research integrity team to safeguard the quality of each article we publish.
Find out more
ORIGINAL RESEARCH article
Front. For. Glob. Change , 23 November 2021
Sec. Forest Growth
Volume 4 - 2021 | https://doi.org/10.3389/ffgc.2021.716278
This article is part of the Research Topic Understanding Patterns and Mechanisms of Forest Canopy Diversity and Ecosystem Functions in a Changing World View all 12 articles
Ecological networks are commonly applied to depict general patterns of biotic interactions, which provide tools to understand the mechanism of community assembly. Commensal interactions between epiphytes and their hosts are a major component of species interactions in forest canopies; however, few studies have investigated species assemblage patterns and network structures of epiphyte–host interactions, particularly non-vascular epiphytes in different types of forest. To analyze the characteristics of network structures between epiphytes and their hosts, composition and distribution of epiphytic bryophytes were investigated from 138 host individuals using canopy cranes in a tropical lowland seasonal rain forest (TRF) and a subtropical montane moist evergreen broad-leaved forest (STF), in Southwest China. We structured binary networks between epiphytic bryophytes and their hosts in these two forests, which presented 329 interactions in the TRF and 545 interactions in the STF. Compared to TRF, the bryophyte–host plant networks were more nested but less modular in the STF. However, both forests generally exhibited a significantly nested structure with low levels of specialization and modularity. The relatively high nestedness may stabilize the ecological networks between epiphytic bryophytes and their hosts. Nevertheless, the low modularity in epiphyte–host networks could be attributed to the lack of co-evolutionary processes, and the low degree of specialization suggests that epiphytes are less likely to colonize specific host species. Vertical distribution of the bryophyte species showed structured modules in the tree basal and crown zones, probably attributing to the adaptation to microclimates within a host individual. This study highlights the nested structure of commensal interaction between epiphytic bryophytes and host trees, and provides a scientific basis to identify key host tree species for conservation and management of biodiversity in forest ecosystems.
Human disturbance and climate change induce a severe biodiversity crisis, which not only directly leads to species extinction, but also indirectly causes community collapse as species co-extinction through interspecific interactions. Hence, biotic interactions remain a core theme to understand the general mechanisms of community assembly and disassembly in order to scientifically guide biodiversity conservation and restoration (Taylor et al., 2016; Naranjo et al., 2019).
Ecological networks provide a powerful tool to elucidate complex interspecific interactions in different types of communities (Borrett et al., 2014; Landi et al., 2018). There is a long tradition of describing ecological networks in bipartite models which generate simple binary interaction matrices (Blick and Burns, 2009; Gruber et al., 2009; Arthur, 2020). In addition to depicting the interactions among species, quantitative descriptions of network properties are possible to explore the process of colonization during successions (Fontaine et al., 2011; Peralta, 2016) and to predict community stability under disturbance in the future (Vizentin-Bugoni et al., 2019; Baumgartner, 2020). Many empirical studies have uncovered different network patterns, such as resource–consumer networks (Welti and Joern, 2015; Costa et al., 2021), plant–pollinator networks, plant–seed disperser networks (Veron et al., 2018; Stein et al., 2021), as well as commensal networks in the last decade (Sayago et al., 2013; Francisco et al., 2018). However, the ecological processes and underlying causes that drive the network structure are still under debate (Bluethgen, 2010; Calatayud et al., 2017; Landi et al., 2018; Pinheiro et al., 2019). Much effort is required to understand general structures of interaction networks and to clarify the underlying mechanisms that mediate ecological networks.
Epiphytes constitute a large part of the global plant biodiversity and provide a unique component in forest ecosystems (Nieder et al., 2001; Song et al., 2015b; Toivonen et al., 2017). Since the survival and growth of epiphytes mainly depend on their host plants, studies on the patterns and mechanisms of commensal interactions between epiphytes and host trees are essential to understand the diversity of epiphytic communities. So far, some patterns of epiphyte–host interaction networks have been reported in different forest ecosystems such as a nested structure, low connectance, low degree of specialization, and low modularity (Francisco et al., 2019; Naranjo et al., 2019; Fontúrbel et al., 2021). The mechanisms behind network patterns of epiphyte species and their host plants are poorly understood, although non-random processes seem to be recognized in shaping the structure of epiphyte networks (Fontúrbel et al., 2021). Furthermore, epiphyte–host network studies are often restricted to communities in a single forest type (e.g., boreal forest, temperate forest, subtropical or tropical forest) and/or in specific vascular epiphyte groups (e.g., orchids) (Zhao et al., 2015; Ceballos et al., 2016; Francisco et al., 2018, 2019). Although the database EpIG-DB has integrated existing data on epiphyte assemblages at the continental scale (Mendieta-Leiva et al., 2020), we are still in the process of establishing general knowledge about the epiphyte–host networks among all epiphyte groups in different forest types.
Epiphytes attached to host trees are more sensitive to changes in humidity, light and temperature in different habitat environments (Coyle, 2017). On the one hand, climate differences at a regional scale act as environmental filters to constraint epiphyte community assembly. For example, the typical elevational changes in epiphyte species composition were found to be explained by humidity gradients, as species richness showed mid-elevational peaks which corresponded to humidity gradients (Song et al., 2015a; Quiel and Zotz, 2021). A study from the temperate oceanic climate zone of Western Europe revealed that annual rainfall and average temperature gradients are responsible for the frequency and abundance of epiphytes (Klinghardt and Zotz, 2021). On the other hand, host attributes such as bark texture (Zarate-Garcia et al., 2020), tree size (Francisco et al., 2018) and species richness (Calatayud et al., 2017) are the important factors which may affect the biodiversity of epiphyte community in forest stands.
Additionally, microclimatic gradients on individual host trees provide a range of different conditions for epiphyte assembly from the tree base to upper canopy (de Oliveira and de Oliveira, 2016). It has been reported that more bryophyte species occurred in the tree crowns than the trunks and base zones in subtropical forests and tropical forests (Shen et al., 2018). Humidity, temperature and light incidence are the main microclimate factors determining growth and survival of epiphytes at different vertical zones that contribute to the variation in species composition and development of epiphyte species in forests (Padilha et al., 2017). Although numerous studies suggested that the epiphyte species distribute along vertical microclimatic gradients on host individuals (Zotz, 2007; Li et al., 2015), epiphyte–host network structures along different vertical zones have rarely been studied (but see Francisco et al., 2019).
Here, we investigated epiphytic bryophytes and their hosts using the canopy cranes in the tropical and the subtropical forests in Yunnan, Southwest China. The preceding study by Shen et al. (2018) investigated the vertical composition and distributions of epiphytic bryophytes in the same study sites, but our study re-analyzed the data by constructing commensal networks of bryophyte–host interactions and quantified network properties using six network metrics. In this study, we aim to (a) characterize the structures of the epiphytic bryophyte–host networks, (b) assess the roles of forest types, host traits, and vertical zonation in structuring the bryophyte–host networks. Based on previous knowledge, we hypothesize that networks present a nested structure with low level of modularity, and bryophyte species attached on the base and crown zones are grouped into different modules. We also hypothesize that occurrence of higher bryophyte diversity is more likely in the humid subtropical forest than in the monsoonal tropical forest; and the host size and abundance are two main drivers of epiphytic community structure.
This study was conducted at the two canopy crane sites located in the southwest of China. While these two sites are only 330 km apart, the climate and the forest canopy composition are different (Shen et al., 2018). One site is situated in the tropical lowland seasonal rain forest (hereafter referred to as TRF) of Bubeng within Xishuangbanna National Nature Reserve (101°35′E, 21°37′N), at an elevation of around 700 m a.s.l. Mean annual temperature and mean annual precipitation of this region are 21.0°C and 1,532 mm, respectively. The vegetation in the TRF is dominated by Parashorea chinensis (Lan et al., 2012). The other site is the subtropical montane moist evergreen broad-leaved forest (hereafter referred to as STF) of Xujiaba within Ailao Mountain National Nature Reserve (101°01′E, 24°32′N), at an elevation of around 2,420 m a.s.l. Mean annual temperature is 11.6°C, and mean annual precipitation is 1,859 mm (Song et al., 2015b). The vegetation in the STF is dominated by Castanopsis rufescens (Shen et al., 2018). In both sites, rainy season occurs from May to October, and dry season between December and April (Li et al., 2011).
At each site, the canopy crane is established in the primary forest, covering an area of approximately 1 ha. Within this area, we conducted fieldwork during the dry season from October 2016 to April 2017. Both forests can be vertically divided into three tree layers: a canopy layer of trees (> 30 m in the TRF; > 25 m in the STF), a subcanopy layer (16–30 m in the TRF; 16–25 m in the STF) and an understory layer (6–16 m in both TRF and STF). A total of 69 target trees, with a diameter at breast height (DBH) greater than 3 cm, were selected randomly in each forest until we obtain a total of 14 tree species. We recorded host tree characteristics such as species identity, height, and DBH (Supplementary Tables 1, 2). Considering micro-climatic variations along the vertical gradient on the host trees, epiphytic bryophytes were sampled from several vertical zones set for each tree according to its height: we subdivided the height of the trees into six vertical zones (Z1-6) for canopy trees and four vertical zones (Z1-4) for sub-canopy and understory trees. Samples were taken using frame quadrats (20 cm × 20 cm for large branches, 80 cm × 5 cm for small branches) and taking an estimated total of 400 cm2 of twigs in each vertical zone of the host tree by a ladder and canopy sampling techniques such as a telescopic tool and the canopy crane. Owing to the differences in tree size, the number of quadrat repeats varied from 4 to 6; hence, the total area sampled per vertical segment of each host tree ranged from 1,600 to 2,400 cm2. Detailed investigation methods are described in Shen et al. (2018).
As most epiphytic bryophytes are spore plants with asexual reproduction that restricted us to count the number of individuals, we recorded the presence and absence of epiphytic bryophyte species in binary matrices. To describe the interaction between epiphytic bryophytes (in rows) and host trees (in columns), we constructed the bipartite matrices, in which the cell with the number 0 or 1, respectively, represents absence or presence of epiphytic bryophyte species as observed on each host tree species. Based on the matrix data, we developed a bipartite graph whose nodes represent bryophyte species (top) and tree species (bottom) (Guimera et al., 2007). Links represent observed interactions when at least one individual of an epiphyte species was found on at least one individual of a host tree species (Gruber et al., 2009; Burns and Zotz, 2010). Similarly, to test the modularity structure across the vertical zones, the frequency-weighted matrices were constructed using the occurrence of bryophyte species (in rows) across vertical zones (in columns).
Network statistics were used to describe the structure of the epiphytic bryophyte–host networks. The following metrics were chosen: vulnerability, generality, connectance (C), nestedness (NODF), and modularity (Q). Vulnerability and generality represent the average number of species that forms links with another group. Connectance (C) measures network complexity (Heleno et al., 2012), corresponding to the number of actual links in relation to the number of theoretically possible links with the value varying from 0 (without interaction) to 1 (all species linked to each other) (Dunne et al., 2002). Nestedness was examined by NODF (the nestedness metric based on overlap and decreasing fill), which varies from 0 (when there is no nesting) to 100 (indicating maximum nesting) (Almeida-Neto et al., 2008). Modularity was analyzed with the Q index, ranging from 0, where the community has no more links within modules than expected by chance, to a maximum value of 1 (Barber, 2007; Arthur, 2020). Modularity was further analyzed using standardized, within-module connectivity (z) and among-module connectivity (c) coefficients proposed by Guimera et al. (2005). These values are calculated for each species to represent how well the species is connected to others within (z) and outside (c) its modular networks. According to the threshold values of z (2.5) and c (0.62) for binary networks, species were divided into four roles: peripheral species (z ≤ 2.5 and c ≤ 0.62); connectors (z ≤ 2.5 and c > 0.62); module hubs (z > 2.5 and c < 0.62); and network hubs (z > 2.5 and c > 0.62) (Olesen et al., 2007). Peripherals tend to form a few interactions within a module and rarely any to other modules, in contrast, connectors play an important role in network coherence by connecting modules together. Module hubs play the role of hubs with many links, most of which are in their own modules, whereas network hubs play the roles of connectors and module hubs simultaneously (Dormann and Strauss, 2014; Ines Borthagaray et al., 2018).
Species accumulation curves were plotted by Shen et al. (2018) to evaluate sampling completeness, showing that curves approached their asymptotes. We generated histograms that showed the proportion of epiphytic bryophyte species attached to the given number of host tree species.
Using simple linear models, we checked whether the increase in the number of individuals of each host species was positively related to the bryophyte species richness. We then analyzed whether the bryophyte species richness on individual trees vary with tree size, as we predicted that the species richness would increase with tree height and DBH.
The statistical significance of observed network metrics was tested using the null model that generated 1,000 random networks in which the number of nodes and interactions are given by the observed networks (Barber, 2007). Data analyses were performed using software R version 4.0.2. All network statistics were calculated and visualized with the “bipartite” package (Gruber et al., 2009) except for the modularity metrics which were analyzed by the “igraph” package (Csardi and Nepisz, 2006).
In total, we recorded 85 and 100 epiphytic bryophyte species in the TRF and STF, respectively (Supplementary Tables 3, 4). The number of interaction links was lower in the TRF (329 links) than STF (545) (Figure 1). The largest number of bryophyte species was recorded on Parashorea chinensis (61 species) in the TRF, and Castanopsis rufescens (70) in the STF. Plagiochila parvifolia was the only bryophyte species recorded on all host species in the TRF, whereas five species, Plagiochila assamica, Porella oblongifolia, Wijkia deflexifoia, Sinskea phaea, and Herbertus aduncus, were attached to all host tree species in the STF. Similar proportions of bryophyte species (25% in the TRF and 21% in the STF) were recorded on only one tree species in both forests (Figure 2).
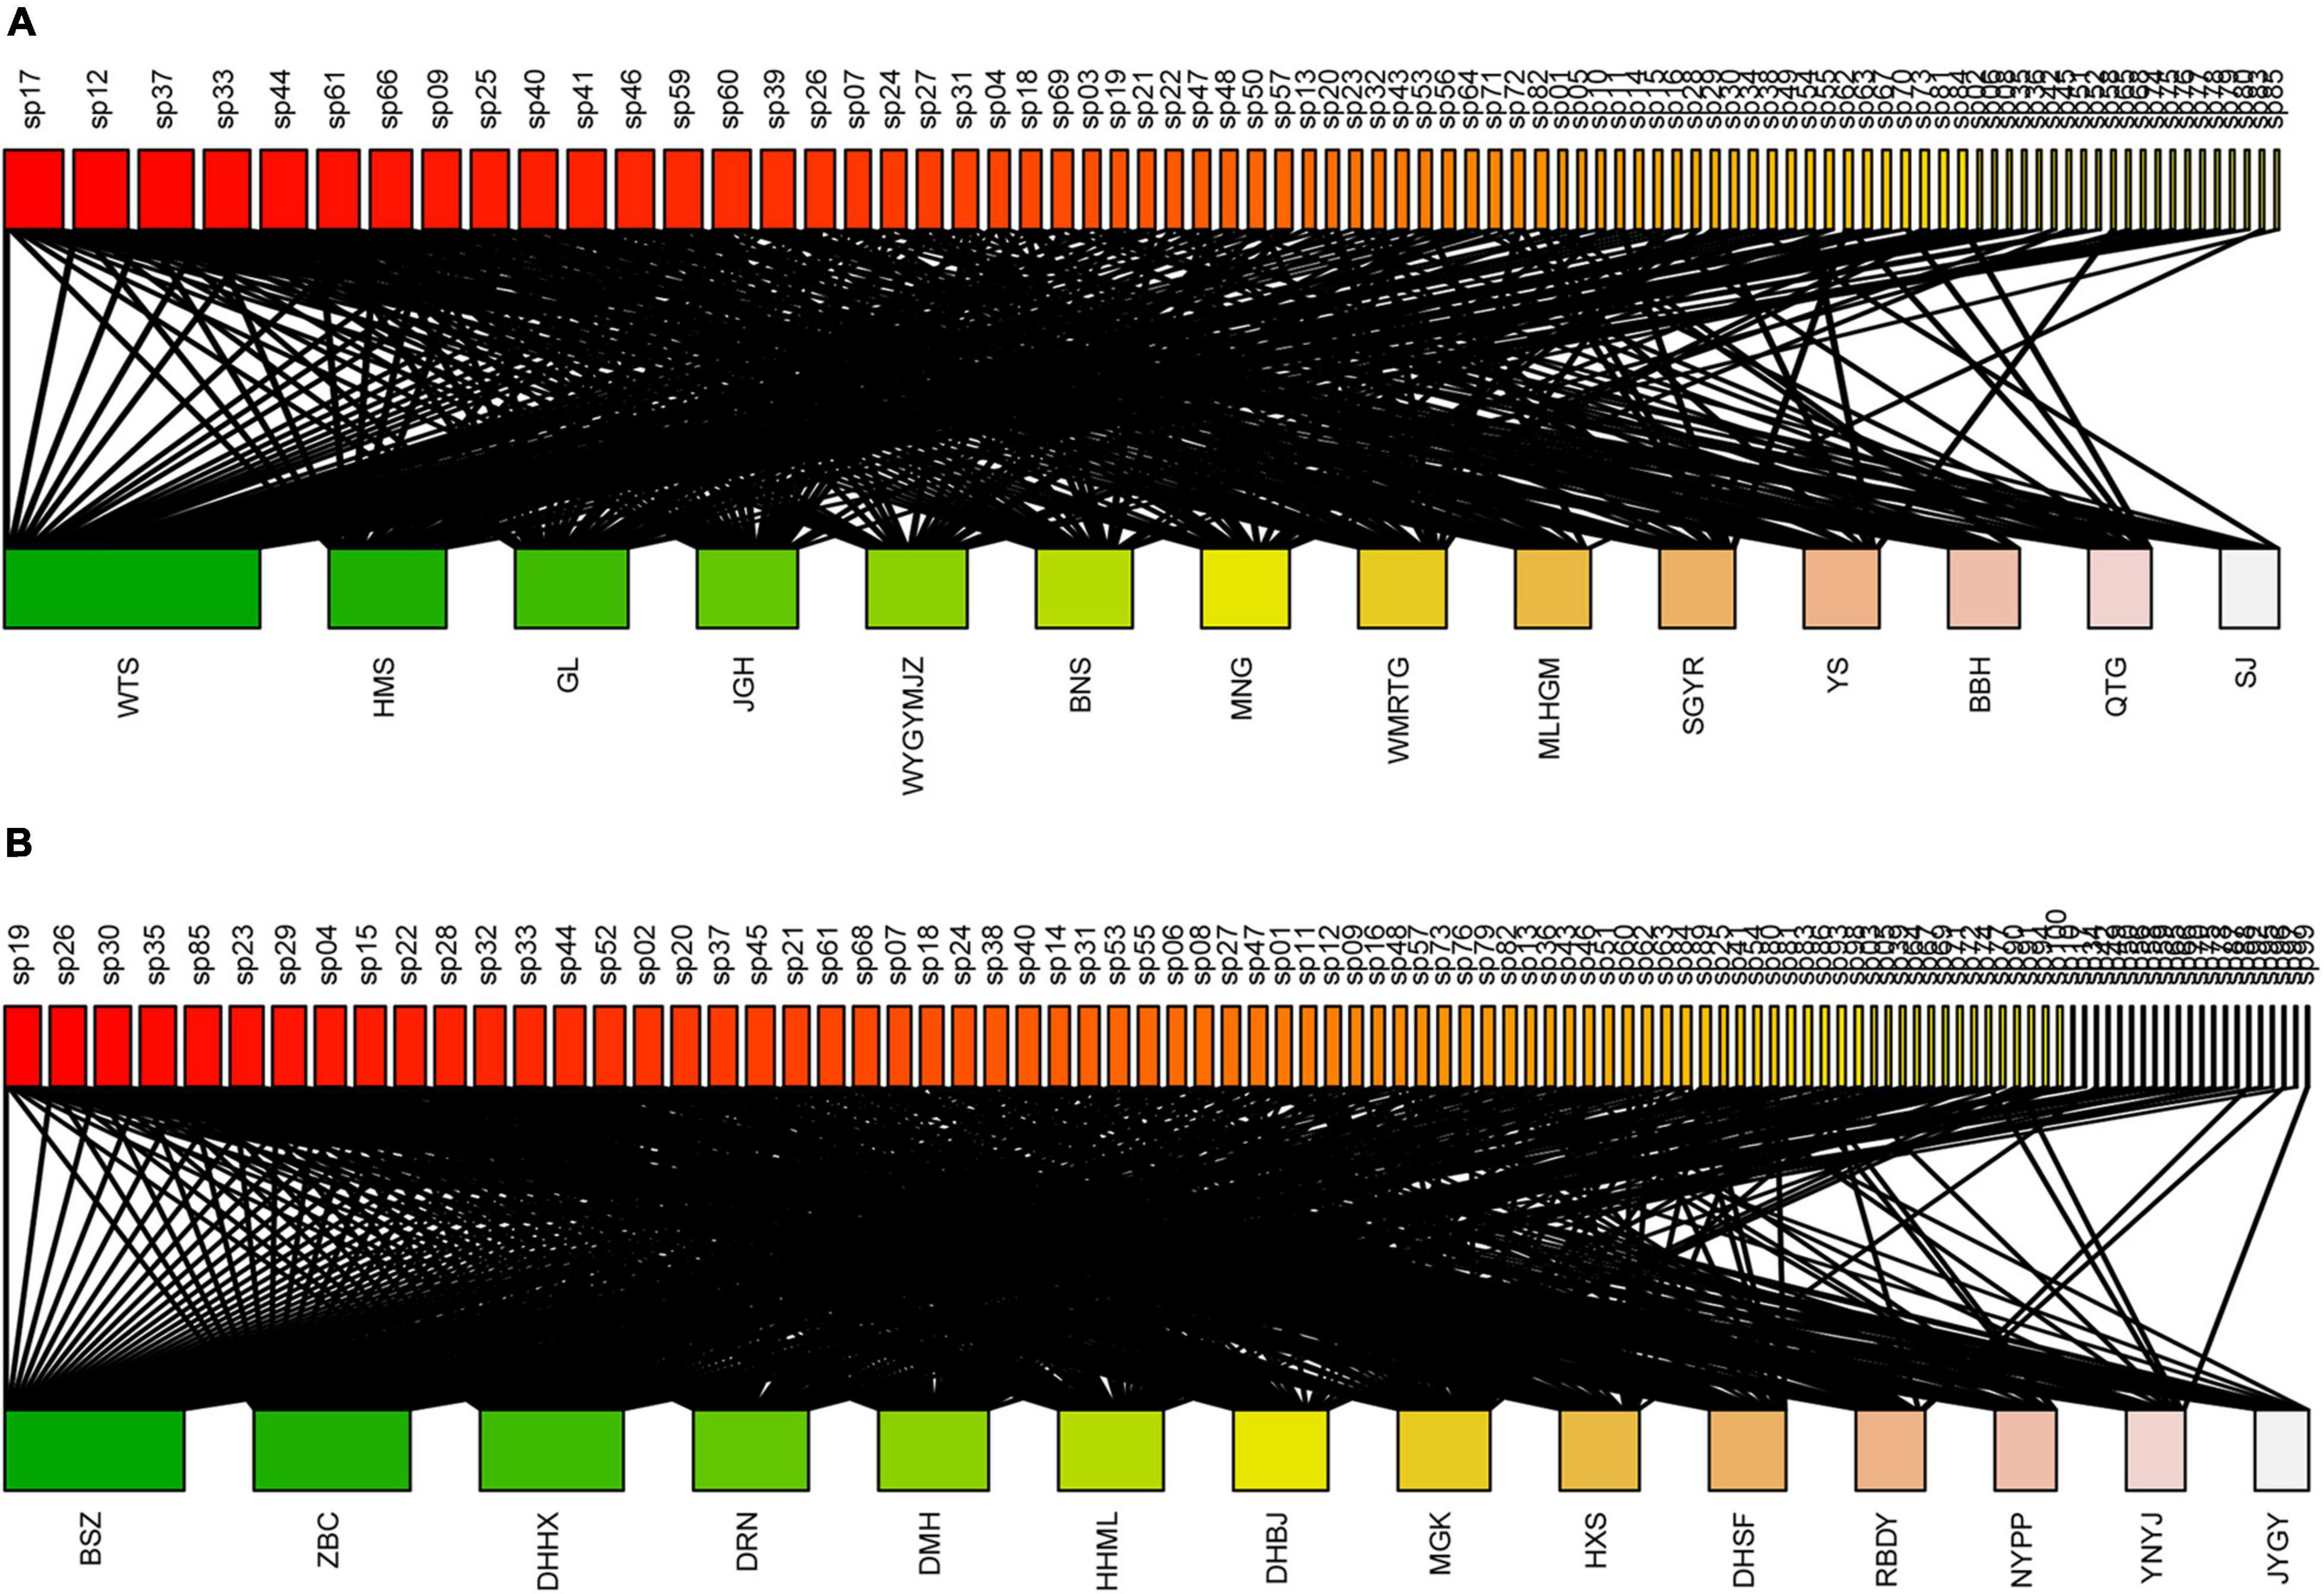
Figure 1. The bipartite epiphytic bryophyte–host tree networks of the (A) tropical lowland seasonal rain forest (TRF) and (B) subtropical montane moist evergreen broad-leaved forest (STF). For each network, epiphytic bryophytes are displayed as rectangles at the top, and the host trees are shown as rectangles at the bottom of each bipartite graph. The width of the rectangles represents the number of links for each species. Black links indicate observed interactions between epiphytic bryophytes and hosts. The label added to each rectangle refers to the species codes of epiphytic bryophytes and trees. The names of species and corresponding species codes are provided in Supplementary Tables 1–4.
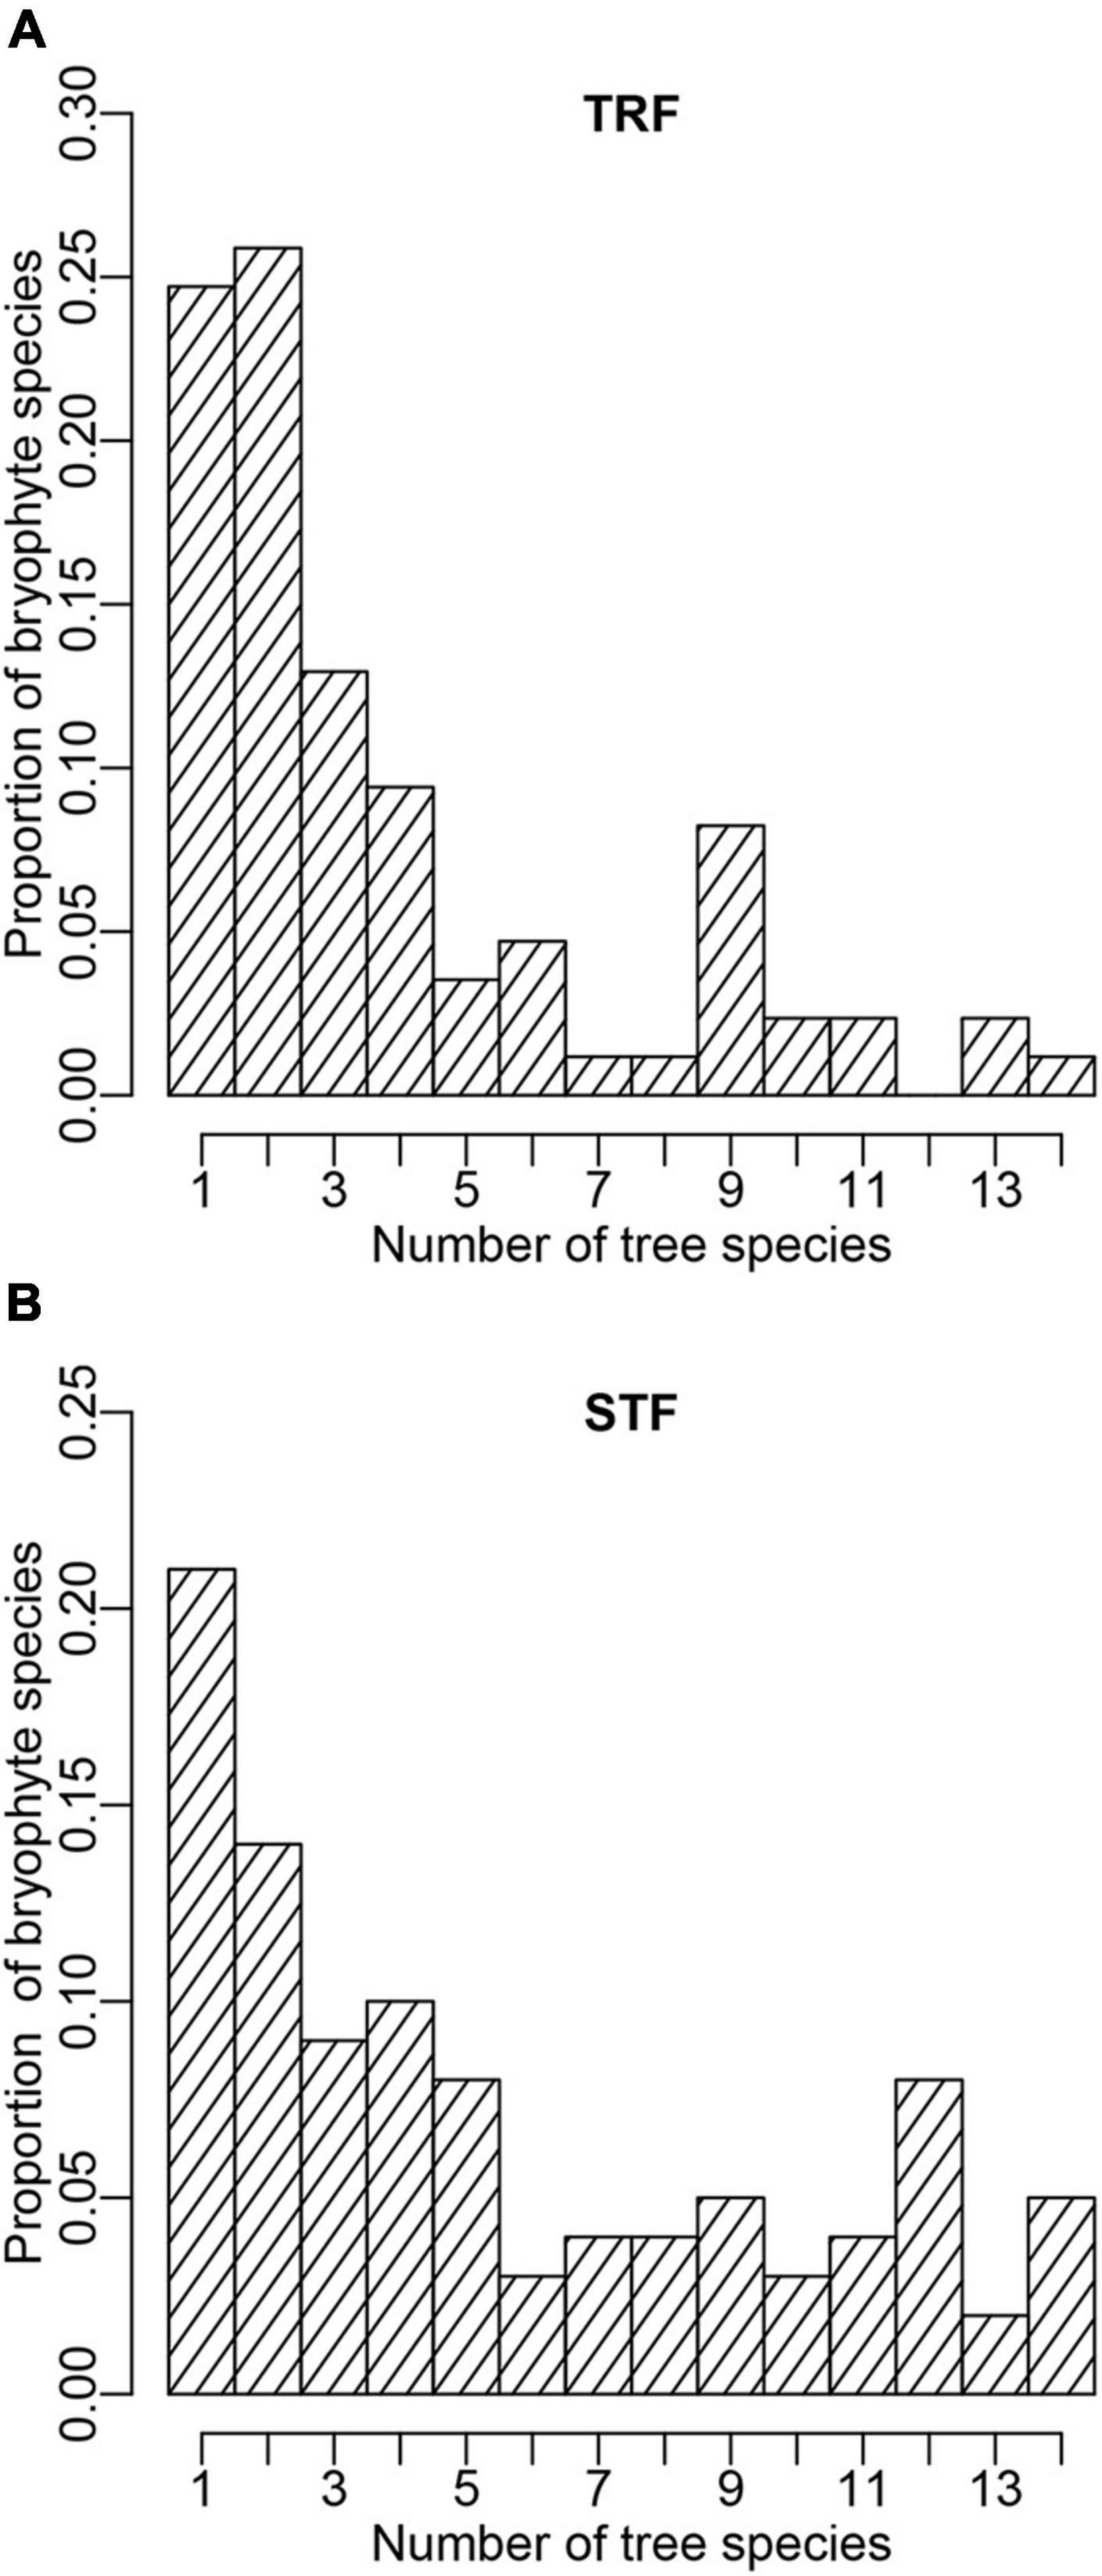
Figure 2. Probability distribution structure of epiphytic bryophyte species attached to tree species in the (A) tropical lowland seasonal rain forest (TRF) and (B) subtropical montane moist evergreen broad-leaved forest (STF). The X-axis presents the number of tree species to which a bryophyte species attaches; the Y-axis presents the proportion of bryophyte species that can attach to given number of tree species.
Species interaction networks in both TRF and STF showed low levels of connectance and low levels of specialization (Table 1). In the TRF, epiphytic bryophytes interacted, on average, with 6.70 host tree species (representing the degree of generality), and host tree species interacted with 29.10 epiphyte species (vulnerability). In the STF, the value of generality and vulnerability were 9.07 and 43.21, respectively. The networks in the TRF and STF displayed significantly nested structure (Table 1) and presented low modularity with six modules in the TRF (Q = 0.030, P < 0.001, Table 1) and also six modules in the STF (Q = 0.003, P < 0.001) (Figure 3). Surprisingly, the values of all other metrics, except for modularity (Q), were higher in the STF than in the TRF (Table 1). Across the vertical zones of host trees, epiphytic bryophytes formed four modules in the TRF and three modules in the STF (Figure 4). In both forests, bryophyte species typically attached on the base and crown of hosts were grouped into different modules.
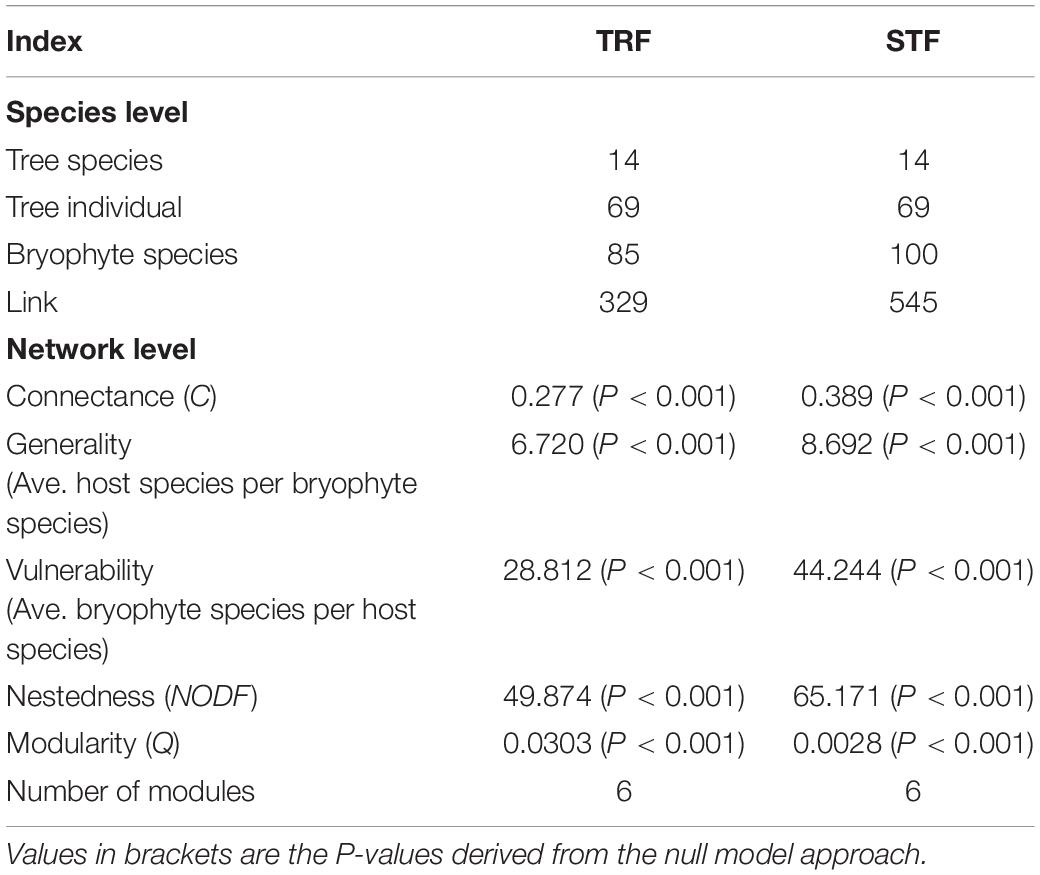
Table 1. Species-level and network-level indices in the subtropical montane moist evergreen broad-leaved forest (STF) and tropical lowland seasonal rain forest (TRF).
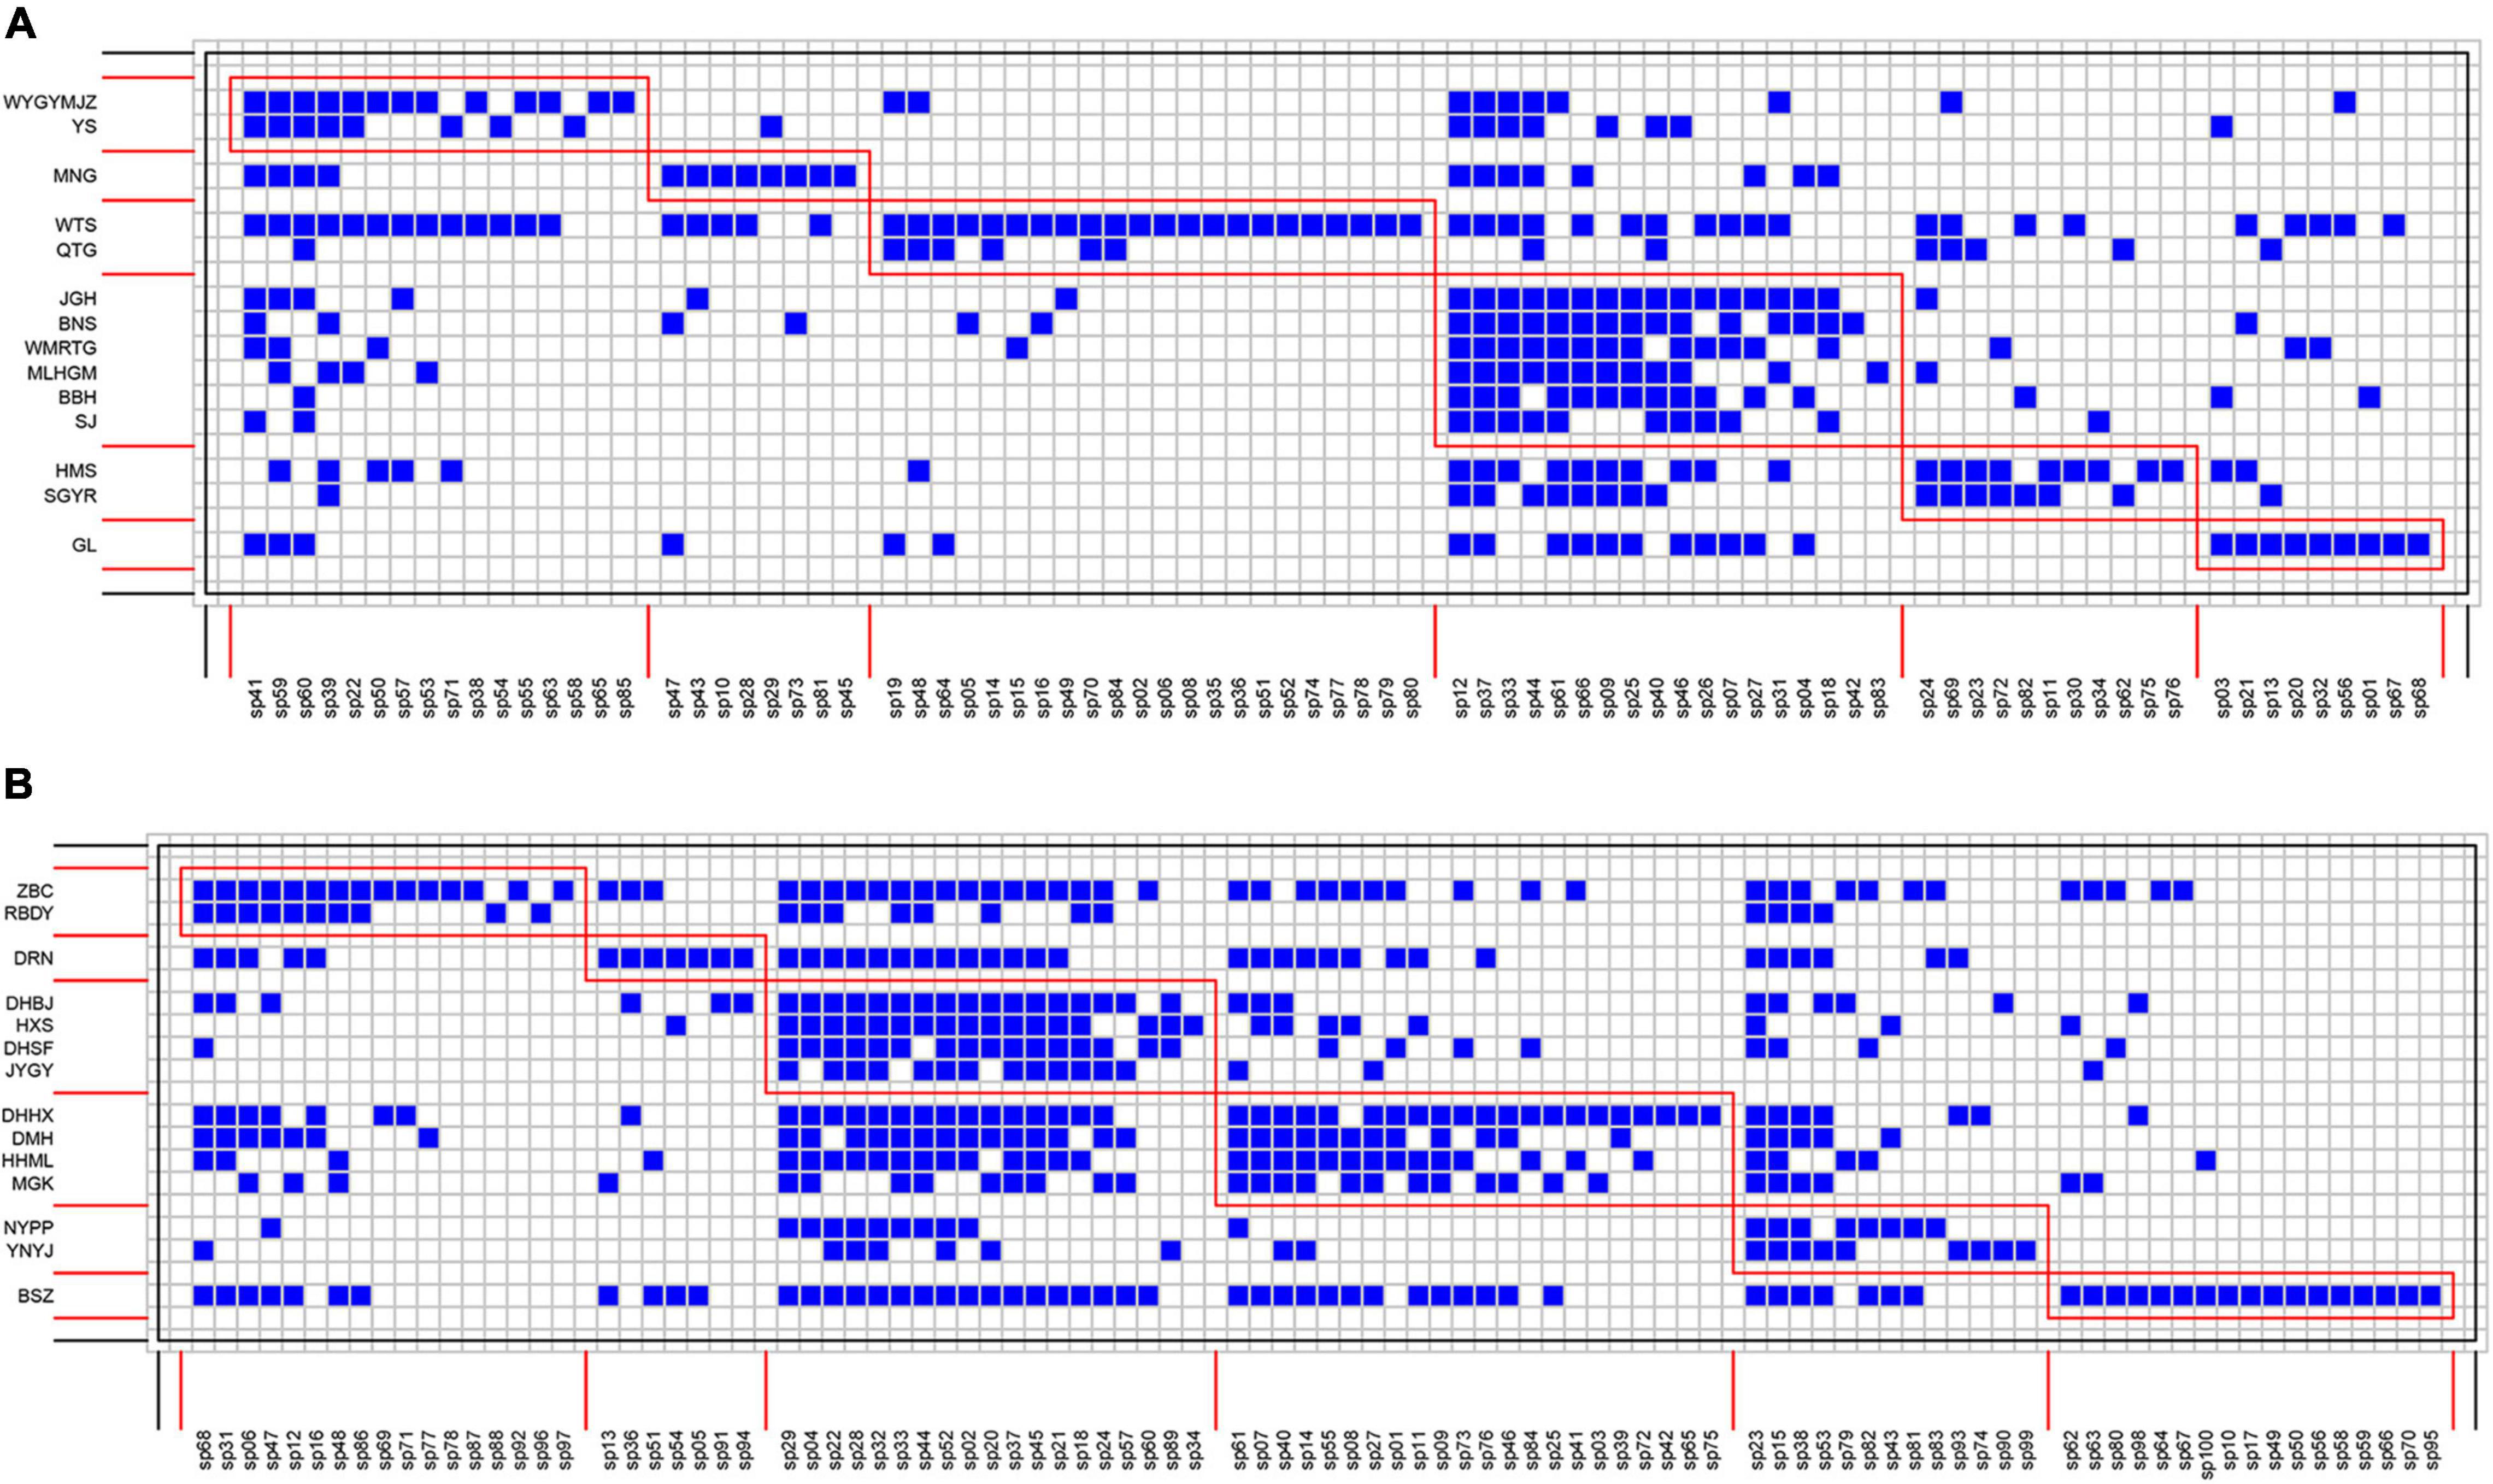
Figure 3. Interaction matrices featuring modules (red boxes) of bryophyte–host tree networks in the (A) tropical lowland seasonal rain forest (TRF) and (B) subtropical montane moist evergreen broad-leaved forest (STF). Species are sorted according to their modular affinity, showing tree species as rows and bryophyte species as columns. Each blue square indicates the presence of an interaction between bryophyte and their host species. Red boxes delineate the six modules in TRF (A) and in STF (B).
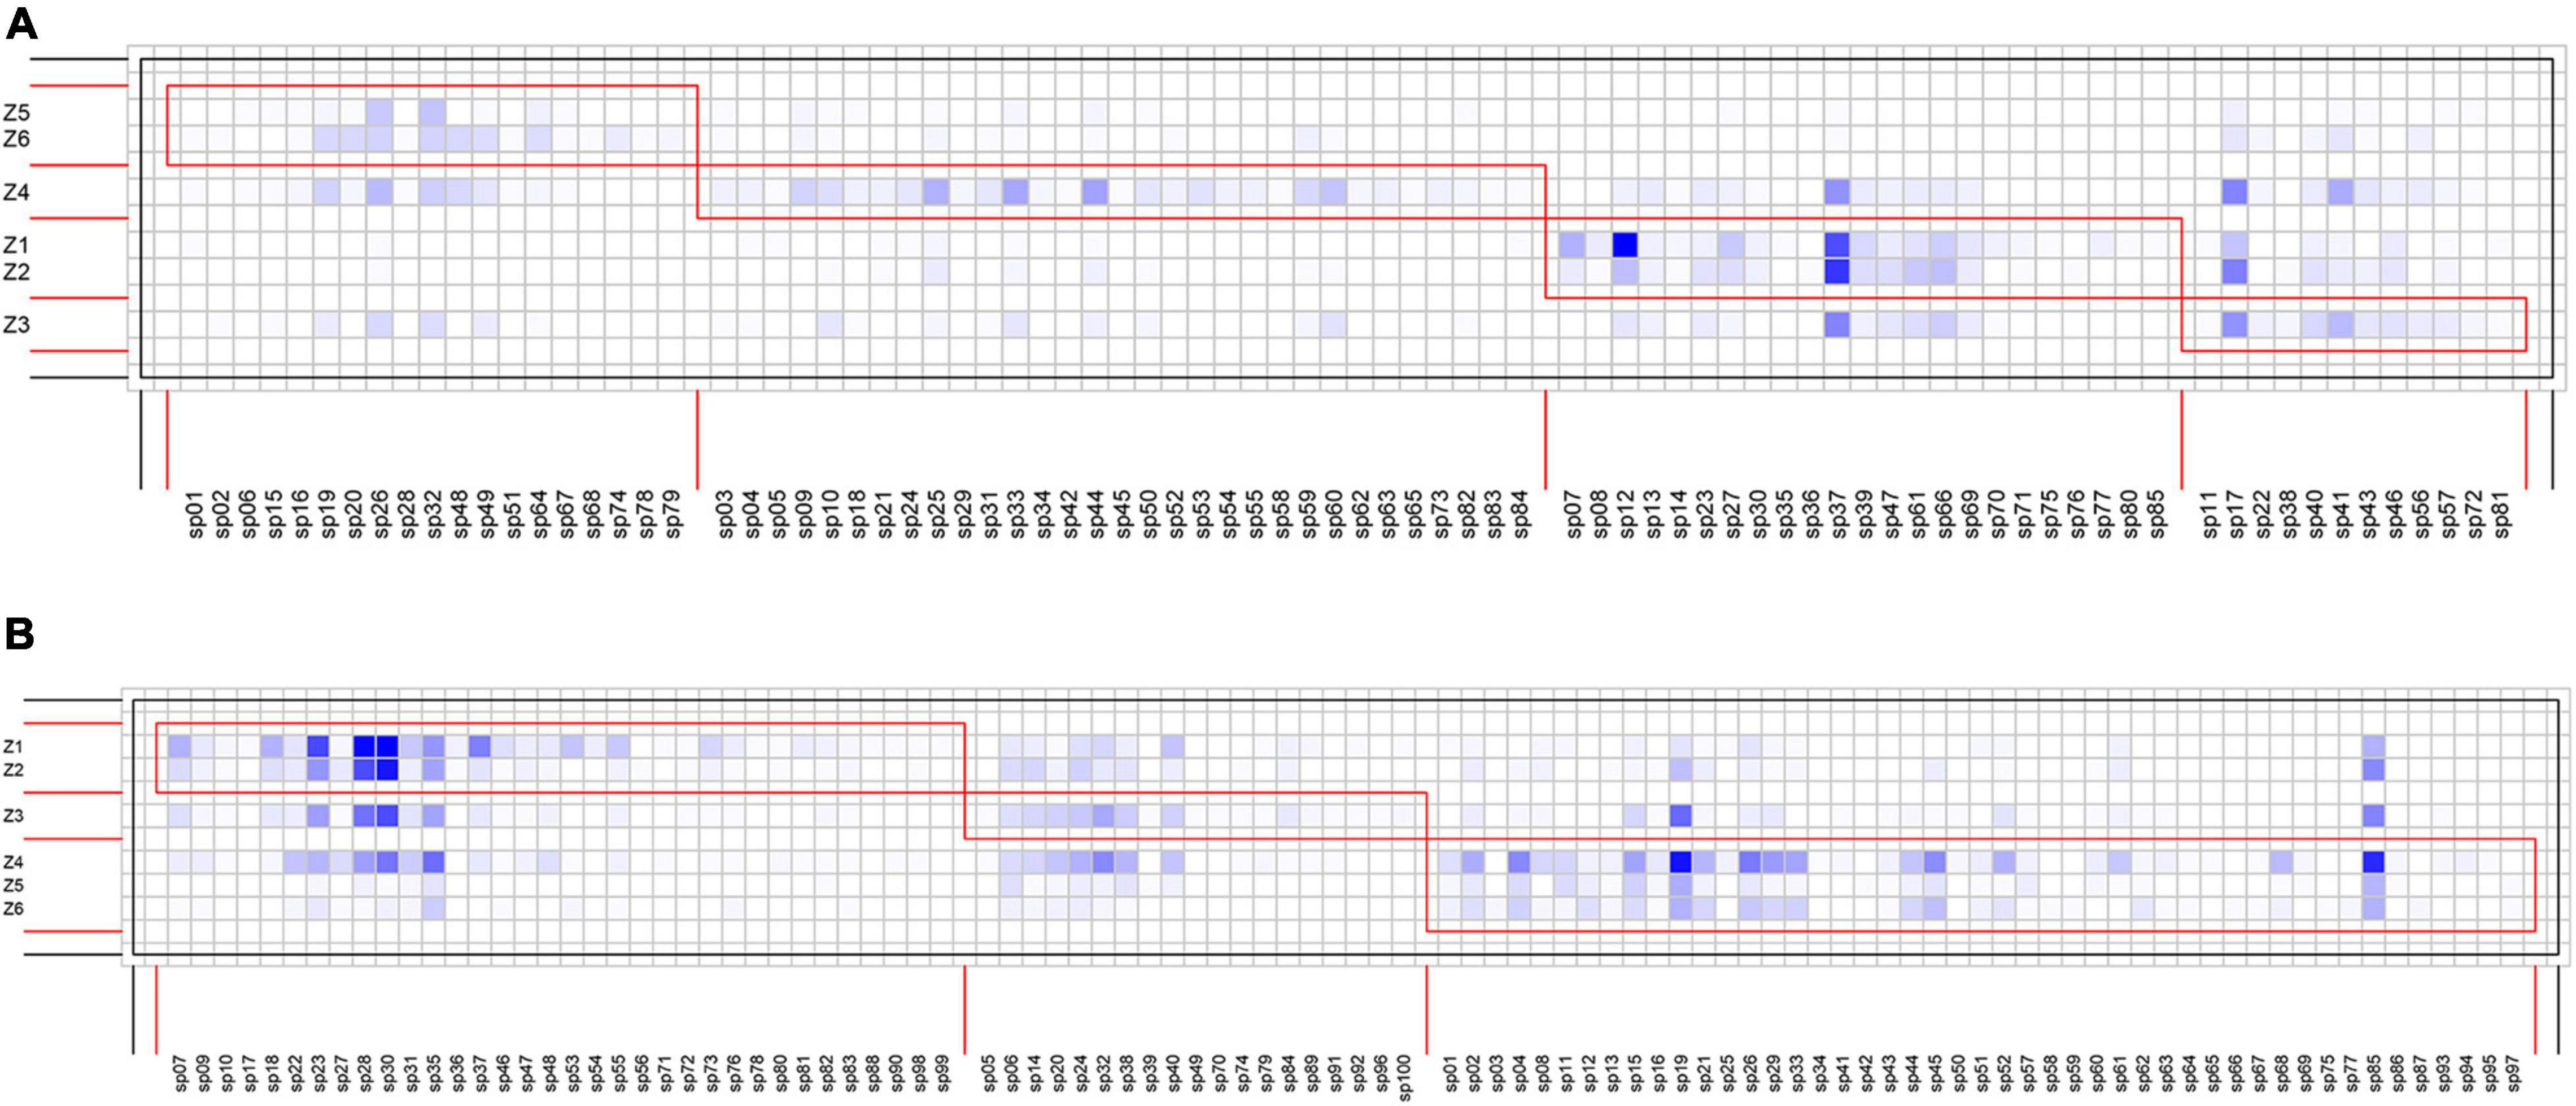
Figure 4. Interaction matrices featuring modules (red boxes) of epiphytic bryophytes according to affinity with the vertical zones of the host trees. Tree vertical zones are shown as rows and bryophyte species as columns. Square cells in the darker blue color indicate more frequent interactions. (A) Four modules are detected in the tropical lowland seasonal rain forest (TRF), whereas (B) three modules are detected in the subtropical montane moist evergreen broad-leaved forest (STF).
In the TRF, c-values ranged between 0 and 0.71 (with 13 of 85 bryophytes and 2 of 14 tree species exceeding the threshold of 0.62), and z-values range between −1.67 and 2.12 (no species exceeding the value of 2.5). In the STF, c-values range between 0 and 0.78 (with 41 of 100 bryophytes and 9 of 14 tree species exceeding the threshold of 0.62), and z-values range between −2.33 and 1.61 (no species exceeding the value of 2.5). Both networks in this study represented the lack of species representing module and network hubs (z > 2.5). Five tree species (Elaeocarpus japonicus, Vaccinium duclouxii, Castanopsis rufescens, Machilus bombycine, and Illicium macranthum) in the STF can be considered as peripheral species, while Pseuduvaria indochinensis and Drypetes hoaensis are the connector species in the TRF (Figure 5).
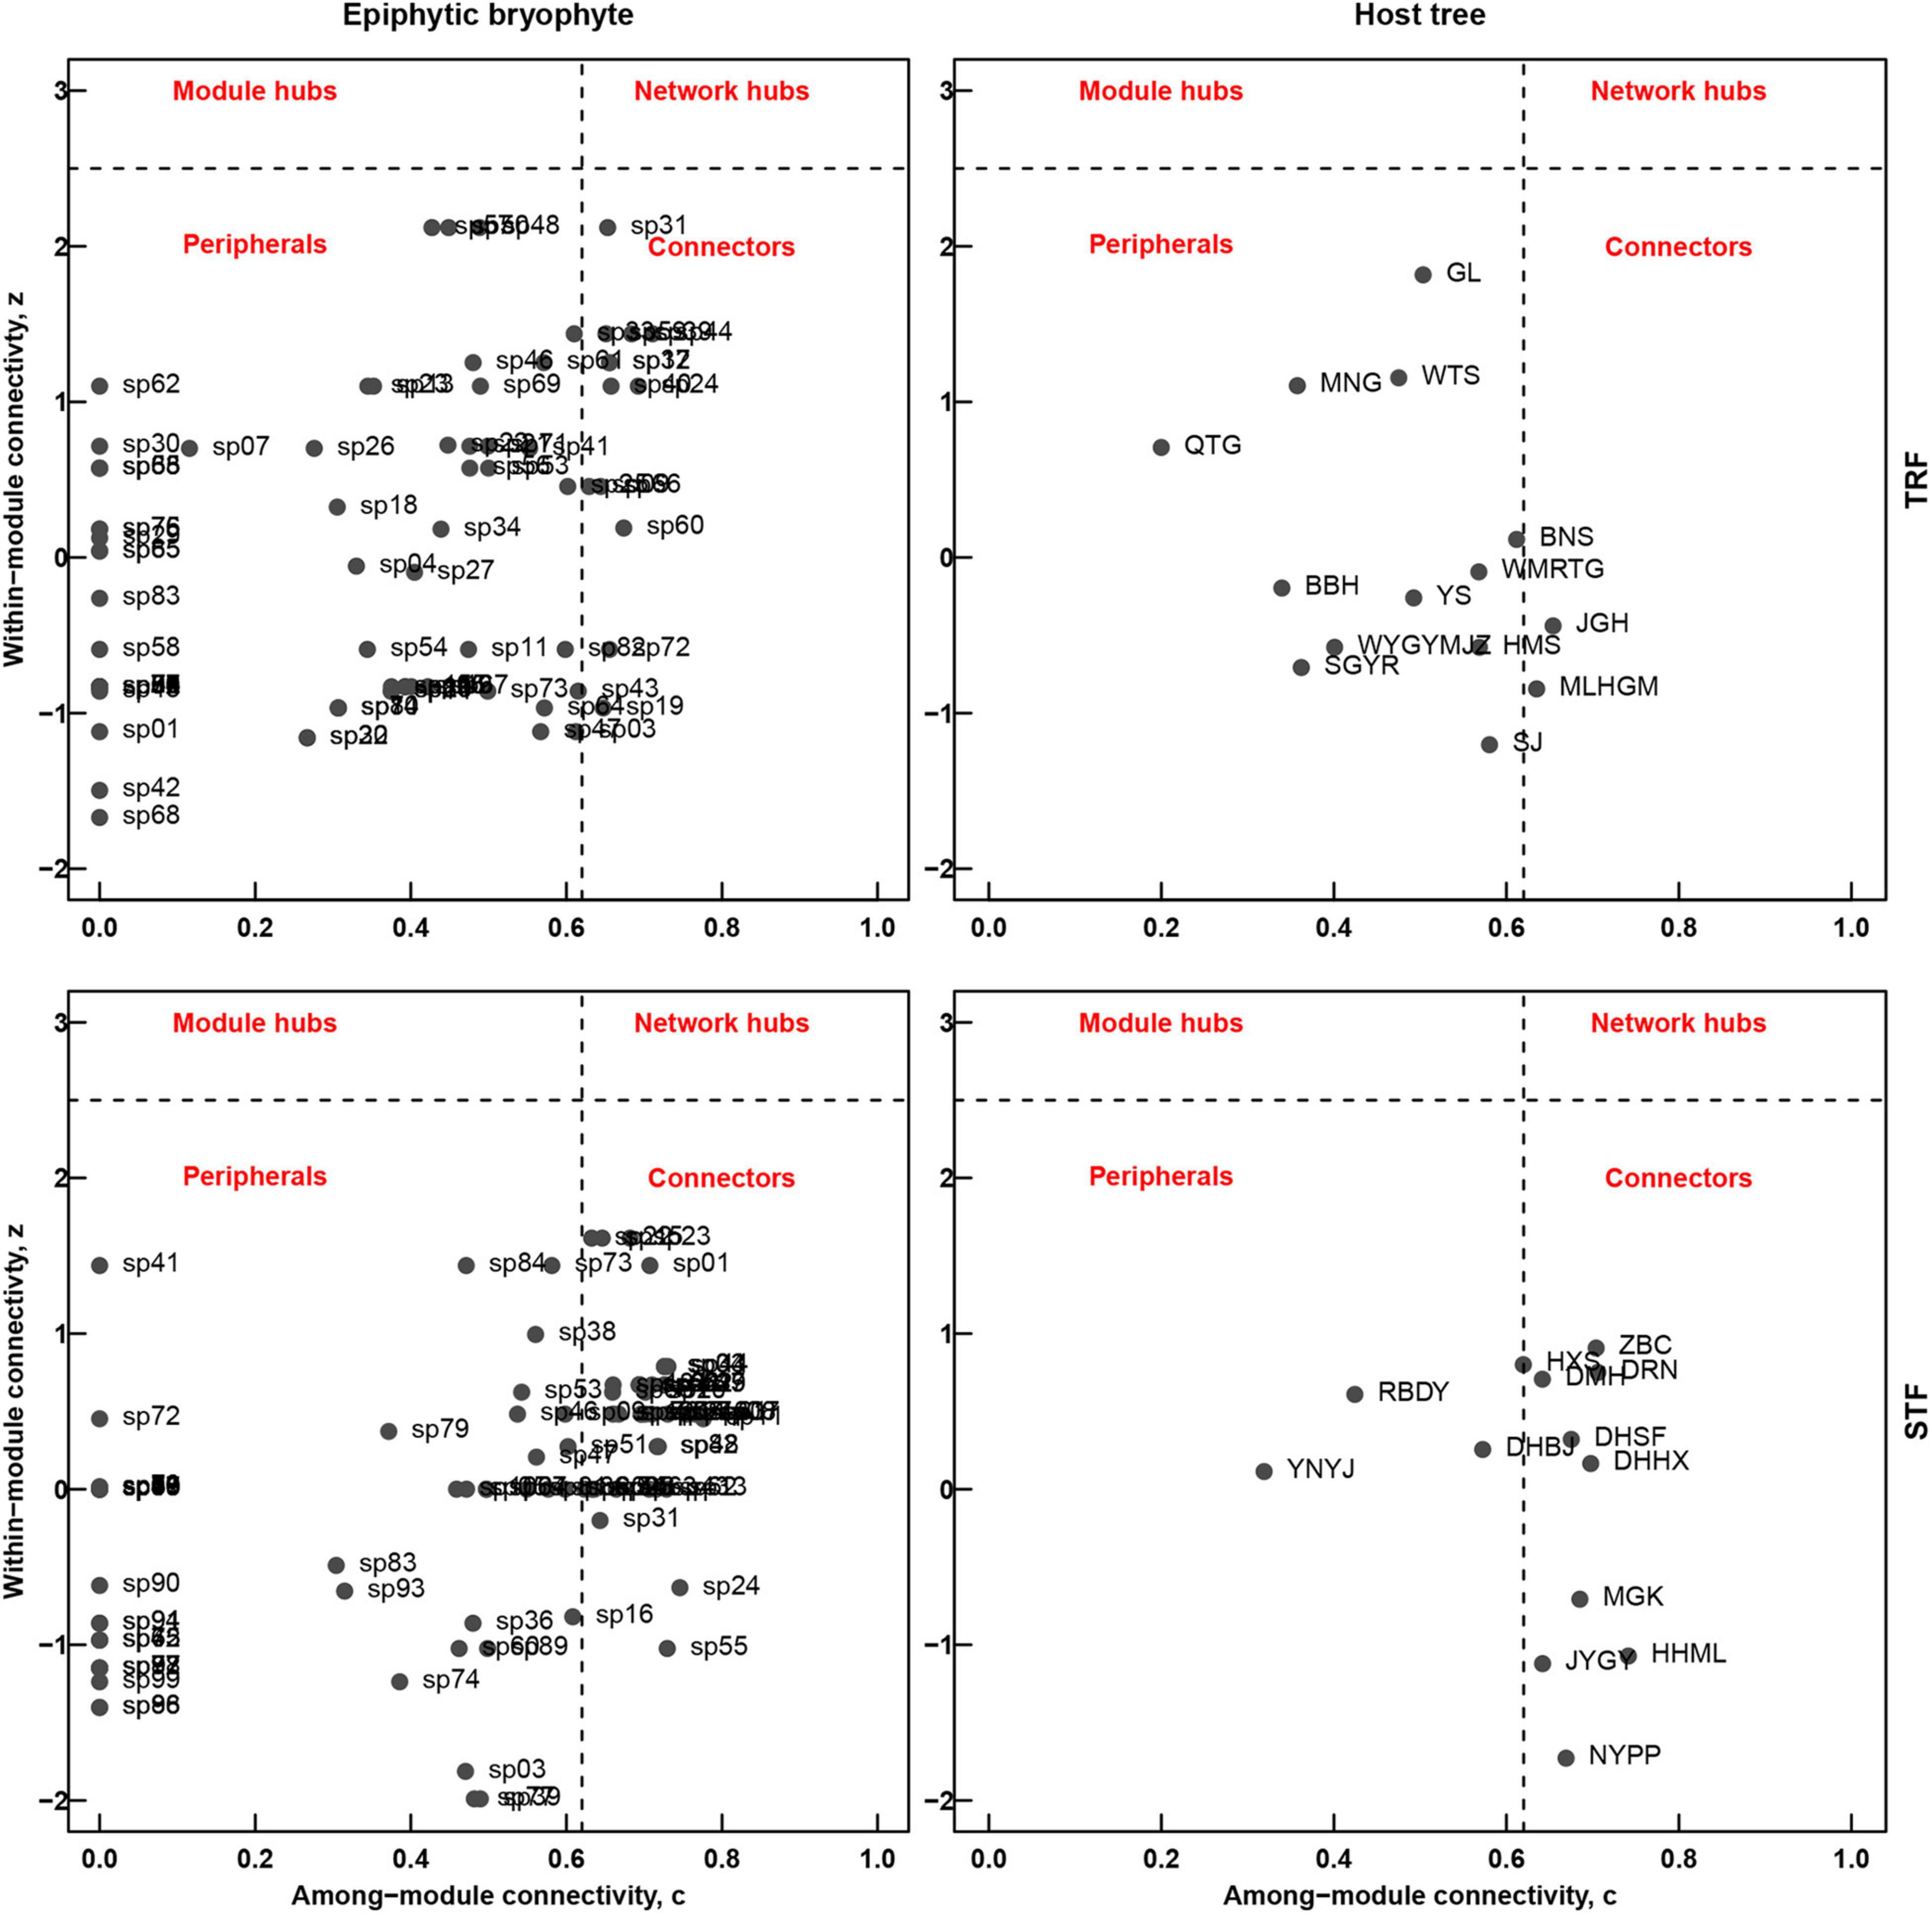
Figure 5. Roles of the epiphytic bryophyte species (left) and host tree species (right) in the modular and the entire network structures in the tropical lowland seasonal rain forest (TRF) (top) and subtropical montane moist evergreen broad-leaved forest (STF) (bottom). The coefficients z and c refer to among-module connectivity and within-module degree, respectively. Dashed lines represent threshold values for c (0.62) and z (2.5), indicating the topographical space of network hubs (top right-hand rectangle, high z- and c-values), module hubs (top left-hand rectangle, high z- and low c-values), connectors (bottom right-hand rectangle, low z- and high c-values) and peripheral species (bottom left-hand rectangle, low z- and c-values).
The number of interacting bryophyte species significantly increased with increasing number of recorded individuals per host tree species. The slope of the fitted linear model was higher in the STF than TRF (4.489 in the STF and 2.212 in the TRF) (Figure 6). Similarly, the number of epiphyte species increased significantly with tree height and DBH with higher slopes in the STF than TRF (Figure 7).
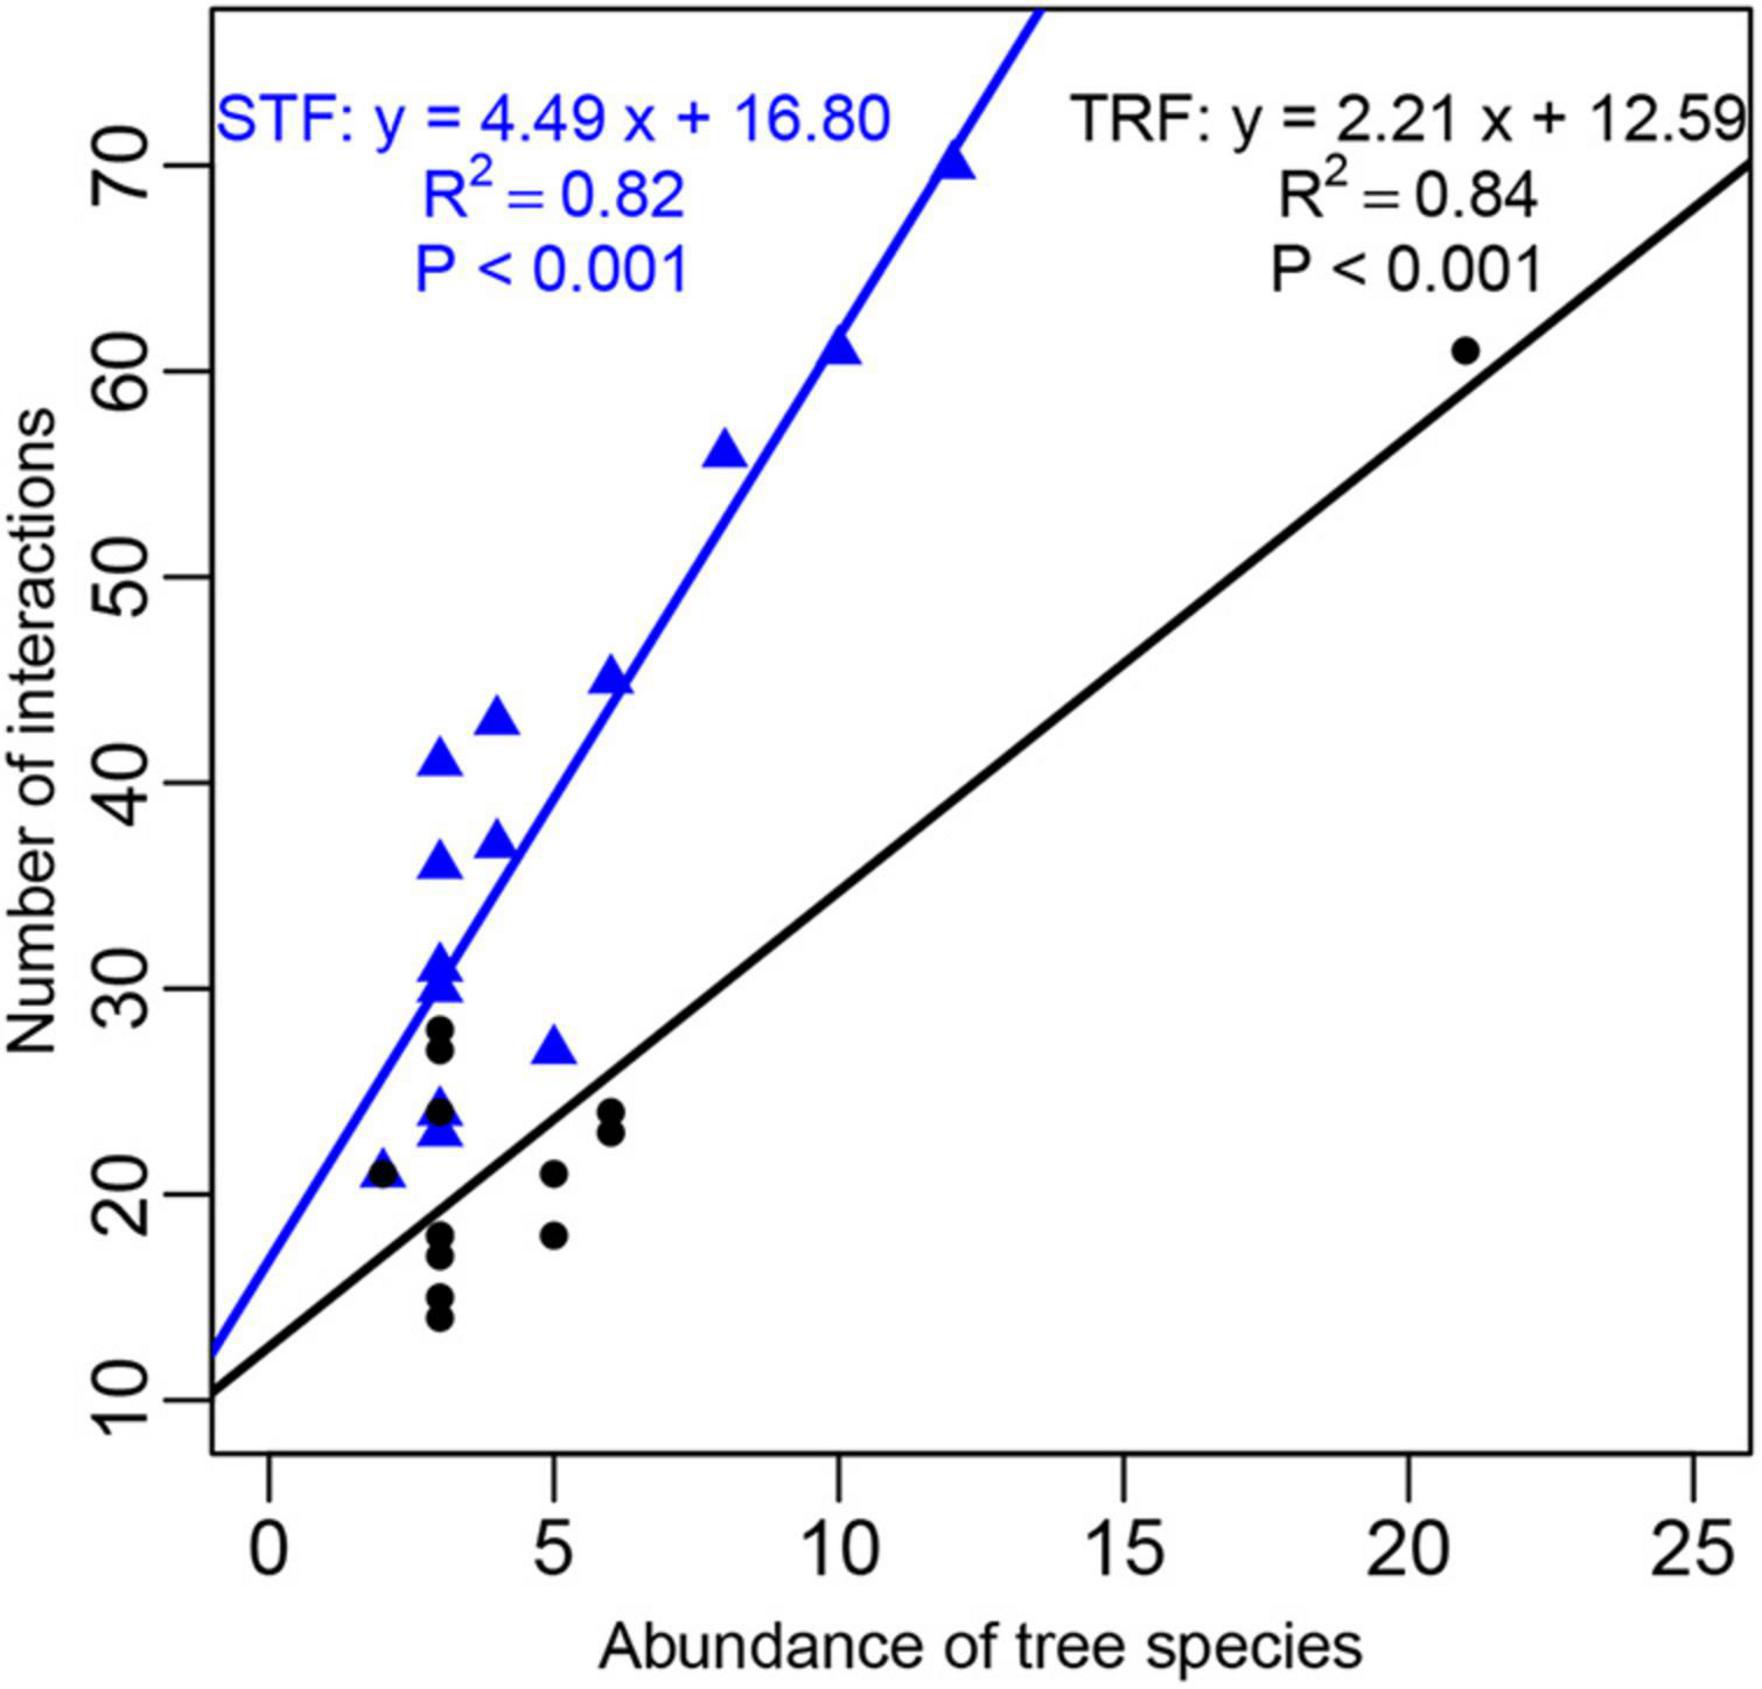
Figure 6. Abundance of the 14 host plant species plotted against the number of interactions with epiphytic bryophyte species. Black solid circles represent those in the tropical lowland seasonal rain forest (TRF) and blue solid triangles represent the tree species in the subtropical montane moist evergreen broad-leaved forest (STF). The solid line is the best fit linear regression: the black line in TRF (slope = 2.21, R2 = 0.84, P < 0.001); and the blue line in STF (slope = 4.49, R2 = 0.82, P < 0.001).
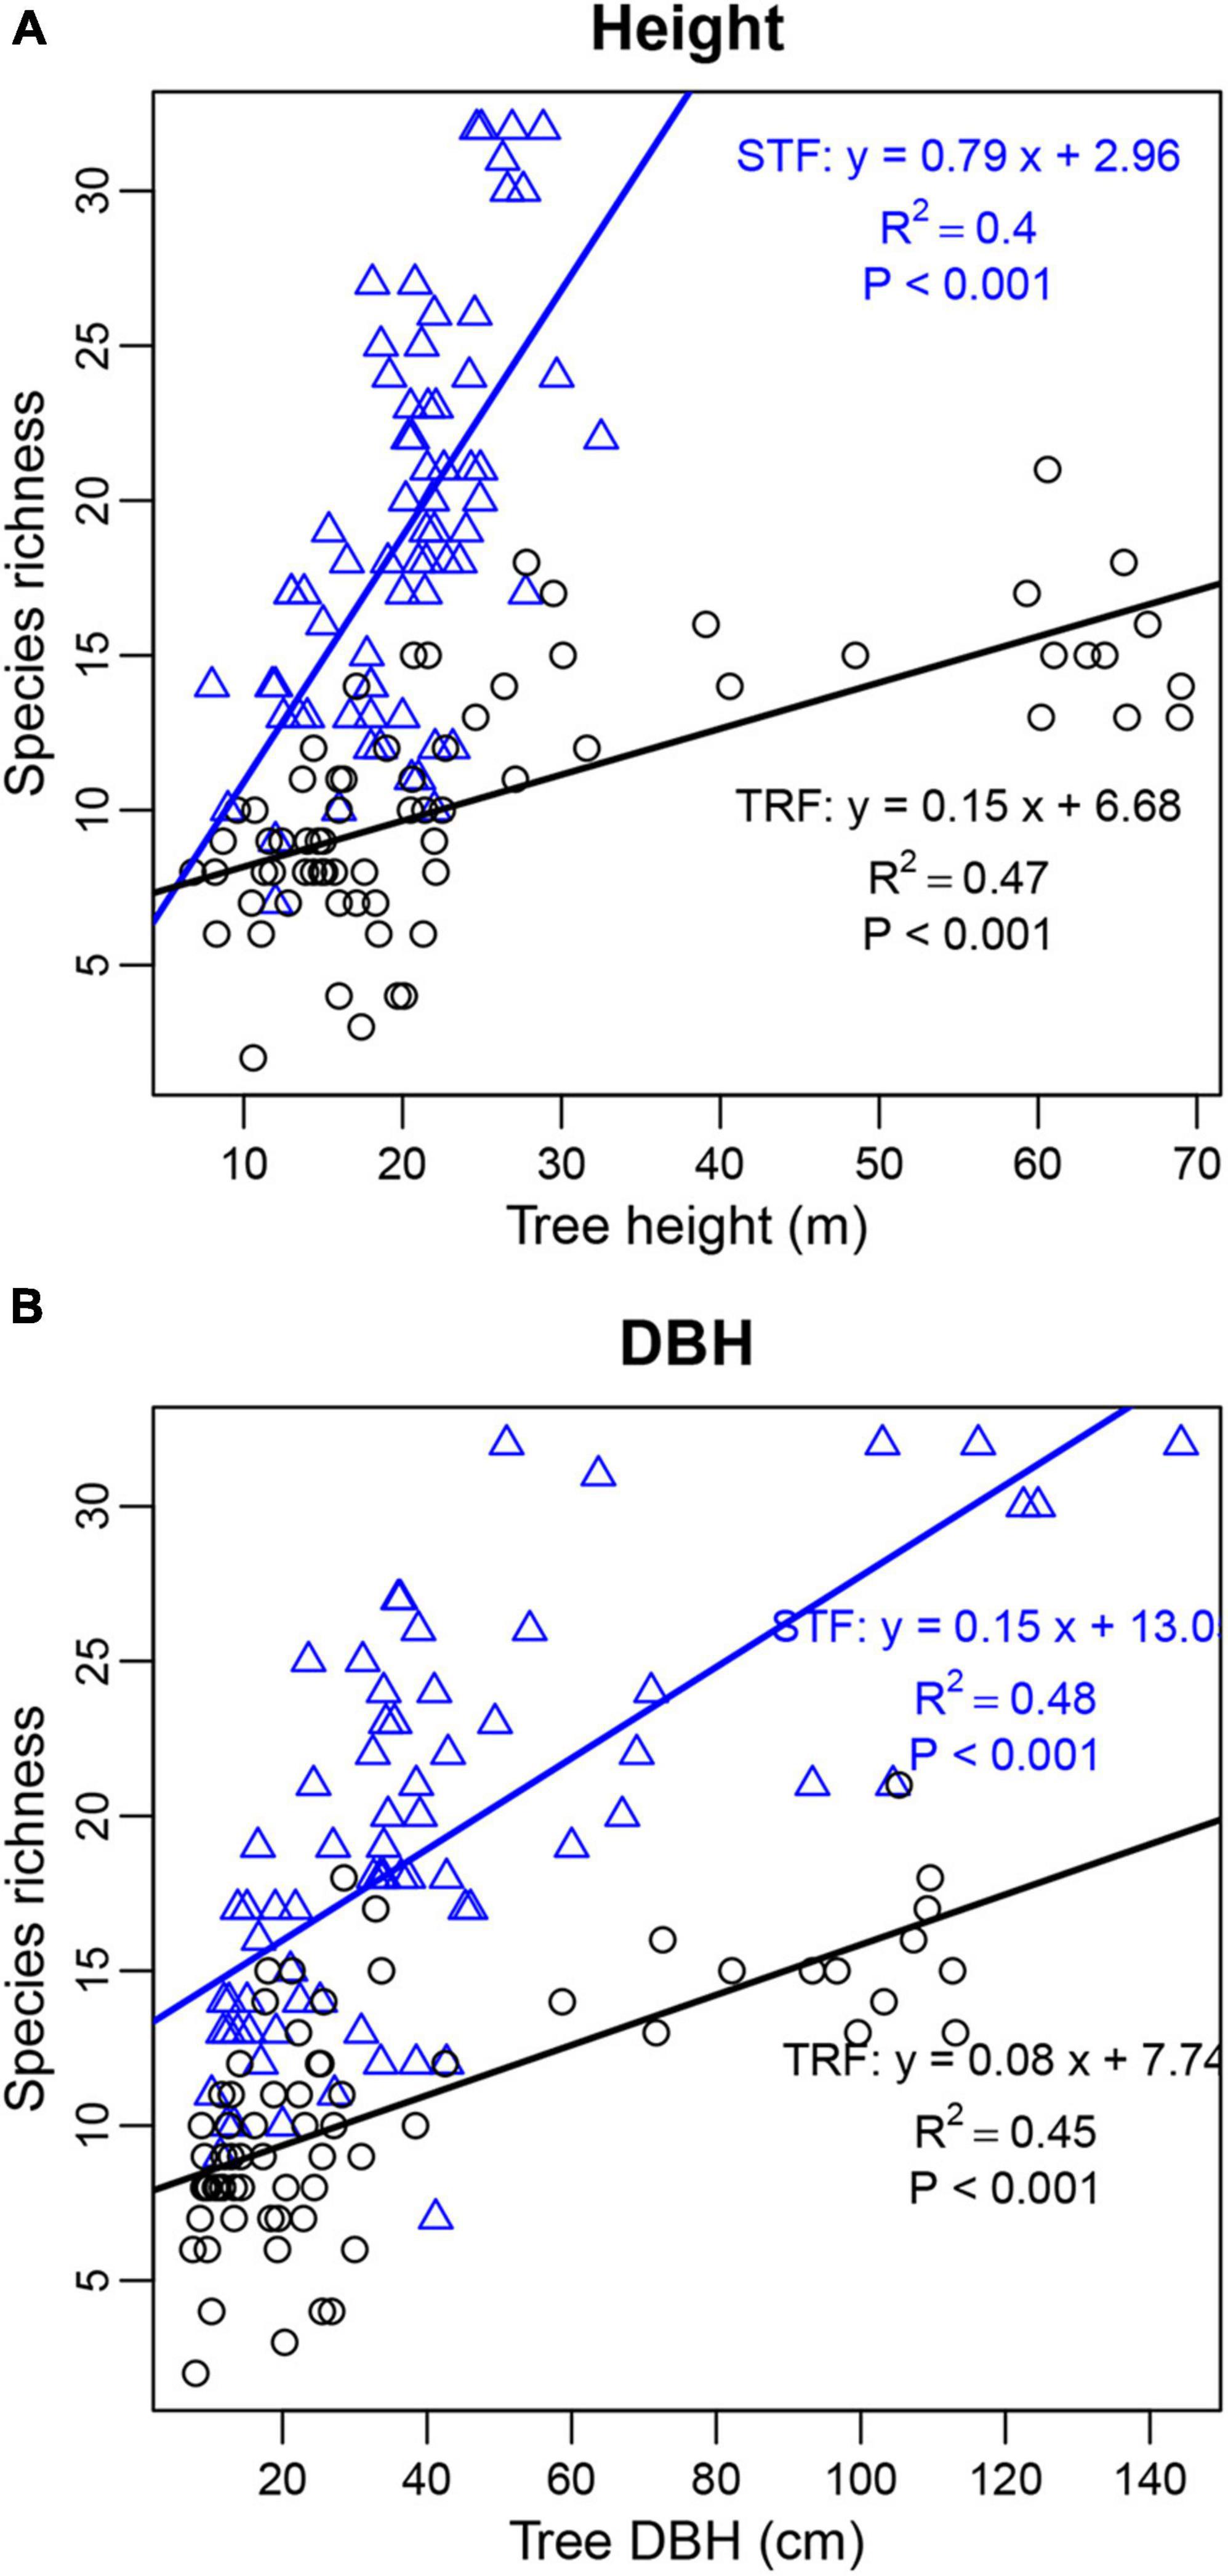
Figure 7. Linear relationship of tree height (A) and DBH (B) with the number of bryophyte species found on individual host trees. Black circles and blue triangles are from the tropical lowland seasonal rain forest (TRF) and subtropical montane moist evergreen broad-leaved forest (STF), respectively. The solid lines indicate the overall trends of linear regression: black lines in TRF [(A) slope = 0.15, R2 = 0.47, P < 0.001; (B) slope = 0.08, R2 = 0.45, P < 0.001] and blue lines in STF [(A) slope = 0.79, R2 = 0.40, P < 0.001; (B) slope = 0.14, R2 = 0.48, P < 0.001].
Both bryophyte–host interaction networks in two forests exhibited nested structures with low modularity. Although the observed structures are a common pattern for commensal interaction (Naranjo et al., 2019), we acknowledge that relatively small sample sizes collected within the reach of canopy cranes may cause sampling bias and phylogenetic effects on estimates of host specificity, possibly representing incomplete forest community structures (Novotny et al., 2002).
Our study showed that more bryophyte species interacted with two or more tree species (generalists), while the smaller proportions of bryophyte species (25% in the TRF and 21% in the STF) interacted with a specific tree species (specialists). A possible explanation is that epiphytic bryophytes are generally pioneer species representing wide niche and great adaptability, colonizing the tree surface at early stages of tree growth to provide suitable substrates (Burns, 2007), while a few specialists subsequently colonize and thrive under specific conditions. Specificity is expected to be weaker in commensal interactions than other types of interactions (Bluthgen et al., 2006). The low level of specialization in epiphytic network structure may be related to the weak selection effects on epiphyte colonization by the host species (Silva et al., 2010) and low coevolution intensities in epiphyte bryophyte–host interactions (Fontaine et al., 2011). However, networks between epiphytes and hosts are not a simple random distribution of individuals, and epiphytes generally present their preferences for particular host traits and microclimatic conditions rather than for host species identifies per se (Wagner et al., 2015; Taylor et al., 2016).
Our epiphytic bryophyte–host networks showed a nested pattern, which is in line with the majority of other epiphyte–host networks (Naranjo et al., 2019; Olivia Cortes-Anzures et al., 2020; Fontúrbel et al., 2021). For ecological networks, nested structure indicates that specialists tend to interact with an appropriate subset of species that interact with more generalists. High nestedness may also play an important role in stabilizing the ecological networks between epiphytic bryophytes and their hosts (Piazzon et al., 2011; Song et al., 2017); however, this mechanism is still speculative and needs to be further investigated. One possible hypothesis is that the abundance of species may be one of the factors contributing to the formation of nested structure. The dominant tree species with high abundance were the generalists, which support the most epiphytic bryophyte species, including generalists and specialists. Under the nested structure, the large-scale species loss of epiphytic community requires the reduction of dominant tree species, while the abundance of dominant species is quite stable, which ensures the stability of epiphytic community.
Unlike other ecological networks, there are low levels of modularity (Q) in both TRF and STF, which may reflect the existence of lower niche partitioning caused by low host or microhabitat preferences by epiphytes. Networks were divided into modules as species within modules interact more frequently with each other (Guimera et al., 2007; Francisco et al., 2019). Some studies argued that species within modules may have adapted to the same habitat conditions and have close phylogenetic relationships (Olesen et al., 2007; Watts et al., 2016). At species level, both TRF and STF lacked network hubs: we found 9 host tree connectors in the STF, while only Pseuduvaria indochinensis and Drypetes hoaensis were the connector species in the TRF. Similar results have been reported on pollination networks and seed dispersal networks that most species act as peripherals and few species act as module and network hubs (Olesen et al., 2007; Vizentin-Bugoni et al., 2021). Our study suggests that, although highly nested interactions provide more stable networks, the loss of highly connected species (i.e., connectors in this study) may cause altered network structures.
We recorded more bryophyte species and links in the STF than in the TRF, despite having collected the same number of host species and individuals in both forests. Furthermore, the metrics of network properties in the STF were higher than those in the TRF, except for modularity. High level of connectivity, vulnerability and generality indicate the complexity of network structure, while nested structure with low level of modularity is correlated with the stability of network. These results may reflect more complex and stable structure of epiphytic bryophyte community in the STF. Relatively high epiphyte richness and network complexity in the STF may be attributable to the hump-shaped pattern of tree bole bryophyte species richness with increasing altitude in the same area, where our STF site is located in the middle of the elevational transect (Song et al., 2015a). Climatic differences between two sites may be strong drivers of epiphyte community assembly (Saiz et al., 2020). Despite higher annual temperature in the tropical forest than in subtropical forest, relatively lower rainfall in the TRF may have acted as an indispensable factor limiting epiphytic bryophyte abundance. On the other hand, the difference in the structure of epiphyte communities might be explained, at least partially, by the host tree identify (and the substrate and microclimate conditions they provide) at different sites (Patino and Gonzalez-Mancebo, 2011). According to previous study, even in the same type of forests (but with different dominant tree species), network properties varied widely among study sites (Taylor et al., 2016). In our study, the dominant species in the TRF (Parashorea chinensis) and STF (Castanopsis rufescens) belong to different taxonomic groups, which may have resulted in the difference in microhabitats they provide for epiphytes.
It has been repeatedly confirmed that epiphyte–host interactions correlate well with host size, because large tree size provides more surface areas, various microhabitats, and longer exposure time for the colonization of epiphytes (Agglael Vergara-Torres et al., 2010; Sayago et al., 2013; Zotarelli et al., 2019). For example, in a tropical montane forest, DBH alone explained 6% of the epiphyte community variation (Zhao et al., 2015), and a study conducted in two tropical dry forests found a positive relationship between epiphyte richness and host tree size (i.e., height and DBH) (Siaz-Torres et al., 2021). Some researchers treated the host tree individuals as isolated islands, and the epiphyte diversity is predicted by the theory of island biogeography which depicts that larger hosts are able to support a larger number of epiphytic species (Spruch et al., 2019). In addition to size, host abundance could influence the plant–host network through the neutral allocation of species interactions, as proposed by Calatayud et al. (2017). In our study, Parashorea chinensis and Castanopsis rufescens were the most common species among sampled trees. These tree species may provide greater opportunities for colonization by epiphytic bryophyte, which may have resulted in the majority of interactions in the networks. A study of a Mexican oak forest, in contrast, revealed that interaction intensities were not determined by their host abundance (Olivia Cortes-Anzures et al., 2020). The inconsistent result may suggest that the interaction patterns are attributable to the combination of neutral and niche processes.
We observed similar module patterns in the vertical distributions of bryophyte–host interactions in the two forests. Bryophyte species attached on the base zones (Z1, Z2) were grouped into one module, while those recorded on crown zones (Z4, Z5, Z6) were grouped into another. Our results support the findings of Francisco et al. (2019), who subdivided the epiphyte–host networks in a tropical cloud forest into three modules among the hosts’ vertical zones. The clumped epiphyte distributions along vertical zones may be related to the adaptation to microclimates within a host with increasing light intensity, wind speed, and air temperature and declining air humidity along the entire vertical gradient from the tree base to canopy (Krömer et al., 2007; Shen et al., 2018). We found that epiphytic bryophyte species such as Taxiphyllum taxirameum in the TRF and Thuidium cymbifolium in the STF commonly occurred on the base of host individuals, and these species may prefer shade and high humidity habitat. In contrast, Frullania fuscovirens in the TRF and Frullania chenii in the STF attached on the crown zones are adapted to intense radiation and drought stress in the forest canopy. These findings carry conservation implications for the potential impacts of climate change on epiphytic bryophyte distributions, as the changes in microclimatic conditions due to anthropogenic warming may results in the shift in their vertical distributions or in local extinctions (Pardow and Lakatos, 2013; Zanatta et al., 2020).
Our study shows that the STF supports a higher diversity of epiphytic bryophytes and more complex structures of bryophyte–host networks in comparison to the TRF in southwest China. Despite that the TRF and STF represent different biomes, both sites showed some common patterns in epiphyte–host networks. In both sites, size and abundance are two attributes affecting the structure of epiphytic communities and tree vertical zones were closely related to their network modules. In light of our study, forest management and conservation in these areas should focus on Castanopsis rufescens, Pseuduvaria indochinensis, and Drypetes hoaensis in the STF and Parashorea chinensis in the TRF that contribute greatly to epiphytic bryophyte diversity and community stability as network connectors. Once these key species are lost, the network structure may break apart or cause a sharp decline of the biodiversity in the forest canopies. Some bryophyte species (such as Taxiphyllum taxirameum and Frullania fuscovirens in the TRF; Thuidium cymbifolium and Frullania chenii in the STF) were only recorded on specific vertical zones, and these species may be sensitive to environment changes and used as bioindicators.
The original contributions presented in the study are included in the article/Supplementary Material, further inquiries can be directed to the corresponding author/s.
LS, TS, D-LQ, and H-XH conceived the research idea and were involved in statistical analyses and interpretations. TS and LS led the data collection. H-XH and D-LQ draft the manuscript. All authors contributed to the final manuscripts.
This study was supported by the National Natural Science Foundation of China (Nos. 32171529 and 31670452), the Natural Science Foundation of Yunnan Province (No. 202101AT070059), the CAS “Light of West China” Program, the Lancang-Mekong Cooperation (LMC) Special Fund (Biodiversity Monitoring and Network Construction along Lancang-Mekong River Basin Project), the CAS 135 Program (Nos. 2017XTBG-F03 and 2017XTBG-F01), the candidates of the Young and Middle-Aged Academic Leaders of Yunnan Province (No. 2019HB040), and the Yunnan Ten Thousand Plan Young and Elite Talents Project (YNWR-QNBJ-2020-066).
The authors declare that the research was conducted in the absence of any commercial or financial relationships that could be construed as a potential conflict of interest.
All claims expressed in this article are solely those of the authors and do not necessarily represent those of their affiliated organizations, or those of the publisher, the editors and the reviewers. Any product that may be evaluated in this article, or claim that may be made by its manufacturer, is not guaranteed or endorsed by the publisher.
We thank Ailaoshan Station for Subtropical Forest Ecosystem Studies and the Xishuangbanna Station for Tropical Forest Ecosystem Studies for their supports in field survey.
The Supplementary Material for this article can be found online at: https://www.frontiersin.org/articles/10.3389/ffgc.2021.716278/full#supplementary-material
Agglael Vergara-Torres, C., Carmen Pacheco-Alvarez, M., and Flores-Palacios, A. (2010). Host preference and host limitation of vascular epiphytes in a tropical dry forest of central Mexico. J. Trop. Ecol. 26, 563–570. doi: 10.1017/s0266467410000349
Almeida-Neto, M., Guimaraes, P., Guimaraes, P. R. Jr., Loyola, R. D., and Ulrich, W. (2008). A consistent metric for nestedness analysis in ecological systems: reconciling concept and measurement. Oikos 117, 1227–1239. doi: 10.1111/j.0030-1299.2008.16644.x
Arthur, R. (2020). Modularity and projection of bipartite networks. Phys. A-Stat. Mech. Appl. 549:124341. doi: 10.1016/j.physa.2020.124341
Barber, M. J. (2007). Modularity and community detection in bipartite networks. Phys. Rev. E 76:066102. doi: 10.1103/PhysRevE.76.066102
Baumgartner, M. T. (2020). Connectance and nestedness as stabilizing factors in response to pulse disturbances in adaptive antagonistic networks. J. Theor. Biol. 486:110073. doi: 10.1016/j.jtbi.2019.110073
Blick, R., and Burns, K. C. (2009). Network properties of arboreal plants: are epiphytes, mistletoes and lianas structured similarly? Perspect. Plant Ecol. Evol. Syst. 11, 41–52. doi: 10.1016/j.ppees.2008.10.002
Bluethgen, N. (2010). Why network analysis is often disconnected from community ecology: a critique and an ecologist’s guide. Basic Appl. Ecol. 11, 185–195. doi: 10.1016/j.baae.2010.01.001
Bluthgen, N., Menzel, F., and Bluthgen, N. (2006). Measuring specialization in species interaction networks. BMC Ecol. 6:9. doi: 10.1186/1472-6785-6-9
Borrett, S. R., Moody, J., and Edelmann, A. (2014). The rise of network ecology: maps of the topic diversity and scientific collaboration. Ecol. Model. 293, 111–127. doi: 10.1016/j.ecolmodel.2014.02.019
Burns, K. C. (2007). Network properties of an epiphyte metacommunity. J. Ecol. 95, 1142–1151. doi: 10.1111/j.1365-2745.2007.01267.x
Burns, K. C., and Zotz, G. (2010). A hierarchical framework for investigating epiphyte assemblages: networks, meta-communities, and scale. Ecology 91, 377–385. doi: 10.1890/08-2004.1
Calatayud, J., Madrigal-Gonzalez, J., Gianoli, E., Hortal, J., and Herrero, A. (2017). Uneven abundances determine nestedness in climbing plant-host interaction networks. Perspect. Plant Ecol. Evol. Syst. 26, 53–59. doi: 10.1016/j.ppees.2017.04.003
Ceballos, S. J., Chacoff, N. P., and Malizia, A. (2016). Interaction network of vascular epiphytes and trees in a subtropical forest. Acta Oecol. Int. J. Ecol. 77, 152–159. doi: 10.1016/j.actao.2016.10.007
Costa, A., Romano, A., Rosa, G., and Salvidio, S. (2021). Weighted individual-resource networks in prey-predator systems: the role of prey availability on the emergence of modular structures. Integr. Zool. 1–13. doi: 10.1111/1749-4877.12520
Coyle, J. R. (2017). Intraspecific variation in epiphyte functional traits reveals limited effects of microclimate on community assembly in temperate deciduous oak canopies. Oikos 126, 111–120. doi: 10.1111/oik.03239
Csardi, G., and Nepisz, T. (2006). The igraph software package for complex network research. Int. J. Complex Syst. 1695, 1–9.
de Oliveira, H. C., and de Oliveira, S. M. (2016). Vertical distribution of epiphytic bryophytes in Atlantic forest fragments in northeastern Brazil. Acta Bot. Brasil. 30, 609–617. doi: 10.1590/0102-33062016abb0303
Dormann, C. F., and Strauss, R. (2014). A method for detecting modules in quantitative bipartite networks. Methods Ecol. Evol. 5, 90–98. doi: 10.1111/2041-210x.12139
Dunne, J. A., Williams, R. J., and Martinez, N. D. (2002). Food-web structure and network theory: the role of connectance and size. Proc. Natl. Acad. Sci. U.S.A. 99, 12917–12922. doi: 10.1073/pnas.192407699
Fontaine, C., Guimaraes, P. R. Jr., Kefi, S., Loeuille, N., Memmott, J., van der Putten, W. H., et al. (2011). The ecological and evolutionary implications of merging different types of networks. Ecol. Lett. 14, 1170–1181. doi: 10.1111/j.1461-0248.2011.01688.x
Fontúrbel, F. E., Osorio, F., Riffo-Donoso, V., Carvallo, G. O., and Rydin, H. (2021). Cryptic interactions revisited from ecological networks: mosses as a key link between trees and hummingbirds. Funct. Ecol. 35, 226–238. doi: 10.1111/1365-2435.13691
Francisco, T. M., Couto, D. R., Evans, D. M., Garbin, M. L., and Ruiz-Miranda, C. R. (2018). Structure and robustness of an epiphyte-phorophyte commensalistic network in a neotropical inselberg. Austr. Ecol. 43, 903–914. doi: 10.1111/aec.12640
Francisco, T. M., Couto, D. R., Garbin, M. L., Muylaert, R. L., and Ruiz-Miranda, C. R. (2019). Low modularity and specialization in a commensalistic epiphyte–phorophyte network in a tropical cloud forest. Biotropica 51, 509–518. doi: 10.1111/btp.12670
Gruber, B., Bluethgen, N., Fruend, J., and Dormann, C. F. (2009). Indices, graphs and null models: analyzing bipartite ecological networks. Open Ecol. J. 2, 7–24. doi: 10.2174/1874213000902010007
Guimera, R., Mossa, S., Turtschi, A., and Amaral, L. A. N. (2005). The worldwide air transportation network: anomalous centrality, community structure, and cities’ global roles. Proc. Natl. Acad. Sci. U.S.A. 102, 7794–7799. doi: 10.1073/pnas.0407994102
Guimera, R., Sales-Pardo, M., and Amaral, L. A. N. (2007). Module identification in bipartite and directed networks. Phys. Rev. E 76:036102. doi: 10.1103/PhysRevE.76.036102
Heleno, R., Devoto, M., and Pocock, M. (2012). Connectance of species interaction networks and conservation value: is it any good to be well connected? Ecol. Indic. 14, 7–10. doi: 10.1016/j.ecolind.2011.06.032
Ines Borthagaray, A., Soutullo, A., Carranza, A., and Arim, M. (2018). A modularity-based approach for identifying biodiversity management units. Rev. Chil. Hist. Nat. 91:2. doi: 10.1186/s40693-018-0072-y
Klinghardt, M., and Zotz, G. (2021). Abundance and seasonal growth of epiphytic ferns at three sites along a rainfall gradient in Western Europe. Flora 274:151749. doi: 10.1016/j.flora.2020.151749
Krömer, T., Kessler, M., and Gradstein, S. R. (2007). Vertical stratification of vascular epiphytes in submontane and montane forest of the Bolivian Andes: the importance of the understory. Plant Ecol. 189, 261–278. doi: 10.1007/s11258-006-9182-8
Lan, G., Zhu, H., and Cao, M. (2012). Tree species diversity of a 20-ha plot in a tropical seasonal rainforest in Xishuangbanna, southwest China. J. For. Res. 17, 432–439. doi: 10.1007/s10310-011-0309-y
Landi, P., Minoarivelo, H. O., Brannstrom, A., Hui, C., and Dieckmann, U. (2018). Complexity and stability of ecological networks: a review of the theory. Popul. Ecol. 60, 319–345. doi: 10.1007/s10144-018-0628-3
Li, S., Liu, W.-Y., Li, D.-W., Song, L., Shi, X.-M., and Lu, H.-Z. (2015). Species richness and vertical stratification of epiphytic lichens in subtropical primary and secondary forests in southwest China. Fungal Ecol. 17, 30–40. doi: 10.1016/j.funeco.2015.02.005
Li, S., Liu, W., Wang, L., Ma, W., and Song, L. (2011). Biomass, diversity and composition of epiphytic macrolichens in primary and secondary forests in the subtropical Ailao Mountains, SW China. For. Ecol. Manage. 261, 1760–1770. doi: 10.1016/j.foreco.2011.01.037
Mendieta-Leiva, G., Ramos, F. N., Elias, J. P. C., and Zotz, G. (2020). EpIG-DB: a database of vascular epiphyte assemblages in the Neotropics. J. Veg. Sci. 31, 518–528. doi: 10.1111/jvs.12867
Naranjo, C., Iriondo, J. M., Riofrio, M. L., and Lara-Romero, C. (2019). Evaluating the structure of commensalistic epiphyte-phorophyte networks: a comparative perspective of biotic interactions. Aob Plants 11:lz011. doi: 10.1093/aobpla/plz011
Nieder, J., Prosperi, J., and Michaloud, G. (2001). Epiphytes and their contribution to canopy diversity. Plant Ecol. 153, 51–63. doi: 10.1023/A:1017517119305
Novotny, V., Basset, Y., Miller, S. E., Weiblen, G. D., Bremer, B., Cizek, L., et al. (2002). Low host specificity of herbivorous insects in a tropical forest. Nature 416, 841–844. doi: 10.1038/416841a
Olesen, J. M., Bascompte, J., Dupont, Y. L., and Jordano, P. (2007). The modularity of pollination networks. Proc. Natl. Acad. Sci. U.S.A. 104, 19891–19896. doi: 10.1073/pnas.0706375104
Olivia Cortes-Anzures, B., Maria Corona-Lopez, A., Damon, A., Mata-Rosas, M., and Flores-Palacios, A. (2020). Phorophyte type determines epiphyte-phorophyte network structure in a Mexican oak forest. Flora 272:151704. doi: 10.1016/j.flora.2020.151704
Padilha, P. T., Elias, G. A., dos Santos, R., Martins, R., and Citadini-Zanette, V. (2017). Vascular epiphytes respond to successional stages and microhabitat variations in a subtropical forest in southern Brazil. Braz. J. Bot. 40, 897–905. doi: 10.1007/s40415-017-0391-2
Pardow, A., and Lakatos, M. (2013). Desiccation Tolerance and global change: implications for tropical bryophytes in lowland forests. Biotropica 45, 27–36. doi: 10.1111/j.1744-7429.2012.00884.x
Patino, J., and Gonzalez-Mancebo, J. M. (2011). Exploring the effect of host tree identity on epiphyte bryophyte communities in different Canarian subtropical cloud forests. Plant Ecol. 212, 433–449. doi: 10.1007/s11258-010-9835-5
Peralta, G. (2016). Merging evolutionary history into species interaction networks. Funct. Ecol. 30, 1917–1925. doi: 10.1111/1365-2435.12669
Piazzon, M., Larrinaga, A. R., and Santamaria, L. (2011). Are nested networks more robust to disturbance? A test using epiphyte-tree, comensalistic networks. PLoS One 6:e19637. doi: 10.1371/journal.pone.0019637
Pinheiro, R. B. P., Felix, G. M. F., Dormann, C. F., and Mello, M. A. R. (2019). A new model explaining the origin of different topologies in interaction networks. Ecology 100:e02796. doi: 10.1002/ecy.2796
Quiel, C. R., and Zotz, G. (2021). Vascular epiphyte assemblages on isolated trees along an elevational gradient in Southwest Panama. Divers. Basel 13:49. doi: 10.3390/d13020049
Saiz, H., Dainese, M., Chiarucci, A., and Nascimbene, J. (2020). Networks of epiphytic lichens and host trees along elevation gradients: climate change implications in mountain ranges. J. Ecol. 109, 1122–1132. doi: 10.1111/1365-2745.13538
Sayago, R., Lopezaraiza-Mikel, M., Quesada, M., Yolotl Alvarez-Anorve, M., Cascante-Marin, A., and Ma Bastida, J. (2013). Evaluating factors that predict the structure of a commensalistic epiphyte - phorophyte network. Proc. R. Soc. B Biol. Sci. 280:20122821. doi: 10.1098/rspb.2012.2821
Shen, T., Corlett, R. T., Song, L., Ma, W.-Z., Guo, X.-L., Song, Y., et al. (2018). Vertical gradient in bryophyte diversity and species composition in tropical and subtropical forests in Yunnan, SW China. J. Veg. Sci. 29, 1075–1087. doi: 10.1111/jvs.12692
Siaz-Torres, S. S., Mora-Olivo, A., Arellano-Mendez, L. U., Vanoye-Eligio, V., Flores-Rivas, J., and de la Rosa-Manzano, E. (2021). Contribution of peeling host for epiphyte abundance in two tropical dry forests in the “El Cielo biosphere reserve” Mexico. Plant Species Biol. 36, 269–283. doi: 10.1111/1442-1984.12317
Silva, I. A., Ferreira, A. W. C., Lima, M. I. S., and Soares, J. J. (2010). Networks of epiphytic orchids and host trees in Brazilian gallery forests. J. Trop. Ecol. 26, 127–137. doi: 10.1017/s0266467409990551
Song, C., Rohr, R. P., and Saavedra, S. (2017). Why are some plant-pollinator networks more nested than others? J. Anim. Ecol. 86, 1417–1424. doi: 10.1111/1365-2656.12749
Song, L., Zhang, Y.-J., Chen, X., Li, S., Lu, H.-Z., Wu, C.-S., et al. (2015b). Water relations and gas exchange of fan bryophytes and their adaptations to microhabitats in an Asian subtropical montane cloud forest. J. Plant Res. 128, 573–584. doi: 10.1007/s10265-015-0721-z
Song, L., Ma, W.-Z., Yao, Y.-L., Liu, W.-Y., Li, S., Chen, K., et al. (2015a). Bole bryophyte diversity and distribution patterns along three altitudinal gradients in Yunnan, China. J. Veg. Sci. 26, 576–587. doi: 10.1111/jvs.12263
Spruch, L., Hellwig, J., Zotz, G., and Blasius, B. (2019). Modeling community assembly on growing habitat “islands”: a case study on trees and their vascular epiphyte communities. Theor. Ecol. 12, 513–529. doi: 10.1007/s12080-019-0425-4
Stein, K., Coulibaly, D., Balima, L. H., Goetze, D., Linsenmair, K. E., Porembski, S., et al. (2021). Plant-pollinator networks in savannas of Burkina Faso, West Africa. Divers. Basel 13:1. doi: 10.3390/d13010001
Taylor, A., Saldaña, A., Zotz, G., Kirby, C., Díaz, I., and Burns, K. (2016). Composition patterns and network structure of epiphyte–host interactions in chilean and New Zealand temperate forests. New Zeal. J. Bot. 54, 204–222. doi: 10.1080/0028825x.2016.1147471
Toivonen, J. M., Suominen, L., Gonzales-Inca, C. A., Trujillo Paucar, G., and Jones, M. M. (2017). Environmental drivers of vascular and non-vascular epiphyte abundance in tropical pre-montane cloud forests in Northern Peru. J. Veg. Sci. 28, 1198–1208. doi: 10.1111/jvs.12577
Veron, S., Fontaine, C., Dubos, N., Clergeau, P., and Pavoine, S. (2018). Predicting the impacts of co-extinctions on phylogenetic diversity in mutualistic networks. Biol. Conserv. 219, 161–171. doi: 10.1016/j.biocon.2018.01.028
Vizentin-Bugoni, J., Sperry, J. H., Kelley, J. P., Gleditsch, J. M., Foster, J. T., Drake, D. R., et al. (2021). Ecological correlates of species’ roles in highly invaded seed dispersal networks. Proc. Natl. Acad. Sci. U.S.A. 118:e2009532118. doi: 10.1073/pnas.2009532118
Vizentin-Bugoni, J., Tarwater, C. E., Foster, J. T., Drake, D. R., Gleditsch, J. M., Hruska, A. M., et al. (2019). Structure, spatial dynamics, and stability of novel seed dispersal mutualistic networks in Hawai’i. Science 364, 78–82. doi: 10.1126/science.aau8751
Wagner, K., Mendieta-Leiva, G., and Zotz, G. (2015). Host specificity in vascular epiphytes: a review of methodology, empirical evidence and potential mechanisms. Aob Plants 7:lu092. doi: 10.1093/aobpla/plu092
Watts, S., Dormann, C. F., Martin Gonzalez, A. M., and Ollerton, J. (2016). The influence of floral traits on specialization and modularity of plant-pollinator networks in a biodiversity hotspot in the Peruvian Andes. Ann. Bot. 118, 415–429. doi: 10.1093/aob/mcw114
Welti, E. A. R., and Joern, A. (2015). Structure of trophic and mutualistic networks across broad environmental gradients. Ecol. Evol. 5, 326–334. doi: 10.1002/ece3.1371
Zanatta, F., Engler, R., Collart, F., Broennimann, O., Mateo, R. G., Papp, B., et al. (2020). Bryophytes are predicted to lag behind future climate change despite their high dispersal capacities. Nat. Commun. 11:5601. doi: 10.1038/s41467-020-19410-8
Zarate-Garcia, A. M., Noguera-Savelli, E., Andrade-Canto, S. B., Zavaleta-Mancera, H. A., Gauthier, A., and Alatorre-Cobos, F. (2020). Bark water storage capacity influences epiphytic orchid preference for host trees. Am. J. Bot. 107, 726–734. doi: 10.1002/ajb2.1470
Zhao, M., Geekiyanage, N., Xu, J., Khin, M. M., Nurdiana, D. R., Paudel, E., et al. (2015). Structure of the epiphyte community in a tropical montane forest in SW China. PLoS One 10:e0122210. doi: 10.1371/journal.pone.0122210
Zotarelli, H. G. S., Molina, J. M. P., Ribeiro, J. E. L. S., and Sofia, S. H. (2019). A commensal network of epiphytic orchids and host trees in an Atlantic forest remnant: a case study revealing the important role of large trees in the network structure. Austr. Ecol. 44, 114–125. doi: 10.1111/aec.12659
Keywords: commensal interaction, epiphyte, modularity, nestedness, specialization
Citation: Hu H-X, Shen T, Quan D-L, Nakamura A and Song L (2021) Structuring Interaction Networks Between Epiphytic Bryophytes and Their Hosts in Yunnan, SW China. Front. For. Glob. Change 4:716278. doi: 10.3389/ffgc.2021.716278
Received: 28 May 2021; Accepted: 01 November 2021;
Published: 23 November 2021.
Edited by:
Brett Scheffers, University of Florida, United StatesReviewed by:
Julian Donald, University of Exeter, United KingdomCopyright © 2021 Hu, Shen, Quan, Nakamura and Song. This is an open-access article distributed under the terms of the Creative Commons Attribution License (CC BY). The use, distribution or reproduction in other forums is permitted, provided the original author(s) and the copyright owner(s) are credited and that the original publication in this journal is cited, in accordance with accepted academic practice. No use, distribution or reproduction is permitted which does not comply with these terms.
*Correspondence: Liang Song, c29uZ2xpYW5nQHh0YmcuYWMuY24=
†These authors have contributed equally to this work and share first authorship
Disclaimer: All claims expressed in this article are solely those of the authors and do not necessarily represent those of their affiliated organizations, or those of the publisher, the editors and the reviewers. Any product that may be evaluated in this article or claim that may be made by its manufacturer is not guaranteed or endorsed by the publisher.
Research integrity at Frontiers

Learn more about the work of our research integrity team to safeguard the quality of each article we publish.