 Bruno Walter Pietzsch
 Felix Johannes Peter2
 Uta Berger
95% of researchers rate our articles as excellent or good
Learn more about the work of our research integrity team to safeguard the quality of each article we publish.
Find out more
ORIGINAL RESEARCH article
Front. For. Glob. Change , 26 July 2021
Sec. Forest Management
Volume 4 - 2021 | https://doi.org/10.3389/ffgc.2021.704930
Sanitation felling is considered as the main measure to protect managed forests from damage due to outbreaks of the European Spruce Bark Beetle. In this study, we investigate the effectiveness of sanitation felling on stopping the spread of a bark beetle population from an un-managed to a managed forest area. For this, we advance an individual-based dispersion model of Ips typographus by adding the influence of wind on the beetle dispersion and by importing GIS data to simulate real world forests. To validate the new model version and to find reasonable parameter values, we conduct simulation experiments to reproduce infestation patterns that occurred in 2015, 2016, and 2017 within the national park Saxon Switzerland, Germany. With the then calibrated model IPS-SPREADS (Infestation Pattern Simulation Supporting PREdisposition Assessment DetailS), we investigate the impact of different factors such as the distance between beetle source trees and the forest border on the amount of damage within the managed forest stand and test the effectiveness of different levels of sanitation felling and its point of action on reducing the amount of damaged trees. As expected, the results of the model calibration show that the direction of wind plays an important role for the occurring infestation patterns and that bark beetle energy reserve is reduced during mass outbreaks. The results of the second experiment show that the main drivers for the amount of damaged trees are the primary attractiveness and the distance to beetle source trees. Sanitation felling effectiveness is highest when performed near the beetle source trees, with considerably high felling intensities and if there is at least some distance to the managed forest. IPS-SPREADS can be used in future studies as a tool for testing further management measures (e.g., pheromone traps) or to assess the risk for bark beetle infestations of forest areas near to wind-felled or already infested trees.
There has been a strong increase of biotic (forest pest) and abiotic (droughts) disturbances in central European forests in recent years. With the ongoing climate change and its expected influence on the current and future disposition of these forests to disturbances, there is no weakening of the threat to be expected (Senf et al., 2019). One of the main beneficiaries of climate change and past forest management decisions in Central Europe is the European Spruce Bark Beetle Ips typographus L. 1758 that is currently exerting a mass outbreak in Germany. While forest management is constantly trying to minimize the impact of this catastrophe, large areas of un-managed forests such as national parks (NLPs) provide insights in natural factors that influence the starting conditions as well as the development of such a bark beetle mass outbreak (Lausch et al., 2011). On the other hand, forest areas adjacent (ADJ) to such unmanaged areas with ongoing mass outbreaks can be under risk of spreading infestations and timber loss, for which reason an adaptive and thorough management is needed (Zolubas and Dagilius, 2012; Mezei et al., 2017). While sanitation felling can reduce the threat for such forests close to unmanaged areas as it is a desirable measure in regards to forest health, timber yield and economic profit, it is inconsistent with most conservation goals (Kulakowski, 2016) further emphasizing the tension field between large protected areas and managed forest.
To assess the risks of infestations and to support the management of protected area as well as managed forests, a variety of simulation models for the system European spruce bark beetle—Norway spruce tree are available. One main goal of such models lies in the assessment of predisposition or infestation risk ranging from single trees over forest stands up to whole landscapes in dependence of influencing factors such as tree age, soil water supply, or forest management regime (Dutilleul et al., 2000; Netherer and Nopp-Mayr, 2005; Overbeck et al., 2011; Jönsson et al., 2012; Thom et al., 2013; Seidl et al., 2016; Mezei et al., 2017; Blomqvist et al., 2018; Rammer and Seidl, 2019). Other simulation models aim at reproducing and predicting the dispersal and infestation patterns of I. typographus (Fahse and Heurich, 2011; Stadelmann et al., 2013b; Kautz et al., 2014, 2016; Doležal et al., 2016; Louis et al., 2016; Økland et al., 2016; Honkaniemi et al., 2018; Koreň et al., 2021), at the prediction of the seasonal brood development (Baier et al., 2007; Jönsson et al., 2007; Ogris et al., 2019) or at the assessment and prediction of population dynamics and its impact as disturbance factor on ecosystem levels (Seidl et al., 2007, 2008, 2009; Marini et al., 2013; Temperli et al., 2013; Rammer and Seidl, 2015). Challenges associated with modeling bark beetle infestation are as diverse as the different model types used. Models on the individual tree or even beetle level often times reach computational cost that forbid their application on scales larger than the local scale or for mass outbreak conditions. On the other hand, models on a higher spatial scale need to make assumptions about mean properties of forest stands, site conditions, or timing, location, and type of forest management measures such as sanitation felling. With all the mentioned simulation models, there is still a lack for assessing the impact and possible effectiveness of forest protection management against the spread of I. typographus on very small spatial and temporal scales. With such a fine grained tool, it would be possible to investigate planned management measures on previously assessed risk hot spots in a quasi real time manner and to adapt the intended protection strategy accordingly. To achieve this, we combined the following well known and applied models into one: the pre-disposition assessment systems PAS (Netherer and Nopp-Mayr, 2005), the phenology model PHENIPS (Baier et al., 2007) and, the infestation pattern simulation IPS (Kautz et al., 2014, 2016). PAS generates infestation risks for whole forest stands from forest inventory data and of the forest soil, which can be used to translate given GIS data into a primary attractiveness of spruce trees for bark beetles. PHENIPS estimates the start and duration of I. typographus life stages for varying spatial resolutions and can be utilized to calculate the onset of beetle swarming in spring. IPS simulates the beetle dispersal and their infestation pattern in a artificial forest on the individual-based level.
The so derived model is called IPS-SPREADS (Infestation Pattern Simulation Supporting PREdisposition Assessment DetailS) and can be used to simulate the dispersal and infestation of bark beetles within a real forested landscape on the individual-based level on a small spatial resolution (5 × 5 m) under varying management strategies. To calibrate and test ISP-SPREADS, data on infestation patterns of the Saxon Switzerland NLP in Germany is used to reproduce those patterns from 2015, 2016, and 2017. Furthermore, simulation experiments are presented which assess the impact of sanitation felling on the infestation risk of forests adjacent to the NLP on five different research areas as felling infested trees is considered to be one of the main measures against the spread of I. typographus (Jönsson et al., 2012; Kulakowski, 2016). For our study, we formulated two hypotheses which we want to investigate: (1) IPS-SPREADS is capable of reproducing the severity and direction of infestation development as observed within the Saxony Switzerland NLP from 2015 to 2017. (2) Sanitation felling at the border of the NLP can effectively reduce the damage in adjacent managed forest areas.
A complete, detailed model description, following the ODD (Overview, Design concepts, Details) protocol (Grimm et al., 2006, 2010, 2020) can be found in Supplementary Material 1. The overall purpose of our model is to understand and investigate the impact of individual traits of beetles and trees as well as measures of bark beetle management (e.g., sanitation felling) on the spatial pattern of infestations of the Spruce Bark Beetle (I. typographus). Specifically, we are addressing the following questions: Which are the main drivers of Spruce Bark Beetle infestation patterns? How does sanitation felling impact the spreading of Bark Beetles to other forests? To consider our model realistic enough for its purpose, we use patterns of location, number and progression from 2015, 2016, and 2017 of infested spruce trees (Picea abies) within the Saxon Switzerland NLP located in the East of Germany.
The model includes the following entities: patches, bark beetles and volatiles. The state variables characterizing these entities are listed in Table 1. The global environment (a forested area) is characterized by wind speed and direction. Patches represent 5 × 5 m areas containing one spruce, one pheromone trap or are empty if neither a spruce tree nor a trap is present. Characteristics of these patches include their primary and secondary attractiveness for bark beetles, a capacity for infesting and emerging beetles and, a level of infestation: Not infested, infested or, fully occupied. Patches are squares in the horizontal plane with information about tree height stored within, uniform size and shape. Beetles have unique values of energy level and energy efficiency. Volatiles are emitted by beetles infesting trees or by pheromone traps and carry information about the location and the total attractiveness of their source at the time of emission. The spatial extent depends solely on the extent of the imported GIS data. If a mass outbreak of I. typographus is to be simulated, a maximum extent of a quarter square kilometer is advised. The temporal resolution of IPS-SPREADS is defined by time steps, where 200 steps resemble 1 day in reality. The overall length of the simulation depends on the chosen parameter settings (e.g., if one, two, or three generations are to be simulated). The simulation ends as soon as all beetles emerged from the beetle source trees and no more dispersal flight or tree attacks are taking place.
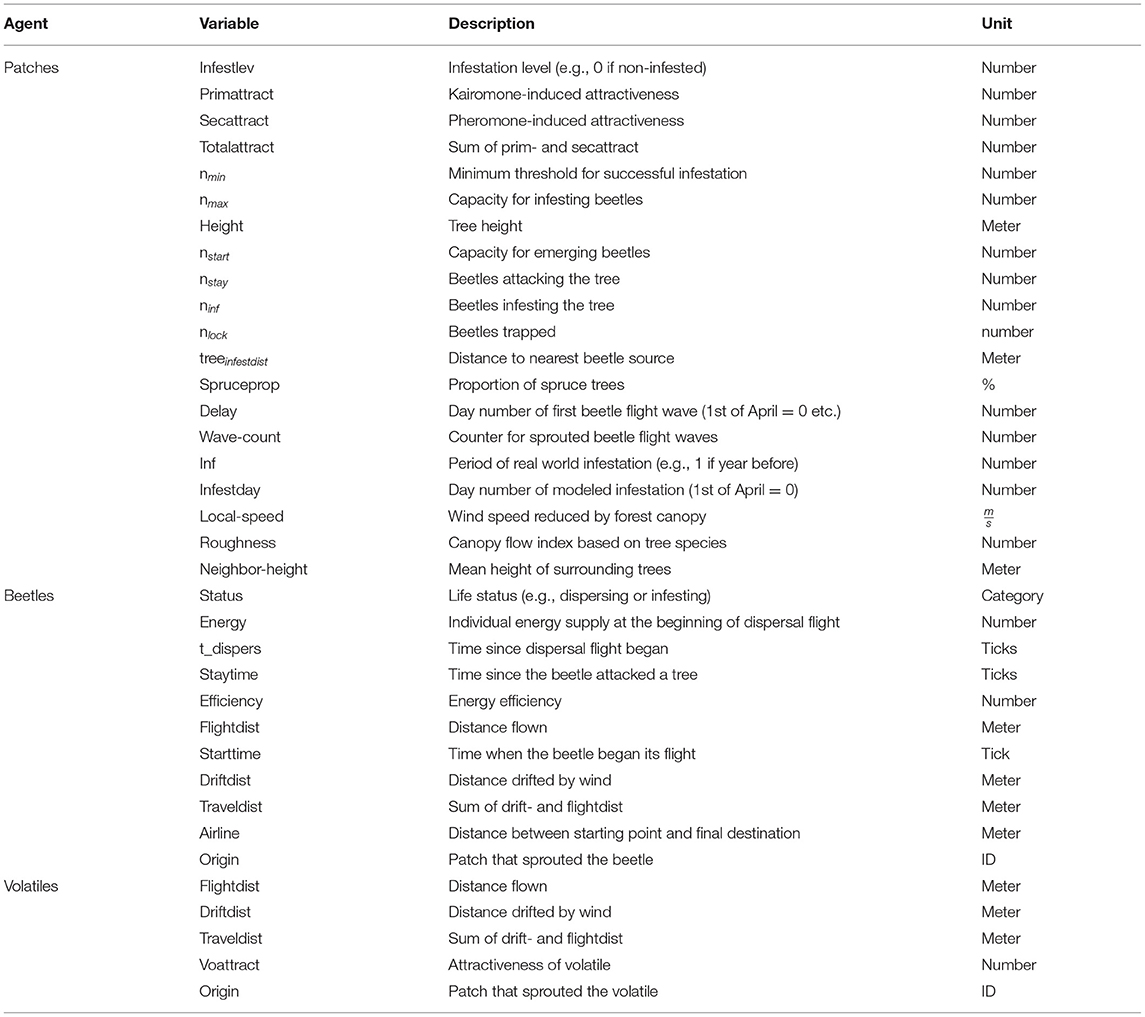
Table 1. Entities and state variables of the IPS-SPREADS model.
The most important processes of the model, which are repeated every time step (Figure 1), are the emission of volatiles by infested trees and pheromon traps, the beetle flight, the beetle decision to attack a patch and the defense of trees that are attacked by beetles. Each simulation begins with the model setup during which GIS data like tree height or the begin of beetle flight is imported and used to create the model world by distributing spruce trees and beetle source trees. After the artificial environment is set up, the first day of the simulation starts with the generation of beetles on all beetle source trees and the updating of all plots in the model interface. Then, on each time step, volatiles are emitted by infested trees as well as deployed pheromone traps and the beetles are moved either to the source tree of the most attractive volatile within the beetles perception range or to a neighboring patch using a correlated random walk. After all beetles were moved, it is checked if the beetles energy reserve is higher than the total attractiveness of the beetles current patch. If so and if the current patch is a pheromone trap, the beetle is killed by the trap. If the target is an already infested tree, the beetle is added to the infesting beetles on this patch. Otherwise, the beetle will wait on the given tree for 1 day (200 time steps). If enough further beetles attack the same tree within this 1 day, the tree defense will be overcome and the tree will be infested. Otherwise, all beetles waiting on the patch are killed by the tree defense. Every time 1 day (200 time steps) has passed, it is checked if all beetles of the given beetle generation were generated and dispersed. If this is not the case, the next day starts with the generation of beetles and the update of all plots. Otherwise (if the whole beetle generation was simulated), bark beetle management is taking place and the predefined proportion (e.g., 50%) of infested trees is removed from the model world by sanitation felling. If more than one beetle generation was defined, all infested trees that were not removed by sanitation felling are shifted to beetle source trees for the next beetle generation. After this, a new day with the same schedule of actions as described above begins (generation of beetles, update of plots, emission of volatiles, movement of beetles and so on). If the predefined amount of generations was simulated and the sanitation felling for each of those generations took place, the model results are calculated, the pattern of infested trees is exported as a raster layer (.asc file) and, the simulation stops.
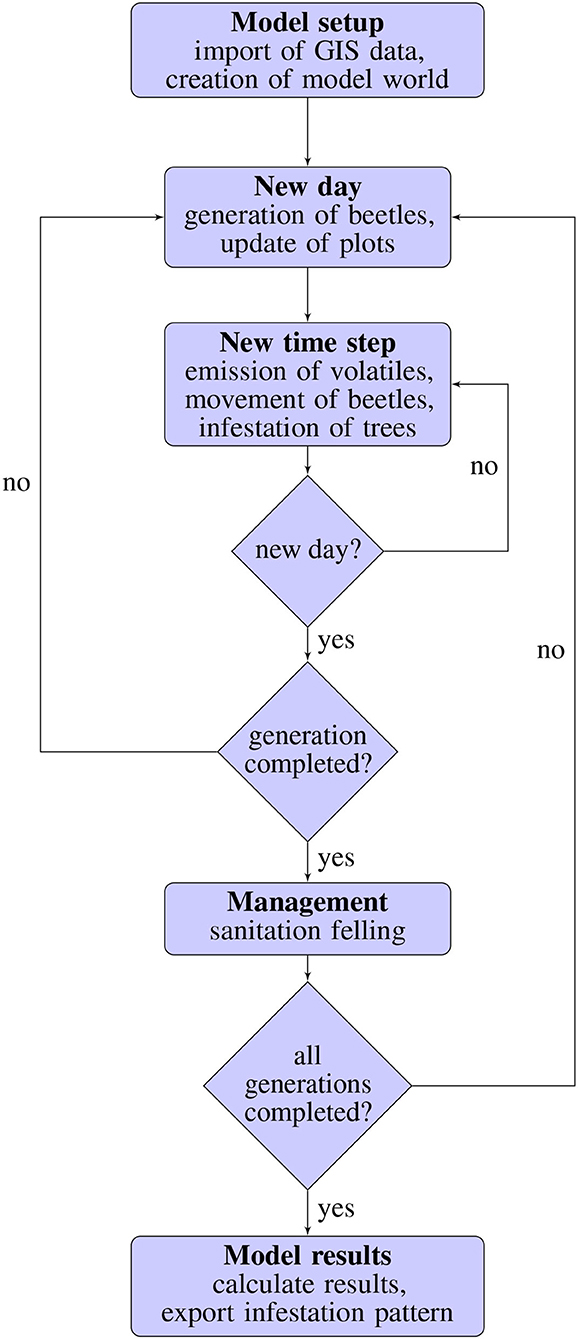
Figure 1. Flow chart showing the schedule for IPS-SPREADS. A new day begins every 200 time steps.
The most important design concepts of the model are adaptation, sensing and interaction. Dispersal and infestation patterns are the key results of IPS-SPREADS, which are strongly influenced by the beetles' decision when to attack an attractive patch (adaptation), their sensing of susceptible trees as well as the interaction with other beetles already infesting such trees and fully occupied trees (repelling further attacking beetles). Furthermore, the secondary attractiveness of trees is adapted (zero at the beginning of each simulation) according to the number of beetles attacking (weak increase) or infesting (strong increase) the given tree. If the capacity for infesting beetles of a tree is reached, its primary, secondary and total attractiveness is set to zero, which repels further beetle attacks representing the production of anti-aggregation pheromones by the infesting beetles.
Model dynamics are driven by input data representing (1) the location (derived from forest inventory data), size (derived from the digital elevation and surface model provided by the NLP) and attractiveness (calculated with PAS Netherer and Nopp-Mayr, 2005 using stand and site data from the NLP) of susceptible spruce trees; (2) location of beetle source trees (provided by the NLP), (3) day of beetle flight begin [calculated with PHENIPS (Baier et al., 2007) using the digital elevation model provided by the NLP as well as daily air temperature and radiation which were obtained from several climate stations of Germany's federal weather service DWD].
To calibrate and test the newly build IPS-SPREADS model, four different study sites with characteristic infestation patterns from the Saxon Switzerland NLP in 2016 and 2017 were selected (Table 2) and imported into IPS-SPREADS (Figure 2). These research areas were chosen so that a group of infested trees was in the center, no further infested tree groups were within a 500 m radius and the real world infestations of the following year were completely within a 250 m radius.
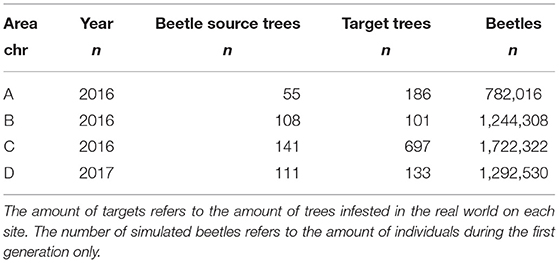
Table 2. Characteristics of research areas used for the calibration of IPS-SPREADS.
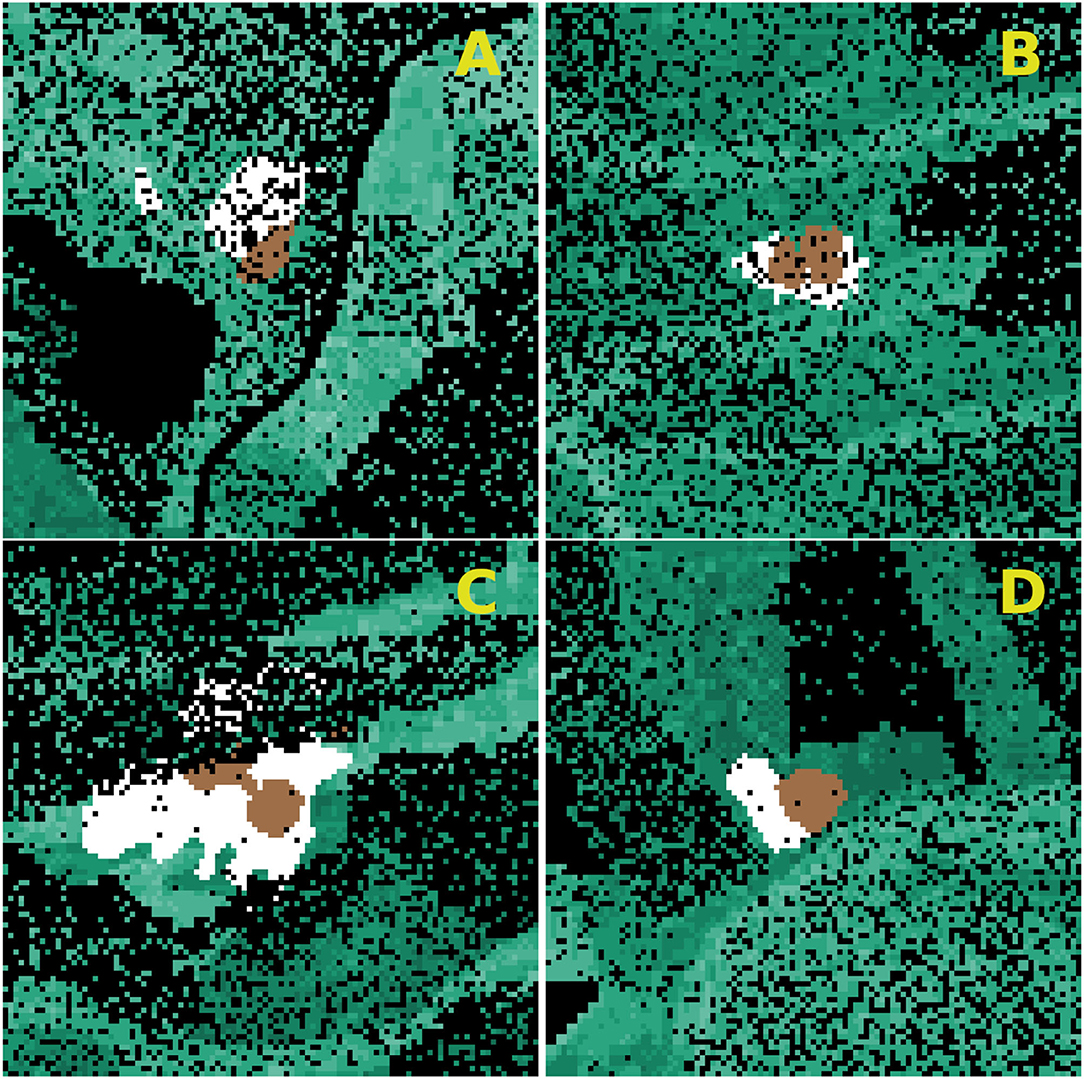
Figure 2. Infestation patterns chosen (research sites A–D) for the calibration of IPS-SPREADS. Brown, beetle source trees; green, susceptible spruce trees; white, spruces infested in reality (target trees); black, other (for example other tree species, roads, or rivers).
After testing the impact of all model parameters on the amount and pattern of infested trees (global sensitivity analysis, Supplementary Material 2), the parameters swarming time, mean beetle energy, amount of beetle generations, wind direction and speed were investigated during the calibration of IPS-SPREADS as they are the main drivers for the resulting infestation patterns. The range of values for these parameters was retrieved from literature (Table 3). The duration of swarming and the amount of generations for the experiments were derived from the application of PHENIPS (Baier et al., 2007) for the NLP in the investigated years 2015–2017. All other parameters received their standard values (Supplementary Material 1: ODD Protocol). To achieve a reasonable trade off between amount of simulated parameter combinations and the high computational cost of IPS-SPREADS for the mass outbreak conditions investigated, a random sampling was performed: 200 simulation experiments for each research area were run, where for each run a random value for each parameter out of the displayed ranges was sampled using a uniform distribution. This resulted in 200 different parameter combinations for each site and a total of 800 simulation experiments for the calibration of IPS-SPREADS. All simulation experiments were performed on the high-performance computing machines of the TU Dresden using the BehaviorSpace-Tool of NetLogo version 6.0.4 (Wilensky, 1999).
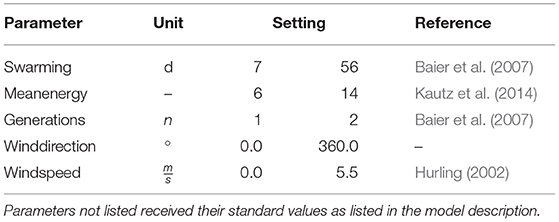
Table 3. Parameter settings for IPS-SPREADS during the model calibration experiments with a reference for the chosen ranges.
To calculate the deviation between the model prediction and the real world infestation patterns (the white patches in Figure 2), following measure of error was calculated:
n_inf_match is the number of infested trees within the model that match the real world data, n_inf_model is the total number of infested trees within the model and, n_inf_real is the number of trees infested in the real world. If no trees infested within the model run matched the real world data (n_inf_match = 0), the error e was set to 100%. The focus of this particular measure of error was to achieve high numbers of infested trees that match the real world data while keeping the total number of infested trees as low as possible. Other measures of error which focused more or only on the number of matching trees resulted in three or four times the total amount of infested trees within the model. On the other hand, a measure of error focusing on the smallest possible amount of falsefully infested trees resulted in model runs with only one to 10 trees in total. The measure of error (Equation 1) was then used to find the parameter combination with the highest agreement between model prediction and real world data on each research site. Furthermore, this measure was used to derive parameter values for swarming time, beetle energy and wind speed, which provided the highest fits across all research sites. For this, scatter plots and locally estimated scatter-plot smoothing was utilized. To test the robustness of the so derived parameter values, one model run was performed on each research site using these values and the achieved prediction error was compared to the best fit during the random sampling. For all analyses described, the free statistical environment R (R Core Team, 2020) in version 3.6.3 and a variety of packages were used (Table 4).
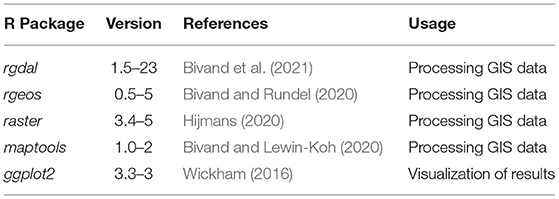
Table 4. R packages used for the calibration and application of IPS-SPREADS.
To investigate the impact of sanitation felling onto the risk of spreading of infestations from NLP to ADJ, five research areas were chosen and imported into IPS-SPREADS (Figure 3). The areas were chosen so that the center was defined by a group of infested trees and the shortest distance to the outer NLP border was equal or less to 500 m. Possible further cohorts of beetle source trees were removed on each site to set the focus only on the cohort in the center of each research area. The amount of beetle source trees, the amount of beetles starting within the first generation, the direction and distance of the nearest ADJ as well as the susceptibility of the spruces inside and outside the NLP varied between the selected research sites (Table 5).
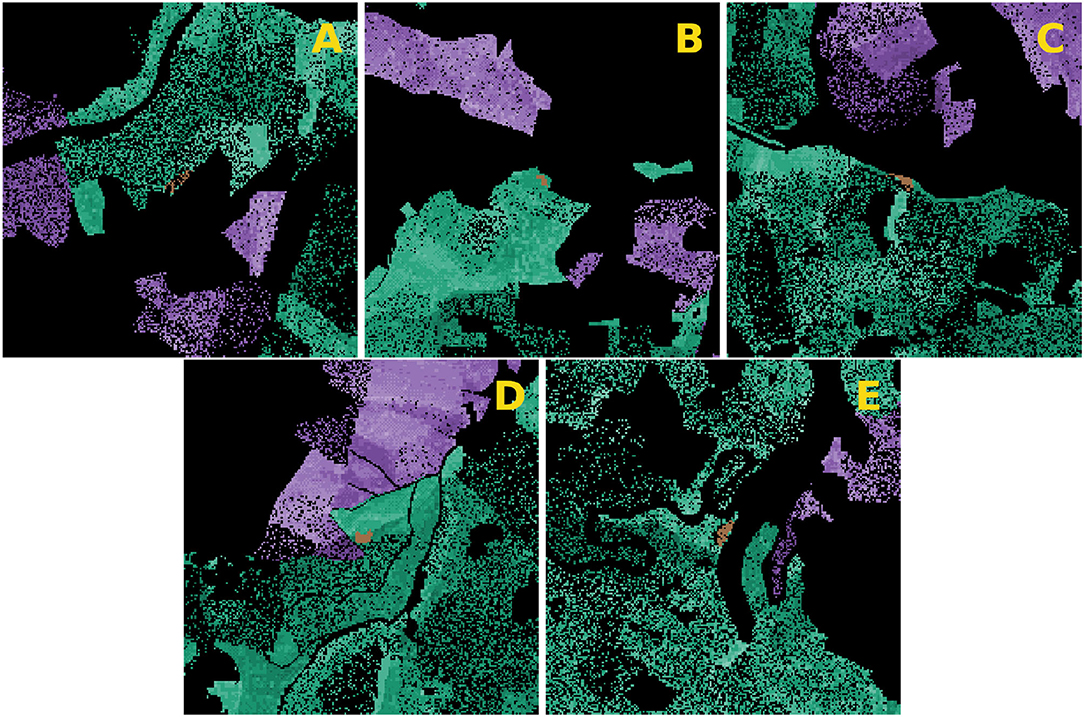
Figure 3. Representation of the five research sites (labeled A–E) used for the application of IPS-SPREADS. All spruces outside the NLP (national park) are colored purple. Green, spruce trees inside NLP; brown, beetle sources; black, everything else (meadow, roads, other tree species).
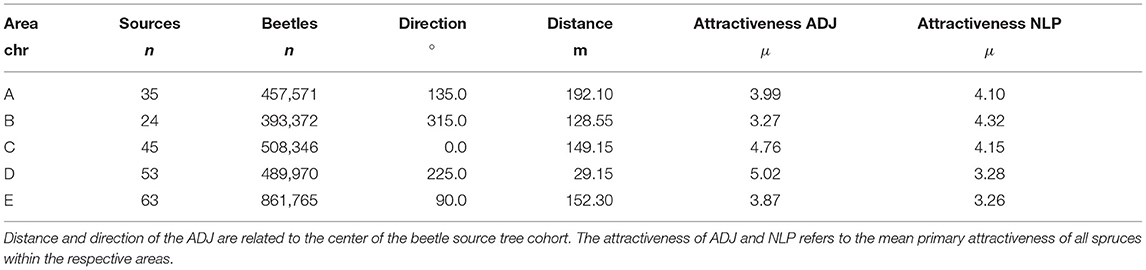
Table 5. Properties of the five research sites investigated during the test of sanitation felling effectiveness on the spread of Ips typographus from the national park (NLP) to the adjacent forest area (ADJ).
Parameters which were reported as insignificant during the sensitivity analysis of IPS-SPREADS (Supplementary Material 2) received their standard values. Influencing factors with a high influence on beetle infestation success as well as on the amount, direction and the distance of infested trees were given values fitted during the model calibration (section 3.1). This included wind speed, beetle swarming time and mean beetle energy. The wind direction and the amount of beetle generations was set to impose a worst case scenario for the forest protection management of the NLP on each investigated research site (Table 6).
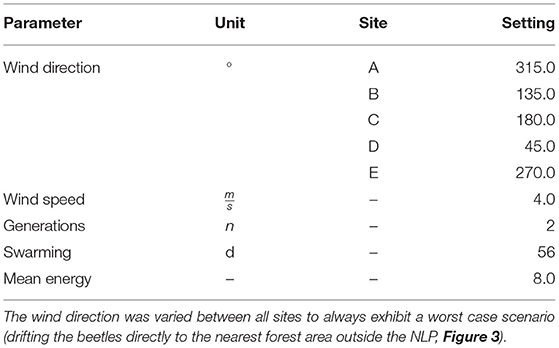
Table 6. The settings of all parameters with high influence on direction, distance and amount of infested trees as used for the simulation experiments on testing the effectiveness of sanitation felling.
To depict different scenarios of forest protection management (e.g., a forest protection buffer zone which could be placed inside, outside or on both sides of the border), the intensity of sanitation felling was varied from 0 to 100% in 25% steps. Additionally, the felling intensity inside and outside the NLP was varied simultaneously leading to a total of 25 combinations to be modeled. By repeating each combination 40 times to account for the high stochasticity of individual-based models such as IPS-SPREADS and by using five different research areas, a total amount of 5,000 simulation experiments had to be carried out for the investigation. We chose to simulate 40 repetitions of each combination based on the assumption that the probability of a 41st run to lie outside the range of the previous 40 is 2.5 % (1/40).
To investigate the impact of varying properties of the research sites on the amount of damaged trees without any sanitation felling, the mean amount of trees killed outside the NLP without sanitation felling taking place was used to generate a point plot in dependency of those properties (amount of beetle source trees, amount of beetles within the first generation, distance between beetle source trees and the ADJ, mean primary attractiveness of ADJ as well as NLP). To assess the impact of each property, a linear model was fitted and validated using an ANOVA.
In order to assess the impact of sanitation felling on the amount of damaged trees outside the NLP, the effectiveness after Abbott (1925) was calculated and visualized as tile plot for each research area. For this, we calculated the mean amount of trees killed outside the NLP when no felling took place and used this as the control variant for the calculation of effectiveness. We then calculated the mean number of trees killed outside the NLP for each combination of sanitation felling intensity as well as its point of action and used this number as the treatment for the effectiveness of Abbott (1925). This calculation was done for each of the five research sites individually.
For the experimental setup and all analysis, the free statistical environment R (R Core Team, 2020) in version 3.6.3 and the same packages as during the calibration of IPS-SPREADS were used (Table 4).
While IPS-SPREADS can easily predict the correct amount of infested trees on each investigated research area, predicting the correct location comes along with nearly the same amount of wrongly infested trees even on the best fitting parameter combinations during the random sampling (first four rows of Table 7). Nevertheless, the predicted infestations of the fitted parameter values agree well enough with the observed patterns to be used as base setting of IPS-SPREADS during the sanitation felling tests in the second part of this study as they do not underestimate the threat of spreading bark beetle infestations. Interestingly, best agreements between model and reality were achieved on all sites with decreased beetle energy levels and high swarming durations. The amount of beetle generations varied throughout the investigated research areas, where one generation scored best on sites with fewer and nearer follow-up infestations and vice versa for two generations. The wind speed intensity seems to play only a minor role for the correct reproduction of infestation patterns, but it is still of great importance as it affects the direction of infestation the most.
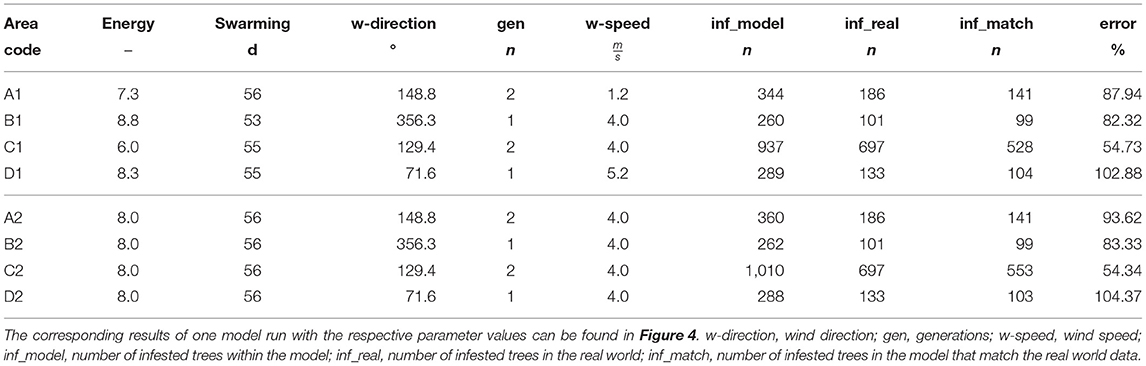
Table 7. Parameter combinations with the lowest prediction error for each research area during the random sampling (first four rows) and derived parameter combinations with their prediction errors (last four rows).
Using scatter plots and locally estimated scatter-plot smoothing (Supplementary Material 3), same parameter values on all sites for beetle energy, beetle swarming duration, and wind speed were chosen (last four rows of Table 7) and simulated once on each research area (Figure 4). In combination with the best value for wind direction and beetle generation amount on each research site during the random sampling, these derived parameter values scored roughly the same prediction errors as the best fits during the random sampling. With these chosen and robust parameter values for beetle energy, beetle swarming duration and wind speed, simulation experiments investigating the effectiveness of sanitation felling could than be carried out. Beetle generations and wind direction as varying parameters were set to impose a worst case scenario on each of the given research sites during the model application.
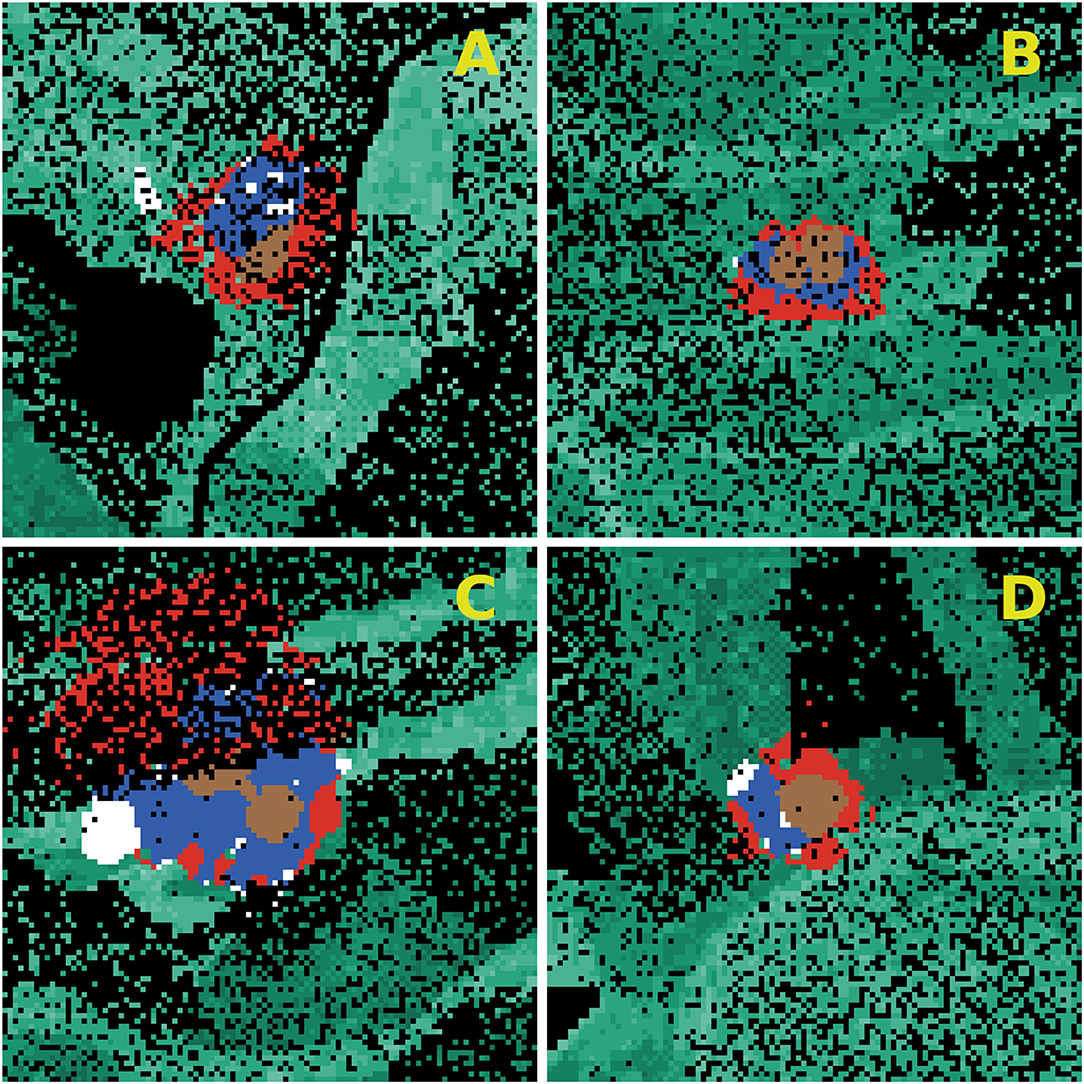
Figure 4. Simulation results for the fitted parameter combinations on the four research sites (A–D). The values for beetle energy, wind speed, and beetle swarming duration are the same on each research site while the values of wind direction and beetle generation amount are taken from the best fits during random sampling. The corresponding parameter values and prediction errors can be found in Table 7. Brown, beetle source trees; red, trees infested only in the model; white, trees infested only in reality; blue, trees infested in the model matching the real world data; green, spruce trees; black, everything else (e.g., other tree species, meadow, roads).
The mean amount of damaged trees outside the NLP of all 40 repetitions of the control variant (no sanitation felling applied) on each research site revealed a high influence of mean primary attractiveness and distance between beetle source trees and ADJ (Figure 5). The amount of beetle source trees as well as the primary attractiveness of spruces within the NLP had only a small impact while the amount of beetles emerging within the first beetle generation had none at all. Performing a ANOVA analysis on the displayed linear models revealed that only for the primary attractiveness of ADJ a significant influence on the amount of damaged trees without sanitation felling could be proven.
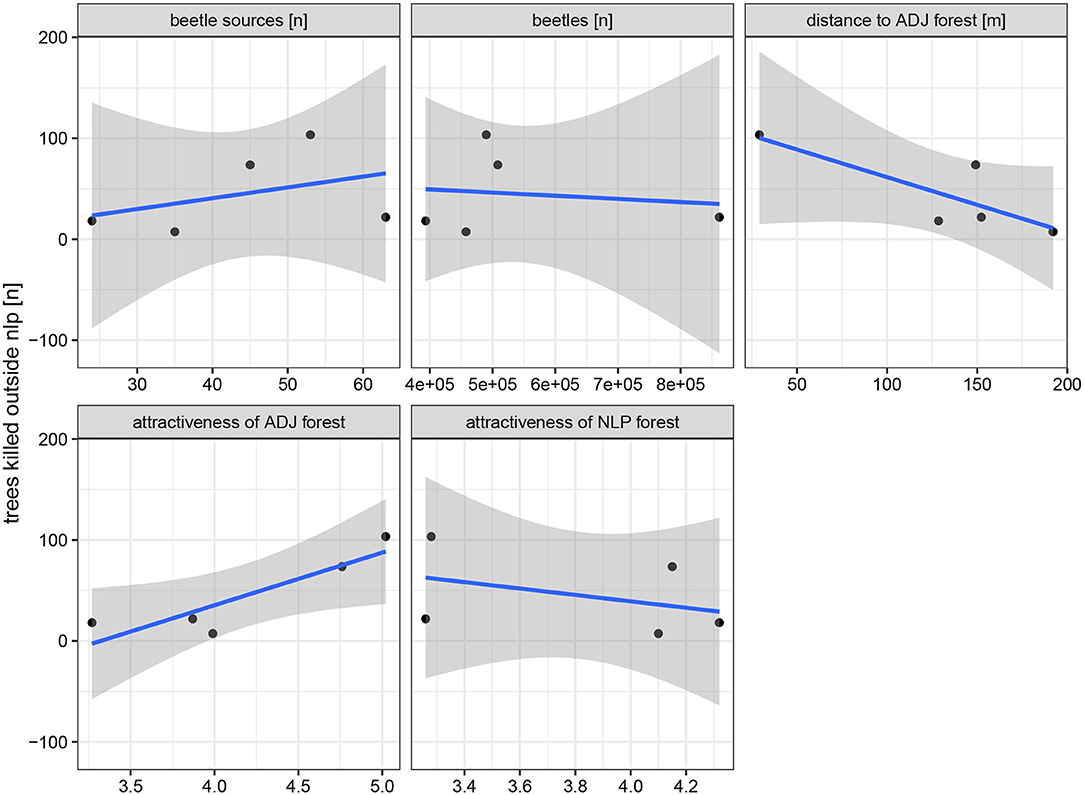
Figure 5. Mean amount of damaged tress [n] outside the national park (NLP) for the control variants (no sanitation felling applied) of each research area. Each panel displays a different property (from top left to bottom right): Amount of beetle source trees, amount of emerging beetles during the first generation, distance between source trees and adjacent forest area (ADJ), mean primary attractiveness of ADJ and mean primary attractiveness of the NLP. Blue lines display a linear model fitted with the smooth function of the R package ggplot2 and gray areas highlight the 95% confidence interval.
The calculated effectiveness highlights the possible reduction of damaged trees outside the NLP by applying sanitation felling after each beetle generation (Figure 6). While felling infested trees inside the NLP always exhibited a strong reduction of damaged trees, felling outside the NLP was only effective on 60% of all sites. This behavior is in direct relationship to the amount of NLP forest area between the beetle source trees and ADJ: On sites B and E, where the sanitation felling outside the NLP has no impact at all, there is some distance with spruces between the beetle source trees and the NLP border. On sites with no NLP forest between the beetle sources and ADJ, the sanitation felling outside the NLP becomes much more important and reaches reduction levels of up to 69% without felling a single tree inside the NLP. The overall mean effectiveness (bottom right panel of Figure 6) shows that only with the removal of 75% or more of infested trees inside the NLP or in combination with felling outside the NLP can achieve noteworthy damage reduction effects.
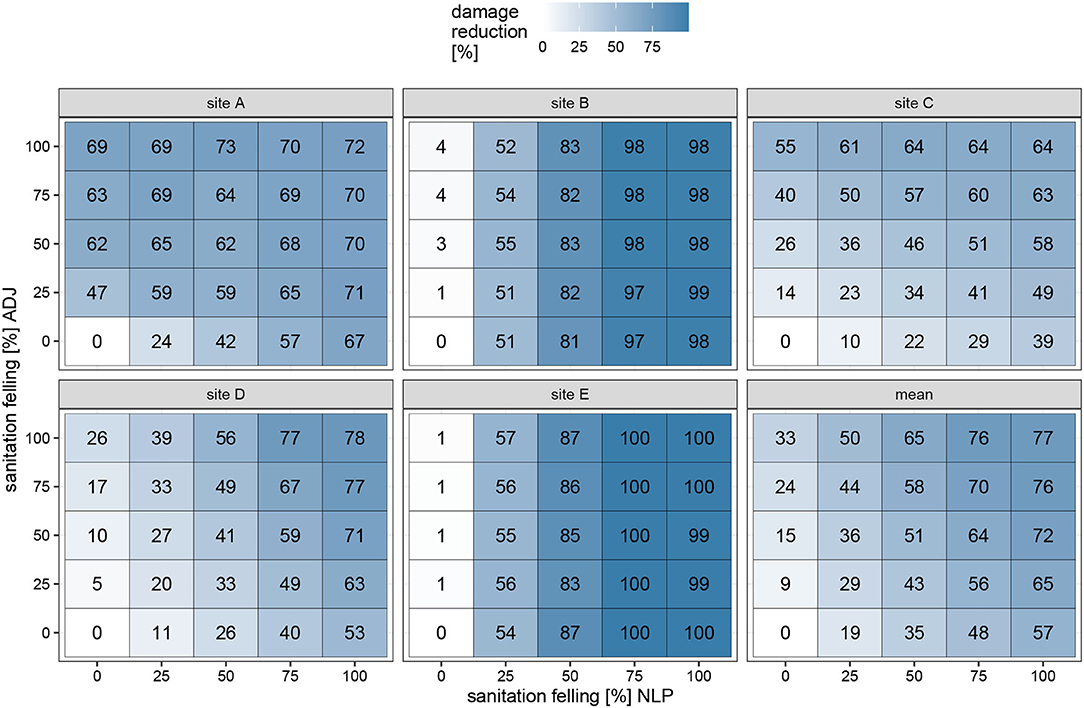
Figure 6. Mean effectiveness of reduction of damaged trees outside the NLP [%] of the 40 repetitions in dependency of sanitation felling intensity inside the NLP (x axis) and outside the NLP (y axis). Each panel displays the effects on one of the five research sites and the mean over all sites combined. The effectiveness is calculated following (Abbott, 1925).
In this study, we introduce the newly developed IPS-SPREADS, a combination of three well accepted models on the European spruce bark beetle (I. typographus): the predisposition assessment systems PAS (Netherer and Nopp-Mayr, 2005), the phenology model PHENIPS (Baier et al., 2007) and, the individual-based model IPS (Kautz et al., 2016). By incorporating the ability to utilize GIS data, IPS-SPREADS is applicable on any real world landscape and is capable of investigating the impact of different management measures as well as climate change on the dispersal and infestation patterns of I. typographus. By using patterns of real world infestations of a NLP inside Germany, we test our model (sensitivity analysis), calibrate its most important parameters and investigate the effectiveness of sanitation felling against the spread of the European spruce bark beetle. In the following paragraphs, the results of the model calibration as well as its application are discussed.
Decreased energy due to high intra-specific competition plays a major role in populations of I. typographus (Salle et al., 2005). Results of Botterweg (2009) show that the mean relative fat content of emerging beetles decreased to 86.5% when the breeding density was doubled. These findings support the results of the calibration of IPS-SPREADS, where reduced mean beetle energy levels scored the smallest errors. Relating the fitted value for beetle energy to the standard value of the original model IPS (Kautz et al., 2014, 2016), a reduction of 20% can be expected when mass outbreaks of I. typographus take place. The relatively high swarming duration can be explained with the overall dry and hot weather that was observed in the simulated years (2016 and 2017). The online version of PHENIPS (Baier et al., 2007) for the German federal state Saxony, in which the NLP is located, calculated for the years 2016, 2017, and 2018 theoretical swarming durations of 100, 101, and 120 days, respectively for the NLP1. Distributed on two beetle generations, a theoretical swarming duration between 50 and 60 days is achieved and in accordance with the values fitted during the calibration of IPS-SPREADS. The differences in the number of beetle generations between the investigated research sites could be connected with different elevations of those sites (Baier et al., 2007; Wermelinger et al., 2012; Jakoby et al., 2019) or the presence and absence of forest protection management. Nevertheless, as the data provided by the NLP does not state when in the course of the year the infestation took place, all trees from 1 year are considered as beetle source trees for the following year. Because of this, even trees infested in early spring are considered as beetle source trees for the next year, which should lead to an overestimation of beetles emerging during the first beetle generation. Because of that, sites with fewer and nearer infested trees achieve lower errors with only one beetle generation as the number of beetles within this one generation is sufficient to infest the same amount of trees as observed in reality. More precise data on the timing of infestation or at least the affiliation to spring or summer infestation would result in better fits and probably lead to a fitted amount of two generations on all investigated sites. The impact of wind direction and intensity on the distance and direction of infested trees in relation to the beetle source trees is directly linked to the general impact of wind on the dispersion of airworthy insects as mentioned by Johnson (1969) and Pasek (1988) as well as on the impact on the pheromones produced by the beetles to attract more individuals to already infested trees (Mankin et al., 1980; Strand et al., 2009). The wind speed does not exert an influence as big as the wind direction, which can be explained with the overall low wind speeds that are reached within the forest canopy. The average wind speed (local-speed in the model) never exceeded 1 m per second on all research sites. As the beetles do not (yet) stop their dispersal flight due to high wind speeds, the maximum wind speed was not set beyond 5.5 m per second, which is reported to be the maximum wind speed in which I. typographus still disperses (Hurling, 2002). The overall fit could have been improved if another calibration cycle with reduced parameter sections would have been performed. As the overall fit was reasonable and the simulation cost considerably large, further model runs were not performed. One of the main limitations for IPS-SPREADS to reproduce real world infestation patterns lies within the modified PAS for calculating the primary attractiveness of each tree. Firstly, the data provided by the NLP is limited in its temporal and spatial resolution. For example, the variation of important factors for spruce tree vitality such as acute drought stress (Netherer et al., 2019) are not taken into account as only long term means are used for the calculation in this study. Secondly, the original PAS was developed to calculate predispositions for whole forest stands and not for the individual trees. Factors influencing the individual composition of spruces can vary greatly between each 5 × 5 m patch and those small scale differences were not taken into account. Further improvements could be achieved by using open accessible sentinel radar data which provide a high temporal resolution or by using promising analysis methods such as machine learning, which could improve the results of the predisposition assessment while using the same base data as done in the presented study (Rammer and Seidl, 2019).
The increase of damaged trees outside the NLP with increasing primary attractiveness of those trees is a logical consequence as the tree defense is directly calculated from the primary attractiveness. As such, higher primary attractiveness results in lower tree defense and therefore lower beetle densities are needed to inflict a successful infestation (Kautz et al., 2014, 2016). As the primary attractiveness was calculated based on the PAS (Netherer and Nopp-Mayr, 2005), high levels of primary attractiveness imply worse conditions for the trees outside the NLP such as low water supply or poor nutrient availability. With higher distances between beetle source trees and the ADJ forest area lower amounts of damaged trees occurred. This connection between distance to infested trees and infestation risk is often reported: New infestations occur mostly within 100 and up to 500 m around old infestations (Wichmann and Ravn, 2001; Kautz et al., 2011; Zolubas and Dagilius, 2012; Potterf et al., 2019), which is in turn connected to decreasing beetle densities with higher distances from beetle sources (Angst et al., 2012; Hinze and John, 2020). The amount of beetle source trees as well as the amount of beetles starting in the first generation from those trees had no impact on the amount of damaged trees outside the NLP. This phenomenon can be understood as indication that the resulting beetle densities in the ADJ forest areas were always high enough generate a damage there. If smaller amounts of beetle source trees or starting beetles would have been tested on the same research sites, there would have been a minimum amount necessary for damage outside the NLP to happen. With this, it would be possible to determine critical amounts of beetle source tree cohorts for damages to occur and highlight further possibilities to facilitate IPS-SPREADS as a risk assessment tool. As most infestations occur in the direct surroundings of previous infested trees, higher primary attractiveness and therefore lower tree defenses of spruces within the NLP reduce the risk of damage outside the NLP. This is in direct relationship to the aforementioned lower beetle densities which are further lowered if a given amount of beetles is attracted to susceptible trees before they can reach the ADJ forest area.
The applied sanitation felling happened only between the two simulated beetle generations as this is reported to be the optimal timing (Wichmann and Ravn, 2001) and to depict realistic frequencies that could be applied to a whole NLP and its surrounding forest areas. A complete reduction of damage outside the NLP was only achieved on sites with appropriate amount of NLP forest area between the beetle source trees and the NLP border. On the one hand, this is directly related to the aforementioned higher infestation emergence near old infestations or wind-thrown trees (Wichmann and Ravn, 2001; Kautz et al., 2011; Zolubas and Dagilius, 2012; Havašová et al., 2017; Potterf et al., 2019), as this leads to fewer damaged trees outside the NLP to begin with. On the other hand, trees cut during the sanitation felling outside the NLP were also counted as damaged trees in this study. Therefore, even with a removal of 100% of infested trees outside the NLP, there were still trees being damaged. In accordance with Stadelmann et al. (2013a) the results of the presented model application indicate, that increasing sanitation felling reduces the amount of damaged trees. It is also reported that sanitary felling of more than 80% or more than 95% is needed to substantially reduce bark beetle disturbances (Dobor et al., 2020a,b), further validating the model results. Similar intensities are needed relating to the amount of individual beetles, where more than 80% of the population should be killed to avoid bark beetle outbreaks (Fahse and Heurich, 2011).
The advantages of IPS-SPREADS in comparison to other simulation models for I. typographus are in its high spatial and temporal resolution, which allows it to be applied as a tool to assess the effects of different management strategies in any given real world forest on a daily bases. For example, it is possible to test the planned management strategy for a given infestation cohort and revise it according to the model results and to achieve the lowest possible damage for the next days, weeks, or month. This also emphasizes the possibility of IPS-SPREADS to be used as a risk assessment tool. As an older version of the model was used to calibrate the implementation of pheromone traps using results of mark recapture experiments similar to the model of Doležal et al. (2016), it is possible to extract the relation between the number of trapped beetles and the total size of the beetle population within a given forest. This relation could then be used to improve the estimation of bark beetle activity throughout the year more accurately in the given area. Disadvantages of the presented model are in the high computational cost which exceed the capabilities of average computers if mass outbreak conditions are to be simulated like during our model calibration. For such conditions other, less computational intensive models are to be preferred to analyze the dispersal and infestation patterns (Fahse and Heurich, 2011; Honkaniemi et al., 2018) or to perform risk assessment on larger scales (Dutilleul et al., 2000; Overbeck et al., 2011; Blomqvist et al., 2018). Nevertheless, if IPS-SPREADS is applied for initial infestations or the development of early outbreak stages, thanks to thorough code optimization the model performs well even simulating all beetles individually. For longer study periods or broader areas IPS-SPREADS is not suitable as it does not take into account changes in forest structure, water household or weather throughout the year or between years and it does not account for disturbances such as wind, fire or management and their impact on host tree availability, population dynamics and management in return. For this, other available simulation models (Seidl et al., 2007, 2008, 2009; Temperli et al., 2013; Rammer and Seidl, 2015, 2019) are far more appropriate. Another shortcoming of IPS-SPREADS is in the dependency on the availability of various base data to be applicable in a given forest, such as digital elevation model, daily temperature and irradiation, canopy closure, spruce proportion, or soil properties. For future applications of IPS-SPREADS it is therefor planned to make full use of publicly available and globally present data such as from the European Union's earth observation program Copernicus.
The datasets presented in this study can be found in an online repository: https://github.com/bwpietzsch/IPS-SPREADS.
BP developed the model, designed and carried out the experiments, analyzed and interpreted the results, and wrote the article. FP developed parts of the model and commented on the article. UB supervised the whole project and revised the article. All authors contributed to the article and approved the submitted version.
BP was supported by the PhD scholarship (20017/493) of the German Federal Environmental Foundation; Deutsche Bundesstiftung Umwelt, An der Bornau 2, 49090 Osnabrück, Germany.
The authors declare that the research was conducted in the absence of any commercial or financial relationships that could be construed as a potential conflict of interest.
All claims expressed in this article are solely those of the authors and do not necessarily represent those of their affiliated organizations, or those of the publisher, the editors and the reviewers. Any product that may be evaluated in this article, or claim that may be made by its manufacturer, is not guaranteed or endorsed by the publisher.
We thank three reviewers for their insightful and constructive comments. We also thank the Center for Information Services and High Performance Computing (ZIH) at TU Dresden for generous allocations of computer time.
The Supplementary Material for this article can be found online at: https://www.frontiersin.org/articles/10.3389/ffgc.2021.704930/full#supplementary-material
1. ^https://ifff-server.boku.ac.at/wordpress/index.php/language/de/phenips-online-monitoring/phenips-online-deutschland/phenips-sachsen/
Abbott, W. S. (1925). A method of computing the effectiveness of an insecticide. J. Econ. Entomol. 18, 265–267. doi: 10.1093/jee/18.2.265a
Angst, A., Rüegg, R., and Forster, B. (2012). Declining bark beetle densities (Ips typographus, Coleoptera: Scolytinae) from infested Norway spruce stands and possible implications for management. Psyche 2012:321084. doi: 10.1155/2012/321084
Baier, P., Pennerstorfer, J., and Schopf, A. (2007). PHENIPS-A comprehensive phenology model of Ips typographus (L.) (Col., Scolytinae) as a tool for hazard rating of bark beetle infestation. For. Ecol. Manage. 249, 171–186. doi: 10.1016/j.foreco.2007.05.020
Bivand, R., Keitt, T., and Rowlingson, B. (2021). rgdal: Bindings for the Geospatial Data Abstraction Library. R Package Version 1.5-23.
Bivand, R., and Lewin-Koh, N. (2020). maptools: Tools for Handling Spatial Objects. R Package Version 1.0-2.
Bivand, R., and Rundel, C. (2020). rgeos: Interface to Geometry Engine - Open Source (GEOS). R Package Version 0.5-5.
Blomqvist, M., Kosunen, M., Starr, M., Kantola, T., Holopainen, M., and Lyytikäinen-Saarenmaa, P. (2018). Modelling the predisposition of Norway spruce to Ips typographus L. infestation by means of environmental factors in southern Finland. Eur. J. For. Res. 137, 675–691. doi: 10.1007/s10342-018-1133-0
Botterweg, P. (2009). The effect of attack density on size, fat content and emergence of the spruce bark beetle Ips typographus L.1. Zeitsch. Angew. Entomol. 96, 47–55. doi: 10.1111/j.1439-0418.1983.tb03640.x
Dobor, L., Hlásny, T., Rammer, W., Zimová, S., Barka, I., and Seidl, R. (2020a). Is salvage logging effectively dampening bark beetle outbreaks and preserving forest carbon stocks? J. Appl. Ecol. 57, 67–76. doi: 10.1111/1365-2664.13518
Dobor, L., Hlásny, T., Rammer, W., Zimová, S., Barka, I., and Seidl, R. (2020b). Spatial configuration matters when removing windfelled trees to manage bark beetle disturbances in Central European forest landscapes. J. Environ. Manage. 254:109792. doi: 10.1016/j.jenvman.2019.109792
Doležal, P., Okrouhlík, J., and Davídková, M. (2016). Fine fluorescent powder marking study of dispersal in the spruce bark beetle, Ips typographus (Coleoptera: Scolytidae). Eur. J. Entomol. 113, 1–8. doi: 10.14411/eje.2016.001
Dutilleul, P., Nef, L., and Frigon, D. (2000). Assessment of site characteristics as predictors of the vulnerability of Norway spruce (Picea abies Karst.) stands to attack by Ips typographus L. (Col., Scolytidae). J. Appl. Entomol. 124, 1–5. doi: 10.1046/j.1439-0418.2000.00440.x
Fahse, L., and Heurich, M. (2011). Simulation and analysis of outbreaks of bark beetle infestations and their management at the stand level. Ecol. Model. 222, 1833–1846. doi: 10.1016/j.ecolmodel.2011.03.014
Grimm, V., Berger, U., Bastiansen, F., Eliassen, S., Ginot, V., Giske, J., et al. (2006). A standard protocol for describing individual-based and agent-based models. Ecol. Model. 198, 115–126. doi: 10.1016/j.ecolmodel.2006.04.023
Grimm, V., Berger, U., DeAngelis, D. L., Polhill, J. G., Giske, J., and Railsback, S. F. (2010). The ODD protocol: a review and first update. Ecol. Model. 221, 2760–2768. doi: 10.1016/j.ecolmodel.2010.08.019
Grimm, V., Railsback, S. F., Vincenot, C. E., Berger, U., Gallagher, C., DeAngelis, D. L., et al. (2020). The ODD protocol for describing agent-based and other simulation models: a second update to improve clarity, replication, and structural realism. J. Artif. Soc. Soc. Simul. 23:7. doi: 10.18564/jasss.4259
Havašová, M., Ferenčík, J., and Jakuš, R. (2017). Interactions between windthrow, bark beetles and forest management in the Tatra national parks. For. Ecol. Manage. 391, 349–361. doi: 10.1016/j.foreco.2017.01.009
Hinze, J., and John, R. (2020). Effects of heat on the dispersal performance of Ips typographus. J. Appl. Entomol. 144, 144–151. doi: 10.1111/jen.12718
Honkaniemi, J., Ojansuu, R., Kasanen, R., and Heliövaara, K. (2018). Interaction of disturbance agents on Norway spruce: a mechanistic model of bark beetle dynamics integrated in simulation framework WINDROT. Ecol. Model. 388, 45–60. doi: 10.1016/j.ecolmodel.2018.09.014
Hurling, R. (2002). Zur flugaktivität und brutherdentwicklung des buchdruckers Ips typographus (L.) (Ph.D. thesis). Georg-August-Universität Göttingen, Germany.
Jakoby, O., Lischke, H., and Wermelinger, B. (2019). Climate change alters elevational phenology patterns of the European spruce bark beetle (Ips typographus). Glob. Change Biol. 2019:gcb.14766. doi: 10.1111/gcb.14766
Jönsson, A. M., Schroeder, L. M., Lagergren, F., Anderbrant, O., and Smith, B. (2012). Guess the impact of Ips typographus-an ecosystem modelling approach for simulating spruce bark beetle outbreaks. Agric. For. Meteorol. 166–167, 188–200. doi: 10.1016/j.agrformet.2012.07.012
Jönsson, A. M. A., Harding, S., Bärring, L., and Ravn, H. P. (2007). Impact of climate change on the population dynamics of Ips typographus in southern Sweden. Agric. For. Meteorol. 146, 70–81. doi: 10.1016/j.agrformet.2007.05.006
Kautz, M., Dworschak, K., Gruppe, A., and Schopf, R. (2011). Quantifying spatio-temporal dispersion of bark beetle infestations in epidemic and non-epidemic conditions. For. Ecol. Manage. 262, 598–608. doi: 10.1016/j.foreco.2011.04.023
Kautz, M., Imron, M. A., Dworschak, K., and Schopf, R. (2016). Dispersal variability and associated population-level consequences in tree-killing bark beetles. Mov. Ecol. 4:9. doi: 10.1186/s40462-016-0074-9
Kautz, M., Schopf, R., and Imron, M. A. (2014). Individual traits as drivers of spatial dispersal and infestation patterns in a host-bark beetle system. Ecol. Model. 273, 264–276. doi: 10.1016/j.ecolmodel.2013.11.022
Koreň, M., Jakuš, R., Zápotocký, M., Barka, I., Holuša, J., Ďuračiová, R., et al. (2021). Assessment of machine learning algorithms for modeling the spatial distribution of bark beetle infestation. Forests 12:395. doi: 10.3390/f12040395
Kulakowski, D. (2016). Managing bark beetle outbreaks (Ips typographus, Dendroctonus spp.) in conservation areas in the 21st century. For. Res. Pap. 77, 352–357. doi: 10.1515/frp-2016-0036
Lausch, A., Fahse, L., and Heurich, M. (2011). Factors affecting the spatio-temporal dispersion of Ips typographus (L.) in Bavarian Forest National Park: a long-term quantitative landscape-level analysis. For. Ecol. Manage. 261, 233–245. doi: 10.1016/j.foreco.2010.10.012
Louis, M., Toffin, E., Gregoire, J. C., and Deneubourg, J. L. (2016). Modelling collective foraging in endemic bark beetle populations. Ecol. Model. 337, 188–199. doi: 10.1016/j.ecolmodel.2016.07.008
Mankin, R. W., Vick, K. W., Mayer, M. S., Coffelt, J. A., and Callahan, P. S. (1980). Models for dispersal of vapors in open and confined spaces: applications to sex pheromone trapping in a warehouse. J. Chem. Ecol. 6, 929–950. doi: 10.1007/BF00990477
Marini, L., Lindelöw, Å., Jönsson, A. M., Wulff, S., and Schroeder, L. M. (2013). Population dynamics of the spruce bark beetle: a long-term study. Oikos 122, 1768–1776. doi: 10.1111/j.1600-0706.2013.00431.x
Mezei, P., Jakuš, R., Pennerstorfer, J., Havašová, M., Škvarenina, J., Ferenčík, J., et al. (2017). Storms, temperature maxima and the Eurasian spruce bark beetle Ips typographus-An infernal trio in Norway spruce forests of the Central European High Tatra Mountains. Agric. For. Meteorol. 242, 85–95. doi: 10.1016/j.agrformet.2017.04.004
Netherer, S., and Nopp-Mayr, U. (2005). Predisposition assessment systems (PAS) as supportive tools in forest management - Rating of site and stand-related hazards of bark beetle infestation in the High Tatra Mountains as an example for system application and verification. For. Ecol. Manage. 207, 99–107. doi: 10.1016/j.foreco.2004.10.020
Netherer, S., Panassiti, B., Pennerstorfer, J., and Matthews, B. (2019). Acute drought is an important driver of bark beetle infestation in Austrian Norway spruce stands. Front. For. Glob. Change 2:39. doi: 10.3389/ffgc.2019.00039
Ogris, N., Ferlan, M., Hauptman, T., Pavlin, R., Kavčíč, A., Jurc, M., et al. (2019). RITY-A phenology model of Ips typographus as a tool for optimization of its monitoring. Ecol. Model. 410:108775. doi: 10.1016/j.ecolmodel.2019.108775
Økland, B., Nikolov, C., Krokene, P., and Vakula, J. (2016). Transition from windfall- to patch-driven outbreak dynamics of the spruce bark beetle Ips typographus. For. Ecol. Manage. 363, 63–73. doi: 10.1016/j.foreco.2015.12.007
Overbeck, M., Schmidt, M., Fischer, C., Evers, J., Schulze, A., Hövelmann, T., et al. (2011). Ein statistisches modell zur regionalisierung der nutzbaren feldkapazität von Waldstandorten in Niedersachsen. Forstarchiv 82, 92–100. doi: 10.2376/0300-4112-82-92
Pasek, J. E. (1988). Influence of wind and windbreaks on local dispersal of insects. Agric. Ecosyst. Environ. 22–23, 539–554. doi: 10.1016/0167-8809(88)90044-8
Potterf, M., Nikolov, C., Kočická, E., Ferenčík, J., Mezei, P., and Jakuš, R. (2019). Landscape-level spread of beetle infestations from windthrown- and beetle-killed trees in the non-intervention zone of the Tatra National Park, Slovakia (Central Europe). For. Ecol. Manage. 432, 489–500. doi: 10.1016/j.foreco.2018.09.050
Rammer, W., and Seidl, R. (2015). Coupling human and natural systems: simulating adaptive management agents in dynamically changing forest landscapes. Glob. Environ. Change 35, 475–485. doi: 10.1016/j.gloenvcha.2015.10.003
Rammer, W., and Seidl, R. (2019). Harnessing deep learning in ecology: an example predicting bark beetle outbreaks. Front. Plant Sci. 10:1327. doi: 10.3389/fpls.2019.01327
Salle, A., Baylac, M., and Lieutier, F. (2005). Size and shape changes of Ips typographus L. (Coleoptera: Scolytinae) in relation to population level. Agric. For. Entomol. 7, 297–306. doi: 10.1111/j.1461-9555.2005.00274.x
Seidl, R., Baier, P., Rammer, W., Schopf, A., and Lexer, M. J. (2007). Modelling tree mortality by bark beetle infestation in Norway spruce forests. Ecol. Model. 206, 383–399. doi: 10.1016/j.ecolmodel.2007.04.002
Seidl, R., Müller, J., Hothorn, T., Bässler, C., Heurich, M., and Kautz, M. (2016). Small beetle, large-scale drivers: how regional and landscape factors affect outbreaks of the European spruce bark beetle. J. Appl. Ecol. 53, 530–540. doi: 10.1111/1365-2664.12540
Seidl, R., Rammer, W., Jäger, D., and Lexer, M. J. (2008). Impact of bark beetle (Ips typographus L.) disturbance on timber production and carbon sequestration in different management strategies under climate change. For. Ecol. Manage. 256, 209–220. doi: 10.1016/j.foreco.2008.04.002
Seidl, R., Schelhaas, M. J., Lindner, M., and Lexer, M. J. (2009). Modelling bark beetle disturbances in a large scale forest scenario model to assess climate change impacts and evaluate adaptive management strategies. Region. Environ. Change 9, 101–119. doi: 10.1007/s10113-008-0068-2
Senf, C., Müller, J., and Seidl, R. (2019). Post-disturbance recovery of forest cover and tree height differ with management in Central Europe. Landsc. Ecol. 9, 2837–2850. doi: 10.1007/s10980-019-00921-9
Stadelmann, G., Bugmann, H., Meier, F., Wermelinger, B., and Bigler, C. (2013a). Effects of salvage logging and sanitation felling on bark beetle (Ips typographus L.) infestations. For. Ecol. Manage. 305, 273–281. doi: 10.1016/j.foreco.2013.06.003
Stadelmann, G., Bugmann, H., Wermelinger, B., Meier, F., and Bigler, C. (2013b). A predictive framework to assess spatio-temporal variability of infestations by the European spruce bark beetle. Ecography 36, 1208–1217. doi: 10.1111/j.1600-0587.2013.00177.x
Strand, T., Lamb, B., Thistle, H., Allwine, E., and Peterson, H. (2009). A simple model for simulation of insect pheromone dispersion within forest canopies. Ecol. Model. 220, 640–656. doi: 10.1016/j.ecolmodel.2008.11.018
Temperli, C., Bugmann, H., and Elkin, C. (2013). Cross-scale interactions among bark beetles, climate change, and wind disturbances: a landscape modeling approach. Ecol. Monogr. 83, 383–402. doi: 10.1890/12-1503.1
Thom, D., Seidl, R., Steyrer, G., Krehan, H., and Formayer, H. (2013). Slow and fast drivers of the natural disturbance regime in Central European forest ecosystems. For. Ecol. Manage. 307, 293–302. doi: 10.1016/j.foreco.2013.07.017
Wermelinger, B., Epper, C., Kenis, M., Ghosh, S., and Holdenrieder, O. (2012). Emergence patterns of univoltine and bivoltine Ips typographus (L.) populations and associated natural enemies. J. Appl. Entomol. 136, 212–224. doi: 10.1111/j.1439-0418.2011.01629.x
Wichmann, L., and Ravn, H. P. (2001). The spread of Ips typographus (L.) (Coleoptera, Scolytidae) attacks following heavy windthrow in Denmark, analysed using GIS. For. Ecol. Manage. 148, 31–39. doi: 10.1016/S0378-1127(00)00477-1
Wickham, H. (2016). ggplot2: Elegant Graphics for Data Analysis. New York, NY: Springer-Verlag. doi: 10.1007/978-3-319-24277-4_9
Wilensky, U. (1999). NetLogo. Evanston: Center for Connected Learning and ComputerBased Modeling; Northwestern University.
Keywords: Ips typographus, management, effectiveness, risk assessment, mass outbreak, active forest protection, agent-based model, individual-based model
Citation: Pietzsch BW, Peter FJ and Berger U (2021) The Effect of Sanitation Felling on the Spread of the European Spruce Bark Beetle—An Individual-Based Modeling Approach. Front. For. Glob. Change 4:704930. doi: 10.3389/ffgc.2021.704930
Received: 04 May 2021; Accepted: 28 June 2021;
Published: 26 July 2021.
Edited by:
Thomas Cordonnier, Institut National de Recherche pour L'Agriculture, L'Alimentation et L'Environnement (INRAE), FranceReviewed by:
Werner Rammer, Technical University of Munich, GermanyCopyright © 2021 Pietzsch, Peter and Berger. This is an open-access article distributed under the terms of the Creative Commons Attribution License (CC BY). The use, distribution or reproduction in other forums is permitted, provided the original author(s) and the copyright owner(s) are credited and that the original publication in this journal is cited, in accordance with accepted academic practice. No use, distribution or reproduction is permitted which does not comply with these terms.
*Correspondence: Bruno Walter Pietzsch, YnJ1bm9fd2FsdGVyLnBpZXR6c2NoQHR1LWRyZXNkZW4uZGU=
Disclaimer: All claims expressed in this article are solely those of the authors and do not necessarily represent those of their affiliated organizations, or those of the publisher, the editors and the reviewers. Any product that may be evaluated in this article or claim that may be made by its manufacturer is not guaranteed or endorsed by the publisher.
Research integrity at Frontiers
Learn more about the work of our research integrity team to safeguard the quality of each article we publish.