 Sara C. Nieman
 Chris E. Johnson
- Department of Civil and Environmental Engineering, Syracuse University, Syracuse, NY, United States
Chemical weathering of minerals is the principal mechanism by which base cations (Ca2+, Mg2+, K+, and Na+) are released and acidity is neutralized in soils, bedrock, and drainage waters. Quantifying the release of base cations from watershed soils is therefore crucial for the calculation of “critical loads” of atmospheric acidity to forest ecosystems. We used a mass-balance approach to estimate the rate of release of base cations in 25 headwater catchments in the Catskill region of New York, an area historically subject to high inputs of acid deposition. In 2010–2013, total net base cation release via geochemical processes averaged 1,704 eq ha–1 yr–1 (range: 928–2,622). Calcium accounted for 58% of this total, averaging 498 mol ha–1 yr–1 (range: 209–815). Mass balance estimates of net geochemical release of base cations were most strongly driven by stream export and biomass uptake fluxes, with only minor contributions from precipitation. Documented rates of base cation depletion from soil exchange sites in the region were also small relative to the net geochemical release rates. We observed a significant influence of bedrock type on net base cation release rates (P = 0.002), and a weak but significant negative correlation with watershed elevation (r = −0.51). Relationships with other geographic factors such as aspect and watershed size were not significant. Net base cation release was 4.5 times higher than precipitation inputs of SO42– and NO3–, suggesting that sources of acidity internal to the watershed are now more important drivers of weathering than acid deposition. Our data suggest that release of base cations from most Catskill forest soils is sufficient to neutralize existing inputs of acidity.
Introduction
Because of their proximity to midwestern industries and power plants, as well as east coast urban areas, the Catskill Mountains of New York receive among the highest rates of atmospheric deposition of SO2 and NOx in the United States (Lovett et al., 2000). Between 1998 and 2000, for example, wet deposition in the Catskill region had an average pH of 4.4, approximately 10 times more acidic than the background conditions (Driscoll et al., 2003). In acid-sensitive areas of New York, such as the Catskills, acidic deposition has impacted soils, the health of sensitive tree species, fish and other aquatic organisms, and has negatively affected water quality. Acidic deposition alters soils, reducing their ability to neutralize further inputs of strong acids and prolonging the time needed for ecosystems to recover from acidification (Driscoll et al., 2003).
The 1990 Amendments to the Clean Air Act (CAAA) were part of the first federal legislation focused on the issue of acid deposition (Driscoll et al., 2001; Likens et al., 2001). As a result of these efforts, SO2 emissions decreased 73% in the United States between 1990 and 2011 (U.S. EPA, 2014). Even though there have been substantial reductions in acid deposition in the northeastern United States as a result of the CAAA, the acid neutralizing capacity (ANC) of surface waters in the region has been slow to recover. At the Biscuit Brook watershed in the southern Catskills, for example, sulfate and nitrate in precipitation declined at a rate of 1.0 μeq L–1 yr–1 between 1984 and 2002, while the ANC in the stream water increased by only 0.5 μeq L–1 yr–1 (Murdoch and Shanley, 2006). While there has been some recovery of ANC and pH in regional surface waters, base cation concentrations have declined (calcium [Ca2+], magnesium [Mg2+], sodium [Na+], and potassium [K+]), and the soils have continued to acidify (Likens et al., 1996; Warby et al., 2009).
A possible explanation for the declining stream Ca concentrations in the northeastern United States is the depletion of exchangeable Ca pools from soils (Bailey et al., 1996; Lawrence et al., 1999; Driscoll et al., 2001; Warby et al., 2009). Long-term soil studies have provided evidence of considerable and statistically significant decreases in exchangeable Ca in the soils of the northeast (Warby et al., 2009). For example, Bailey et al. (2005) reported a 77% decrease of exchangeable Ca in the Oa and A soil horizons on the Allegheny Plateau in Pennsylvania between 1967 and 1997. This suggests that mineral weathering rates of base cations may be too slow to neutralize fully the acid inputs to the soil (Bailey et al., 2005) and that current base cation export from watersheds in the northeastern United States may not be sustainable. These findings are consistent with studies in acid-sensitive areas around the world (Paces, 1986; Yamada et al., 2013; Cremer and Prietzel, 2017).
The decline in surface water Ca concentrations and the depletion of exchangeable Ca from the soils in the northeastern United States suggest that mineral weathering rates may not be sufficient to fully neutralize acid inputs. Unfortunately, it is not possible to observe and quantify directly the release of base cations through mineral weathering in the field, making it difficult to obtain accurate estimates of field weathering rates (Futter et al., 2012) and to assess the response of weathering processes to changes in acid deposition. For example, long-term monitoring of stream chemistry at the Hubbard Brook Experimental Forest in New Hampshire showed an increase in pH from 4.1 to 4.4 between 1963 and 1988, resulting from decreases in atmospheric sulfate deposition; however, the silica concentrations in stream water remained essentially constant, suggesting that no apparent decrease in weathering rates had occurred (White and Brantley, 1995).
The “critical load” for an acid-sensitive ecosystem is an estimate of the maximum amount of acid deposition that an ecosystem can receive without causing acidification of the soil and water. Critical loads are helpful in setting standards for pollutants, particularly sulfur and nitrogen (Sverdrup and De Vries, 1994; Duarte et al., 2013). Chemical weathering of minerals constitutes the major source of dissolved base cations in most catchments (Moldan and Černý, 1994). Since both chemical weathering of silicate minerals and exchange of exchangeable base cations in the soil for incoming H+ ions result in stoichiometrically equivalent rates of base cation release and H+ ion neutralization, the release rate of base cations can be taken as a measure of the critical load in areas underlain by silicate parent materials (Moldan and Černý, 1994).
In this project we estimated the net geochemical release of base cations in 25 small headwater catchments in the Catskills using watershed mass balance calculations. The net geochemical release is the net mobilization of base cations from soils and parent materials. It includes weathering of minerals, net release from soil exchange sites, and potential inputs from deep groundwater sources, if applicable. Mass balance studies have often been used to assess base cation sinks and sources in small watersheds (e.g., April et al., 1986; Paces, 1986; Lewis et al., 1987; Giovanoli et al., 1988; Sarin et al., 1989; Johnson et al., 1994; Hyman et al., 1998). Because these fluxes are calculated from the differences between annual inputs and outputs, the resulting estimates are uncertain (Futter et al., 2012). By studying 25 small watersheds in the region, we were able to characterize the variation in the estimated net geochemical release rates and identify the most important terms in the mass balance. We were also able to assess the dependence of base cation release on bedrock type.
Catskill streams ultimately drain to the New York, Delaware, and Chesapeake Bays; impaired soils and surface waters in Catskill headwaters could therefore have negative impacts on these downstream systems (Lovett et al., 2000). Additionally, Catskill watersheds supply about 90% of the drinking water to New York City, with its population of approximately 9 million people. Biogeochemical processes in Catskill watersheds result in exceptional water quality. Indeed, New York is one of a handful of cities in the United States that is not required to filter its drinking water. The release of Ca, Mg, Na and K to Catskill streams is thus a crucial process in providing healthy and appealing drinking water to the largest metropolis in the United States.
Materials and Methods
Study Site
This study was conducted in the Catskill Park in New York State (Figure 1). The Catskill Mountains cover approximately 5,000 km2 in southeastern New York, with Slide Mountain as the highest peak at 1,274 m (Lovett et al., 2000). The mountains of the Catskills are flat-topped and have deeply carved valleys that formed during deglaciation. The ancient Acadian Mountains eroded and formed a large plateau, known as the Catskill Delta (Titus, 1998). The Catskill Mountains are the remains of the down-cutting of the Catskill Delta by glacial activity (Titus, 1998).
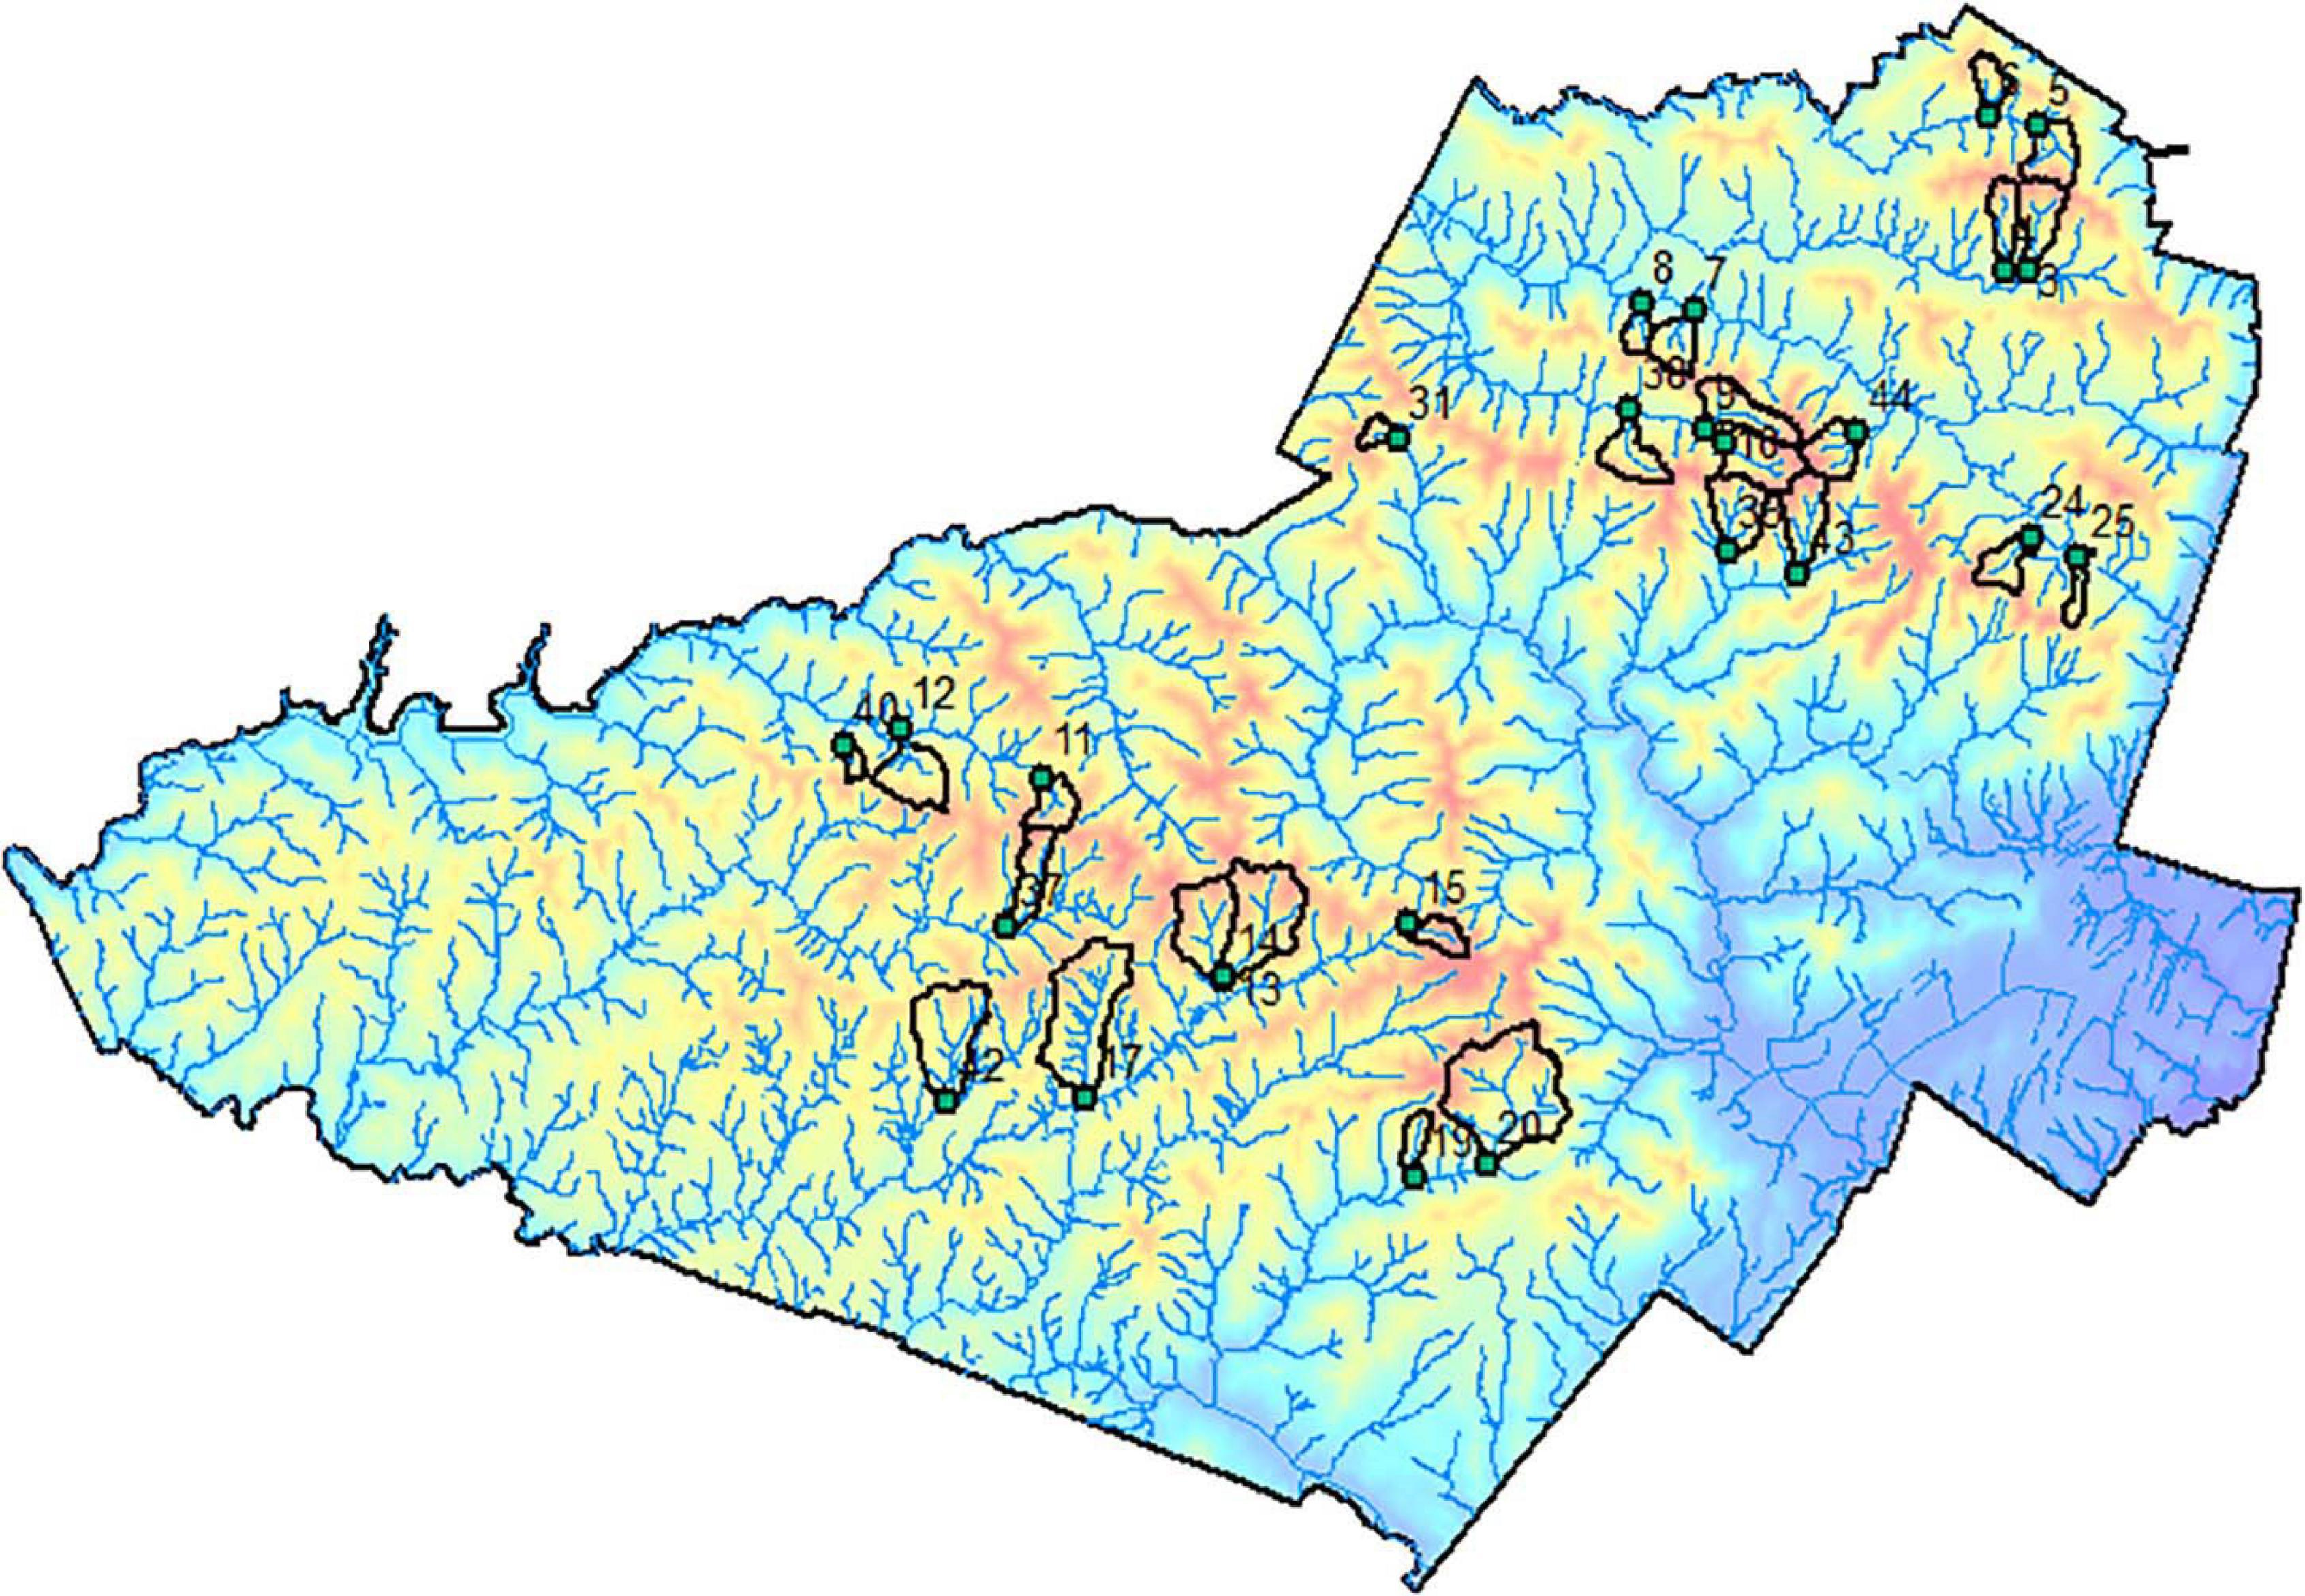
Figure 1. Map of the Catskill Park in New York State with boundaries of the study watersheds and elevation shading.
The bedrock in the Catskill region generally consists of sandstone and shale deposits of Devonian age, which are covered by glacial till of largely local origin (Kudish, 2000; Lovett et al., 2000; Ver Straeten, 2013). The sampling locations for the headwater catchments in this study are located on either the Lower Walton formation, the Upper Walton formation, or the Oneonta formation (Figure 2). These three formations are all composed of sandstone, shale, mudstone, and minor conglomerates; however, the Lower and Upper Walton formations contain a higher percentage of shale and mudstone, and the Oneonta formation contains a higher percentage of minor conglomerates (Ver Straeten, 2013).
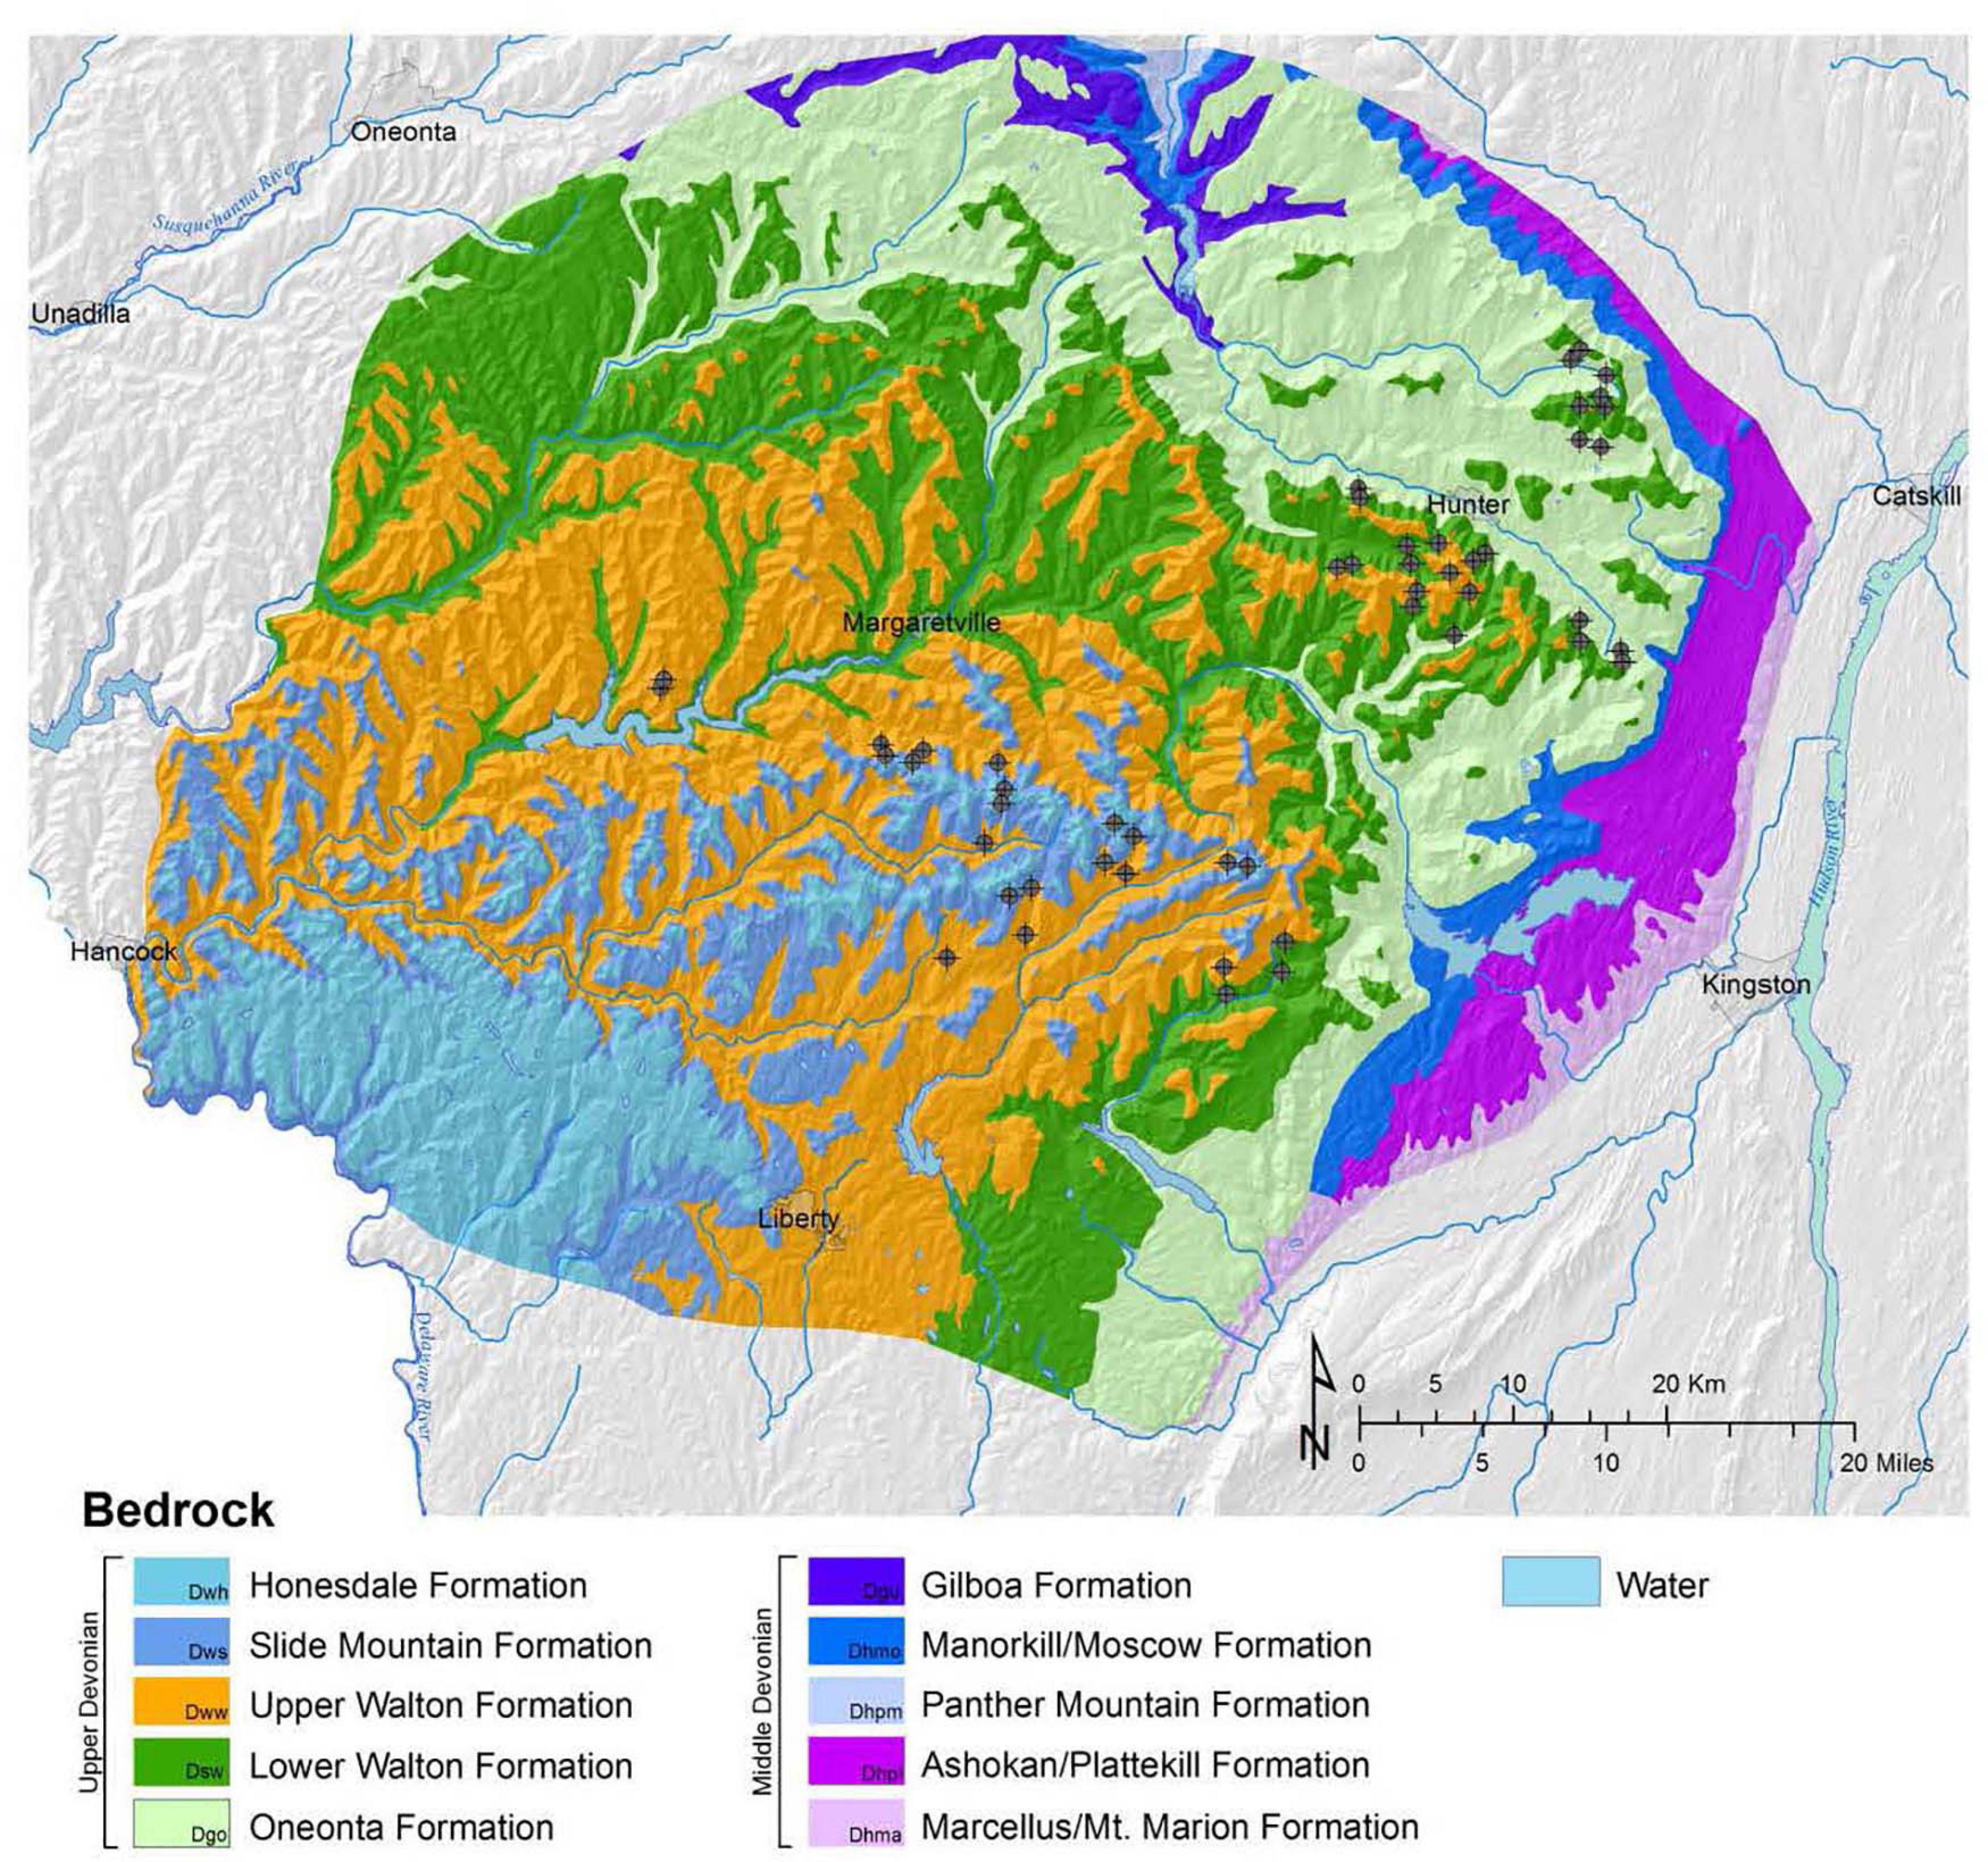
Figure 2. Locations of the study watersheds superimposed on a map of bedrock geology. Bedrock geology layer taken from Ver Straeten (2013).
About 20,000 years ago, the Laurentide ice sheet, which had covered the Catskill region and extended as far south as New York City, began to melt (Kudish, 2000). It is estimated that deglaciation in the Catskills ended between 16,000 and 18,000 years ago, with the melting of the ice sheet leaving behind extensive deposits of glacial till. This mantle of till, which ranges from a few cm to over 30 m thick, makes up most of the parent material of the soils today (Kudish, 2000; Ver Straeten, 2013). Because of the glacial history of the region, the soils of northeastern North America are much younger than soils in non-glaciated areas to the south (Kudish, 2000).
The most common soil types in the Catskills are Inceptisols. Catskill soils tend to be medium-textured, sandy-loams, containing on average around 60% sand, 30% silt, and 10% clay (Kudish, 2000). At higher elevations in the Catskills, some soils are classified as Spodosols, which contain a higher fraction of sand and are found in smaller, localized pockets. Catskill soils are highly acidic, with low concentrations of exchangeable base cations and low pH (Johnson, 2013).
The Catskill region is largely forested, with the lower elevations (<500 m) dominated by mixed oak forests (Lovett et al., 2000). The northern hardwood forest association dominates at elevations between 500 and 1,100 m, with sugar maple (Acer saccharum), American beech (Fagus grandifolia), and yellow birch (Betula allaghaniensis) as the primary species (Lovett et al., 2000). At higher elevations (>1,100 m), some of the forests are dominated by balsam fir (Abies balsamea) and red spruce (Picea rubens); however, the spruce-fir forest type is generally limited in the Catskills (Kudish, 2000; Lovett et al., 2000).
In the Catskills, the climate today features cool summers and cold winters (Lovett et al., 2000). The average annual temperature varies from about 10°C near sea level in the Hudson Valley to about 4°C at the highest recording station at Winnisook Lake near Slide Mountain (Kudish, 2000). The mean annual precipitation varies across the Catskills. The eastern Catskills receive additional precipitation from coastal storms, especially during the winter, and thunderstorms are frequent in the southern Catskills, especially during the summer (Kudish, 2000).
This study focuses on estimating the input-output budgets of base cations from 25 headwater catchments throughout the Catskill Park (Figures 1, 2). The catchments are located at mid to high elevations and are mainly covered by northern hardwoods. A list of watershed names and locations may be found in Supplementary Table 1.
Study Period
We estimated watershed mass balances for the 2011, 2012, and 2013 water years, running from July 1 of the previous year to June 30. Forest area and biomass data used to develop trends in nutrient uptake for the mass balance calculations were taken from the 2005 and 2015 results reported by the USDA Forest Service’s Forest Inventory and Analysis (FIA) National Program (see section “Net Uptake by Biomass,” below).
Sampling and Analytical Methods
The streams draining the 25 watersheds were sampled monthly from 2010 through 2013. A 2-L grab sample was taken near the centroid of flow from each stream and the sample bottle was rinsed three times with stream water prior to sample collection. The samples were filtered within 2 h using a 0.45-μm membrane filter and vacuum hand pump apparatus. Samples were kept cold prior to filtration and while being transported from the field to the lab. Once in the lab, samples were stored at approximately 4°C until analysis.
Quality control was maintained in the form of field blanks, duplicate samples, continuing calibration verification standards (CCVs), and laboratory blanks. Field blanks were brought into the field as 2-L bottles containing deionized water and were treated identically to stream samples. Duplicate samples were taken from 2 to 4 sites each month and concentrations compared for consistency. There were no instances in which solute concentrations differed by more than 10 percent.
Stream pH was measured using a silver-chloride combination electrode. Hydrogen ion concentrations were calculated from pH using the following relationship (Stumm and Morgan, 1996):
where: [H+] = concentration of hydrogen ion (mol/L)
pH = measured pH of the water sample
No ion activity correction was applied in the calculation of [H+] because the ionic strength of the samples was very low for all sites and sampling dates.
Nitrate, sulfate, and other anions were measured using a Dionex DN-500 Ion Chromatography System (Thermo Fisher Scientific, Waltham, MA) with a potassium hydroxide eluent and a conductivity detector. Ammonium (NH4+) concentrations were measured on a flow-injection analyzer using the phenate method (Cappo et al., 1987). Concentrations of Ca, Mg, Na, and K were measured by inductively coupled plasma, optical emission spectrometry.
Soil samples were collected in 2011 as described by Johnson (2013). Samples from C horizons were analyzed for total Ca, Mg, Na, and K at the Peter Hooper GeoAnalytical Lab at Washington State University. After grinding, 3.5 grams of sample were analyzed for loss-on-ignition (500°C) and then fused at 1,000°C with dilithium tetraborate (Li2B4O7). The beads were reground and re-fused prior to x-ray fluorescence spectroscopy (XRF) analysis. Results were reported as oxide percentages and converted to molar concentrations.
Methods for Constructing Watershed Mass Balances
For any element i, the balance of inputs to and outputs from the soil solution can be expressed as (Bricker et al., 1994):
where: P = atmospheric input
G = net geochemical release
S = streamwater export from the watershed
B = net uptake by biomass in the watershed
It is possible to estimate the net geochemical release of element i by solving for G if the other terms are known. This approach assumes negligible net change in the storage of i in the vadose zone from year to year. For the 25 Catskill watersheds, regional precipitation and deposition chemistry data were used to estimate P, while measured stream chemistry was used to estimate S. Estimates of the net uptake of base cations by forest vegetation in the Catskills, B, were derived from data from the USDA Forest Service’s FIA program. In addition, regional studies of soil base cation depletion provide estimates of the net rate of depletion of base cations from soil exchange sites.
Atmospheric Input (P)
The atmospheric input of each element was estimated by multiplying the concentration in precipitation by the precipitation amount. To estimate precipitation amount for each watershed, we applied an inverse distance weighting (IDW) procedure to data from precipitation gaging stations in the region, archived by the National Climate Data Center (NOAA/NCDC., 2013). The IDW method was preferred due to the relatively sparse network of gages in the region. IDW involves calculating weights (λ) which are applied to data from precipitation gaging locations and which are scaled so that their sum is equal to one (Krivoruchko, 2011). We used Geographic Information Systems (GIS) to determine the three closest precipitation stations to each watershed location. Using the known precipitation quantities (Z) from gaging stations within and near the Catskills (NOAA/NCDC., 2013) and the IDW weights for the three closest gaging stations, we determined the monthly precipitation inputs into each catchment using Eqs. 3 and 4:
where: Ẑ(s0) = predicted precipitation amount at location s_0 (the watershed)
Z(si) = measured precipitation amount at gaging location s_i
N = number of precipitation gaging stations used for prediction; N = 3 in this study
λi = IDW weight for the ith precipitation gaging station
di0 distance between locations s_i and s_0.
For gaged locations that had missing precipitation data for a particular month, we used a linear regression relationship with the closest gaged location to estimate the missing precipitation value. The distances and weights used to determine the precipitation amount in each catchment may be found in Supplementary Tables 2,3.
We expected to find higher precipitation amounts at higher elevations; however, no relationship was observed between precipitation and elevation in the gaging stations used in this study. Because it is well-known that deposition of strong acids generally increases with increasing elevation, we used GIS techniques to determine the percent of each watershed above 1,000 m and applied an enhancement factor (Weathers et al., 2000):
where: WEF = watershed enhancement factor
EL = fraction of elevation less than 1,000 m
EG = fraction of elevation greater than 1,000 m
The calculated enhancement factors for the 25 watersheds may be found in Supplementary Table 4.
The Biscuit Brook watershed is the only location in the Catskill region that is part of the National Atmospheric Deposition Program (NADP: site NY68)1. Precipitation chemistry has been measured at Biscuit Brook since 1983. We multiplied the monthly average solute concentrations in the precipitation at the Biscuit Brook NADP site by the estimated precipitation amounts for the study watersheds, and then summed these monthly fluxes for each water year for each watershed. Dry deposition data were not used for estimating deposition of SO42–, NO3–, and NH4+, only wet deposition data from the NADP were used. Using data from the Claryville site (CAT175) in the Clean Air Status and Trends Network (CASTNET), which is co-located with the Biscuit Brook NADP site, we determined that dry deposition of SO42–, NO3–, and NH4+ were insignificant in estimating total (wet + dry) deposition (6, 2, and 15%, respectively)2. To take elevation effects into account, enhanced deposition values in each study watershed were calculated for NH4+, NO3–, and SO42– (Eq. 6), which have been shown to increase with elevation in the region (Weathers et al., 2000):
where: Dh = enhanced deposition, mol ha–1 yr–1
Db = base deposition at Biscuit Brook monitoring station, mol ha–1 yr–1
The concentration of H+ was also adjusted to account for the adjustments made to NH4+, NO3–, and SO42–. To do this, we used Eq. 7, where “base” refers to the original precipitation flux of each solute and “adj” refers to the adjusted solute flux after taking the watershed enhancement factors into account:
Application of Eq. 7 preserves the charge balance in precipitation inputs to the study watersheds.
Stream Export (S)
To quantify the stream chemistry, the streams draining the watersheds were sampled during the 2011, 2012, and 2013 water years for chemical analysis. The samples were filtered and measured for pH (field and lab), NH4+, base cations (Ca2+, Mg2+, Na2+, K+), and acid anions (NO3–, SO42–, Cl–) using methods described above.
We used the USGS StreamStats database to estimate the daily flow for each watershed on the particular day that it was sampled3. For study watersheds where direct discharge measurements were not available, we used the ratio of the watershed area above the stream sampling point to the watershed area at the nearest gaging station downstream to determine the daily flow for the ungaged location. Gianfagna et al. (2015) showed that this watershed-area-ratio approach provides good estimates of average daily streamflow in small watersheds in the Catskills. The daily discharge for the gage at the Winnisook catchment was not available after March 31, 2013; therefore, we used a linear regression between the average daily flow at nearby Biscuit Brook and the corresponding values at Winnisook to estimate the daily flows for Winnisook for the remainder of the 2013 water year (R2 = 0.83):
Using the solute concentrations and the daily flow on each sampling date, we calculated the annual flow-weighted average for each solute. We then used these flow-weighted concentrations and the daily discharge values to calculate the mass flux of each solute in the stream water. We then determined the stream export (S) for each element using Eq. 9, where Q is the average volumetric flow rate of the stream, C is the volume-weighted solute concentration in the stream, and A is the watershed area:
Net Uptake by Biomass (B)
Areas of various forest types, along with aboveground and belowground biomass, were available through the USDA Forest Service’s FIA program (USDA Forest Service, 2016). The datasets were assembled by county (Delaware, Greene, Ulster, and Sullivan), forest type group, and year (1993, 2005, 2010, and 2015). The FIA forest type groups were re-categorized as northern hardwood, southern hardwood, spruce-fir, or pine (Table 1).
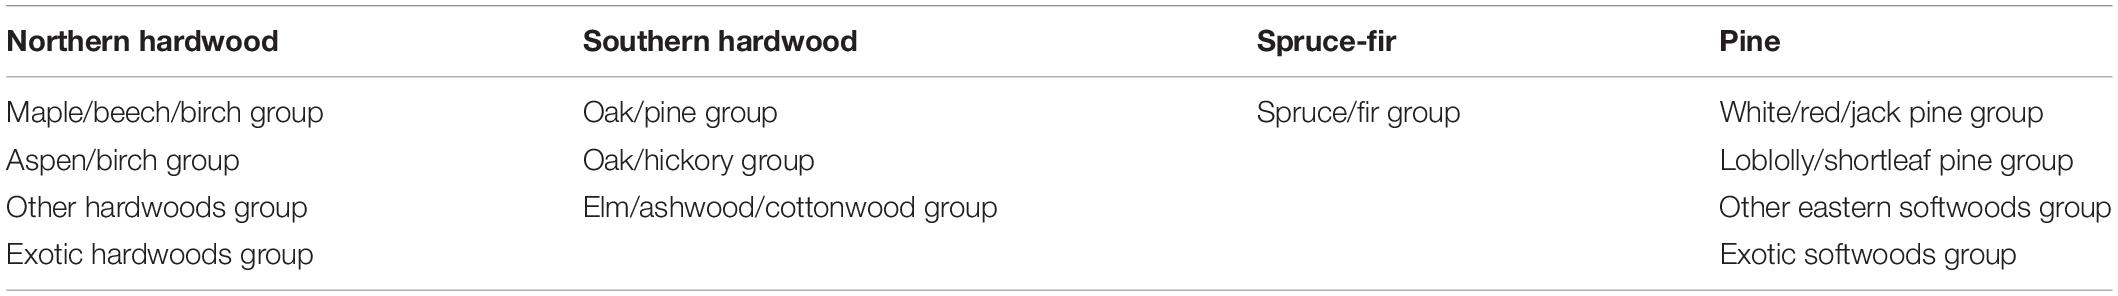
Table 1. Forest Inventory Analysis (FIA) forest types (i.e., the entries in the table) were grouped into one of four broader categories (northern hardwood, southern hardwood, spruce-fir, or pine) for the calculation of biomass nutrient uptake.
To calculate biomass nutrient pools, we used nutrient stocks in a northern hardwood forest studied by Whittaker et al. (1979) and corresponding area-weighted biomass means (Whittaker et al., 1974) to compute average nutrient concentrations for forest biomass. We then multiplied the total biomass (aboveground plus belowground) of each recategorized forest type in each county for each year by the computed nutrient concentrations, and divided by the respective forest areas. We then estimated the average rate of change in the nutrient pools for the period of 2005–2015 for each forest type. The FIA database includes biomass for live trees greater than 2.5-cm diameter at breast height. The exclusion of shrubs, herbs, and smaller saplings is not a significant source of uncertainty, as these forests have sparse understories. For example, Whittaker et al. (1974), working in a similar forest type, reported that shrubs and herbs accounted for 0.12% of total forest biomass (0.19 Mg ha–1 vs. 161.7 Mg ha–1).
The proportions of each forest type in each of the watersheds were determined using GIS. The GIS shapefile layer of the distribution of forest types in the Catskill Mountains was obtained from Lovett et al. (2002) and their forest types were re-categorized as northern hardwood, southern hardwood, spruce-fir, or pine to match our re-categorization of the FIA data (Driese et al., 2004; Table 2). Using GIS, an elevation cut-off was imposed for areas classified as “oak dominated.” Any area where the forest type was “oak dominated” at an elevation greater than 800 m was reclassified as “northern hardwood.” Any area where the forest type was “oak dominated” at an elevation less than 800 m was classified as “southern hardwood” (Table 2). The proportions of each forest type in each watershed are shown in Supplementary Table 5. We then multiplied the average change in nutrient pools for each forest type by the corresponding percent of each forest type in each watershed to estimate the rate of net biomass uptake for each cation in each watershed (Bi).
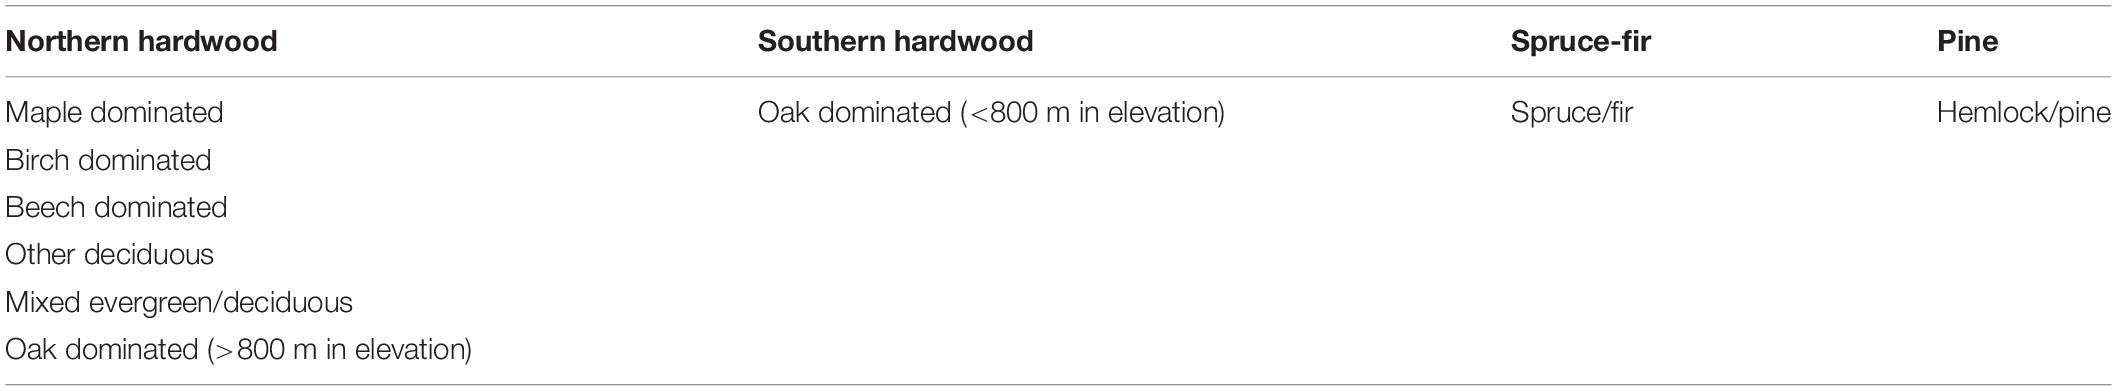
Table 2. Forest types delineated by Lovett et al. (2002) and Driese et al. (2004) were grouped into one of four broader categories (northern hardwood, southern hardwood, spruce-fir, or pine) for the assessment of forest type distribution within the study watersheds.
Net Depletion From Soil Exchange Sites
To estimate the average annual net depletion of base cations from soil exchange sites, we used the average annual change for each exchangeable base cation from 1984 to 2001 for the Catskills/Poconos region as reported by Warby et al. (2009; Table 3). We then multiplied these estimated depletion rates by the average mass of soil in the O, A, and 0–10 cm layers in the study watersheds from Johnson (2013). This approach assumes that base cation depletion has occurred primarily in the O, A, and upper mineral soil layers. The resulting estimates were compared to the calculated net geochemical release to evaluate the relative importance of exchangeable base cation depletion to the net losses.
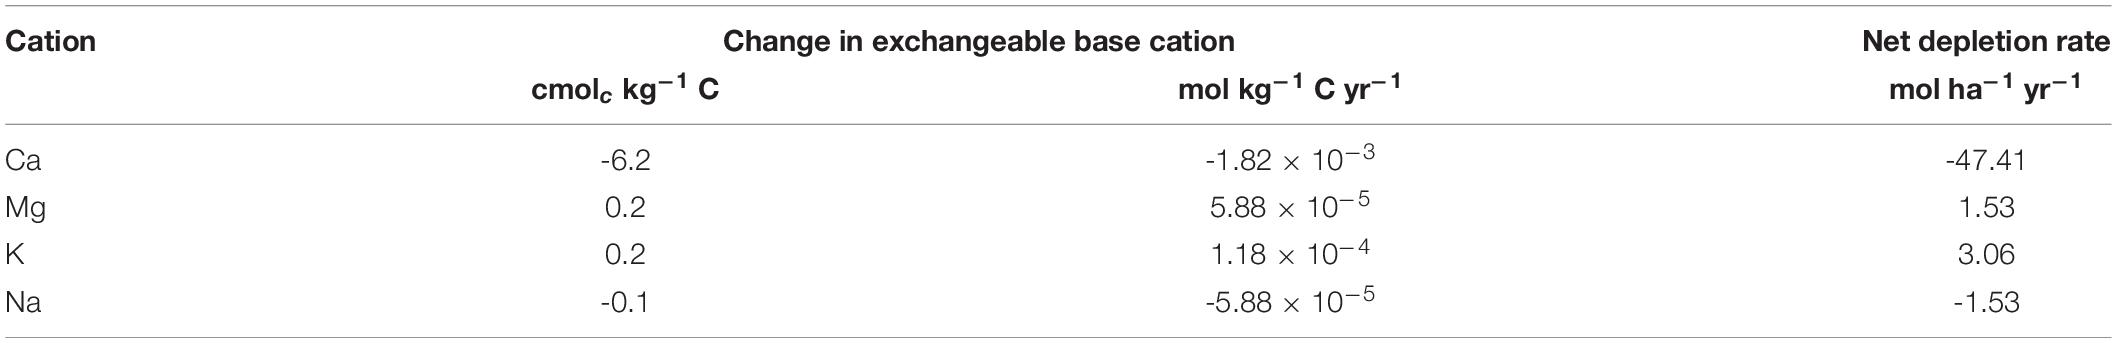
Table 3. Average annual change for each exchangeable base cation from 1984 to 2001 for the Catskills/Poconos region and the average annual rates of net depletion (negative) or accumulation (positive) from soil exchange (data sources: Warby et al., 2009; Johnson, 2013).
Statistical Methods
The significance of bedrock type as a factor influencing net geochemical release rates was tested using one-way analysis of variance after testing for normality using the Shapiro-Wilk test. Pearson correlation coefficients (r values) were used to assess linear correlations. All statistical analyses were performed using Minitab 16 (Minitab Inc., State College, PA, United States).
Results
Geochemical Release Rates as Estimated by Watershed Mass Balances
Using the mass-balance approach, we estimated that the average net geochemical release rate of Ca for the period of 2010–2013 for all of the watersheds was 498 mol ha–1 yr–1 (range: 209–815 mol ha–1 yr–1) (Table 4). The average net geochemical release rates of K, Mg, and Na were 72, 218, and 200 mol ha–1 yr–1, respectively (Table 4). The average total net release of base cations was estimated to be 1,704 eq ha–1 year–1 (range: 928–2,622 eq ha–1 yr–1). On average, Ca accounted for approximately 58% of the total base cation weathering on an equivalence basis, while K, Mg, and Na accounted for 4, 26, and 12%, respectively. Net geochemical release of Ca also varied more than the release of other base cations, both on a year-to-year basis (Table 4) and a site-to-site basis (Figure 3). Net geochemical release values for each watershed in each water year may be found in Supplementary Tables 8–10.
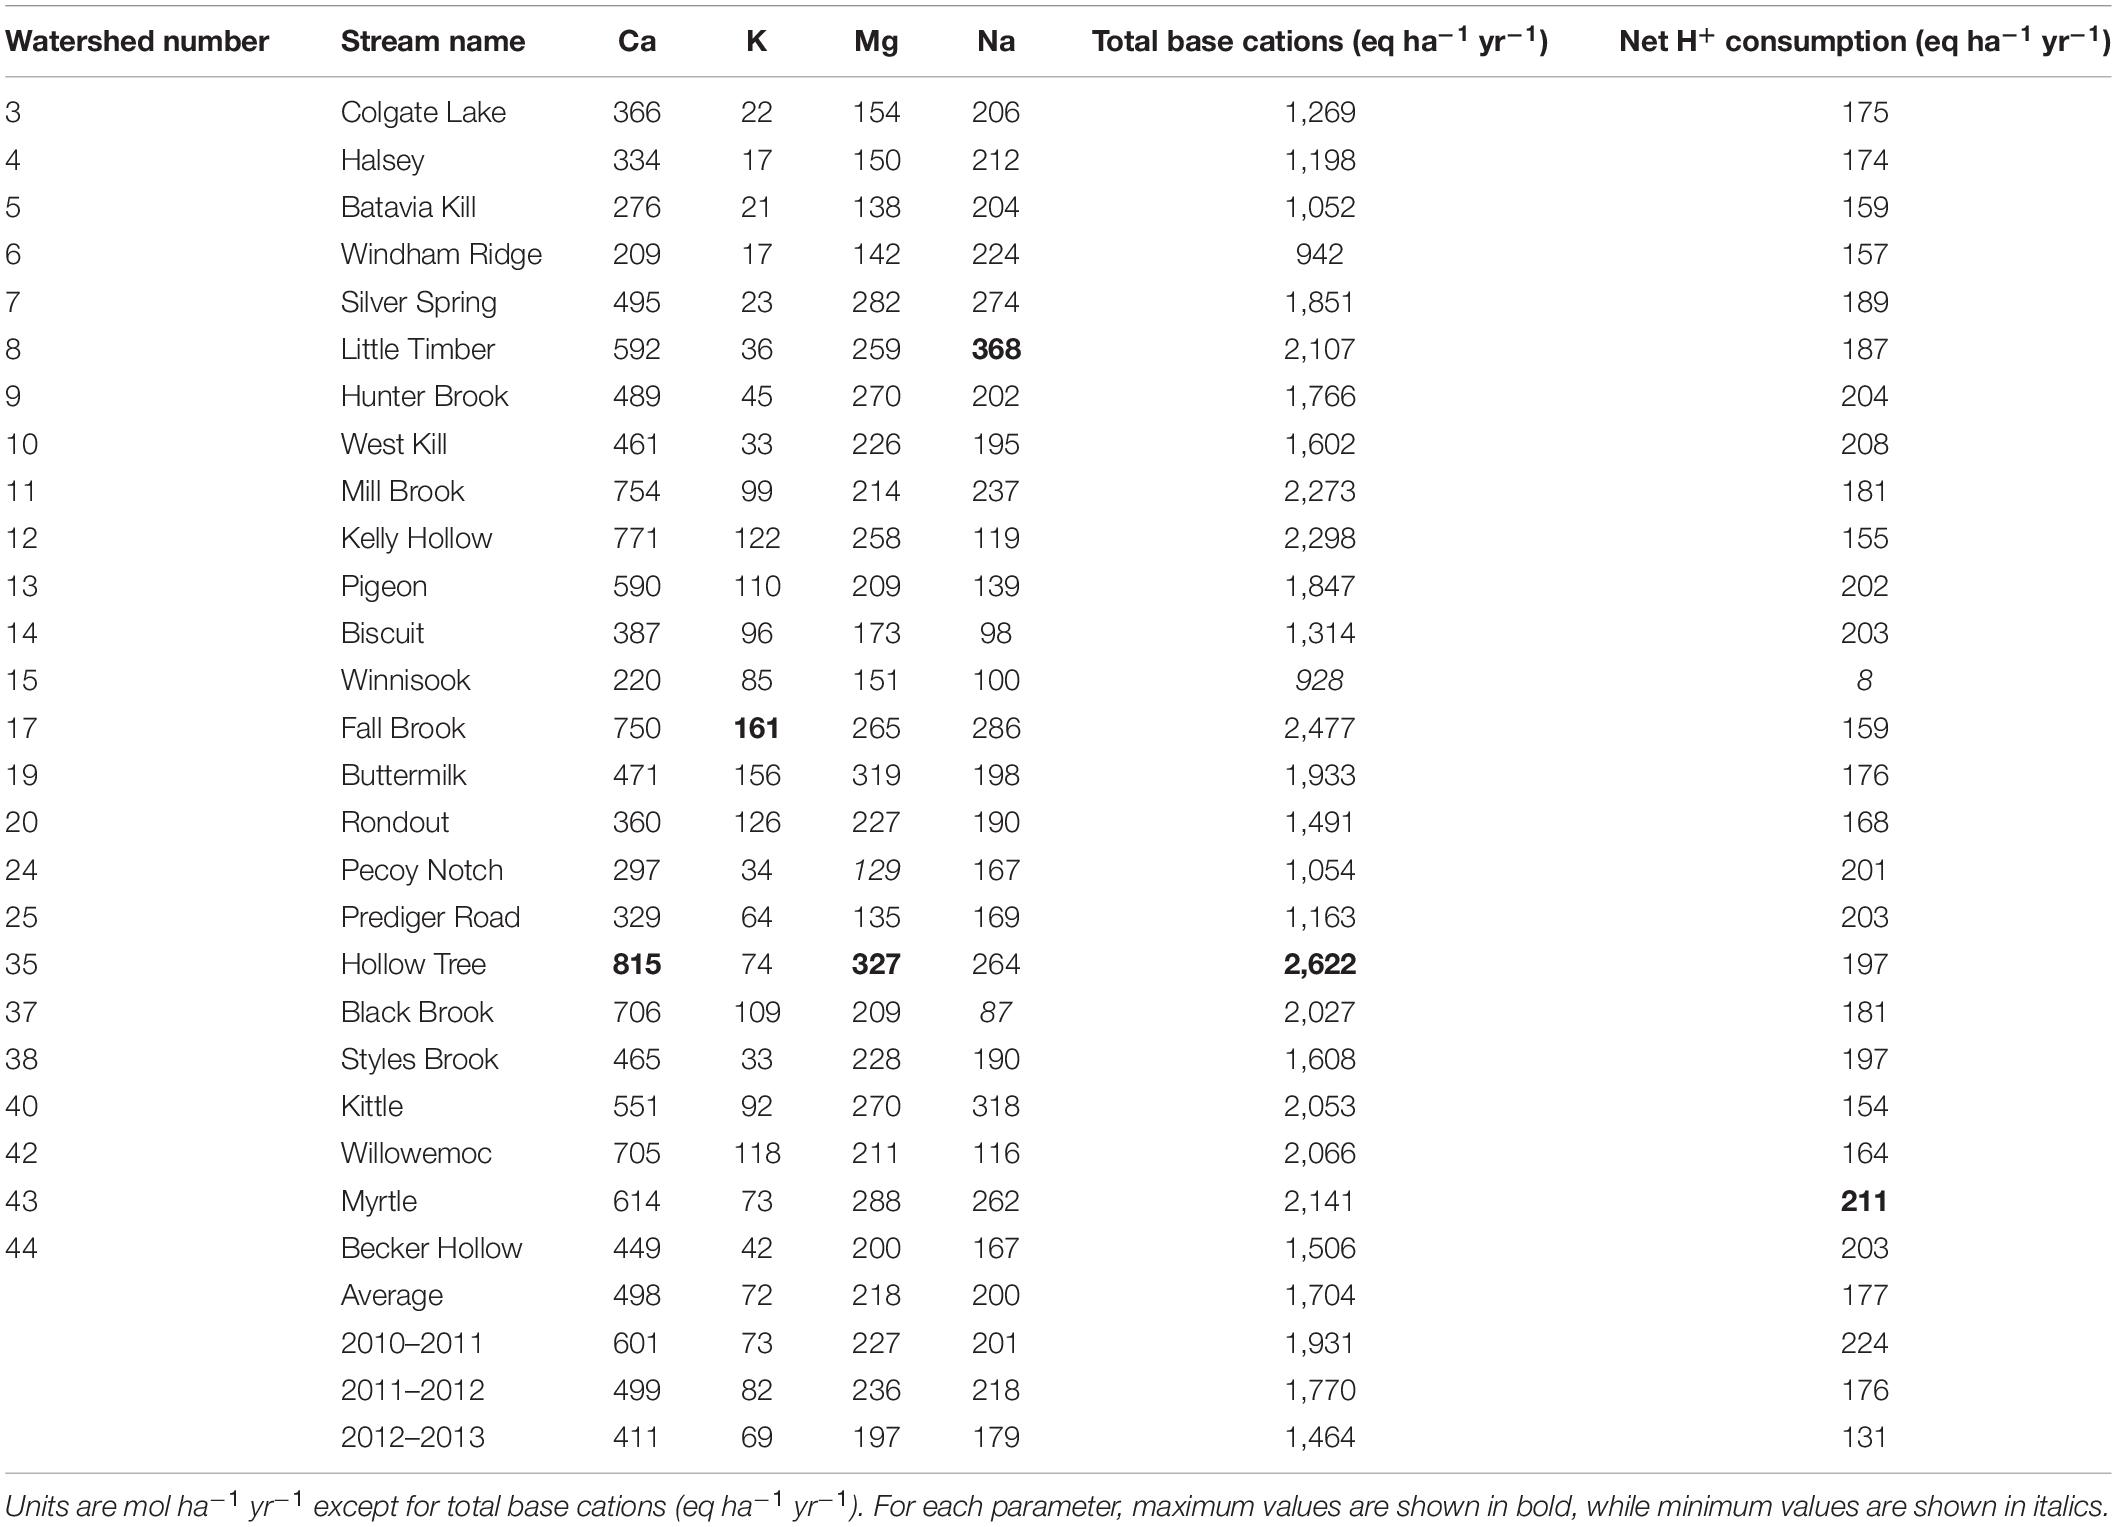
Table 4. Average annual net geochemical release rates for base cations for all watersheds.
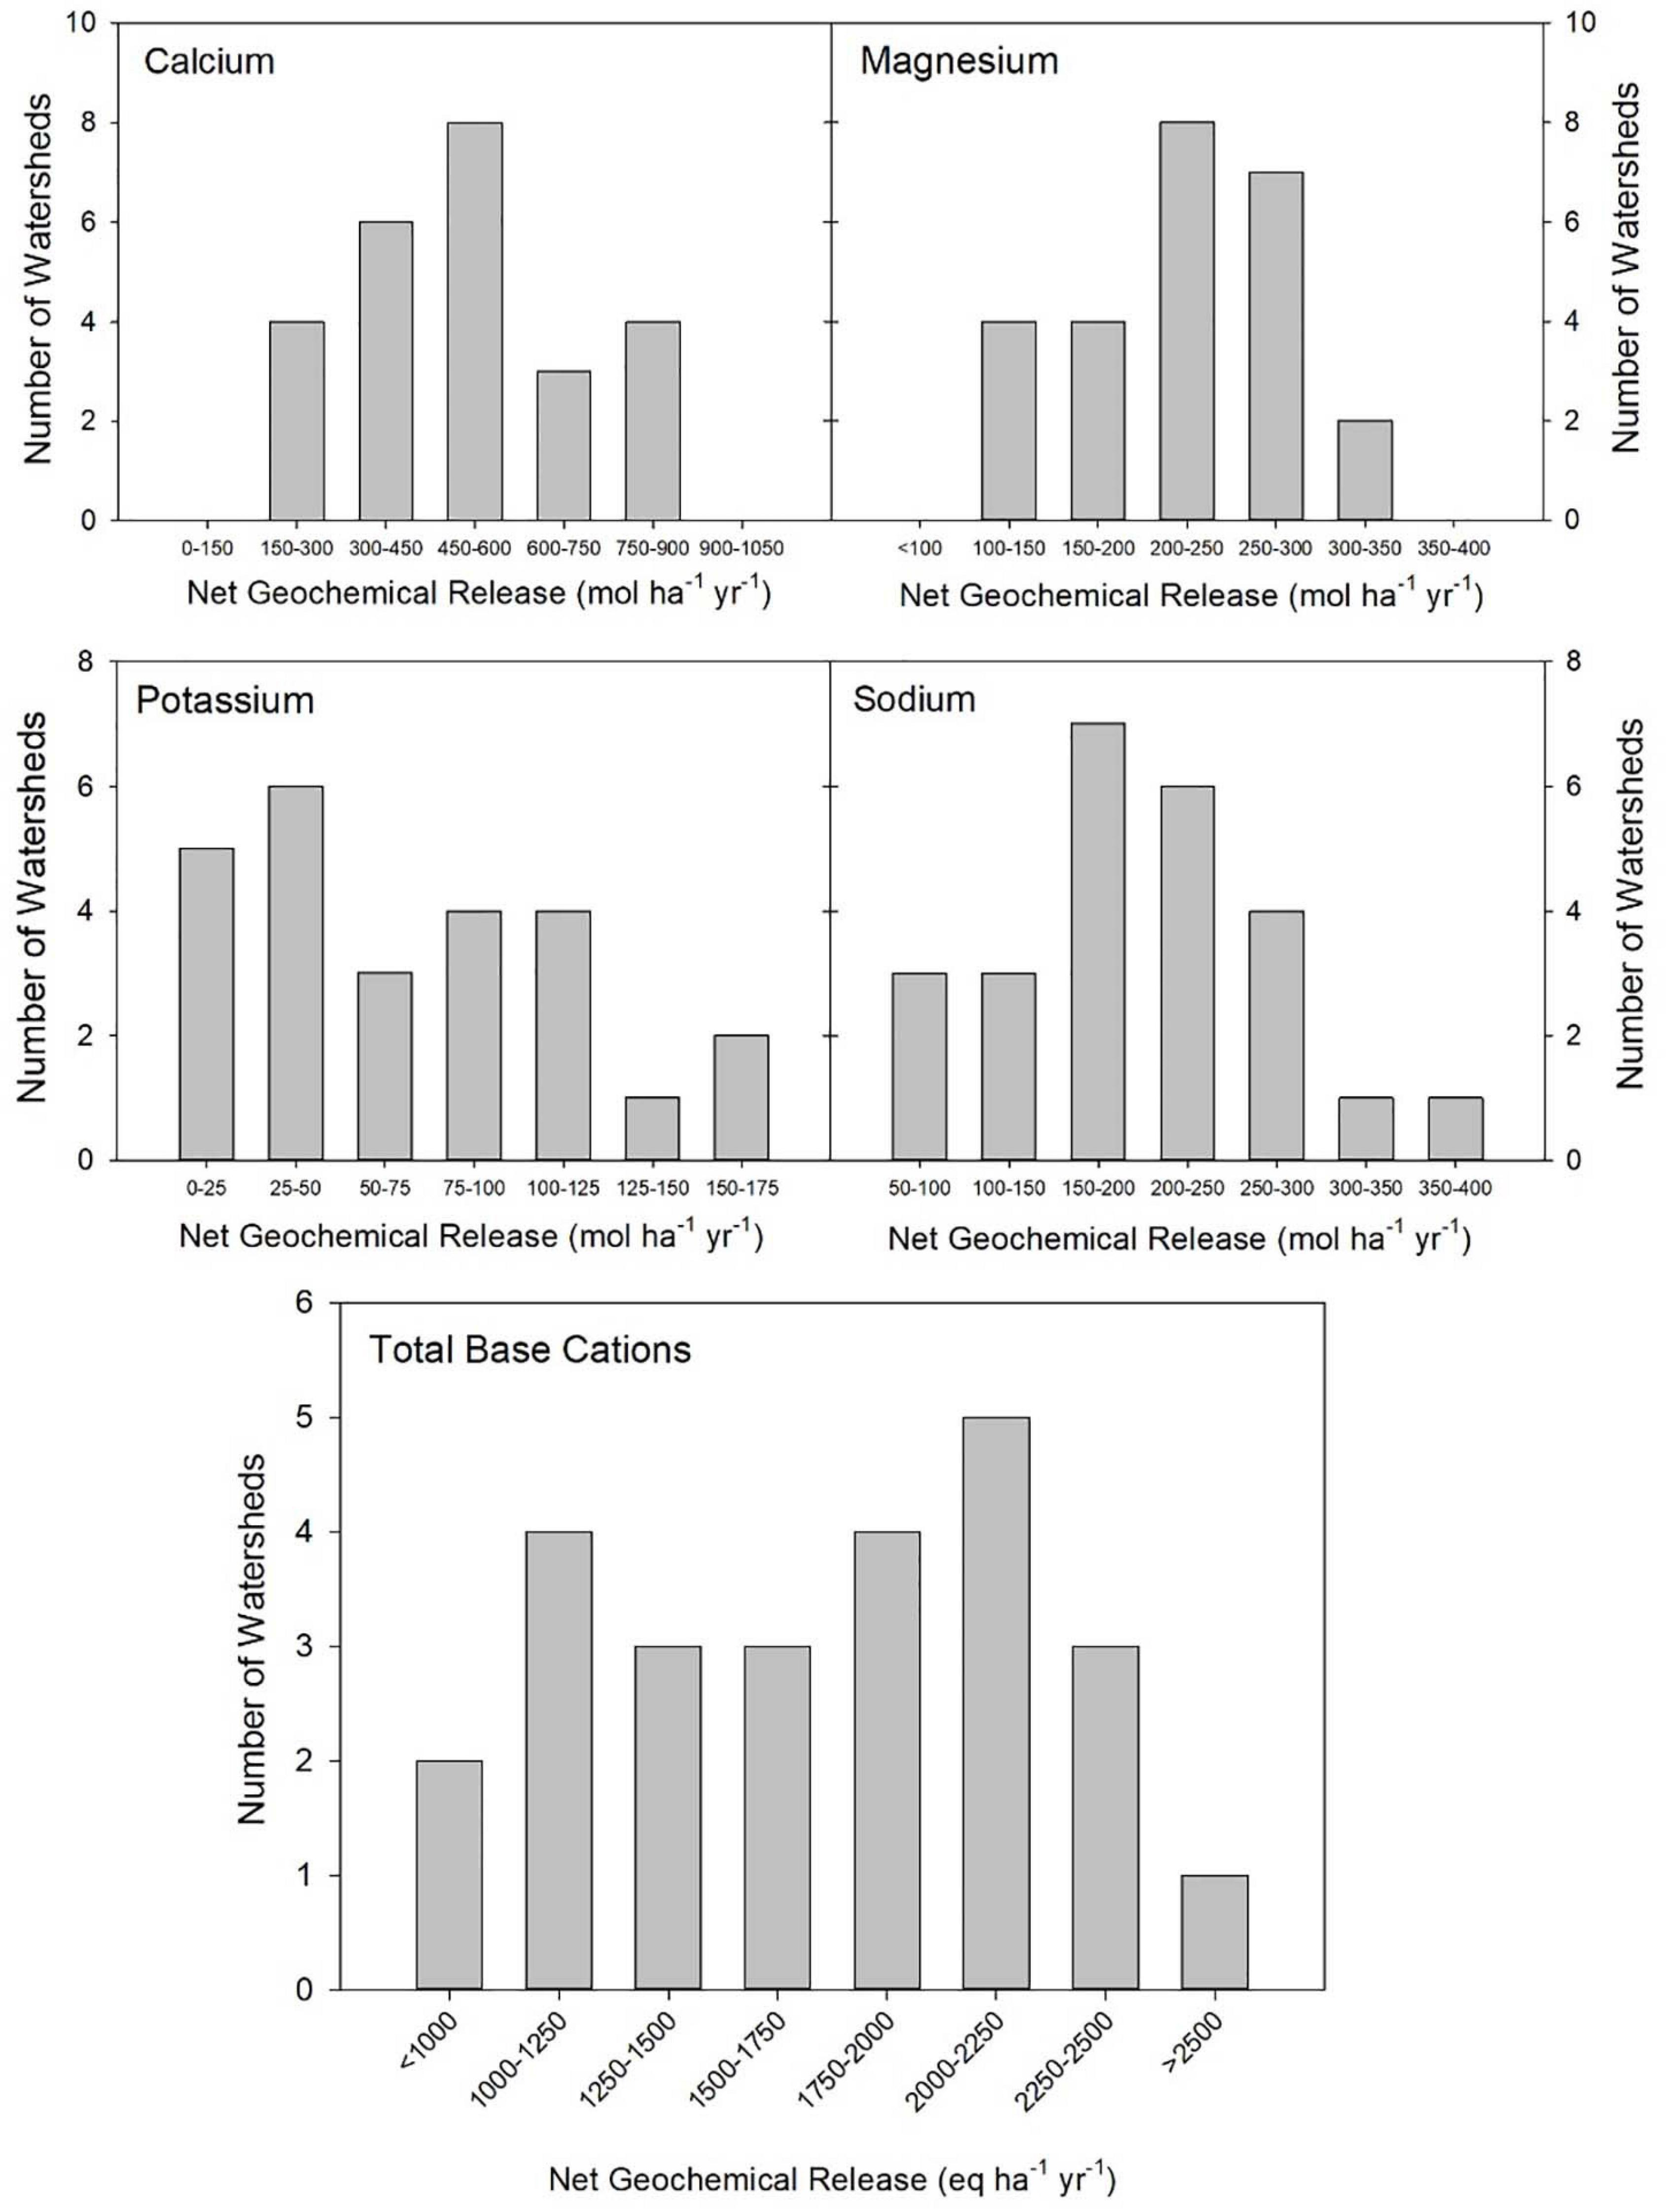
Figure 3. Histograms of net geochemical release rates using the mass-balance approach.
The watersheds with the lowest rates of net base cation release were Windham Ridge (watershed #6), Pecoy Notch (#24) and Black Brook (#37) (Table 4). Winnisook (#15) had the lowest net geochemical release rate for total base cations (928 eq ha–1 yr–1) and the lowest net H+ consumption rate (8 eq ha–1 yr–1) (Table 4). Black Brook had the lowest net release rate for Na (87 mol ha–1 yr–1) (Table 4). Windham Ridge had the lowest net release of Ca and K (209 and 17 mol ha–1 yr–1, respectively), while Pecoy Notch had the lowest net release for Mg (129 mol ha–1 yr–1).
The watersheds with the highest net geochemical release rates (Table 4) were Hollow Tree, Little Timber, and Fall Brook (watersheds #35, #8, and #17). Hollow Tree had the highest Ca, Mg, and total base cation release rates (815, 327 mol ha–1 yr–1 and 2,622 eq ha–1 yr–1, respectively) (Table 4). Little Timber had the highest Na net release rate (368 mol ha–1 yr–1), while Fall Brook had the highest rate for K (161 mol ha–1 yr–1). The Myrtle watershed (#43) had the highest net H+ consumption (211 eq ha–1 yr–1) (Table 4). Hollow Tree also had relatively high net geochemical release rates for Na and K (264 and 74 mol ha–1 yr–1, respectively) and a high net H+ consumption rate (197 eq ha–1 yr–1) (Table 4).
Precipitation input played a relatively minor role in the input-output budgets of base cations in the study watersheds. Consequently, the calculation of the net geochemical release rates was heavily dependent on the biomass uptake and stream export terms (Figure 4). For example, at the Biscuit Brook and Black Brook watersheds, we estimated that Ca input via precipitation averaged 24.8 and 22.3 mol ha–1 yr–1, respectively (Figure 4). In contrast, the biomass accumulated Ca at estimated average rates of 126 and 133 mol ha–1 yr–1 at Biscuit Brook and Black Brook, respectively, and Ca was exported via streamflow at average rates of 286 and 595 mol ha–1 yr–1, respectively (Figure 4). Therefore, biomass uptake and stream export were the dominant terms in the estimation of net geochemical release rates of base cations using the mass-balance approach.
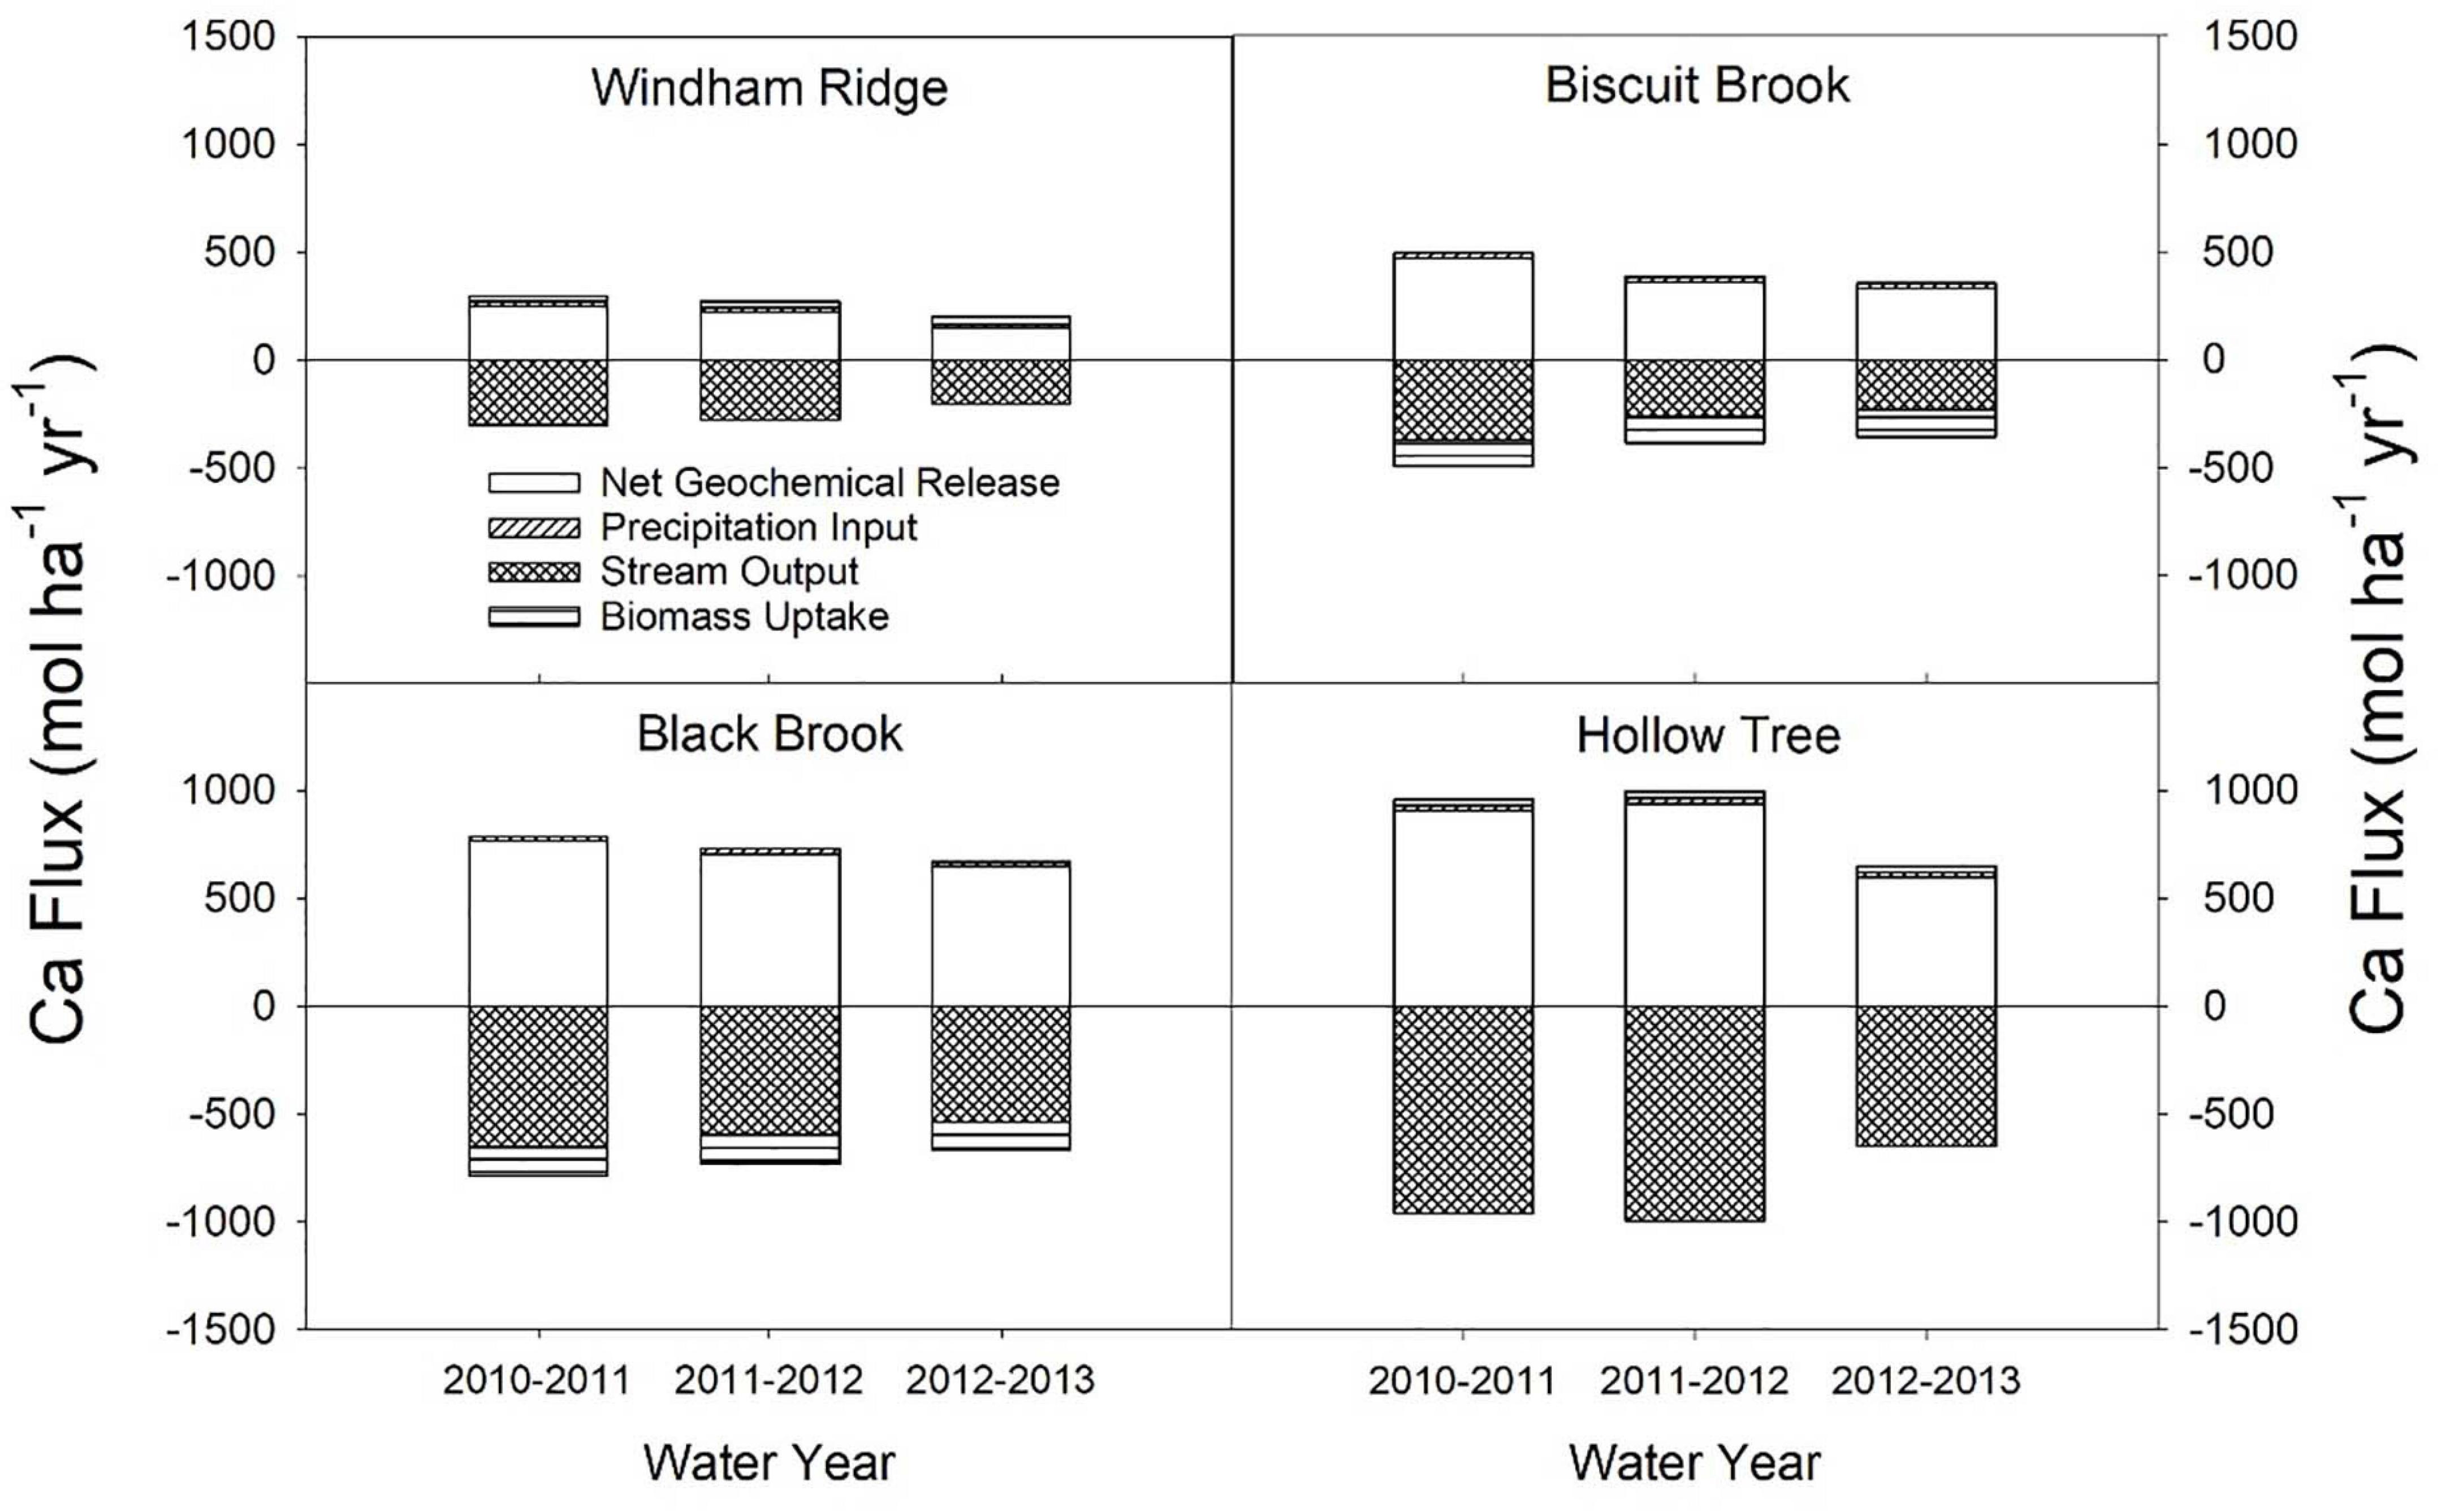
Figure 4. Terms used in calculating the net geochemical release rate of Ca using the mass-balance method in four watersheds (mol ha– 1 yr– 1). Positive values indicate sources of Ca and negative values indicate sinks. Windham Ridge had the lowest net geochemical release rate for Ca in the study, while Hollow Tree had the highest. Note that biomass uptake may be either a source or sink of base cations depending on whether the forest is declining or aggrading.
From 2010 to 2013, decreasing trends in both atmospheric deposition and stream export of base cations were observed (Table 5). Sulfate in precipitation decreased by 32% from 2010 to 2013, NO3– was reduced by 19%, and Ca exported via stream water decreased by 34%. Calcium and the total base cations showed decreases in stream export each year, while Mg, Na, and K either increased or remained constant from the 2011 water year to 2012 and then decreased in 2013 (Table 5). The year-to-year trends in net geochemical release rates of base cations were consistent with the trends in acid deposition and stream export of base cations (Table 4). The average net geochemical release rates of Mg, Na, and K increased slightly from the 2011 water year to 2012 and then decreased in 2013, while Ca and the total base cations showed decreases in net release rates each year (Table 4).
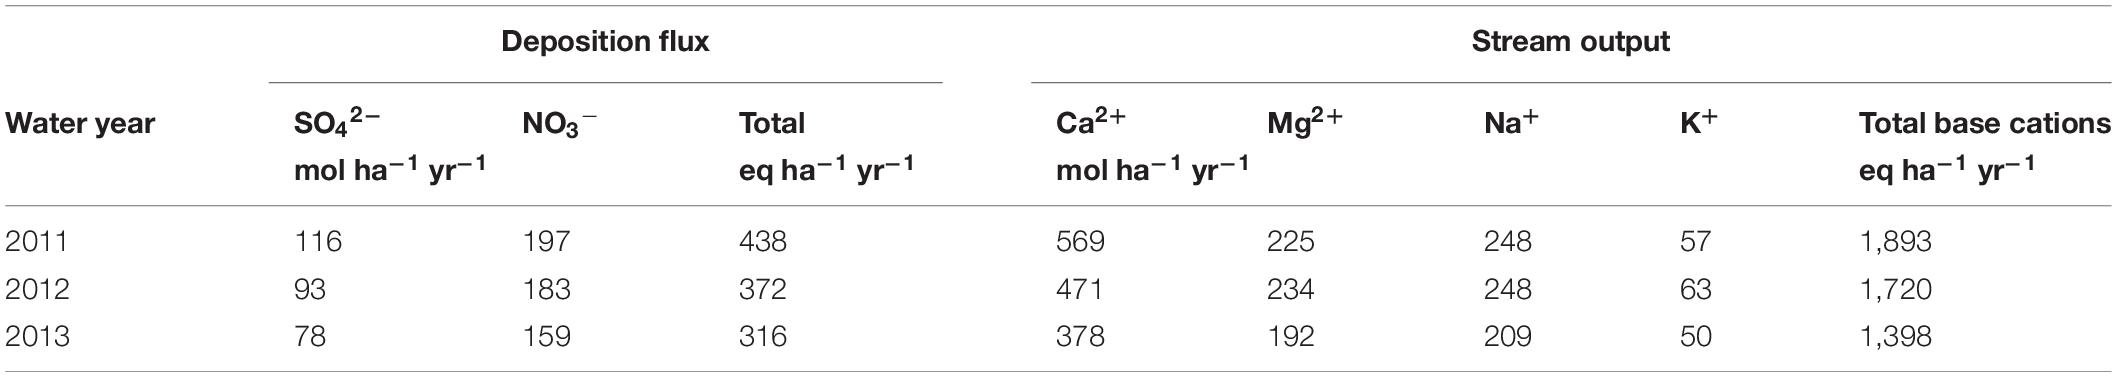
Table 5. Average annual deposition fluxes of SO42– and NO3– and average annual stream output of base cations for all watersheds.
Patterns Related to Bedrock Types
The major geological formations in the study area are the Lower and Upper Walton formations and the Oneonta formation. The Lower and Upper Walton formations are composed of sandstone, red, green, and dark gray shale/mudstone, and minor conglomerates. The Oneonta formation is composed of sandstone, minor conglomerates, and red, green, and dark gray shale/mudstone (Ver Straeten, 2013). Sandstone in the Catskills consists of litharenites, which are rich in quartz and sand-size grains composed of weathered rock (Ver Straeten, 2013). The major grain types of the sandstones in the Catskills include quartz, metamorphic, and sedimentary rock pieces with lesser quantities of feldspars, igneous rock fragments, dolostone, rare calcite, and clay-size particles (Ver Straeten, 2013). Catskill shales and mudstones are composed of microscopic clay minerals, with illite and chlorite dominating the clay minerals (Ver Straeten, 2013). Conglomerates, on the other hand, are sedimentary rocks that are rich in gravel.
Bedrock type has a significant influence on net geochemical release rates of base cations (Figure 5). With the exception of Na, we observed higher release rates in watersheds located on the Lower and Upper Walton formations and lower release rates on the Oneonta formation (Figure 5). The watersheds on the Oneonta formation had an average total base cation release rate of 1,089 eq ha–1 yr–1, whereas the watersheds on the Lower and Upper Walton formations experienced on average, higher net geochemical release rates of total base cations (1,741 and 1,989 eq ha–1 yr–1, respectively) (Figure 5).
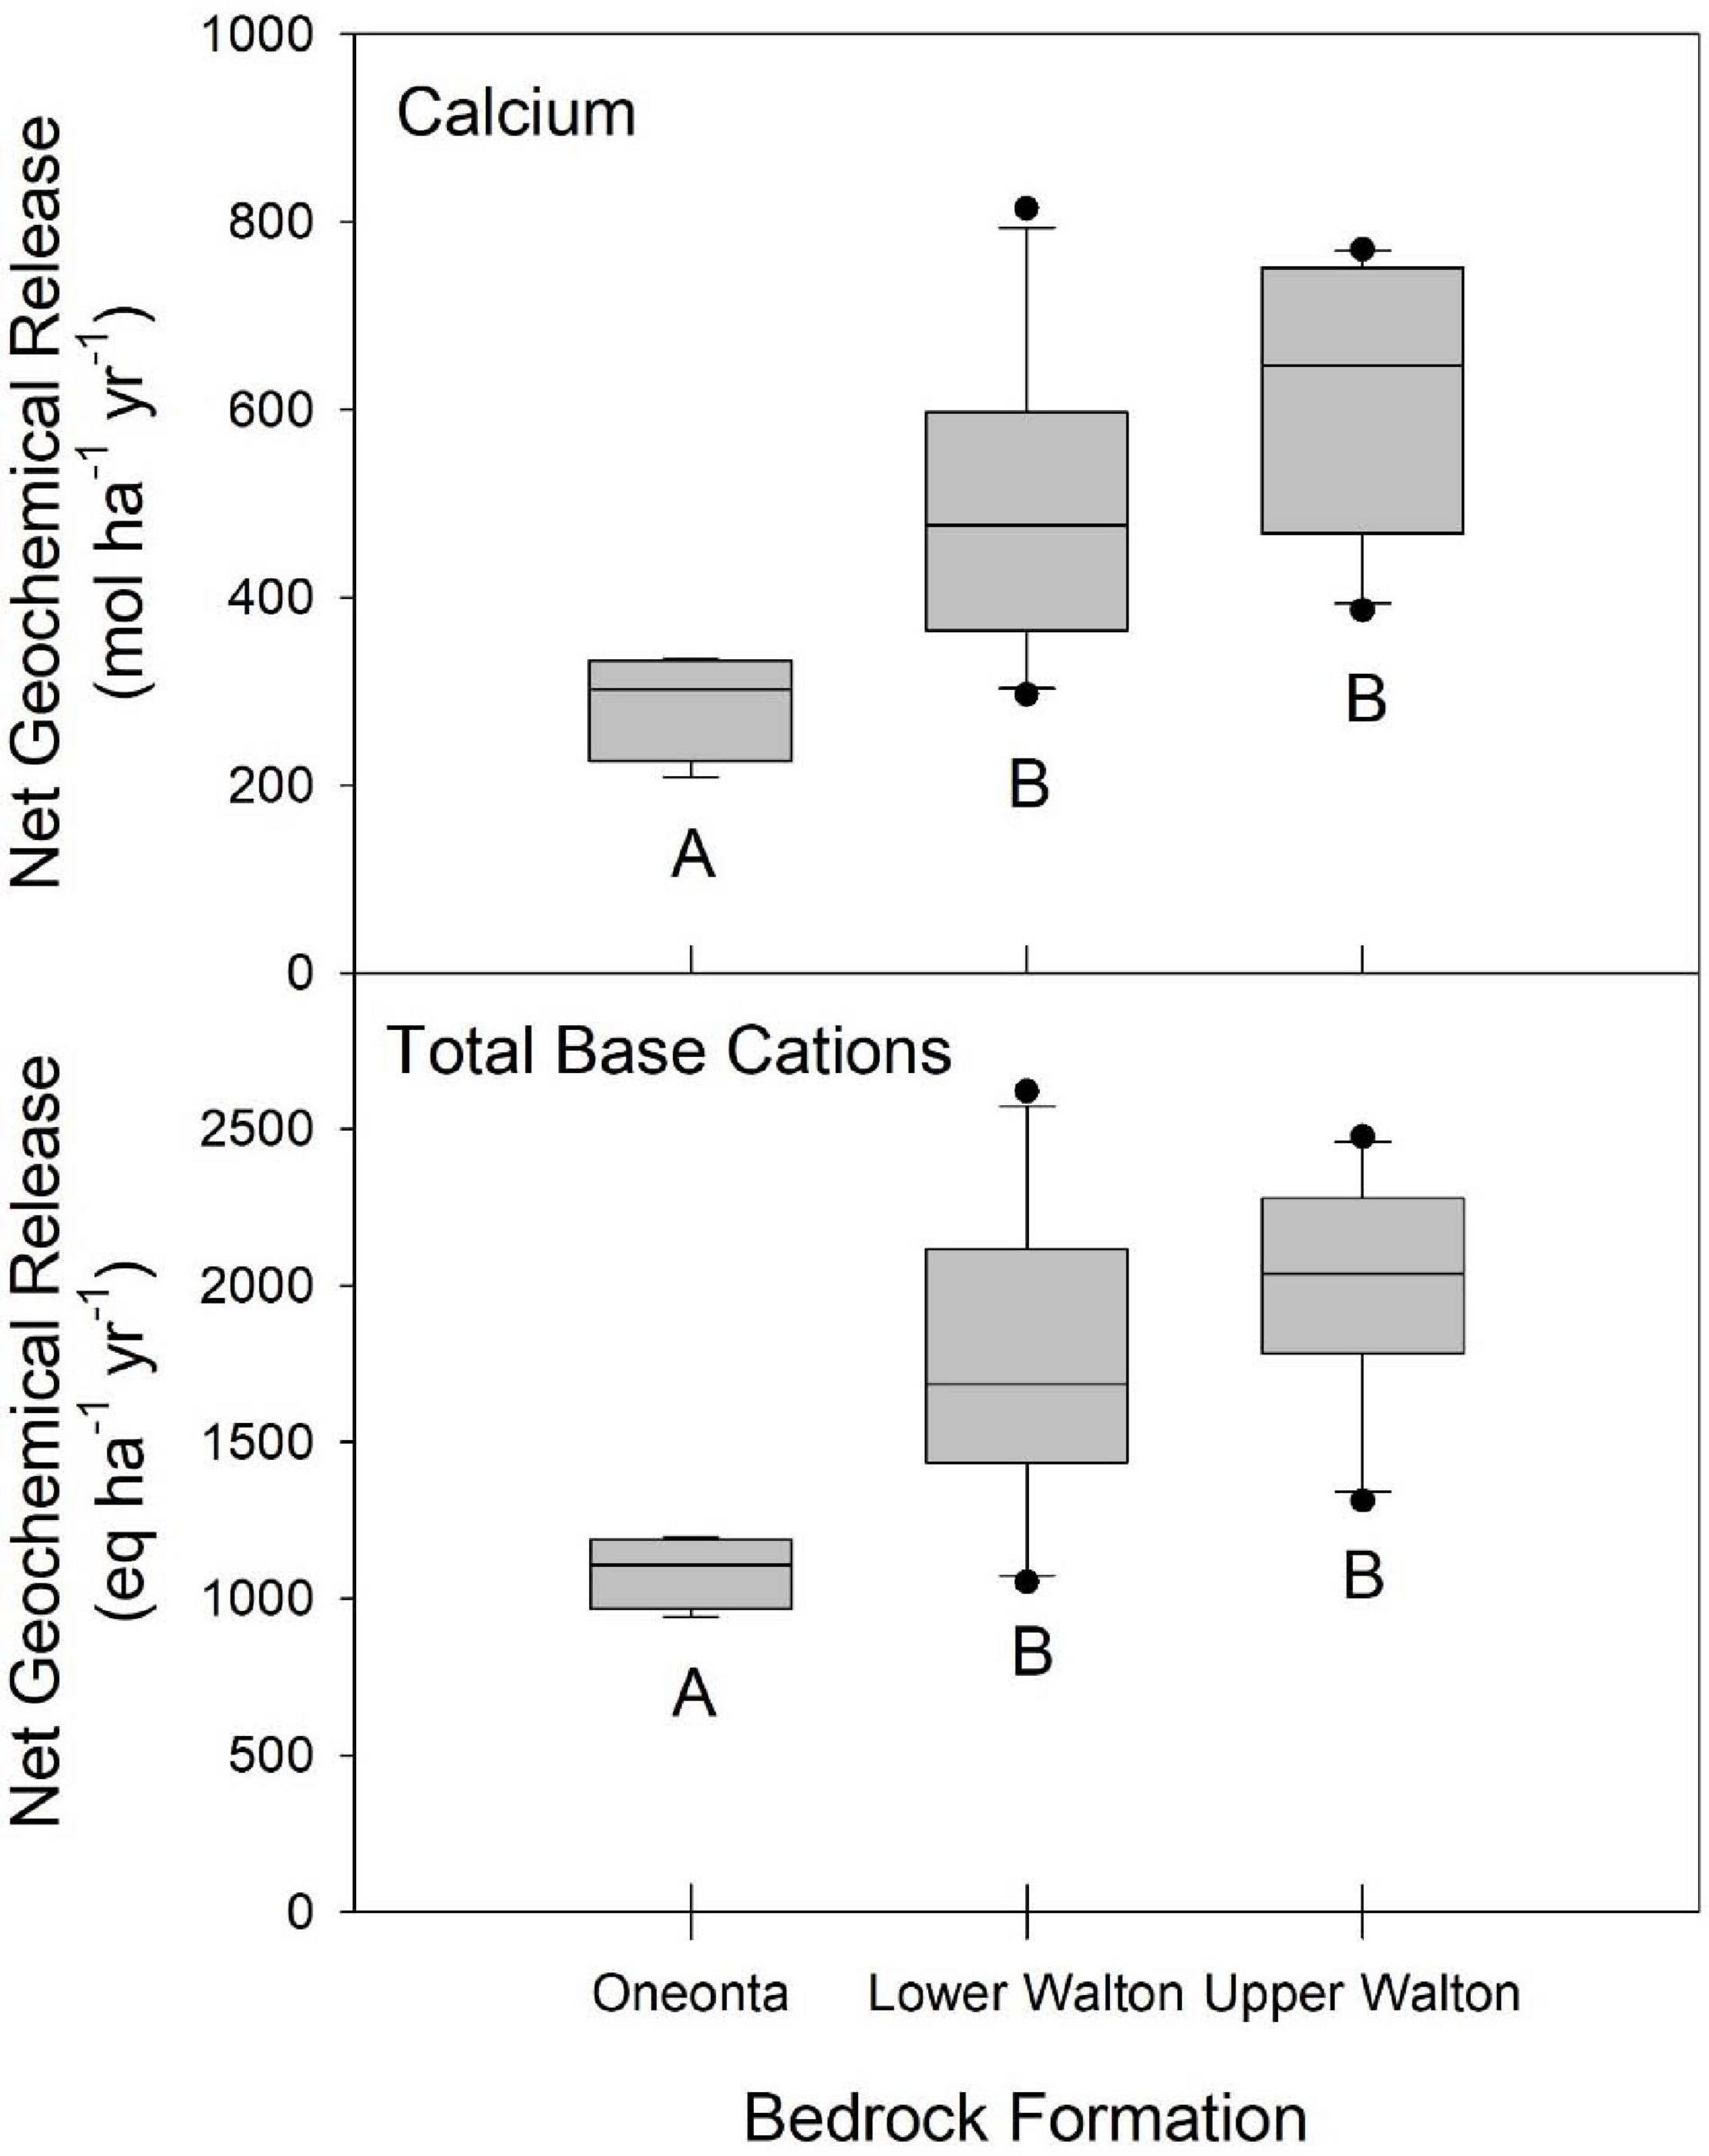
Figure 5. Net geochemical release rates for the three dominant bedrock types. For the Oneonta, Lower Walton, and Upper Walton Formations, N = 4, N = 10, and N = 11, respectively. Median values are shown as a bold lines, the extent of the boxes are defined by the lower (25%) and upper (75%) quartiles. Individual values are plotted for samples that lie more than 1.5 times the interquartile range from the box. Differing letters indicate significantly different means, using one-way ANOVA (P < 0.05).
Discussion
Watershed Mass Balances
Mass-balance studies have been used extensively in the United States and Europe to monitor the impact of acidic deposition on water quality and ecosystem processes. Using this approach, we found that Ca and total base cations were released from soil and parent materials in the Catskill watersheds at average rates of 498 mol ha–1 yr–1 and 1,704 eq ha–1 yr–1, respectively, between 2010 and 2013. In the United States and Europe, similar geochemical release rates have been observed using this approach. Johnson et al. (1994) compiled the net release rates of base cations in catchments affected by acidic deposition located throughout the United States and Europe. They reported a range of Ca net release rates between 0 and 575 mol ha–1 yr–1, with the lowest release rate occurring at a spruce-dominated catchment in the Solling forest region of Germany and the highest rate occurring at the Panther Lake watershed in the Adirondacks. The range in the total base cation release rate was found to be between 160 and 2,290 eq ha–1 yr–1, with the lowest release rate occurring at the Zota catchment in the southern Alps of Switzerland and the highest release rate occurring at the X-14 catchment in the Czech Republic (Johnson et al., 1994). The catchments in the Catskills were on the upper end of this range of net geochemical release rates; indeed, 36% of the Catskill watersheds had average Ca release rates greater than the range reported by Johnson et al. (1994). The total base cation release rates for the Catskill catchments were more often within the range of values listed in Johnson et al. (1994), with 22 of the 25 Catskill catchments falling within the range of values reported for catchments across the United States and Europe. It is worth noting that many of the studies reported by Johnson et al. (1994) did not factor vegetation uptake into their weathering calculations. If they had done so, many of these estimates would have been higher than the reported values.
Estimating biomass uptake of base cations proved to be essential to the mass-balance estimates. Biomass uptake of base cations was one of the most important terms in the estimation of net geochemical release rates in the Catskills using the mass-balance approach. The net biomass uptake of Ca, for example, ranged from -31 mol ha–1 yr–1 at the Myrtle watershed to +161 mol ha–1 yr–1 at Kelly Hollow. Negative uptake values occurred where forest biomass was declining over time. In this circumstance, forest vegetation represents a net source of base cations. The variation in both the magnitude and sign of this term indicates that estimating biomass uptake should be considered when calculating input-output budgets of base cations in watershed studies. However, the biomass term is often disregarded in input-output studies. FIA data are publicly available for forested lands across the United States. Therefore, it should be possible to incorporate biomass uptake estimates into mass-balance studies in the United States to obtain more accurate estimates of net release rates.
Depletion of base cations from cation exchange sites in the soil can only account for a fraction of the net geochemical release in Catskills watersheds. Depletion of exchangeable Ca from O horizons and surface mineral soils between 1984 and 2001 averaged 47 mol ha–1 yr–1 (Table 3). This represents less than 10 percent of the average net geochemical release for the study watersheds (498 mol ha–1 yr–1) and only 23 percent of the minimum net release rate (209 mol ha–1 yr–1, at Windham Ridge; Table 4). Depletion of other exchangeable cations was negligible, ranging from 1.5 mol ha–1 yr–1 for Na to an average net accumulation of 3.1 mol ha–1 yr–1 for K (Table 3), all less than two percent of the estimated net geochemical release rates. Exchangeable base cation pools in Catskills soils are very small. For example, the average pool of exchangeable Ca in the entire soil profile in the 25 study watersheds was estimated to be 10,055 mol ha–1 in 2011 (Johnson, 2013). If depletion of exchangeable Ca were the sole source of the net geochemical depletion we observed, all of the exchangeable Ca would be gone in just 17.5 years. Therefore, the net geochemical release must be largely explained by mineral weathering in soils, glacial till and bedrock underlying the watersheds. The net export of base cations in streamwater is largely driven by weathering release, which in turn reflects strong acid inputs.
In the Great Smoky Mountains National Park, Cai et al. (2010) used an input-output budget to estimate net base cation release in the high-elevation Noland Divide Watershed. They used wet deposition, throughfall, soil lysimeters, and stream collection stations located in the watershed to create input-output budgets for the period of 1991–2006 (Cai et al., 2010). Net ion retention or depletion in the watershed was estimated as the difference between throughfall and stream export. They estimated average annual atmospheric deposition fluxes of SO42– and NO3– of 1,110 and 1,073 mol ha–1 yr–1, respectively, an order of magnitude greater than the annual deposition fluxes of SO42– and NO3– we estimated for the Catskills in 2010–2013 (96 and 180 mol ha–1 yr–1, respectively). The higher deposition of SO42– and NO3– in the Great Smoky Mountains reflects higher rates of atmospheric acid deposition occurring at the earlier point in time and the higher elevation of the watershed (1,680–1,920 m mean sea level; Cai et al., 2010) than the watersheds in the Catskills.
Cai et al. (2010) found that Ca, Mg, Na, and K were exported from Noland Divide at average rates of 433, 165, 443, and 182 mol ha–1 yr–1 from 1991 to 2006, respectively. In the Catskills, Ca, Mg, Na, and K were exported at similar average rates of 472, 217, 235, and 57 mol ha–1 yr–1 between 2010 and 2013, respectively. However, the estimated net geochemical release rates of base cations in the Catskills were much greater than in the Noland Divide Watershed. In the Catskills, Ca, Mg, Na, and K were released at average rates of 498, 218, 200, and 72 mol ha–1 yr–1, respectively, from 2010 to 2013. In the Great Smoky Mountains, Ca, Mg, and Na were released at average rates of 39, 23, and 66 mol ha–1 yr–1, respectively, and K was retained at 447 mol ha–1 yr–1 between 1991 and 2006 (Cai et al., 2010). In the Noland Divide Watershed, the authors made the assumption that the retention of the K was due to assimilation into forest biomass since they did not account for biomass uptake in their calculations. If 447 mol ha–1 yr–1 of K was taken up by forest biomass, it is likely that hundreds of mol ha–1 yr–1 of Ca and Mg were also assimilated, which would raise the estimated geochemical release rates at Noland Divide to levels similar to the estimates for the Catskills.
Net geochemical fluxes were also estimated using a geochemical mass balance approach by Hyman et al. (1998) in the Cone Pond watershed in central New Hampshire from 1989 to 1994. The Cone Pond watershed is susceptible to continued acidification as a result of low-alkalinity drainage waters, acidic Spodosol soils, and a thin layer of glacial till. Hyman et al. (1998) developed mineral weathering reactions using mineral abundance throughout the soil profile and mineral chemistry. They found that the weathering of plagioclase feldspar was the principal weathering reaction (171 mol ha–1 yr–1; Hyman et al., 1998). Calcium had an average net geochemical release rate of 75 mol ha–1 yr–1; however, silicate weathering was responsible for only 71% of the Ca release, with the remaining 22 mol ha–1 yr–1 attributed to the depletion of exchangeable Ca from soil pools (Hyman et al., 1998). The catchments in the Catskills had average net Ca and Mg release rates of 498 and 218 mol ha–1 yr–1, respectively, nearly an order of magnitude greater than the average net release rate of Ca and Mg (34.7 mol ha–1 yr–1) in Cone Pond. In addition, the average net release rates of Na and K at Cone Pond (129.1 and -2.3 mol ha–1 yr–1, respectively) were lower than those observed in the Catskills (200 and 72 mol ha–1 yr–1, respectively). Hydrogen ion was neutralized at an average rate of 356 eq ha–1 yr–1 at Cone Pond and 177 eq ha–1 yr–1 in the Catskills. At Cone Pond, H+ inputs were not completely neutralized; 52% was neutralized via silicate weathering and 42% was exported via streamflow (Hyman et al., 1998). The thin till and base-poor conditions at the Cone Pond watershed resulted in shorter residence time for groundwater; as a result, the soil was not able to neutralize acidic inputs (Hyman et al., 1998). The lower net H+ consumption rate in the Catskill watersheds despite much greater net geochemical release rates indicates that there is an important internal source of H+ in the watersheds. Carbon dioxide produced by respiration in the soil is likely to be the principal mechanism of internal H+ generation.
April et al. (1986) estimated net geochemical release rates for base cations using mass balances in two watersheds in the Adirondacks—Woods Lake and Panther Lake, which were impacted by acid deposition. These two watersheds were intensively monitored during the 1970s and 1980s as part of the Integrated Lake-Watershed Acidification Study (ILWAS), with the purpose of studying the effects of acid deposition on lake acidification in the northeastern United States. April et al. (1986) used the composition of stream water in both watersheds and estimates of inputs via wet and dry deposition to estimate weathering rates for 1978–1980. The average mass-balance-based base-cation release rates for the Woods Lake and Panther Lake watersheds in comparison to this study are shown in Table 6.
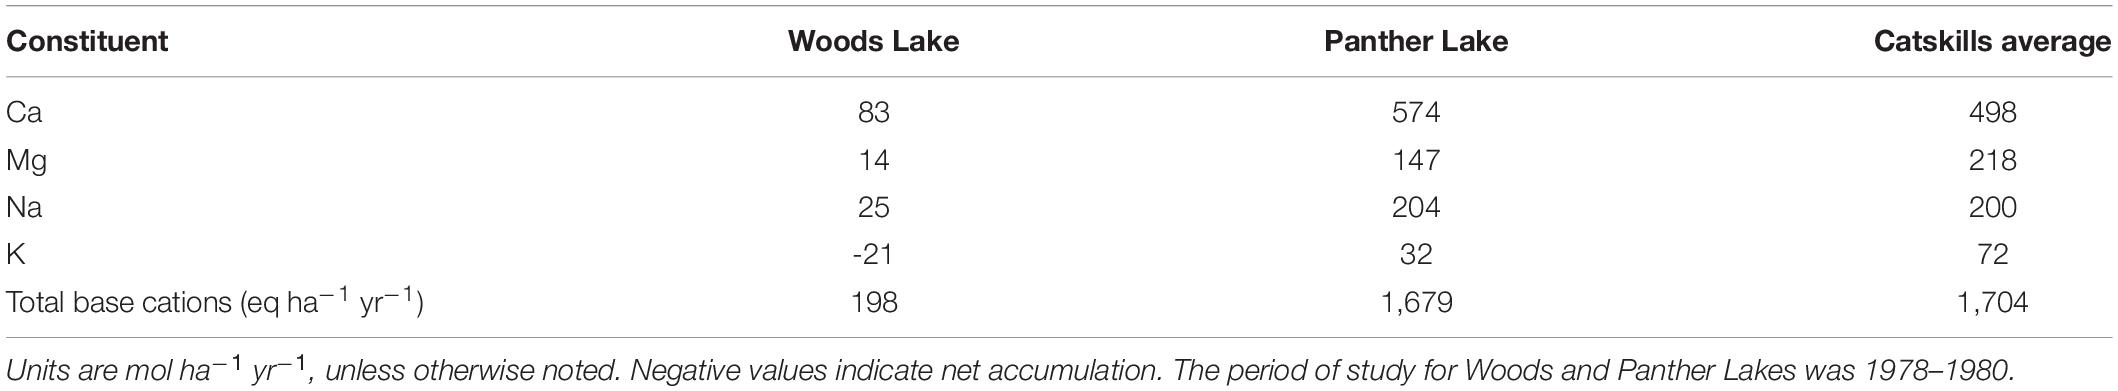
Table 6. Average net geochemical release rates for two watersheds in the Adirondacks (April et al., 1986) and for the watersheds in this study.
The Catskill watersheds in this study generally experienced higher net geochemical release rates than the two watersheds in the Adirondacks. In the Woods Lake watershed, the authors determined that weathering reactions were not adequate to neutralize the acid inputs (April et al., 1986). The lower base-cation release rates in the Woods Lake watershed were attributed to a combination of a decline in the amount of mineral surfaces exposed to weathering, thin soil and till exposure in the basin, and high surface runoff within the watershed (April et al., 1986). The shallow soils and thin till at the Woods Lake watershed result in shorter residence time for groundwater and were not able to neutralize acidic inputs fully (April et al., 1986).
In the Panther Lake watershed, the estimated average total base cation release rate was 1,679 eq ha–1 yr–1, similar to the average total base cation release rate for the Catskill watersheds in 2010–2013 of 1,704 eq ha–1 yr–1. Higher rates in Panther Lake, compared to Woods Lake, were attributed to thicker till and deeper flow paths in the Panther Lake watershed. Unlike the Woods Lake watershed, acidic deposition was largely neutralized in the Panther Lake watershed as a result of the deeper glacial till (April et al., 1986). In the Catskill watersheds, which also feature relatively deep till, the average total base cation release rate (1,958 eq ha–1 yr–1) greatly exceeded the average net H+ consumption rate (177 eq ha–1 yr–1). These three watersheds thus span a range of H+ neutralization conditions. In Woods Lake and Panther Lake in the 1980s, weathering was driven by strong acid inputs, with Woods Lake soils unable to completely neutralize those inputs. In the Catskills in 2010–2013, strong acid inputs represented only about 10% of the H+ required to generate the observed weathering fluxes. Weathering in these watersheds appears now to be largely driven by CO2 acidity derived in watershed soils.
Relation to Parent Material and Bedrock Geology
To determine if the net geochemical release rates of base cations are proportional to concentrations found in the parent material, we computed the molar ratios of the release rates for the base cations and compared them to those in C horizon soils. The parent material of soils in the Catskills is extremely base-poor. Using Na as a reference element for mineral weathering, molar ratios were computed for Ca:Na, Mg:Na, and K:Na. The average molar Ca:Na ratio for the net geochemical release rates was 2.49, whereas the molar Ca:Na ratio in C horizon soils was much lower (0.20). In contrast, the Mg:Na and K:Na ratios in C horizon soils (5.74 and 9.13, respectively) were both much larger than the ratios for the net geochemical release rates (1.09 and 0.36, respectively). Incongruous rates of base cation release, often featuring elevated Ca losses, have been reported in numerous weathering studies (Johnson et al., 1994). Nevertheless, the very high net geochemical release rates for Ca in Catskills watersheds, relative to other base cations, suggests a source of Ca below the C horizon, in deeper till layers or bedrock fractures.
We observed that the watersheds with the highest net geochemical release rates were underlain by the Upper Walton formation, while the watersheds with the lowest net release rates were located on the Oneonta formation (Figure 5). Watersheds underlain by the Lower Walton formation were intermediate, with net geochemical release rates significantly greater than those in watersheds on the Oneonta formation. According to Ver Straeten (2013), the Lower and Upper Walton formations have greater amounts of shale and mudstone than the Oneonta formation. Shales and mudstones contain a large fraction of clays and are bonded together by compaction, dewatering, and clay diagenesis, not by cementitious materials (Ver Straeten, 2013). Therefore, the shales and mudstones in the Lower and Upper Walton formations have relatively low rock strength and are less resistant to weathering. Unlike the Lower and Upper Walton formations, the Oneonta formation has a larger fraction of conglomerates. Conglomerates have a higher rock-strength than the shales and mudstones, and as a result, they are more resistant to weathering (Ver Straeten, 2013). The weathering processes that are largely responsible for the production of base cations in Catskill watersheds may be occurring in soils, till or underlying bedrock. However, the weathering signature of the underlying bedrock is particularly important because the soils develop in till, which is largely derived from local sources.
Geographic Factors That May Influence Weathering Rates
Higher elevations in the Catskills are dominated by very resistant sandstone and conglomerate units while the lower elevations are dominated by mudrocks, which are more easily weathered (Ver Straeten, 2013). Therefore, rock units in the higher elevations are more difficult to weather and we expected to find a decrease in base cation release rates with increasing elevation. There was a weak, but significant negative correlation (r = −0.51; P < 0.01) between watershed elevation and the mass-balance-derived net geochemical release rate for total base cations (Figure 6B). There was also a decreasing trend in the release rate of Ca with increasing elevation; however, it was only marginally significant (r = -0.39; P = 0.056; Figure 6A). The lack of strong correlations indicates that factors other than these are more important in determining geochemical release rates.
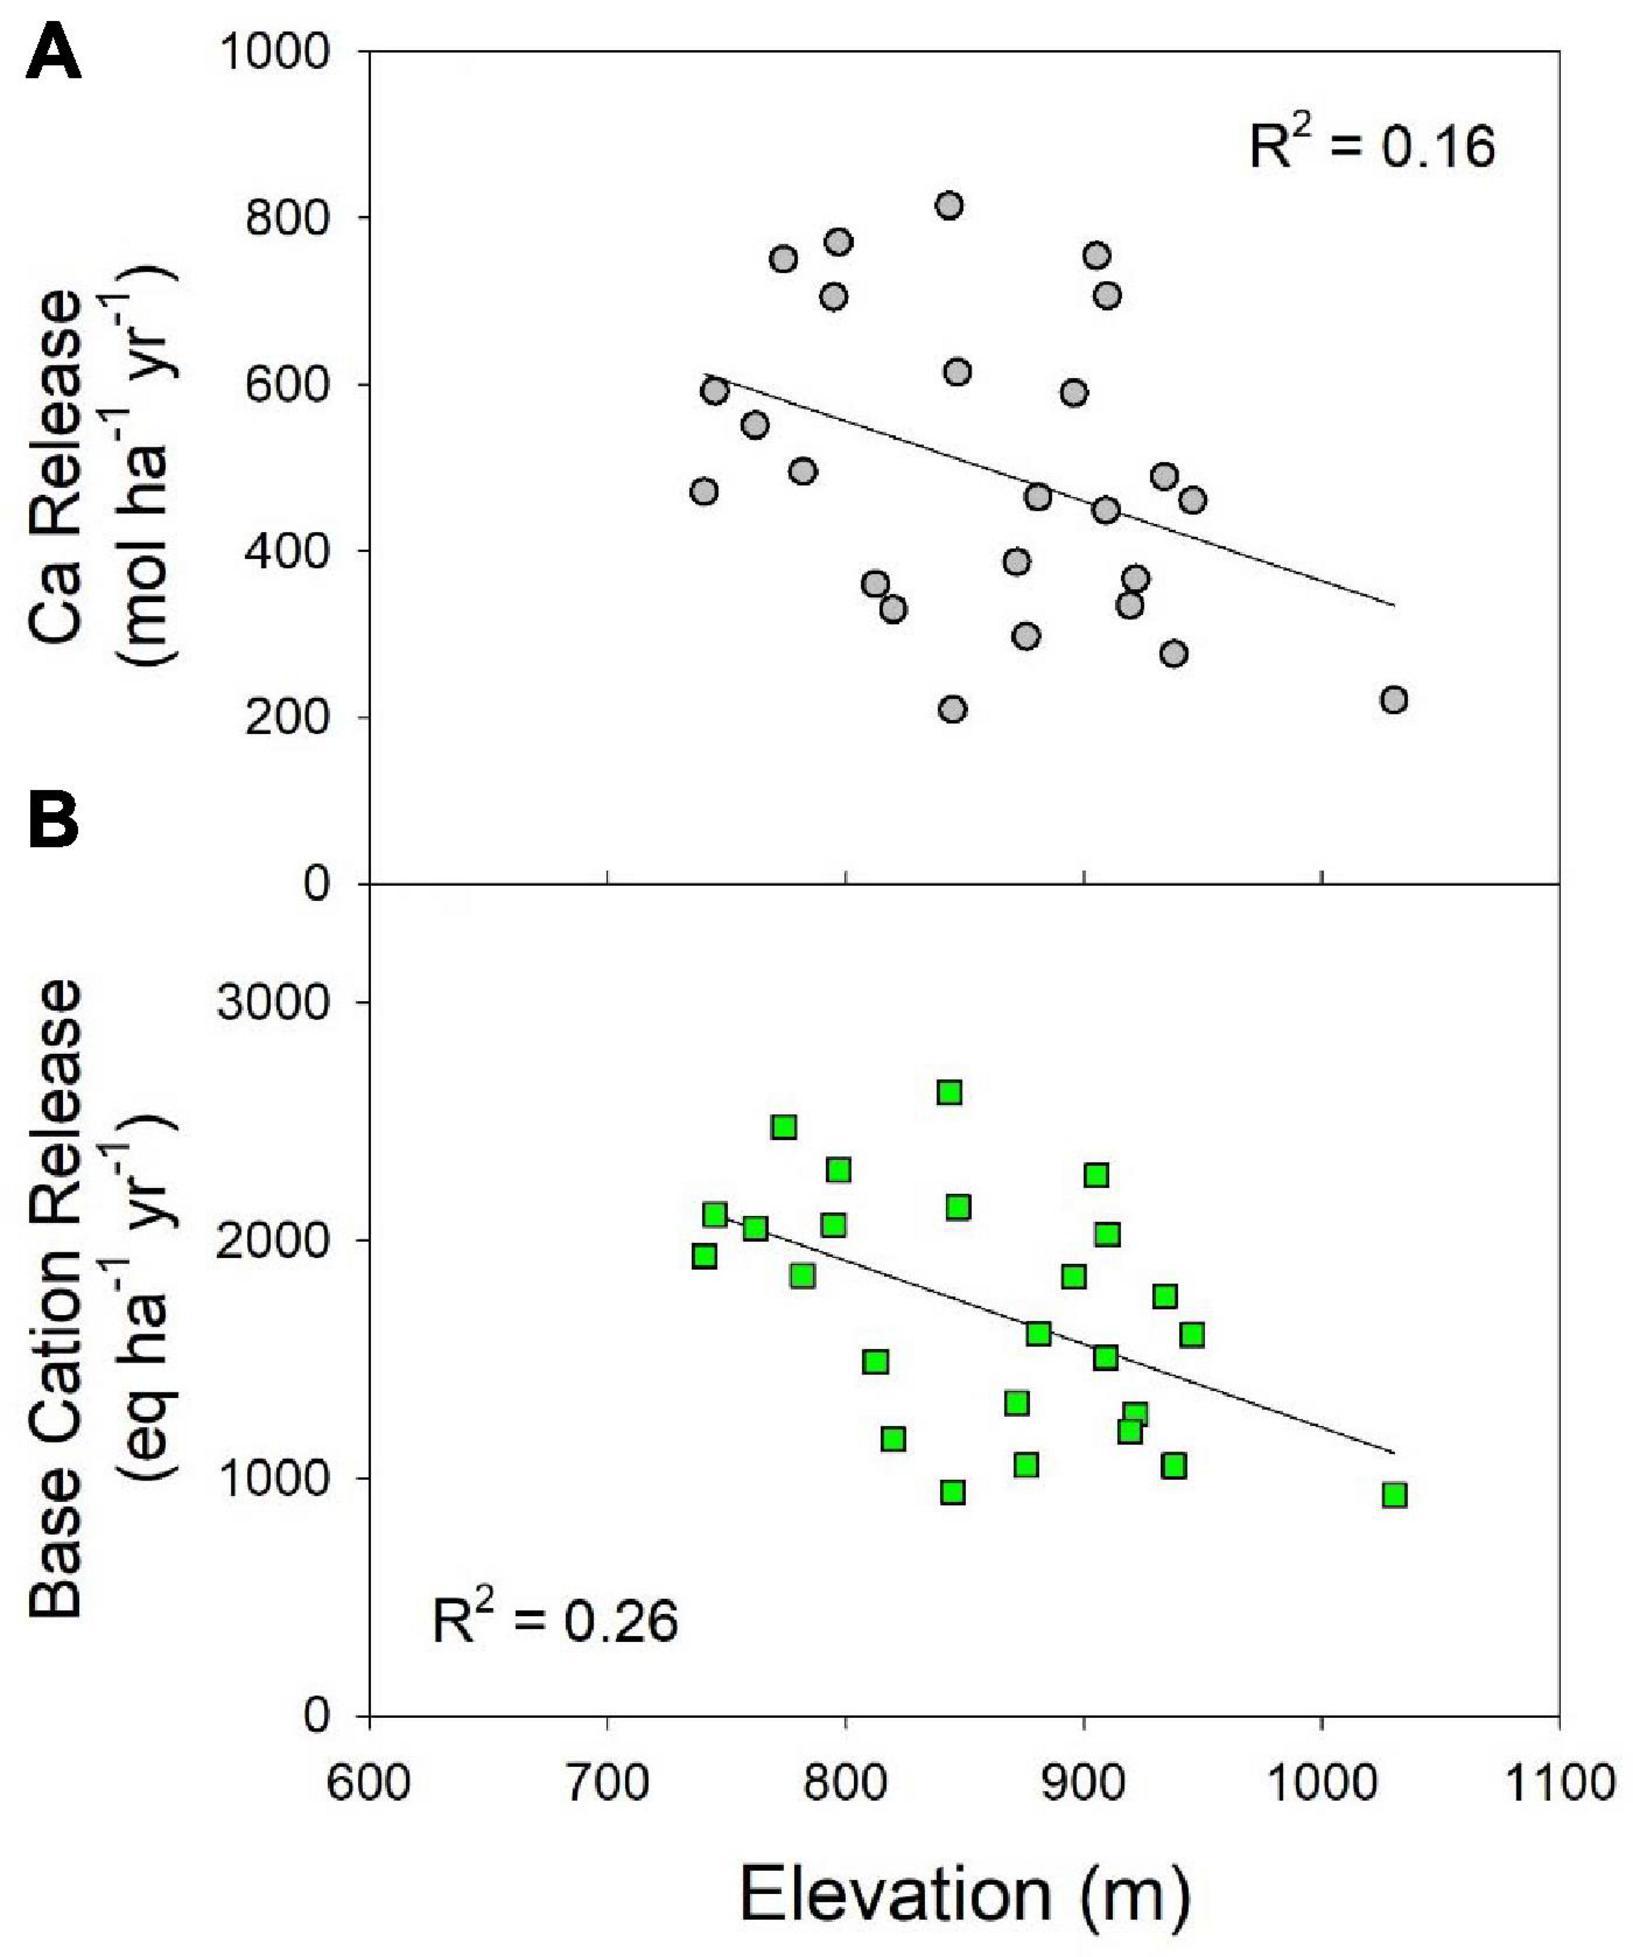
Figure 6. Correlations between watershed average elevation and (A) the net geochemical release rate of Ca (P = 0.055); (B) the total base cation net geochemical release rate (P = 0.009). Least-squares regression lines are shown for reference only.
We also investigated the relationship between the weathering release rates and watershed area. We hypothesized that watersheds with a greater area would have longer average flow paths and greater water residence time in soils, which might result in higher weathering rates (Johnson et al., 1994). However, we did not find any significant correlations between net geochemical release rates and watershed area. In addition, we hypothesized that there would be higher release rates for catchments located on south-facing slopes in the Catskills as a result of warmer temperatures due to higher solar radiation; however, there were no apparent correlations observed between aspect and base cation release rates for the Catskill catchments.
Weathering Rates and Critical Loads
McNulty et al. (2007) utilized national-scale databases to construct mass balance equations in order to estimate critical acid loads and exceedances for forest soils across the United States between 1994 and 2000. Base cation weathering rates were estimated using a clay correlation-substrate method, which required a combination of percent clay and parent material data. McNulty et al. (2007) estimated that the average base cation weathering rate for most of New York State was between 500 and 1,000 eq ha–1 yr–1, with a few localized areas experiencing between 1,000 and 2,000 eq ha–1 yr–1. The average total base cation weathering release rate for this Catskill study (1,704 eq ha–1 yr–1) is near the upper end of the observations from McNulty et al. (2007). Only two of the watersheds in the Catskills (Winnisook and Windham Ridge) had a base cation release rate less than 1,000 eq ha–1 yr–1, while 14 of the watersheds had a release rate between 1,000 and 2,000 eq ha–1 yr–1, and nine watersheds had total base cation release rates greater than 2,000 eq ha–1 yr–1.
For the period of 1994–2000, McNulty et al. (2007) estimated that the average annual critical acid load for the Catskill region was relatively low (less than 2,000 eq ha–1 yr–1) compared to the rest of the United States. The authors also found that forested watersheds in the New England region typically exceeded the critical acid load by more than 500 eq ha–1 yr–1 between 1994 and 2000. Further reductions in acid deposition since 2000 suggest that the rate of critical loads exceedance has likely decreased in the northeastern United States. However, since acid deposition has historically been a driver of mineral weathering, reductions in acid inputs affect weathering rates and, hence, critical loads. We observed year-to-year decreases in total base cation geochemical release rates that corresponded to year-to-year decreases in acid deposition (Table 5). Nevertheless, by 2010–2013 base cation release via geochemical processes was 4.5 times greater than acid deposition inputs to our watersheds (1,704 vs. 375 eq ha–1 yr–1: Tables 4, 5). Together with the observation that only three of the 25 streams we studied exhibited pH values below 6.0 (Winnisook, Falls Brook, Rondout Creek), this suggests that in much of the Catskill region geochemical processes in soils and parent material are now sufficient to neutralize current rates of strong acid inputs.
Conclusion
We estimated annual net geochemical release rates of Ca, Mg, Na, and K for 25 watersheds in the Catskill region for the period 2010–2013 using watershed mass balance concepts. Our results demonstrated the importance of the biomass uptake (which is often ignored in mass-balance studies) and stream export terms for estimating net release of base cations from forested watersheds. Precipitation inputs and the net depletion of exchangeable base cations from soil exchange sites were relatively minor contributors to watershed input-output budgets for base cations. There was a significant relationship between bedrock type and net geochemical release rates, with watersheds located on the Lower and Upper Walton formations having higher base cation release rates, and watersheds located on the Oneonta formation experiencing lower release rates. Net geochemical release rates decreased with increasing elevation, but we did not find strong evidence that they were significantly related to other geographic factors such as aspect and watershed area. The net geochemical release of base cations far exceeded acid inputs on an equivalent basis, suggesting that internal sources of acidity—most likely CO2 generation in watershed soils—have replaced acid deposition as the dominant driver of weathering in these watersheds.
The results of this study will aid in estimating critical loads of acid deposition for the Catskills. Our findings suggest that geochemical processes in soils and parent materials in the region are generally sufficient to neutralize acidic inputs. High base cation release rates relative to atmospheric inputs of strong acids indicate that the ANC of forest soils is adequate. The development and application of critical loads based on field measurements could help to maintain the purity of the water supply for New York City and to preserve the Catskill ecosystem.
Data Availability Statement
The datasets presented in this study can be found in online repositories. The names of the repository/repositories and accession number(s) can be found below: Forest Ecosystem Monitoring Cooperative: https://www.uvm.edu/femc/data/archive/project/soil_mass_chemistry_in_25_catskill_headwater_catchments/dataset/soil-chemistry-forested-catskill-headwater-catchments.
Author Contributions
SN conducted the analyses and drafted the initial version of the manuscript. CJ supervised the research project, including sample collection and analysis, edited and prepared the manuscript for submission, and managed the revision process. Both authors contributed to the article and approved the submitted version.
Funding
This work was funded by the New York State Energy Research and Development Authority (Contracts 16299 and 50771). Additional support for Sara Nieman was provided by Syracuse University’s EMPOWER program (National Science Foundation Grant No. DGE-1449617).
Conflict of Interest
The authors declare that the research was conducted in the absence of any commercial or financial relationships that could be construed as a potential conflict of interest.
Acknowledgments
We gratefully acknowledge the assistance of Mary Margaret Koppers in the lab and field. Gary Lovett (Cary Institute of Ecosystem Studies) kindly provided data and GIS layers for forest types in the Catskills. Charles Canham (Cary Institute of Ecosystem Studies) answered numerous questions about working with FIA data.
Supplementary Material
The Supplementary Material for this article can be found online at: https://www.frontiersin.org/articles/10.3389/ffgc.2021.667605/full#supplementary-material
Footnotes
- ^ http://nadp.slh.wisc.edu/data/sites/list/?net=NTN
- ^ https://www3.epa.gov/castnet/site_pages/CAT175.html
- ^ https://water.usgs.gov/osw/streamstats/
References
April, R., Newton, R., and Coles, L. T. (1986). Chemical weathering in two Adirondack watersheds: past and present-day rates. Geol. Soc. Am. Bull. 97, 1232–1238. doi: 10.1130/0016-7606198697<1232:CWITAW<2.0.CO;2
Bailey, S. W., Hornbeck, J. W., Driscoll, C. T., and Gaudette, H. E. (1996). Calcium inputs and transport in a base-poor forest ecosystem as interpreted by Sr isotopes. Water Resour. Res. 32, 707–719. doi: 10.1029/95WR03642
Bailey, S. W., Horsley, S. B., and Long, R. P. (2005). Thirty years of change in forest soils of the Allegheny Plateau, Pennsylvania. Soil Sci. Soc. Am. J. 69, 681–690. doi: 10.2136/sssaj2004.0057
Bricker, O. P., Paces, T., Johnson, C. E., and Sverdrup, H. (1994). “Weathering and erosion aspects of small catchment research,” in Small Catchments: A Tool for Environmental Research, eds B. Moldan and J. Èernı (London: John Wiley), 85–105.
Cai, M., Schwartz, J. S., Robinson, R. B., Moore, S. E., and Kulp, M. A. (2010). Long-term effects of acidic deposition on water quality in a high-elevation great smoky mountains national park watershed: use of an ion input-output budget. Water Air Soil Pollut. 209, 143–156. doi: 10.1007/s11270-009-0187-5
Cappo, K. A., Blume, L. J., Raab, G. A., Bartz, J. K., and Engels, J. L. (1987). Analytical Method Manual for the Direct/Delayed Response Project Soil Survey. United States Environmental Protection Agency, Environmental Monitoring Systems Laboratory, EPA 600/8-87/020. Las Vegas, NV: Office of Research and Development.
Cremer, M., and Prietzel, J. (2017). Soil acidity and exchangeable base cation stocks under pure and mixed stands of European beech. Douglas fir and Norway spruce. Plant Soil 415, 393–405. doi: 10.1007/s11104-017-3177-1
Driese, K. L., Reiners, W. A., Lovett, G. M., and Simkin, S. M. (2004). A vegetation map for the Catskill Park, NY, derived from multi-temporal Landsat imagery and GIS data. Northeast. Natural. 11, 421–442.
Driscoll, C. T., Driscoll, K. M., Mitchell, M. J., and Raynal, D. J. (2003). Effects of acidic deposition on forest and aquatic ecosystems in New York state. Environ. Pollut. 123, 327–336. doi: 10.1016/s0269-7491(03)00019-8
Driscoll, C. T., Lawrence, G. B., Bulger, A. J., Butler, T. J., Cronan, C. S., Eagar, C., et al. (2001). Acidic deposition in the Northeastern United States: sources and inputs, ecosystem effects, and management strategies. Bioscience 51, 180–198. doi: 10.1641/0006-3568(2001)051[0180:aditnu]2.0.co;2
Duarte, N., Pardo, L. H., and Robin-Abbott, M. J. (2013). Susceptibility of forests in the northeastern USA to nitrogen and sulfur deposition: critical load exceedance and forest health. Water Air Soil Pollut. 224, 1355. doi: 10.1007/s11270-012-1355-6
Futter, M. N., Klaminder, J., Lucas, R. W., Laudon, H., and Köhler, S. J. (2012). Uncertainty in silicate mineral weathering rate estimates: source partitioning and policy implications. Environ. Res. Lett. 7:024025. doi: 10.1088/1748-9326/7/2/024025
Gianfagna, C. C., Johnson, C. E., Chandler, D. G., and Hofmann, C. (2015). Watershed area ratio accurately predicts daily streamflow in nested catchments in the Catskills, New York. J. Hydrol. Reg. Stud. 4, 583–594. doi: 10.1016/j.ejrh.2015.09.002
Giovanoli, R., Schnoor, J. L., Sigg, L., Stumm, W., and Zobrist, J. (1988). Chemical weathering of crystalline rocks in the catchment area of acidic Ticino Lakes, Switzerland. Clays Clay Min. 36, 521–529. doi: 10.1346/CCMN.1988.0360605
Hyman, M. E., Johnson, C. E., Bailey, S. W., Hornbeck, J. W., and April, R. H. (1998). Chemical weathering and cation loss in a base-poor watershed. Geol. Soc. Am. Bull. 110, 85–95. doi: 10.1130/0016-76061998110<0085:CWACLI<2.3.CO;2
Johnson, C. E. (2013). Chemical properties of upland forest soils in the Catskills region. Ann. N. Y. Acad. Sci. 1298, 30–42. doi: 10.1111/nyas.12259
Johnson, C. E., Litaor, M. I., Billett, M. F., and Bricker, O. P. (1994). “Chemical weathering in small catchments: climatic and anthropogenic influences,” in Small Catchments: A Tool for Environmental Research, eds B. Moldan and J. Èernı (London: John Wiley), 323–341.
Kudish, M. (2000). The Catskills Forest: A History, 1st Edn. Fleischmanns, NY: Purple Mountain press.
Lawrence, G. B., David, M. B., Lovett, G. M., Murdoch, P. S., Burns, D. A., Stoddard, J. L., et al. (1999). Soil calcium status and the response of stream chemistry to changing acidic deposition rates. Ecol. Applic. 9, 1059–1072. doi: 10.1890/1051-0761(1999)009[1059:scsatr]2.0.co;2
Lewis, W. M., Hamilton, S. K., Jones, S. L., and Runnels, D. D. (1987). Major element chemistry, weathering and element yields for the Caura River drainage, Venezuela. Biogeochemistry 4, 159–181. doi: 10.1007/BF02180153
Likens, G. E., Butler, T. J., and Buso, D. C. (2001). Long-and short-term changes in sulfate deposition: effects of the 1990 clean air act amendments. Biogeochemistry 52, 1–11. doi: 10.1023/A:1026563400336
Likens, G. E., Driscoll, C. T., and Buso, D. C. (1996). Long-term effects of acid rain: response and recovery of a forest ecosystem. Science 272, 244–246. doi: 10.1126/science.272.5259.244
Lovett, G. M., Weathers, K. C., and Arthur, M. A. (2002). Control of nitrogen loss from forested watersheds by soil carbon: nitrogen ratio and tree species composition. Ecosystems 5, 0712–0718. doi: 10.1007/s10021-002-0153-1
Lovett, G. M., Weathers, K. C., and Sobczak, W. V. (2000). Nitrogen saturation and retention in forested watersheds of the Catskill Mountains, New York. Ecol. Applic. 10, 73–84. doi: 10.1890/1051-0761(2000)010[0073:nsarif]2.0.co;2
McNulty, S. G., Cohen, E. C., Myers, J. A. M., Sullivan, T. J., and Li, H. (2007). Estimates of critical acid loads and exceedances for forest soils across the conterminous United States. Environ. Pollut. 149, 281–292. doi: 10.1016/j.envpol.2007.05.025
Moldan, B., and Černý, J. (1994). Biogeochemistry of Small Catchments: A Tool for Environmental Research. London: John Wiley and Sons.
Murdoch, P. S., and Shanley, J. B. (2006). Detection of water quality trends at high, median, and low flow in a Catskill Mountain stream, New York, through a new statistical method. Water Resour. Res. 42:W08407. doi: 10.1029/2004WR003892
NOAA/NCDC. (2013). VIIRS Climate Raw Data Record (C-RDR). Silver Spring, MD:NOAA/National Climatic Data Center.
Paces, T. (1986). Weathering rates of gneiss and depletion of exchangeable cations in soils under environmental acidification. J. Geol. Soc. 143, 673–677. doi: 10.1144/gsjgs.143.4.0673
Sarin, M. M., Krishnaswami, S., Dilli, K., Somayajalu, B. L. K., and Moore, W. S. (1989). Major ion chemistry of the Ganga-Brahmaputra River system: weathering processes and fluxes to the Bay of Bengal. Geochim. Cosmochim. Acta 53, 997–1009. doi: 10.1016/0016-7037(89)90205-6
Stumm, W., and Morgan, J. J. (1996). Aquatic Chemistry: Chemical Equilibria in Natural Waters, 3rd Edn. Hoboken, NJ: John Wiley and Sons.
Sverdrup, H., and De Vries, W. (1994). Calculating critical loads for acidity with the simple mass balance method. Water Air Soil Pollut. 72, 143–162. doi: 10.1007/BF01257121
U.S. EPA (2014). Data From the 2011 National Emissions Inventory, Version 1. Available online at: https://www.epa.gov/air-emissions-inventories/2011-national-emissions-inventory-nei-data (accessed October 18, 2017).
USDA Forest Service (2016). Forest Inventory Data Online Web-Application Version: FIDO 1.5.1.05d. St. Paul, MN: U.S. Department of Agriculture. Online resource.
Ver Straeten, C. A. (2013). Beneath it all: bedrock geology of the Catskill Mountains and implications of its weathering. Ann. N. Y. Acad. Sci. 1298, 1–29. doi: 10.1111/nyas.12221
Warby, R. A., Johnson, C. E., and Driscoll, C. T. (2009). Continuing acidification of organic soils across the northeastern USA: 1984–2001. Soil Sci. Soc. Am. J. 73, 274–284. doi: 10.2136/sssaj2007.0016
Weathers, K. C., Lovett, G. M., Likens, G. E., and Lathrop, R. (2000). The effect of landscape features on deposition to hunter mountain, Catskill Mountains, New York. Ecol. Applic. 10, 528–540. doi: 10.1890/1051-0761(2000)010[0528:teolfo]2.0.co;2
White, A. F., and Brantley, S. L. (1995). Chemical weathering rates of silicate minerals. Rev. Mineral. Geochem. 31, 407–461. doi: 10.1515/9781501509650
Whittaker, R. H., Bormann, F. H., Likens, G. E., and Siccama, T. G. (1974). The Hubbard Brook ecosystem study: forest biomass and production. Ecol. Monogr. 44, 233–254. doi: 10.2307/1942313
Whittaker, R. H., Likens, G. E., Bormann, F. H., Easton, J. S., and Siccama, T. G. (1979). The Hubbard Brook ecosystem study: forest nutrient cycling and element behavior. Ecology 60, 203–220. doi: 10.2307/1936481
Keywords: acidification, acid deposition, biogeochemistry, calcium, critical loads, forest soil, watershed, weathering
Citation: Nieman SC and Johnson CE (2021) Net Geochemical Release of Base Cations From 25 Forested Watersheds in the Catskill Region of New York. Front. For. Glob. Change 4:667605. doi: 10.3389/ffgc.2021.667605
Received: 13 February 2021; Accepted: 21 June 2021;
Published: 15 July 2021.
Edited by:
Ling Zhang, Jiangxi Agricultural University, ChinaReviewed by:
Zeinab Hazbavi, University of Mohaghegh Ardabili, IranBangliang Deng, Nanchang Institute of Technology, China
Copyright © 2021 Nieman and Johnson. This is an open-access article distributed under the terms of the Creative Commons Attribution License (CC BY). The use, distribution or reproduction in other forums is permitted, provided the original author(s) and the copyright owner(s) are credited and that the original publication in this journal is cited, in accordance with accepted academic practice. No use, distribution or reproduction is permitted which does not comply with these terms.
*Correspondence: Chris E. Johnson, Y2Vqb2huc0BzeXIuZWR1