 Alexandre Siminski
 Daisy Christiane Zambiazi
 Karine Louise dos Santos
 Alfredo Celso Fantini
95% of researchers rate our articles as excellent or good
Learn more about the work of our research integrity team to safeguard the quality of each article we publish.
Find out more
ORIGINAL RESEARCH article
Front. For. Glob. Change , 11 March 2021
Sec. Forest Disturbance
Volume 4 - 2021 | https://doi.org/10.3389/ffgc.2021.576908
This article is part of the Research Topic Enhancing Natural Regeneration to Restore Landscapes View all 13 articles
This study aimed to understand post-agricultural natural forest regeneration in the Southern Brazilian Atlantic Forest and its possible role as a cost-effective, passive approach to forest restoration. The study characterized vegetation structure, floristic composition, and the dynamics of secondary forest chronosequences. Data were collected from 159 plots (10 × 10 m each) across forest remnants in Santa Catarina State, covering forest ages that ranged from 2 to 60 years of regeneration after swidden agriculture. Only areas with no signs of degradation were sampled in order to provide a description of vegetation characteristics that could be used to identify and monitor natural regeneration. A total of 11,455 woody plants were identified and classified into 334 species representing 71 families. As the succession process unfolds, the continuous turnover of species makes forests more diverse and structurally complex. Floristic similarity among forest types is observed during the early stages of succession, but decreases over time. Pioneer species dominate young secondary forests, representing about 40% of the basal area up to 10 years of regeneration. Shade-tolerant species start colonizing the sites at early ages; however, they become more important structural elements only after 30 years of succession. The observed patterns of forest structure and species diversity largely conform to the post-agricultural succession seen in many tropical forests. The high species diversity found in this study highlights the importance of natural regeneration as a strategy to restore ecosystems. Floristic data can be used as a reference for choosing suitable species for active restoration, as well as contributing to the design of integrated restoration strategies. We herein reinforce the potential of natural regeneration as part of large-scale restoration programs, which would be particularly attractive to family farmers by the low cost of supplies and labor.
The Brazilian Atlantic Forest region, home to more than 125 million people, contributes to 70% of the gross domestic product, and it is the center of the Brazilian industrial economy (Scarano and Ceotto, 2015). At the same time, the biome is considered one of the “hottest” of biodiversity hotspots, holding 2,420 vertebrates and 20,000 plant species, most of them with high levels of endemism (Rezende et al., 2018). However, historical fragmentation and loss of biodiversity have also made it one of the world's most threatened hotspots, as 84–88% of forest cover has vanished (Soares-Filho et al., 2014). In addition, many plant and animal species are endangered, the equivalent of 60% of the entire list of threatened species for both flora and fauna in Brazil (Joly et al., 2014). Maintaining the remnants of such species-rich biome has been a challenge for conservationists in a region marked by a permanent pressure for economic development.
Fast conversion of forest to other land uses and forest degradation represent a global phenomenon, calling for international organizations to establish programs to restore lost or degraded forest ecosystems. The Aichi Target, for example, set a goal of restoring at least 15% of degraded ecosystems (Jørgensen, 2013). The Bonn Challenge, another initiative, has set a global target of restoring 150 and 350 Mha of degraded/deforested lands by 2020 and 2030, respectively (www.bonnchallenge.org; IUCN, 2011). Aligned with these efforts, the Brazilian government in 2009 launched the Atlantic Forest Restoration Pact, an ambitious action plan to restore 15 Mha of degraded/deforested lands by 2050 in the Atlantic Forest region (www.pactomataatlantica.org.br/) (Crouzeilles et al., 2019).
To guide these efforts in restoring forest ecosystems, three main approaches have been used: (i) natural regeneration (passive restoration or spontaneous regeneration), which relies on the resilience of the ecosystem without, or after, removing the degrading factors; (ii) assisted regeneration, which prescribes the application of practices to facilitate recovery processes; and (iii) active restoration (plantation), which consists of intensive human intervention to accelerate recovery (Holl, 2020). The choice of restoration method should be based on site resilience, as well as the characteristics and goals of the project. Many authors suggest an integrated strategy whereby, for example, passive restoration, nucleation and plantation methods are combined to achieve high levels of species diversity, biomass productivity and ecosystem functions, while balancing inputs and costs (Vogel et al., 2015; Bechara et al., 2016; Meli et al., 2017; Trentin et al., 2018).
Assisted and active regeneration methods can be effective in accelerating restoration and reaching the final target ecosystem condition (Campoe et al., 2010; Rodrigues et al., 2011; Roa-Fuentes et al., 2015; Sujii et al., 2017; Brancalion et al., 2019a). However, costs are usually high (Benini et al., 2017; Crouzeilles et al., 2017) and mainly affordable only to large companies, such as the mining sector, or large-scale funded projects. Moreover, the success of restoration initiatives is not guaranteed by high levels of investment as outcomes vary from near-total success to complete failure (Souza and Batista, 2004; Crouzeilles et al., 2016; Toledo et al., 2018). Barriers to ecological restoration in highly degraded landscapes include lack of seed sources, poor germination, lack of colonizing fauna, weed infestation, as well as soil degradation (Garcia et al., 2016).
Survival of seedlings is one of the major limiting factors to action-based restoration initiatives (Holl, 2002; Grossnickle, 2012), leading to failure in forming a tree cover or maintaining the achieved characteristics of the ecosystem in the long run. This lesson was learned from one of the pioneer and large-scale restoration experiences in the Mata Atlântica region (Kageyama and Isshiki, 1992). The project succeeded in recovering a forest-like structure over a large deforested land, but the length of time it took for establishment of the forest, in addition to the failure of certain species to grow, forced reevaluation of the methodology (Souza and Batista, 2004).
Idealizing a quick restoration of ecosystem functions, legislators have demanded high species diversity as a requirement of restorations activities. For instance, the formerly enacted Resolution SMA 08/2008 regulated forest restoration projects in São Paulo State and required at least 80 species before a project could be considered complete (Secretaria do Meio Ambiente do Estado de São Paulo, 2008). Gomes et al. (2013) challenged the rationale of such requirement, arguing over such issues as the availability and variety of seedlings needed, the cost, and, mainly, the uncertain survival of many species. The authors also argued that even young, naturally regenerated forests frequently do not shelter such diversity of tree species.
Across the Brazilian Atlantic Forest region, as in much of the tropical world, socio-ecological systems demand low input of labor and supplies in exchange for optimal land/forest restoration projects. In Santa Catarina State, for example, 78% of farms are smaller than 50 hectares, and they are owned by family farmers (IBGE, 2019), most of whom cannot afford, or are not willing, to invest in the requirements mandated by environmental laws (Alarcon et al., 2010). Alarcon et al. (2017) reported that farmers in Santa Catarina State would agree to restore deforested land that they owned, but only in exchange for some monetary compensation. In such contexts, then, passive restoration becomes the most practical strategy.
Natural regeneration has been considered an effective nature-based solution for recovering tree biodiversity (Brancalion et al., 2019b; Rozendaal et al., 2019; Crouzeilles et al., 2020), and it may play an important role in the scale-up of landscape restoration to achieve multiple social and environmental benefits at minimal cost, especially in tropical regions (Chazdon and Guariguata, 2016). This approach can rapidly restore the forest at sites recently cleared, considering such factors as the presence of residual trees, seedlings and seed banks of local species, and biodiversity-rich forest across the landscape (Lamb et al., 2005). Moreover, the success of this approach in the Atlantic Forest region could possibly pave the way for reversing deforestation and degradation, mitigating water and food insecurity, improving livelihoods, and promoting ecosystem-based adaptation to climate change (Rezende et al., 2018).
Naturally regenerating forests can provide a wide array of ecosystem goods and services, as well as, support rural economies and livelihoods (Chazdon et al., 2020). Even young secondary forests, that are spread out in isolated patches could help mitigate climate change and recover species of high conservation concern, while, at the same time, improving landscape connectivity (Oliveira et al., 2019a; Matos et al., 2020), and working as a source of seed dispersal for the restoration process. Natural regeneration has also been suggested as a cost-effective method of achieving high carbon sequestration potential with multiple benefits for biodiversity and ecosystem services (Chazdon et al., 2016). Such combination of factors is frequently present in our region of interest since forest cover for Santa Catarina is estimated at around 30% (Vibrans et al., 2013a, 2020). Several studies have demonstrated the resilience of local native forests and their rapid regrowth, even after repeated swidden cultivation, a prevalent land use in the region until recently (Siminski and Fantini, 2007; Liebsch et al., 2008; Siminski et al., 2011; Fantini et al., 2017; Lintemani et al., 2019).
Professionals and researchers frequently evaluate degraded areas based on a mature forest model. Instead, the resilience of the forest at landscape scale should be taken into account, as well as, the potential of natural regeneration to re-establish a degraded ecosystem to a sound condition at a local scale. Therefore, it is important that practitioners recognize how these forests respond to human disturbances at multiple levels of ecological organization and spatiotemporal scales in order to respond to the threats posed and the potential opportunities offered by human-modified landscapes in the context of sustainability and regeneration (Joly et al., 2014; Arroyo-Rodríguez et al., 2017).
It is in this context that we evaluated different chronosequences of secondary forests to explore how attributes of regrowth change over time and across forest types in the Atlantic Forest. In a previous study in the same region, we focused on the average of floristic and structural variables in three forest types (Siminski et al., 2011). Now, we examine the data of individual plots that represent different forest ages in order to understand the dynamics of the diversity and structure of secondary forests through succession from 2 to 60 years. The values of species richness, diversity, density, basal area, and aboveground biomass were regressed against forest age to understand the dynamics of forest structure through succession. Species turnover was assessed through the proportion of ecological groups and the identity of the most dominant species. In order to better depict the importance of each ecological group for forest structure, we also regressed the relative values of plant density, basal area, and biomass. We designed our study in a way that examines how species composition, diversity and forest structure of naturally regenerated secondary forests change over time across forest types. Based on data analysis and information collected from vegetation surveys, we discuss the quantitative and qualitative aspects of secondary forests that can be used as indicators to evaluate and monitor natural regeneration in forest restoration programs.
The study was carried out in 48 small farms located in the counties of Anchieta, Garuva, Concórdia, Três Barras, Caçador, and São Pedro de Alcântara in Santa Catarina state (Figure 1). These areas include in three different forest types recognized in the Mata Atlântica Biome, as defined by Brazilian Atlantic Forest Law 11.428/2006 (BRASIL, 2006): Seasonal Deciduous Forest (Anchieta and Concórdia), Mixed Ombrophilous Forest (Três Barras and Caçador) and Dense Ombrophilous Forest (Garuva and São Pedro de Alcântara) (Veloso et al., 1991).
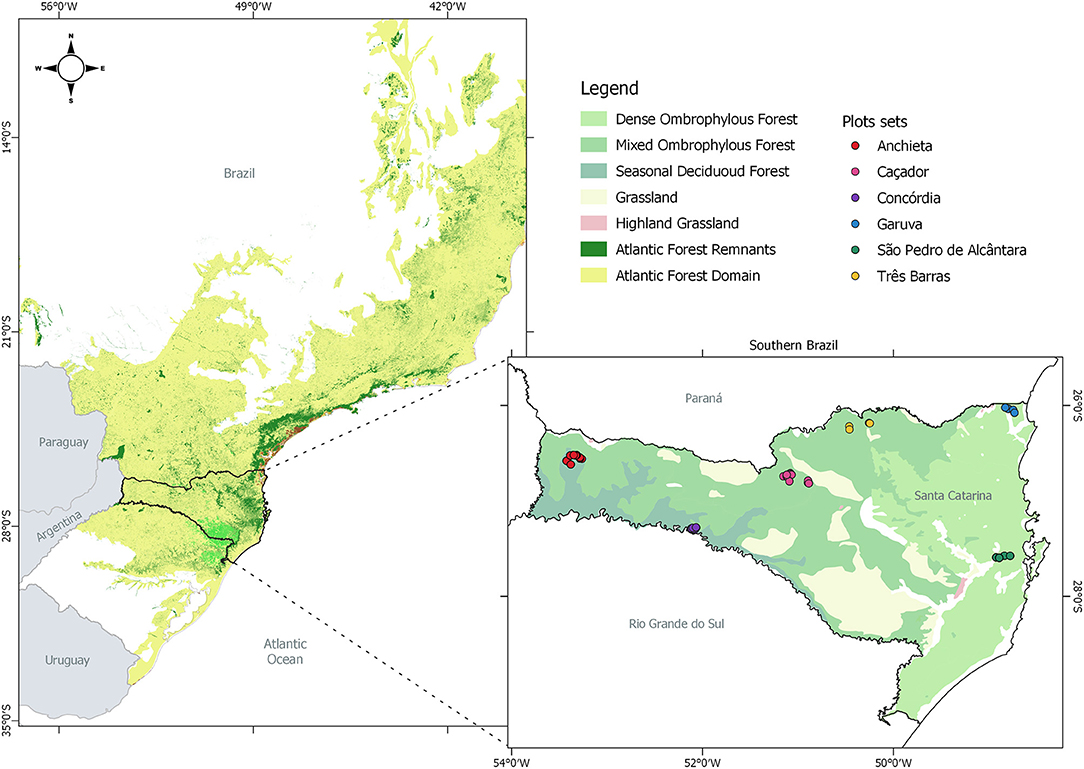
Figure 1. Map of original and remnant Brazilian Atlantic forest. Map of forest types in Santa Catarina State (in detail) and location of the studied sites. Source: http://mapas.sosma.org.br/ (SOS Mata Atlântica, 2020); Application Area Map of Law n° 11.428/2006 (BRASIL, 2006); Klein's phytogeographic (SAR, 2005).
Seasonal Deciduous Forest (SDF) occurs in the Uruguay River basin at elevations ranging from 200 to 600 meters a.s.l., where the predominant climate is Cfa (temperate humid with hot summers), according to Köppen's classification, with an annual precipitation of 1,600 to 2,000 mm (Alvares et al., 2013). It is characterized by a closed canopy dominated by species of Lauraceae, Asteraceae and emergent deciduous species, mostly Fabaceae (Siminski et al., 2011; Vibrans et al., 2012a; Gasper et al., 2013b).
Mixed Ombrophilous Forest (MOF) is usually distributed across plateaus ranging from 500 to 1,500 m a.s.l., with annual precipitation ranging from 1,600 to 2,100 mm. The climate is Cfb (humid temperate climate with moderately hot summers), according to Köppen's classification (Alvares et al., 2013). This forest is characterized by the presence of a supercanopy dominated by Araucaria angustifolia and a subcanopy rich in species of Lauraceae, Myrtaceae, Asteraceae, Solanaceae, and Fabaceae (Siminski et al., 2011; Gasper et al., 2013a; Vibrans et al., 2013b).
Dense Ombrophilous Forest (DOF) occurs across the coastal regions at elevations below 700 m a.s.l., where the climate is Cfa (temperate humid with hot summers), according to Köppen's classification. DOF is characterized as having the hottest temperatures among all forest types and an annual precipitation ranging from 1,500 to 2,000 mm (Alvares et al., 2013). DOF has an evergreen canopy dominated by Lauraceae, Melastomataceae, Fabaceae, Rubiaceae, and Myrtaceae, together with an abundance of epiphytes (Orchidaceae and Bromeliaceae) and palm trees (Siminski et al., 2011; Vibrans et al., 2013c; Gasper et al., 2014).
We studied chronosequences of secondary forests from 2 to 60 years of age that had regenerated naturally on land previously cultivated under traditional swidden agriculture. We sampled only secondary forests originated from abandoned agricultural fields, with no signs of degradation, because they represent the majority of regenerating forests in the region (Lingner et al., 2020; Vibrans et al., 2020). We sampled only forests located within typical farms in the region (i.e., farms with a mosaic of regenerating forest patches, avoiding samples from isolated secondary forest patches). Our sampling did not take into consideration forest size, slope and aspect, or distance from mature forests; consequently, we did not measure such landscape variables in this paper. At each farm, we asked permission to inventory the forest. Then, the landowner was asked to explain the history of land use, and disturbance, including how long the land had been abandoned. Secondary forest in the region presents a sequence of stages recognizable from its physiognomy: shrubs, small trees, arboreal and advanced arboreal species (Siminski et al., 2011; Supplementary Figure 1). We tried to sample an even number of plots at each stage of succession. One plot was set at the center of a homogeneous forest patch, thus avoiding the edge effect on forest structure and diversity.
A total of 159 plots (10 × 10 m each) were inventoried in 2007 (a sampled area of 15,900 m2), covering secondary forests at different ages in all three forest types: Anchieta (18), Garuva (20), Concórdia (20), Três Barras (8), Caçador (30), and São Pedro de Alcântara (63). In each plot, all woody plants higher than 1.5 m were identified to species level, either in the field or aided by taxonomists. Plants were identified using the classification updated on the Angiosperm Phylogeny Website, version IV (Stevens, 2017), as well as Species 2000 & ITIS Catalog of Life (Roskov et al., 2019). All individuals were measured for diameter (DBH, cm) and total height (m). Sampled species were classified into ecological groups (pioneer, early secondary, late secondary, and climax), following the criteria proposed by Budowski (1965), which were, in turn, based on bibliographic research (Carvalho, 2003, 2006, 2008, 2010; Santos et al., 2004; Mantovani et al., 2005; Martins, 2005; Klauberg et al., 2011; Vibrans et al., 2012b, 2013b,c; Ferreira et al., 2013; Barbosa et al., 2017). For simplicity, we will use the term “plants” to mean all individuals measured, irrespective of life form (shrubs, trees, palm trees, and tree ferns).
For each secondary forest plot, we calculated the following attributes of vegetation structure: plant density (stems.ha−1), basal area (m2.ha−1), aboveground biomass (AGB, Mg.ha−1), and importance value (IV) (Müeller-Dombois and Ellenberg, 1974). We also calculated the following attributes of species diversity: species richness (number of species) estimated by rarefaction curve (Mao et al., 2005) and bootstrap method (Smith and van Belle, 1984), rarefied species richness (Hurlbert, 1971), family richness (number of families), species richness, Shannon's diversity (H', nuts. ind−1) and Simpson's diversity (1-D). Rarefied species richness was calculated down to the same number of individuals in the smallest plot (i.e., five individuals). In order to quantify the dominance of species in each forest type, within ecological groups, we calculated the importance value (IV). IV was calculated as the sum from (i) relative frequency; (ii) relative density; and (iii) relative dominance. It was estimated for each species, and the dominant species were selected for each forest type. Dominant species were defined as that set of species, the accumulated IVs which, when ranked from highest to lowest, reached 50% of the total for a given forest type (Finegan, 1996). Diversity metrics and IV were estimated using the vegan package (Oksanen et al., 2019), BiodiversityR package (Kindt, 2020), the FitoR script (Dalagnol et al., 2013) in RCore Team (RStudio Team, 2019), and the RStudio interface (RStudio Team, 2019). Both rarefaction curve and species richness by bootstrap method were estimated using EstimateS 9.1.0 (Colwell, 2019). Forest biomass was estimated using the allometric equation for tropical forests proposed by Chave et al. (2014): AGBest = 0.0559 × (ρD2H), where ρ is wood density, D is the diameter of stem, and H is the total plant height. Wood density was obtained from the database of Chave et al. (2006) for Neotropical tree species and Oliveira et al. (2019b) for species of the Subtropical Atlantic Forest.
Linear mixed-effects models were used to evaluate how forest structure (density, basal area and biomass) and diversity change over time (Gelman and Hill, 2007; Bolker, 2008; Zuur et al., 2009). For analysis of plant density (stems.ha−1), basal area (m2.ha−1), and biomass (MG.ha−1), we transformed the values to meet the normality of the data and back transformed values are represented in Figure 2. We used square transformation and tested the normality with the Shapiro-Wilk test. Thus, one null model was established for each dependent variable: richness dataset, Shannon and Simpson index, density, basal area and biomass. The null model was calculated as: yi = α + bi + εi, where y is the dependent variable, α is the intercept, bi is the random effect, and εi is error (residual). Another model was established with fixed effect to test the significance among models using ANOVA with Chi-square statistics. This model was calculated as: yi = α + β × ai + bi + εi, where y is the dependent variable, α is the intercept, β is the slope, ai is the fixed effect, bi is the random effect, and εi is error (residual). For each variable, the model has age as a fixed effect, and forest type is the random effect. Next, we evaluated how the contribution of the different ecological groups changes along succession. To accomplish this, we grouped all species into the four ecological groups described above and calculated their relative density, basal area, and biomass. We then analyzed the effects of age and ecological group (fixed effects) on the relative values of each response variable, using forest type as the random effect in mixed-effects models. For all variables individually, age and ecological group was included as fixed effect while forest type as random effect and ecological group was used nested within forest type as random slope. This model was calculated as: yij = α + β1×a1ij + β2×a2ij + bj×a2ij + εij, where y is the dependent variable, α is the intercept, β is the slope, aij is the fixed effect, bj is the random effect, and εij is error (residual). First, we established the null model for each variable described above and tested the model with fixed effect. Forest type was the random effect. Ecological groups were used as the random slope, allowing the difference among groups to reflect variation on the slope. In total, we fitted five models to estimate relative values of plant density, basal area and biomass, with and without interaction among fixed effects, and with and without random slope nested with random effect.
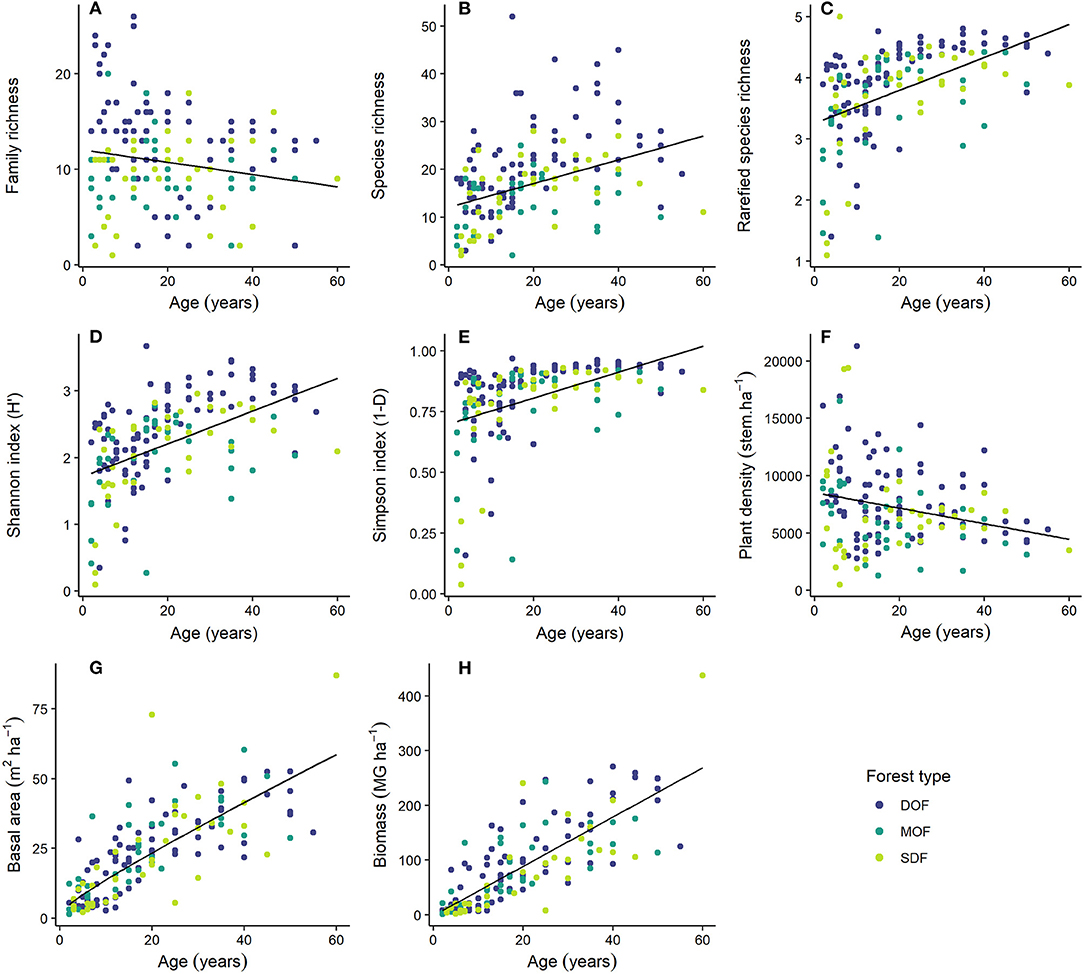
Figure 2. Family (A) and species richness (B), rarefied species richness (C), Shannon (D), and Simpson (E) diversity index, plant density [(F); stems.ha−1], basal area [(G); m2.ha−1], and biomass [(H); MG.ha−1] in 2–60 years old secondary forests in three forest types of the Brazilian Atlantic Forest: Dense Ombrophilous Forest (DOF), Mixed Ombrophilous Forest (MOF), and Seasonal Deciduous Forest (SDF). Dots represent individual plots (10 × 10 m), but some overlapping occurs.
We also applied a model selection procedure, whereby the models with the lowest delta-Akaike Information Criterion (ΔAIC) were chosen as the best model, for each dependent variable. The ΔAIC is the result of the differences among the AIC of the models fitted for each dependent variable (Supplementary Tables 3, 4). For the best model selected we also calculated the conditional and marginal R-square, which explained the proportion of total variance through both fixed and random effects (Supplementary Table 2). The models were fitted with maximum likelihood to compare the null models and models with ANOVA. After selecting the best models for each variable, the distributions of each selected model were verified using the visreg( ) function of the visreg package (Breheny and Burchett, 2017). To plot the predictors for each model, we used the bootMer( ) function of the lme4 package based on the Perform model-based (Semi-)parametric bootstrap for mixed models with 1,000 simulations (Bates et al., 2015). The analyses were performed with the lme4 package (Bates et al., 2015), ggpubr package (Kassambara, 2020), bbmle package (Bolker, 2020), lmerTest package (Kuznetsova et al., 2017), MuMIn package (Barton, 2020) in RCore Team (RStudio Team, 2019), and the RStudio interface (RStudio Team, 2019). For absolute and relative values, a line was fitted to each variable with the predictors of the chosen model (Supplementary Table 3), using the ggplot2 package (Wickham, 2009), viridis package (Garnier, 2018a), viridisLite package (Garnier, 2018b), and cowplot package (Wilke, 2019).
A total of 11,455 woody plants were identified and classified into 334 species representing 71 families. The most common families were Myrtaceae (36 species), Fabaceae (32), Asteraceae (26), Lauraceae (24), Rubiaceae (20), and Melastomataceae (16) (Supplementary Table 1; see also Supplementary Table 5 for plants with DBH > 5 cm). Secondary forests in the DOF region presented a higher number of species (220) compared to MOF (122) and SDF (127). Thirty-nine species were common to all three forest types, representing 11% of the registered species. The three forest types presented a high number of exclusive species: 137, 47, and 53 species, respectively, for DOF, MOF, and SDF. The five most abundant species were Miconia cinnamomifolia, Myrsine coriacea, Tibouchina pulchra, Miconia cabucu, and Hieronyma alchorneoides (DOF); Baccharis dracunculifolia, Matayba elaeagnoides, Eupatorium vauthierianum, Cupania vernalis, and Schinus terebinthifolius (MOF); Baccharis dracunculifolia, Trema micrantha, Nectandra lanceolata, Dalbergia frutescens, and Cupania vernalis (SDF) (Table 1). For exotic species, we registered 21 individuals of Hovenia dulcis in the sampled area, distributed in four plots (11%) of SDF forest and in one plot (3%) of MOF forest.
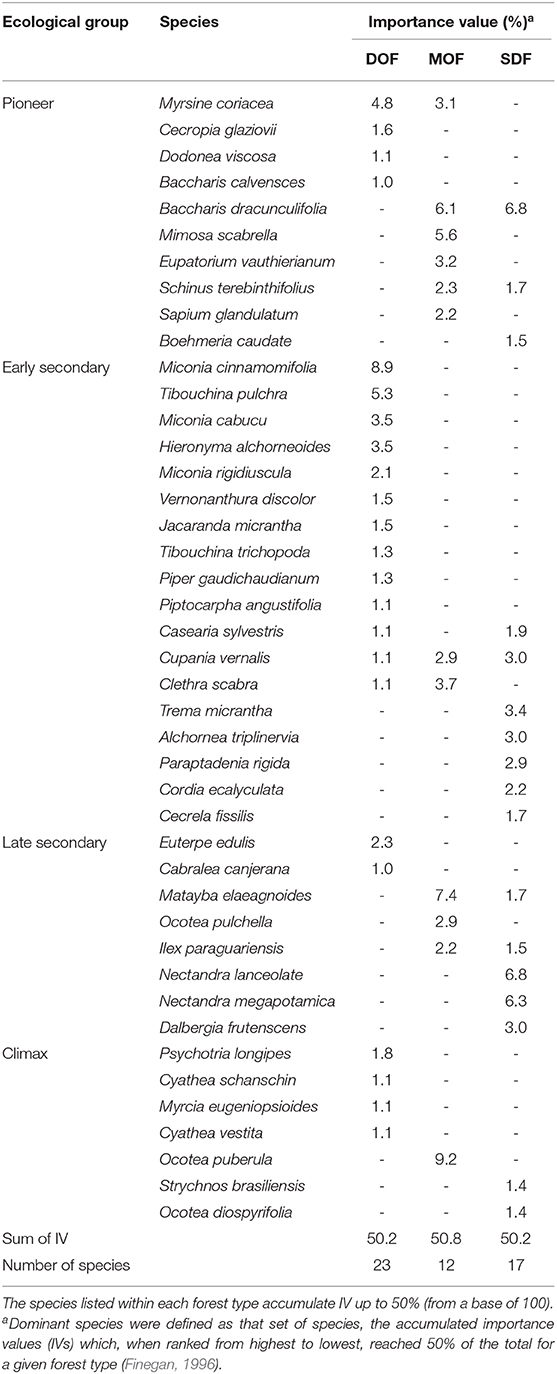
Table 1. Species with highest importance values (IV) in the Dense Ombrophilous Forest (DOF), Mixed Ombrophilous Forest (MOF), and Seasonal Deciduous Forest (SDF).
Family and species richness varied among plots in forests of the same age within each forest type (Figures 2A,B). In DOF, the median richness was 18 species, ranging from 2 to 52 species per plot. Median richness in MOF and SDF was smaller than that in DOF (median values of 10 and 12 species, respectively), as well as the maximum number of species per plot (respectively, 25 and 28 species) (Supplementary Figure 2). The number of species per plot increased rapidly from the early ages to 40 years of succession in all the forest types. By the age of 20 years, most plots within forest types presented around 20 different species, but some plots in DOF reached more than 40 species. Family richness, on the other hand, showed no clear pattern of increase with forest growth in MOF and SDF. Median family richness in these forests was observed to be eight and 10 families per plot, respectively. In DOF, family richness was higher than that in the other forest types, with a median of 14 families per plot. Different from MOF and SDF, however, the number of families per plot in DOF was higher in young forests and decreased as forests aged (Figure 2A).
Species richness of the secondary forests studied varied with age and across forest types (Figures 2B,C). The rarefaction curves show that DOF had higher species richness than MOF and SDF when controlling for different number of samples (Supplementary Figures 3A,B). As an example, 100 species were found after sampling 6, 12, and 15 plots, respectively, in DOF, SDF, and MOF. The curves also suggest that our sampling did not find the maximum number of species expected in these forest types (87% in SDF, 85% in MOF, and 91% in DOF). When we analyzed rarefied species richness with a fixed number of five individuals per plot, the number of species increased rapidly in the first years of succession. At 6 years of fallow forest, we could reach a richness of five species (Figure 2C).
Shannon and Simpson indices also showed rapid increase of species diversity of secondary forests throughout succession (Figures 2D,E). Some plots representing young forests showed low values of Shannon index, but most presented values between 2 and 3, mainly after 15 years of succession. The same pattern was observed for the Simpson index, except for a small number of plots representing young forests. Most forests older than 10 years presented values over 0.75.
The chronosequence studied revealed the dynamics of the secondary forests that regenerated naturally in the three forest types, increasing in the complexity of forest structure (Figures 2F–H) and species succession (Supplementary Table 1). Plant density (height ≥ 1.5 m) varied strongly at early ages of succession, ranging from values as low as 200 plants per hectare to more than 20,000 plants per hectare (Figure 2F). In older forest patches, variation among plots decreased, along with plant density, which converged to values around 5,000 plants per hectare. The forest basal area increased with forest age, with values between 20 and 50 m2.ha−1 by the age of 20 years (Figure 2G). Following the same trend, biomass increased fast with forest age, reaching average values of 80 MG.ha−1 around the age of 20 years, with 16 plots (10%) reaching values higher than 200 MG.ha−1 after this age (Figure 2H).
We observed that species of all ecological groups in forests of all ages, from the youngest forests to those as old as 50 years (Figure 3; Supplementary Tables 3, 4), kept the same pattern of behavior for plant density, basal area and biomass among the three forest types (Supplementary Figure 4). However, high variation was observed among plots insofar as the relative contribution of each group to the total number of plants per plot at each age. We also observed clear patterns of ecological groups in proportion to forest relative plant density through succession. More specifically, the relative plant density of pioneer species was very high at the beginning of succession, close to 100% in some plots, but decreased sharply up to about 15 years (Figure 3A). From that age, the relative density of pioneer species dropped more slowly, from 40% to even lower values. Early secondary species also decreased in their importance to plant density through succession, but high relative density of such species was observed in plots as old as 30 years. However, the relative density of this group in each plot displayed wide variation among plots of the same age, particularly in the youngest forests, ranging from almost zero up to 90% of the total number of plants. The relative density of late secondary and climax species increased as the forests aged. Still, their proportion was limited to ~60% of the total number of plants per plot in the oldest forests (Figure 3A). The contribution of each ecological group to the total basal area of each plot followed behavior very similar to that observed for relative plant density, especially for the pioneer and early secondary species (Figure 3B). Slightly different from the relative importance to plant density, late secondary and climax species contributed more to the basal area in several plots. In turn, the contribution of each group of species to the total biomass of each plot along the succession followed the same course as that observed for relative basal area. That is, as the relative biomass of pioneer and early secondary decreased, late secondary and climax species increased their share of the total biomass (Figure 3C).
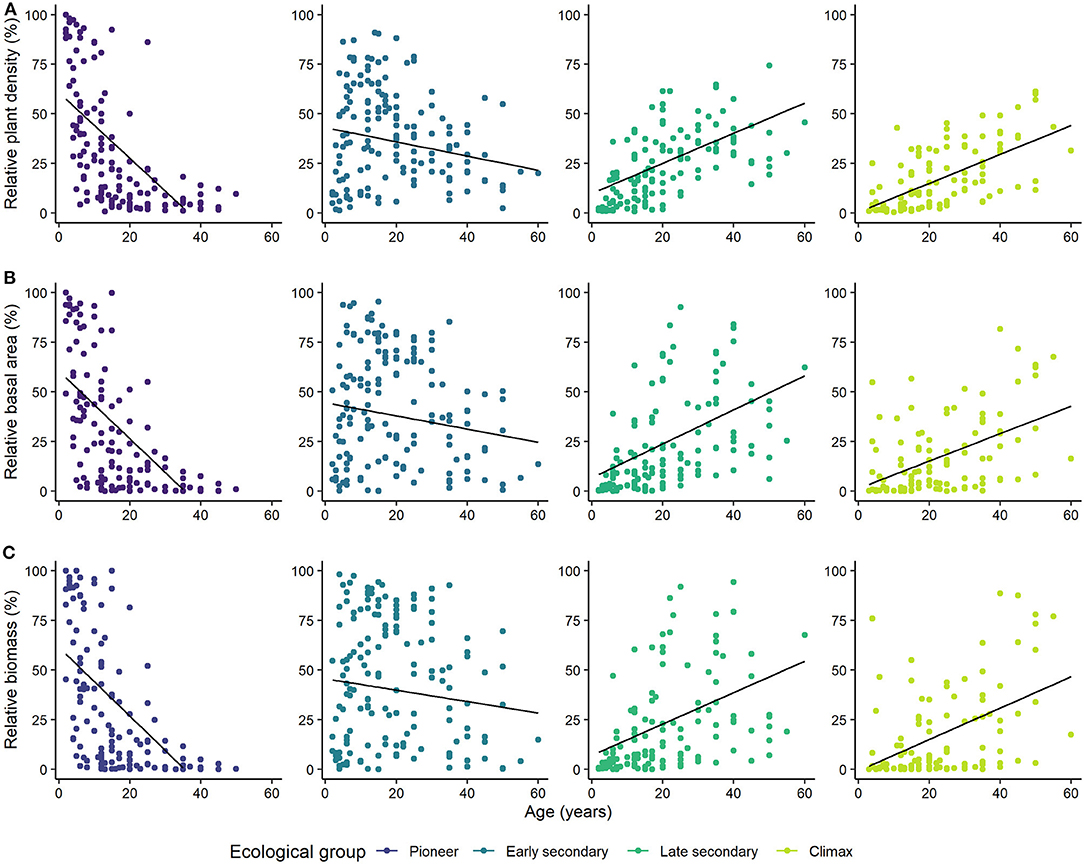
Figure 3. Relative (% of the total per plot) plant density (A), basal area (B), and biomass (C) of plants grouped by ecological groups (pioneer, early secondary, late secondary, and climax) in 2–60 year old secondary forests in three forest types of the Brazilian Atlantic forest: Dense Ombrophilous Forest (DOF), Mixed Ombrophilous Forest (MOF), and Seasonal Deciduous Forest (SDF). Dots represent individual plots (10 × 10 m), but some overlapping occur.
The importance of each species to forest structure through succession varied within each ecological group and forest type (Table 1). Typical pioneer species, such as Baccharis dracunculifolia and Myrsine coriacea, were dominant in young forests and widely represented in all forest types. On the other hand, pioneers, such as Cecropia glaziovii, Mimosa scabrella, and Schinus terebinthifolius, were typical of DOF, MOF, and SDF forests, respectively. The early secondary species Miconia cinnamomifolia, Tibouchina pulchra, Clethra scabra, Trema micrantha, Parapiptadenia rigida, Miconia cabucu, Hieronyma alchorneoides, and Alchornea triplinervia also presented high density, dominance, frequency, or a combination of the three, becoming the most important species of the ecosystem and characterized by typical successional routes within a forest type. These are fast-growing arboreal species capable of forming a closed, or almost closed canopy, shading the environment and dramatically changing local abiotic conditions (Supplementary Figure 1). Important canopy species of secondary forests belong to the late secondary group, such as Nectandra lanceolata, Nectandra megapotamica, and Ocotea pulchella. This ecological group also presented important understory species, such as Ilex paraguariensis and Euterpe edulis. The importance of climax species was characterized by individuals tolerant to the already shaded environment of the forest, and the growth of this guild promoted a new increase in forest canopy diversity.
Taken together, data from our chronosequences indicated that the natural regeneration of secondary forests followed a continuous process of succession from simple to more complex ecosystems. Biodiversity, as measured by richness and diversity indexes, and forest structure, as measured by basal area and biomass, increased through time in our chronosequence, results similar to reports of other studies at sites with a history of swidden-fallow land use (Saldarriaga et al., 1988; Tabarelli and Mantovani, 1999; Aide et al., 2000; Liebsch et al., 2007, 2008). The sampled secondary forest older than 40 years presented structural characteristics (density, basal area, biomass, and diversity) similar to the reference ecosystem, as informed by sites of old growth forests from the official Floristic and Forest Inventory of Santa Catarina—IFFSC (Vibrans et al., 2012b, 2013b,c; also available at www.iff.sc.gov.br).
The high number of species (220) found in DOF, compared to the other forest types was not surprising, as this region holds around 85% of all arboreal species found in Santa Catarina (Vibrans et al., 2013c; Gasper et al., 2014). However, in all cases, the numbers are remarkably high, considering that inventories were based on small plot size (10 × 10 m). Moreover, the high diversity among plots within forest regions was corroborated by the rarefaction curves and the estimator richness. In the DOF region, 100 species were found after taking inventory of only 10 plots, but the number of species grew to more than 200 without reaching a ceiling. In the other two forest types the numbers were smaller, but, again, the rarefaction curves point out that the ceiling for richness was never reached.
The values for diversity indexes found in our study may have resulted from the criteria used for plant inclusion (all plants higher than 1.5 m). The sampling method used, where non-contiguous plots were inventoried, may have raised the levels of diversity. The number of species with low abundance found in our inventories may also have increased the diversity indexes. In an inventory carried out in secondary forest in the same three forest types, Oliveira et al. (2019a) observed that ~50% of the observed species were rare, having a diminished abundance and/ or small area of occurrence. These results reveal the remarkable ability of the Atlantic Forest to hold its diversity of species, despite the reduction in remaining forest cover (Scarano and Ceotto, 2015). Our results show that the forests became more diverse through succession. The species diversity, as indicated by the Shannon and Simpson indices grew in the 1st years of succession. For example, by the age of 15 years, virtually all sampled plots presented a Simpson Diversity Index higher than 0.75. The diversity indices estimated for old-growth forests, as reported by IFFSC studies, show the Shannon Index ranging from 1.79 to 3.64 for SDF (Vibrans et al., 2012b); from 1.01 to 3.51 for MOF (Vibrans et al., 2013b), and from 2.00 to 4.20 for DOF (Vibrans et al., 2013c). It is well-known that species richness can increase rapidly in secondary forests (Aide et al., 2000; Liebsch et al., 2007, 2008; Letcher and Chazdon, 2009), while species composition and interactions recover at a much slower pace. In addition, non-arboreal life forms, like epiphytes, lianas, and ferns, will naturally colonize secondary forests (Guariguata and Ostertag, 2001; Colmanetti et al., 2015), albeit with lower diversity compared to mature or primary forest (Barthlott et al., 2001; Liebsch et al., 2008; Garcia et al., 2016). Liebsch et al. (2008) also verified an increasing number of animal dispersed, non-pioneer and understory species with time after disturbances, although the authors estimated around 1,000 to 4,000 years to reach the levels of endemism existing in mature forests in the Atlantic Forest. As illustrated by Rozendaal et al. (2019), while regeneration processes take, on average, five decades to recover the species richness typical of old-growth forest, it takes centuries to fully recover species composition. However, it seems that around 50 years after the start of succession, naturally regenerated secondary forests in our region formed a forest structure suitable for a wide variety of life forms other than trees.
Another way of evaluating the diversity found in our study is to look at the succession of ecological groups as the forests aged. The relative plant density of the different groups clearly changed over time, with pioneer species being replaced by the early secondary as the most important group and then, later on, by the late secondary and the climax species. These results imply a significant diversity of species, not only among plots of the same age, but also among plots of a different age. They also imply the mosaic of secondary forests across the landscape, a typical scenario in the studied regions, as described in the Floristic and Forest Inventory of Santa Catarina (Vibrans et al., 2012b, 2013b,c; www.iff.sc.gov.br).
Analyzing the behavior of ecological groups through the succession process, we show a pattern very similar to the general description of Neotropical secondary successions, as proposed by Finegan (1996). The presence of species from all ecological groups in young forests suggests that succession, as we illustrated in Figures 3A–C, also fits the Initial Floristic Composition model of Egler (1954). However, our understanding of forest succession in this study region is based on Klein (1980), who described post-agricultural secondary forests as those that present well-defined stages of succession, typically dominated by a few species. According to our interpretation, Klein‘s description agrees with the Relay Floristics model, a traditional view that developed from the work of Clements (Clements, 1916). In this sense, we believe that our data allow us to reconcile the ideas of Egler and Klein since each of the first stages of succession is well-marked by a dominant species, but the community is composed of many other species from all ecological groups, an approach close to that proposed by Drury and Nisbet (1973).
Our results on the chronosequences made evident a fast recovery of forest structure and a rapid restoration of community attributes. The basal area of the secondary forests increased fast in the first 20 years of succession (Figure 2G), the same pattern as that found in other studies in the Neotropics (Aide et al., 2000; Guariguata and Ostertag, 2001; Siminski et al., 2013; Chazdon and Guariguata, 2016). By that age, some forests may have reached the maximum basal area allowed by conditions of the site. Despite decreasing plant density, this growth resulted from the continuous replacement of shrubs and small trees by larger individual trees, the growing diameter of which contributed exponentially to the basal area. For the same reason, part of the large variation of basal area among plots in our data may have resulted from the small plot area we used, such that a single tree could have had a strong impact on the result.
Biomass accumulation can also be a main driver of plant community changes during tropical forest succession (Lohbeck et al., 2015). The studied secondary forests were highly productive, possibly owing to the coexistence of species that ensure a greater complementarity and facilitation among species in regenerated forests and the consequent efficiency in the use of available resources (Gardon et al., 2020). Among forest attributes, time since the beginning of restoration (forest age) and plant community composition play a relevant role in aboveground biomass stocks for ecosystem restoration. While fast-growing species present a higher contribution during the early years, the contribution of slow-growing species is significant at later stages of succession, as pointed out by Gardon et al. (2020).
This study shows that natural regeneration allows the restoration of forest structure and diversity. Here we discuss the local and landscape conditions that allowed a successful natural regeneration and that might be necessary to attain effective forest restoration. Additionally, we discuss indicators that can be used by practitioners to evaluate and monitor forest restoration through natural regeneration in the region.
The potential of natural regeneration to promote forest restoration, depends on local and landscape conditions that enable succession to proceed. First of all, the remnant forest cover in the State of Santa Catarina is high (around 30%, according to Vibrans et al., 2013a, 2020; Lingner et al., 2020). Because of the small size of the farms and the legal restriction against deforestation, these remnants are evenly spread across the State (Siminski and Fantini, 2007), forming a mosaic of secondary and mature forests, which helps to build connectivity among them, facilitating propagule dispersal (Crouzeilles et al., 2020). In addition, the regenerating sites studied show a striking resilience after land use for swidden agriculture, especially keeping soil in good condition (Lintemani et al., 2019), which is necessary in facilitating seed banks and stump sprouts to become important elements of the regeneration process after the land is abandoned. Another factor contributing to fast regeneration of forests may be the long fallow period, up to 30 years, as practiced by farmers in many places, like the Itajaí Valley and the Atlantic Coast (Klein, 1980; Siminski and Fantini, 2007). Such long fallow periods allow the soil to restore fertility (Lintemani et al., 2019) and physical properties. A long period of regeneration is also critical to allow the vegetation to become a source of propagules within the mosaic of regenerating forest and for sustaining an array of dispersers responsible for spreading the propagules to neighboring forest tracts. We recognize that natural regeneration in other regions or different previous land use may present a lower potential to restore degraded/deforested ecosystems (Stanturf et al., 2001; Holl and Aide, 2011; Chazdon and Guariguata, 2016; Crouzeilles et al., 2017; Holl, 2020; César et al., 2021), which can limit its application in specific cases.
In this study, we provide quantitative and qualitative indicators of forest recovery that can be used by practitioners to evaluate and monitor forest restoration within the three forest types herein examined. Quantitative information on forest structure and diversity can be retrieved directly from graphs, which indicate the average levels for the three forest types at all ages (fitted line). Additionally, qualitative information about canopy cover and species composition can help identify recovery dynamics. In the DOF region, for example, a closed canopy happens as early as 15 years after the beginning of succession when Miconia cinnamomifolia forms a nearly homogeneous canopy (Schuch et al., 2008) (Supplementary Figure 1). This event marks a transition from open ecosystems to intensely shaded forests, having a strong impact on pioneer species (Figures 3A–C). Many different successional routes are found in the Atlantic Forest, so each forest has its own species that drives the canopy coverage. Accordingly, this event happens at different times. For example, in the MOF region, the appearance of Mimosa scabrella, a fast-growing pioneer, may cause the formation of a closed canopy in forests as young as 10 years of age (Steenbock et al., 2011). The closing of the canopy favors climax tree species, and the process of vertical stratification of the forest starts. It also makes the environment suitable for other life forms like epiphytes.
Even under apparently favorable conditions, it is important to recognize that some limiting factors may impair or slow down the regeneration process. Lower resilience may be driven by low levels of seed dispersal and/or an absence of forest remnants, a common situation in some highly human-modified landscapes. A scenario with these limiting factors could fully, or partially, demand other restorative actions, such as plantation approaches, to help recovery of the dynamics of regeneration of forest structure, species composition and their interactions (Souza and Batista, 2004; de Melo and Durigan, 2007; Rodrigues et al., 2011; Suganuma and Durigan, 2015; Garcia et al., 2016; Pontes et al., 2019). When an active approach is needed, planted species contribute to internal seed dispersal, supplying seeds to assist secondary succession, as well as improve connectivity across the landscape (Rodrigues et al., 2011). In this sense, the floristic data presented in Supplementary Table 1 can be used as a reference for choosing suitable species for active restoration. We identified those species most common in the early successional stages of regeneration, which will enhance the probability of success of large-scale plantations. We also identified a set of species that occur all across the study area, comprising another group of species suggested for active restoration, as they will potentially adapt to a variety of ecological conditions. Finally, our results made evident the importance of species unique to each forest type, which are critical for qualifying a restoration project.
Another important issue of concern is the occurrence of undesirable species. As pointed out by D'Antonio and Vitousek (1992), Fiore et al. (2019), and Weidlich et al. (2020), a negative association exists between these species and forest community structure and species assembly. In the DOF region, for example, the high susceptibility to fire of Melinis minutiflora, an aggressive grass that forms dense communities right after the abandonment of the land, may set succession back to the starting point more than once. In the SDF region, Hovenia dulcis may become an important element of the forest structure and composition (Dechoum et al., 2015). Colonization by H. dulcis is mostly associated with forest gaps, but the species is also able to invade closed-canopy forest fragments and persist in the more advanced communities (Dechoum et al., 2015; Padilha et al., 2015). However, whether invasive exotic species should be tolerated in restored forests is still a matter of debate in Brazil. Grazing cattle is another common threat to forest restoration all across the Brazilian Atlantic Forest because it may prevent the colonization of many plant species and slow down the pace of succession (Kilca et al., 2020). Fortunately, the problem can be reduced at low cost by building electrical or live fences, technologies already known by local farmers.
Monitoring forests undergoing a restoration process through natural regeneration is obviously crucial to determine the success of the initiative and, ultimately, to determine if the regeneration will flow unassisted. Indicators of potential for natural regeneration can be quantified and mapped, and frameworks can be used for that purpose and to guide decision makers on recognizing natural regeneration as an effective restoration strategy (Chazdon and Guariguata, 2016). Successful monitoring requires the practitioner to understand the whole picture of the succession process in the region (the landscape scale). The practitioners must also be able to recognize features of a particular community (local scale) that signal its qualitative progress.
Based on the data analysis and information of our study, we proposed a set of aspects we should have in mind when evaluating an area being restored through natural regeneration: (1) the matrix surrounding the site to be restored, e.g., predominantly rural or urban, extensive agricultural or industrial tree plantation zone, and proximity to advanced secondary and mature forests; (2) surrounding landscape that indicates frequent natural regeneration or impaired succession; (3) presence of diverse and well-structured regenerated late secondary forests in the region; (4) composition and structure of a given forest patch fit to a stage within a known successional route; (5) presence of juveniles typical of next stages of succession; (6) presence of factors that could delay or prevent succession, such as extreme isolation of the area, invasive species or cattle grazing; and (7) availability of low-cost modifications when limiting factors are present. Developing the skills to interpret the state of a secondary forest beyond the data from an inventory is a matter of training and experience, and training programs would help practitioners to fulfill such requirements.
In naturally regenerating forests, our results showed a continuous turnover of species and ecological groups and an increase in the complexity of forest structure over time. The forest types presented a floristic similarity at early stages of succession, but tended to differentiate over time. While initial succession is important to start forest structure restoration, advanced secondary forests showed the capacity to shelter increasing levels of diversity and likely provide a wider array of ecosystem services. Along with remnants of old-growth forests, these naturally regenerated secondary forests can play an invaluable role in rebuilding healthy ecosystems.
The success of natural regeneration in the region of our study is so conspicuous that we claim it should be the standard approach to restore degraded forest/lands. Because of its low cost, a restoration program based on natural regeneration could prompt landowners to set unproductive areas aside for forest regrowth, especially small farmers, who are otherwise unwilling or financially unable to engage in such programs. However, a combination of local and landscape factors also contributes to the high potential of natural regeneration, such as a significant number of mid and late secondary forests spread across the landscape, the relatively low intensity of previous land use, long fallow periods, and favorable climatic conditions.
The data on species composition, diversity and structure of secondary forests found in our study are valuable to define a set of objective parameters to evaluate and monitor restoration programs, building a reference framework to evaluate the success of restoration initiatives. We reinforce the potential of natural regeneration as part of large-scale restoration programs, which would be particularly attractive to family farmers because of their low cost of supplies and labor in the Atlantic Forest region.
The original contributions presented in the study are included in the article/Supplementary Material, further inquiries can be directed to the corresponding author/s.
All authors agree to be accountable for the content of the work. The authors integrally contributed to the data evaluation and analysis, as well as the writing and discussion of the manuscript.
Financial support came from the Conselho Nacional de Desenvolvimento Científico e Tecnológico (CNPq, Brazil; 141730/2006-4, 201423/2007-3, 304351/2015-6, 423027/2016-6) and from the Fundação de Apoio à Pesquisa Científica e Tecnológica do Estado de Santa Catarina (FAPESC - Edital n° 01/2006 and 03/2017).
The authors declare that the research was conducted in the absence of any commercial or financial relationships that could be construed as a potential conflict of interest.
The handling editor declared a shared affiliation, though no other collaboration, with one of the authors, DZ, at the time of review.
We gratefully acknowledge the expert help of Dr. Marcos Sobral, Dr. Ademir Roberto Ruschel, and Prof. Dr. Ademir Reis in the taxonomic identification of species. We thank the Laboratório de Ecologia e Manejo de Ecossistemas Florestais - LEMEF and Núcleo de Pesquisas em Florestas Tropicais - NPFT for the support.
The Supplementary Material for this article can be found online at: https://www.frontiersin.org/articles/10.3389/ffgc.2021.576908/full#supplementary-material
Aide, T. M., Zimmerman, J. K., Pascarella, J. B., Rivera, L., and Marcano-Vega, H. (2000). Forest regeneration in a chronosequence of tropical abandoned pastures: implications for restoration ecology. Restor. Ecol. 8, 328–338. doi: 10.1046/j.1526-100x.2000.80048.x
Alarcon, G. G., Beltrame, Â. D. V., and Karam, K. F. (2010). Conflitos De Interesse Entre Pequenos Produtores Rurais E a Conservação De Áreas De Preservação Permanente Na Mata Atlântica. Floresta 40, 295–310. doi: 10.5380/rf.v40i2.17825
Alarcon, G. G., Fantini, A. C., Salvador, C. H., and Farley, J. (2017). Additionality is in detail: farmers' choices regarding payment for ecosystem services programs in the Atlantic forest, Brazil. J. Rural Stud. 54, 177–186. doi: 10.1016/j.jrurstud.2017.06.008
Alvares, C. A., Stape, J. L., Sentelhas, P. C., de Moraes Gonçalves, J. L., and Sparovek, G. (2013). Köppen's climate classification map for Brazil. Meteorol. Zeitschrift 22, 711–728. doi: 10.1127/0941-2948/2013/0507
Arroyo-Rodríguez, V., Melo, F. P. L., Martínez-Ramos, M., Bongers, F., Chazdon, R. L., Meave, J. A., et al. (2017). Multiple successional pathways in human-modified tropical landscapes: new insights from forest succession, forest fragmentation and landscape ecology research. Biol. Rev. 92, 326–340. doi: 10.1111/brv.12231
Barbosa, L. M., Shirasuna, R. T., Lima, F. C., and de Ortiz, P. R. T. (2017). Lista de espécies indicadas para Restauração Ecológica para diversas regiões do Estado de São Paulo. São Paulo: Instituto de Botânica.
Barthlott, W., Schmit-Neuerburg, V., Nieder, J., and Engwald, S. (2001). Diversity and abundance of vascular epiphytes: a comparison of secondary vegetation and primary montane rain forest in the Venezuelan Andes. Plant Ecol. 152, 145–156. doi: 10.1023/A:1011483901452
Barton, K. (2020). MuMIn: Multi-Model Inference. R package version 1.43.17. Available online at: https://cran.r-project.org/package=MuMIn (accessed January 5, 2021).
Bates, D., Mäechler, M., Bolker, B. M., and Walker, S. C.s (2015). Fitting linear mixed-effects models using lme4. J. Stat. Softw. 67, 1–48. doi: 10.18637/jss.v067.i01
Bechara, F. C., Dickens, S. J., Farrer, E. C., Larios, L., Spotswood, E. N., Mariotte, P., et al. (2016). Neotropical rainforest restoration: comparing passive, plantation and nucleation approaches. Biodivers. Conserv. 25, 2021–2034. doi: 10.1007/s10531-016-1186-7
Benini, R. D. M., Lenti, F. E. B., Tymus, J. R. C., da Silva, A. P. M., and Insernhagen, I. (2017). Custo de restauração da vegetação nativa no Brasil. Available online at: https://www.nature.org/media/brasil/economia-da-restauracao-florestal-brasil.pdf (accessed June 05, 2020).
Bolker, B. (2020). “bbmle”: Title Tools for General Maximum Likelihood Estimation. R package version 1.0.23.1. Available online at: https://github.com/bbolker/bbmle (accessed January 05, 2021).
Bolker, B. M. (2008). Ecology Ecological Models and Data in R. Princeton, NJ: Princeton University. doi: 10.1086/644667
Brancalion, P. H. S., Campoe, O., Mendes, J. C. T., Noel, C., Moreira, G. G., van Melis, J., et al. (2019a). Intensive silviculture enhances biomass accumulation and tree diversity recovery in tropical forest restoration. Ecol. Appl. 29, 1–12. doi: 10.1002/eap.1847
Brancalion, P. H. S., Niamir, A., Broadbent, E., Crouzeilles, R., Barros, F. S. M., Almeyda Zambrano, A. M., et al. (2019b). Global restoration opportunities in tropical rainforest landscapes. Sci. Adv. 5, 1–12. doi: 10.1126/sciadv.aav3223
BRASIL (2006). Lei n° 11.428, de 22 de dezembro. Brasil. Available online at: http://www.planalto.gov.br/ccivil_03/_ato2004-2006/2006/lei/l11428.htm (accessed September 20, 2020).
Breheny, P., and Burchett, W. (2017). Visualization of regression models using visreg. R J. 9, 56–71. doi: 10.32614/RJ-2017-046
Budowski, G. (1965). Distribution of tropical American Rain Forest trees in the light of successional process. Turrialba 15, 40–42.
Campoe, O. C., Stape, J. L., and Mendes, J. C. T. (2010). Can intensive management accelerate the restoration of Brazil's Atlantic forests? For. Ecol. Manage 259, 1808–1814. doi: 10.1016/j.foreco.2009.06.026
César, R. G., Moreno, V., de, S., Coletta, G. D., Schweizer, D., Chazdon, R. L., Barlow, J., et al. (2021). It is not just about time: agricultural practices and surrounding forest cover affect secondary forest recovery in agricultural landscapes. Biotropica btp12893. doi: 10.1111/btp.12893
Chave, J., Muller-Landau, H. C., Baker, T. R., Easdale, T. A., Hans Steege, T. E. R., and Webb, C. O. (2006). Regional and phylogenetic variation of wood density across 2456 neotropical tree species. Ecol. Appl. 16, 2356–2367. doi: 10.1890/1051-0761(2006)016[2356:RAPVOW]2.0.CO;2
Chave, J., Réjou-Méchain, M., Búrquez, A., Chidumayo, E., Colgan, M. S., Delitti, W. B. C., et al. (2014). Improved allometric models to estimate the aboveground biomass of tropical trees. Glob. Chang. Biol. 20, 3177–3190. doi: 10.1111/gcb.12629
Chazdon, R. L., Broadbent, E. N., Rozendaal, D. M. A., Bongers, F., Zambrano, A. M. A., Aide, T. M., et al. (2016). Carbon sequestration potential of second-growth forest regeneration in the Latin American tropics. Sci. Adv. 2, 1–10. doi: 10.1126/sciadv.1501639
Chazdon, R. L., and Guariguata, M. R. (2016). Natural regeneration as a tool for large-scale forest restoration in the tropics: prospects and challenges. Biotropica 48, 716–730. doi: 10.1111/btp.12381
Chazdon, R. L., Lindenmayer, D., Guariguata, M. R., Crouzeilles, R., Rey Benayas, J. M., and Lazos Chavero, E. (2020). Fostering natural forest regeneration on former agricultural land through economic and policy interventions. Environ. Res. Lett. 15:ab79e6. doi: 10.1088/1748-9326/ab79e6
Clements, F. E. (1916). Plant Sucession: An Analysis of the Development of Vegetation. Washington, DC: Carnegie Institution of Washington Publcation. doi: 10.5962/bhl.title.56234
Colmanetti, M. A. A., Shirasuna, R. T., and Barbosa, L. M. (2015). Flora vascular não arbórea de um reflorestamento implantado com espécies nativas. Hoehnea 42, 725–735. doi: 10.1590/2236-8906-26/RAD/2015
Colwell, R. K. (2019). EstimateS: Statistical Estimation of Species Richness and Shared Species From Samples. Boulder, CO: University of Colorado, Museum of Natural History.
Crouzeilles, R., Beyer, H. L., Monteiro, L. M., Feltran-Barbieri, R., Pessôa, A. C. M., Barros, F. S. M., et al. (2020). Achieving cost-effective landscape-scale forest restoration through targeted natural regeneration. Conserv. Lett. 13:e12709. doi: 10.1111/conl.12709
Crouzeilles, R., Curran, M., Ferreira, M. S., Lindenmayer, D. B., Grelle, C. E. V., and Rey Benayas, J. M. (2016). A global meta-analysis on the ecological drivers of forest restoration success. Nat. Commun. 7, 1–8. doi: 10.1038/ncomms11666
Crouzeilles, R., Ferreira, M. S., Chazdon, R. L., Lindenmayer, D. B., Sansevero, J. B. B., Monteiro, L., et al. (2017). Ecological restoration success is higher for natural regeneration than for active restoration in tropical forests. Sci. Adv. 3, 1–8. doi: 10.1126/sciadv.1701345
Crouzeilles, R., Santiami, E., Rosa, M., Pugliese, L., Brancalion, P. H. S., Rodrigues, R. R., et al. (2019). There is hope for achieving ambitious Atlantic Forest restoration commitments. Perspect. Ecol. Conserv. 17, 80–83. doi: 10.1016/j.pecon.2019.04.003
Dalagnol, R., Christo, A. G., Higuchi, P., and Rodrigues, A. V. (2013). Função Para Cálculo dos Descritores Fitossociológicos e Similaridade Entre Sítios. Available at: https://github.com/ricds/fitoR (accessed January 20, 2020).
D'Antonio, C. M., and Vitousek, P. M. (1992). Biological invasions by exotic grassess, the grass/fire cycle, and global change. Annu. Rev. Ecol. Syst. 23, 63–87. doi: 10.1146/annurev.es.23.110192.000431
de Melo, A. C. G., and Durigan, G. (2007). Structural evolution of planted riparian forests in the medium Paranapanema Valley, SP, Brazil. Sci. For. 35, 101–111.
Dechoum, M. S., Zenni, R. D., Castellani, T. T., Zalba, S. M., and Rejmanek, M. (2015). Invasions across secondary forest successional stages: effects of local plant community, soil, litter, and herbivory on Hovenia dulcis seed germination and seedling establishment. PLANT Ecol. 216, 823–833. doi: 10.1007/s11258-015-0470-z
Egler, F. E. (1954). Vegetation science concepts I. Initial floristic composition, a factor in old-field vegetation development with 2 figs. Veg. Acta Geobot. 4, 412–417. doi: 10.1007/BF00275587
Fantini, A. C., Bauer, E., de Valois, C. M., and Siddique, I. (2017). The demise of swidden-fallow agriculture in an Atlantic Rainforest region: implications for farmers' livelihood and conservation. Land Use Policy 69, 417–426. doi: 10.1016/j.landusepol.2017.09.039
Ferreira, P. I., Gomes, J. P., Batista, F., Bernardi, A. P., Da Costa, N. C. F., Da Costa Bortoluzzi, R. L., et al. (2013). Espécies potenciais para recuperação de áreas de preservação permanente no planalto catarinense. Floresta e Ambient. 20, 173–182. doi: 10.4322/floram.2013.003
Finegan, B. (1996). Pattern and process in neotropical secondary rain forests: the first 100 years of succession. Trends Ecol. Evol. 11, 119–124. doi: 10.1016/0169-5347(96)81090-1
Fiore, N. V., Ferreira, C. C., Dzedzej, M., and Massi, K. G. (2019). Monitoring of a seedling planting restoration in a permanent preservation area of the southeast atlantic forest biome, Brazil. Forests 10, 1–12. doi: 10.3390/f10090768
Garcia, L. C., Hobbs, R. J., Ribeiro, D. B., Tamashiro, J. Y., Santos, F. A. M., and Rodrigues, R. R. (2016). Restoration over time: is it possible to restore trees and non-trees in high-diversity forests? Appl. Veg. Sci. 19, 655–666. doi: 10.1111/avsc.12264
Gardon, F. R., Santos, R. F., and dos Rodrigues, R. R. (2020). Brazil's forest restoration, biomass and carbon stocks: a critical review of the knowledge gaps. For. Ecol. Manage. 462:117972. doi: 10.1016/j.foreco.2020.117972
Garnier, S. (2018a). viridis: Default Color Maps from “matplotlib.” Available online at: https://cran.r-project.org/package=viridis (accessed January 8, 2021).
Garnier, S. (2018b). viridisLite: Default Color Maps from “matplotlib” (Lite Version). Available online at: https://cran.r-project.org/package=viridisLite (accessed January 8, 2021).
Gasper, A. L., De Sevegnani, L., Vibrans, A. C., Sobral, M., Uhlmann, A., Lingner, D. V., et al. (2013a). Inventário florístico florestal de Santa Catarina: espécies da Floresta Ombrófila Mista. Rodriguésia 64, 201–210. doi: 10.1590/S2175-78602013000200001
Gasper, A. L., De Uhlmann, A., Sevegnani, L., Lingner, D. V., Rigon-júnior, M. J., Verdi, M., et al. (2013b). Inventário Florístico Florestal de Santa Catarina : espécies da Floresta Estacional Decidual. Rodriguésia 64, 427–443. doi: 10.1590/S2175-78602013000300001
Gasper, A. L., De Uhlmann, A., Sevegnani, L., Meyer, L., Lingner, D. V., Verdi, M., et al. (2014). Floristic and forest inventory of Santa Catarina: species of evergreen rainforest. Rodriguesia 65, 807–816. doi: 10.1590/2175-7860201465401
Gelman, A., and Hill, J. (2007). Data Analysis Using Regression and Multilevel/Hierarchical Models, 1st Edn. New York, NY: Cambridge. doi: 10.1017/CBO9780511790942
Gomes, E. P. C., Sugiyama, M., Adams, C., Prado, H. M., and De Oliveira, C. J. F. (2013). A sucessão florestal em roças em pousio: a natureza está fora da lei? Sci. For. Sci. 41, 343–352.
Grossnickle, S. C. (2012). Why seedlings survive: influence of plant attributes. New For. 43, 711–738. doi: 10.1007/s11056-012-9336-6
Guariguata, M. R., and Ostertag, R. (2001). Neotropical secondary forest succession: changes in structural and functional characteristics. For. Ecol. Manage. 148, 185–206. doi: 10.1016/S0378-1127(00)00535-1
Holl, K. D. (2002). “Tropical moist forest restoration,” in Handbook of Restoration, eds. M. R. Perrow and A. J. Davy (Cambridge: Cambridge University Press), 539–558.
Holl, K. D., and Aide, T. M. (2011). When and where to actively restore ecosystems? For. Ecol. Manage. 261, 1558–1563. doi: 10.1016/j.foreco.2010.07.004
Hurlbert, S. H. (1971). The nonconcept of species diversity: a critique and alternative parameters. Ecology 52, 577–586. doi: 10.2307/1934145
IBGE (2019). Censo Agropecuário: resultados definitivos 2017. AGRO. Available online at: https://censos.ibge.gov.br/agro/2017/resultados-censo-agro-2017/resultados-definitivos.html (accessed May 23, 2020).
IUCN (2011). Bonn Challenge. Restore our Futur. Available online at: https://www.bonnchallenge.org/ (accessed March 19, 2020).
Joly, C. A., Metzger, J. P., and Tabarelli, M. (2014). Experiences from the Brazilian Atlantic Forest: ecological findings and conservation initiatives. New Phytol. 204, 459–473. doi: 10.1111/nph.12989
Jørgensen, D. (2013). Ecological restoration in the Convention on Biological Diversity targets. Biodivers. Conserv. 22, 2977–2982. doi: 10.1007/s10531-013-0550-0
Kageyama, P. Y., and Isshiki, K. (1992). “Levantamento de espécies em plantios mistos,” in Recomposição da vegetação com espécies arbóreas nativas em reservatórios de usinas hidrelétricas da CESP (Piracicaba, SP: IPEF-Instituto de Pesquisas e Estudos Florestais), 8–10.
Kassambara, A. (2020). ggpubr: “ggplot2” Based Publication Ready Plots. R package version 0.4.0. Available online at: https://CRAN.R-project.org/package=ggpubr (accessed January 8, 2021).
Kilca, R., de, V., Higuchi, P., and Silva da, A. C. (2020). Effects of cattle gazing on cloud forests in São Joaquim National Park, Santa Catarina state, Brazil. Cienc. Florest. 30, 1–17. doi: 10.5902/1980509821179
Kindt, R. (2020). Package “BiodiversityR:” Package for Community Ecology and Suitability Analysis. Nairobi, Kenya: World Agroforestry Centre (ICRAF).
Klauberg, C., Paludo, G. F., Bortoluzzi, R. L., da, C., and Mantovani, A. (2011). Florística e estrutura de um fragmento de Floresta Ombrófila Mista no Planalto Catarinense. Biotemas 23, 35–47. doi: 10.5007/2175-7925.2010v23n1p35
Kuznetsova, A., Brockhoff, P. B., and Christensen, R. H. B. (2017). lmerTest Package: tests in linear mixed effects models. J. Stat. Softw. 82:i13. doi: 10.18637/jss.v082.i13
Lamb, D., Erskine, P. D., and Parrotta, J. A. (2005). Restoration of degraded tropical forest landscapes. Science 310, 1628–1632. doi: 10.1126/science.1111773
Letcher, S. G., and Chazdon, R. L. (2009). Rapid recovery of biomass, species richness, and species composition in a forest chronosequence in northeastern costa Rica. Biotropica 41, 608–617. doi: 10.1111/j.1744-7429.2009.00517.x
Liebsch, D., Goldenberg, R., and Marques, M. C. M. (2007). Florística e estrutura de comunidades vegetais em uma cronoseqüência de Floresta Atlântica no Estado do Paraná, Brasil. Acta Bot. Brasilica 21, 983–992. doi: 10.1590/S0102-33062007000400023
Liebsch, D., Marques, M. C. M., and Goldenberg, R. (2008). How long does the Atlantic Rain Forest take to recover after a disturbance? Changes in species composition and ecological features during secondary succession. Biol. Conserv. 141, 1717–1725. doi: 10.1016/j.biocon.2008.04.013
Lingner, D. V., Rodrigues, A. V., Oliveira, L. Z., de Gasper, A. L., and Vibrans, A. C. (2020). Modelling changes in forest attributes driven by human activities at different spatial scales in the subtropical Atlantic Forest. Biodivers. Conserv. 29, 1283–1299. doi: 10.1007/s10531-020-01935-5
Lintemani, M. G., Loss, A., Mendes, C. S., and Fantini, A. C. (2019). Long fallows allow soil regeneration in slash-and-burn agriculture. J. Sci. Food Agric. 100, 1142–1154. doi: 10.1002/jsfa.10123
Lohbeck, M., Poorter, L., Martinez-Ramos, M., Bongers, F., and Craft, N. J. B. (2015). Biomass is the main driver of changes in ecosystem process rates during tropical forest succession. Ecology 96, 1242–1252. doi: 10.1890/14-0472.1
Mantovani, M., Ruschel, A. R., Puchalski, Â., Da Silva, J. Z., Dos Reis, M. S., and Nodari, R. O. (2005). Diversidade de espécies e estrutura sucessional de uma formação secundária da floresta ombrófila densa. Sci. For. Sci. 14–26.
Mao, C. X., Colwell, R. K., and Chang, J. (2005). Estimating the species accumulation curve using mixtures. Biometrics 61, 433–441. doi: 10.1111/j.1541-0420.2005.00316.x
Martins, R. (2005). Florística, estrutura fitossociológica e interações interespecíficas de um remanescente de Floresta Ombrófila Densa como subsídio para recuperação de áreas degradadas pela mineração de carvão. Siderópolis, SC. Florianópolis, SC: Universidade Federal de Santa Catarina.
Matos, F. A. R., Magnago, L. F. S., Aquila Chan Miranda, C., de Menezes, L. F. T., Gastauer, M., Safar, N. V. H., et al. (2020). Secondary forest fragments offer important carbon and biodiversity cobenefits. Glob. Chang. Biol. 26, 509–522. doi: 10.1111/gcb.14824
Meli, P., Holl, K. D., Benayas, J. M. R., Jones, H. P., Jones, P. C., Montoya, D., et al. (2017). A global review of past land use, climate, and active vs. passive restoration effects on forest recovery. PLoS ONE 12, 1–17. doi: 10.1371/journal.pone.0171368
Müeller-Dombois, D., and Ellenberg, H. (1974). Aims and Methods of Vegetation Ecology, 1st Edn. New York, NY: John Wiley and Sons.
Oksanen, J., Blanchet, F. G., Friendly, M., Kindt, R., Legendre, P., McGlinn, D., et al. (2019). vegan: Community Ecology Package. Available online at: https://CRAN.R-project.org/package=vegan (accessed January 8, 2021).
Oliveira, L. Z., de Gasper, A. L., Lingner, D. V., Sevegnani, L., and Vibrans, A. C. (2019a). Secondary subtropical Atlantic forests shelter a surprising number of rare tree species: outcomes of an assessment using spatially unbiased data. Biodivers. Conserv. 28, 751–768. doi: 10.1007/s10531-018-01690-8
Oliveira, L. Z., Uller, H. F., Klitzke, A. R., Eleotério, J. R., and Vibrans, A. C. (2019b). Towards the fulfillment of a knowledge gap: wood densities for species of the subtropical atlantic forest. Data 4, 1–10. doi: 10.3390/data4030104
Padilha, D. L., Loregian, A. C., and Budke, J. C. (2015). Forest fragmentation does not matter to invasions by Hovenia dulcis. Biodivers. Conserv. 24, 2293–2304. doi: 10.1007/s10531-015-0930-8
Pontes, D. M. F., Engel, V. L., and Parrotta, J. A. (2019). Forest structure, wood standing stock, and tree biomass in different restoration systems in the Brazilian Atlantic forest. Forests 10, 1–18. doi: 10.3390/f10070588
Rezende, C. L., Scarano, F. R., Assad, E. D., Joly, C. A., Metzger, J. P., Strassburg, B. B. N., et al. (2018). From hotspot to hopespot: an opportunity for the Brazilian Atlantic Forest. Perspect. Ecol. Conserv. 16, 208–214. doi: 10.1016/j.pecon.2018.10.002
Roa-Fuentes, L. L., Martínez-Garza, C., Etchevers, J., and Campo, J. (2015). Recovery of soil C and N in a tropical pasture: passive and active restoration. L. Degrad. Dev. 26, 201–210. doi: 10.1002/ldr.2197
Rodrigues, R. R., Gandolfi, S., Nave, A. G., Aronson, J., Barreto, T. E., Vidal, C. Y., et al. (2011). Large-scale ecological restoration of high-diversity tropical forests in SE Brazil. For. Ecol. Manage. 261, 1605–1613. doi: 10.1016/j.foreco.2010.07.005
Roskov, Y., Kunze, T., Orrell, T., Abucay, L., Paglinawan, L., Culham, A., et al. (2019). Species 2000 & ITIS Catalogue of Life. Species 2000 Nat. Available online at: http://www.catalogueoflife.org/annual-checklist/ (accessed December 17, 2019).
Rozendaal, D. M. A., Bongers, F., Aide, T. M., Alvarez-Dávila, E., Ascarrunz, N., Balvanera, P., et al. (2019). Biodiversity recovery of Neotropical secondary forests. Sci. Adv. 5:aau3114. doi: 10.1126/sciadv.aau3114
RStudio Team (2019). RStudio: Integrated Development for R. RStudio. Boston, MA. Available online at: http://www.rstudio.com/ (accessed October 20, 2020).
RStudio Team (2019). RStudio: Integrated Development for R. Available online at: http://www.rstudio.com/ (accessed January 10, 2021).
Saldarriaga, J. G., West, D. C., Tharpt, M. L., and Uhl, C. (1988). Long-term chronosequence of forest succession in the Upper Rio Negro of Colombia and Venezuela. Br. Ecol. Soc. 76, 938–958. doi: 10.2307/2260625
Santos da, J. H. S., Ferreira, R. L. C., Silva, J. A. A., da Souza, A. L., de Santos de, E. S., and Meunier, I. M. J. (2004). Distinction of ecological groups of forest species through multivariate techniques. Rev. Árvore 28, 387–396. doi: 10.1590/S0100-67622004000300010
SAR (2005). Secretaria de Agricultura e Abastecimento do Estado de Santa Catarina. Florianópolis: Inventário Florístico Florestal de Santa Catarina. Relatório do Projeto Piloto, 170. Avaialble online at: http://ciram.epagri.sc.gov.br/index.php?option=com_content&view=article&id=1172 (accessed September 4, 2020).
Scarano, F. R., and Ceotto, P. (2015). Brazilian Atlantic forest: impact, vulnerability, and adaptation to climate change. Biodivers. Conserv. 24, 2319–2331. doi: 10.1007/s10531-015-0972-y
Schuch, C., Siminski, A., and Fantini, A. C. (2008). Uso e potencial madeireiro do jacatirão-açu (Miconia cinnamomifolia (de Candolle)Naudin) no litoral de Santa Catarina. Floresta 38, 735–741. doi: 10.5380/rf.v38i4.13169
Secretaria do Meio Ambiente do Estado de São Paulo (2008). Resolução SMA n° 8/2008. Available online at: https://licenciamento.cetesb.sp.gov.br/legislacao/estadual/resolucoes/2008_Res_SMA_08.pdf (accessed June 16, 2020).
Siminski, A., and Fantini, A. C. (2007). Roça-de-toco: uso de recursos florestais e dinâmica da paisagem rural no litoral de Santa Catarina. Cienc. Rural 37, 690–696. doi: 10.1590/S0103-84782007000300014
Siminski, A., Fantini, A. C., Guries, R. P., Ruschel, A. R., and dos Reis, M. S. (2011). Secondary forest succession in the Mata Atlantica, Brazil: floristic and phytosociological trends. ISRN Ecol. 2011, 1–19. doi: 10.5402/2011/759893
Siminski, A., Fantini, A. C., and Reis, M. S. (2013). Classificação da vegetação secundária em estágios de regeneração da Mata Atlântica em Santa Catarina. Cienc. Florest. 23, 369–378. doi: 10.5902/1980509810548
Smith, E. P., and van Belle, G. (1984). Nonparametric estimation of species richness. Biometrics 40:119. doi: 10.2307/2530750
Soares-Filho, B., Rajão, R., Macedo, M., Carneiro, A., Costa, W., Coe, M., et al. (2014). Cracking Brazil's forest code. Science 344, 363–364. doi: 10.1126/science.1246663
SOS Mata Atlântica (2020). Atlantic Forest maps base. Available online at: http://mapas.sosma.org.br/ (accessed September 4, 2020).
Souza de, F. M., and Batista, J. L. F. (2004). Restoration of seasonal semideciduous forests in Brazil: influence of age and restoration design on forest structure. For. Ecol. Manage. 191, 185–200. doi: 10.1016/j.foreco.2003.12.006
Stanturf, J. A., Schoenholtz, S. H., Schweitzer, C. J., and Shepard, J. P. (2001). Achieving restoration success: myths in bottomland hardwood forests. Restor. Ecol. 9, 189–200. doi: 10.1046/j.1526-100x.2001.009002189.x
Steenbock, W., Siminski, A., Fantini, A. C., and dos Reis, M. S. (2011). Occurrence of bracatinga (Mimosa Scabrella Benth.) in bracatinga traditional management system (bracatingais) and secondary forests in Santa Catarina state Plateau. Rev. Arvore 35, 845–857. doi: 10.1590/S0100-67622011000500010
Stevens, P. F. (2017). Angiosperm Phylogeny Website. Version 14. Available online at: http://www.mobot.org/MOBOT/research/APweb/ (accessed October 4, 2019).
Suganuma, M. S., and Durigan, G. (2015). Indicators of restoration success in riparian tropical forests using multiple reference ecosystems. Restor. Ecol. 23, 238–251. doi: 10.1111/rec.12168
Sujii, P. S., Schwarcz, K. D., Grando, C., de Aguiar Silvestre, E., Mori, G. M., Brancalion, P. H. S., et al. (2017). Recovery of genetic diversity levels of a Neotropical tree in Atlantic Forest restoration plantations. Biol. Conserv. 211, 110–116. doi: 10.1016/j.biocon.2017.05.006
Tabarelli, M., and Mantovani, W. (1999). A Regeneração de uma floresta tropical montana após corte e queima (São Paulo - Brasil). Rev. Bras. Biol. 59, 239–250. doi: 10.1590/S0034-71081999000200008
Toledo, R. M., Santos, R. F., Verheyen, K., and Perring, M. P. (2018). Ecological restoration efforts in tropical rural landscapes: challenges and policy implications in a highly degraded region. Land Use Policy 75, 486–493. doi: 10.1016/j.landusepol.2018.03.053
Trentin, B. E., Estevan, D. A., Rossetto, E. F. S., Gorenstein, M. R., Brizola, G. P., and Bechara, F. C. (2018). Restauração florestal na mata atlântica: passiva, nucleação e plantio de alta diversidade. Cienc. Florest. 28, 160–174. doi: 10.5902/1980509831647
Veloso, H. P., Filho, A. L. R. R., and Lima, J. C. A. (1991). Classificação da vegetação brasileira, adaptada a um sistema universal. Rio de Janeiro: IBGE, Departamento de Recursos Naturais e Estudos Ambientais. Available online at: https://biblioteca.ibge.gov.br/visualizacao/monografias/GEBIS-RJ/classificacaovegetal.pdf (accessed June 14, 2020).
Vibrans, A. C., De Gasper, A. L., Moser, P., Oliveira, L. Z., Lingner, D. V., and Sevegnani, L. (2020). Insights from a large-scale inventory in the southern Brazilian Atlantic Forest. Sci. Agric. 77:2020. doi: 10.1590/1678-992x-2018-0036
Vibrans, A. C., McRoberts, R. E., Moser, P., and Nicoletti, A. L. (2013a). Using satellite image-based maps and ground inventory data to estimate the area of the remaining Atlantic forest in the Brazilian state of Santa Catarina. Remote Sens. Environ. 130, 87–95. doi: 10.1016/j.rse.2012.10.023
Vibrans, A. C., Sevegnani, L., Gasper, A. L., and de, Lingner, D. V. (2012b). Inventario Floristico Florestal de Santa Catarina: Floresta Estacional Decidual, Vol 2, 1st Edn. Blumenau: Edifurb.
Vibrans, A. C., Sevegnani, L., Gasper, A. L., and de Lingner, D. V. (2013b). Inventario Floristico Florestal de Santa Catarina: Floresta Ombrófila Mista. Blumenau: Edifurb
Vibrans, A. C., Sevegnani, L., Gasper, A. L., and de Lingner, D. V. (2012a). Diversidade e conservação dos remanescentes florestais.
Vibrans, A. C., Sevegnani, L., Gasper, A. L., and de Lingner, D. V. (2013c). Inventário Florístico Florestal de Santa Catarina: Floresta Ombrófila Densa. Vol. 4, 1st Edn. eds. A. C. Vibrans, L. Sevegnani, A. L. de Gasper, and D. V. Lingner (Blumenau, SC: Idefurb).
Vogel, H. F., Campos, J. B., and Bechara, F. C. (2015). Early bird assemblages under different subtropical forest restoration strategies in Brazil: passive, nucleation and high diversity plantation. Trop. Conserv. Sci. 8, 912–939. doi: 10.1177/194008291500800404
Weidlich, E. W. A., Flórido, F. G., Sorrini, T. B., and Brancalion, P. H. S. (2020). Controlling invasive plant species in ecological restoration: a global review. J. Appl. Ecol. 57, 1806–1817. doi: 10.1111/1365-2664.13656
Wilke, C. O. (2019). cowplot: Streamlined Plot Theme and Plot Annotations for “ggplot2.” R package version 1.0.0. CRAN, 1?40. Available online at: https://wilkelab.org/cowplot (accessed September 29, 2020).
Keywords: forest succession, secondary forest, passive restoration, swidden agriculture, chronosequences
Citation: Siminski A, Zambiazi DC, dos Santos KL and Fantini AC (2021) Dynamics of Natural Regeneration: Implications for Landscape Restoration in the Atlantic Forest, Brazil. Front. For. Glob. Change 4:576908. doi: 10.3389/ffgc.2021.576908
Received: 27 June 2020; Accepted: 15 February 2021;
Published: 11 March 2021.
Edited by:
Catarina C. Jakovac, Wageningen University and Research, NetherlandsReviewed by:
Tarin Toledo-Aceves, Instituto de Ecología (INECOL), MexicoCopyright © 2021 Siminski, Zambiazi, dos Santos and Fantini. This is an open-access article distributed under the terms of the Creative Commons Attribution License (CC BY). The use, distribution or reproduction in other forums is permitted, provided the original author(s) and the copyright owner(s) are credited and that the original publication in this journal is cited, in accordance with accepted academic practice. No use, distribution or reproduction is permitted which does not comply with these terms.
*Correspondence: Alexandre Siminski, YWxleGFuZHJlLnNpbWluc2tpQHVmc2MuYnI=
Disclaimer: All claims expressed in this article are solely those of the authors and do not necessarily represent those of their affiliated organizations, or those of the publisher, the editors and the reviewers. Any product that may be evaluated in this article or claim that may be made by its manufacturer is not guaranteed or endorsed by the publisher.
Research integrity at Frontiers
Learn more about the work of our research integrity team to safeguard the quality of each article we publish.