
95% of researchers rate our articles as excellent or good
Learn more about the work of our research integrity team to safeguard the quality of each article we publish.
Find out more
ORIGINAL RESEARCH article
Front. For. Glob. Change , 14 December 2020
Sec. Forest Disturbance
Volume 3 - 2020 | https://doi.org/10.3389/ffgc.2020.569184
This article is part of the Research Topic Enhancing Natural Regeneration to Restore Landscapes View all 13 articles
 Mário Marcos do Espírito-Santo1,2*
 André Medeiros Rocha3,4Marcos Esdras Leite4Jhonathan Oliveira Silva5Lucas Augusto Pereira Silva4Gerardo Arturo Sanchez-Azofeifa6
The determination of land cover changes (LCCs) and their association to biophysical and socioeconomic factors is vital to support government policies toward the sustainable use of natural resources. The present study aimed to quantify deforestation, forest recovery and net cover change in tropical dry forests (TDFs) in Brazil from 2007 to 2016, and investigate how they are associated to biophysical and socioeconomic factors. We also assessed the effects of LCC variables in human welfare indicators. For this purpose, we used MODIS imagery to calculate TDF gross loss (deforestation), gross gain (forest recovery) and net cover change (the balance between deforestation and forest recovery) for 294 counties in three Brazilian states (Minas Gerais, Bahia, and Piauí). We obtained seven factors potentially associated to LCC at the county level: total county area, road density, humidity index, slope, elevation, and % change in human population and in cattle density. From 2007 to 2016, TDF cover increased from 76,693 to 80,964 km2 (+5.6%). This positive net change resulted from a remarkable forest recovery of 19,018 km2 (24.8%), offsetting a large deforested area (14,748 km2; 19.2%). Practically all these cover changes were a consequence of transitions from TDF to pastures and vice-versa, highlighting the importance of developing sustainable policies for cattle raising in TDF regions. Each LCC variable was associated to different set of factors, but two biophysical variables were significantly associated both to TDF area gained and lost per county: county area (positively) and slope (negatively), indicating that large and flat counties have very dynamic LCCs. The TDF net area change was only associated (negatively) to the humidity index, reflecting an increase in TDF cover in more arid counties. The net increase in Brazilian TDF area is likely a result from an interplay of biophysical and socioeconomic factors that reduced deforestation and caused pasture abandonment. Although the ecological integrity and permanence of secondary TDFs need further investigation, the recovery of this semi-arid ecosystem must be valued and accounted for in the national forest restoration programs, as it would significantly help achieving the goals established in the Bonn agreement and the Atlantic Rain Forest pact.
The detection of land cover change (LCC) and its causes is fundamental to the formulation of public policies aiming at reducing the loss of biodiversity and ecosystem services, especially in highly threatened tropical regions. The typical land use cycle in the tropics starts with deforestation of mature or secondary forests, frequently with the use of fire, to the establishment of pastures or croplands (Thomaz, 2013; Mesquita et al., 2015; Barlow et al., 2020; Schmidt and Eloy, 2020). Indeed, livestock raising and agriculture are the most important drivers of land cover change in Latin America (Armenteras et al., 2017; Curtis et al., 2018; Bonilla-Moheno and Aide, 2020). The extent and consequences of such process are well-illustrated by the recent and drastic increase in fires and deforestation in Brazil, especially in the Amazon (Barlow et al., 2020; Escobar, 2020).
Usually, tropical agricultural lands are managed using fertilizers, pesticides, and fire [Barona et al., 2010; Organization for Economic Co-operation Development (OECD), 2018], frequently causing soil exhaustion (Sousa et al., 2012; Rocha-Júnior et al., 2017) followed by land abandonment (Lawrence et al., 2010; Thomaz, 2013; Mesquita et al., 2015). Very degraded soils in tropical regions are generally less suitable to plant recolonization (Jakovac et al., 2016; Rezende and Vieira, 2019), which can cause desertification especially in semi-arid regions (Sousa et al., 2012; Marengo and Bernasconi, 2015; Queiroz et al., 2020). However, natural regeneration is somewhat frequent, but its speed and pathways depend on several factors, such as landscape configuration (e.g., distance to forested areas, amount of forest cover) that affect the sources of plant colonizers (Jakovac et al., 2015; Rozendaal et al., 2019), and previous land use practices that determine soil biotic and abiotic conditions for seed germination and plant growth (Jakovac et al., 2015, 2016; Rezende and Vieira, 2019).
In recent years, the importance of forest recovery and secondary forests to biodiversity conservation has received increased attention (Wright and Muller-Landau, 2006; Lugo, 2009; Poorter et al., 2016). Usually, forest recovery through natural regeneration is more cost-effective than active restoration through tree planting, especially at the regional and national scales (Catterall and Harrison, 2006; Nunes et al., 2017; Crouzeilles et al., 2020). A recent global meta-analysis also indicated that, in tropical regions, natural regeneration is more successful to restore biodiversity and vegetation structure than active restoration when abiotic and biotic factors are controlled (Crouzeilles et al., 2017). However, the effectiveness of natural regeneration can be hindered in isolated, dry and/or highly degraded regions, where active restoration is considered more adequate (Holl and Aide, 2011; Crouzeilles et al., 2017)
In order to develop policies to stimulate large-scale restoration initiatives, it is necessary to determine the spatial occurrence of both deforestation and forest recovery, as well as their association to biophysical and socioeconomic factors. It is also important to assess the effects of LCC on human welfare, because agricultural sectors in tropical countries claim that deforestation is necessary for increasing employment and income (frequently based on Kuznets environmental curves) (Bhattarai and Hammig, 2004; Espírito-Santo et al., 2016; Santiago and Couto, 2020). On the other hand, environmental agencies and researchers indicate that decreasing natural vegetation cover inevitably erode ecosystems services that support human well-being (IPBES, 2019). In many cases, forest recovery occurs after land abandonment in private properties for economic reasons, including decreasing demand for commodities (e.g., beef, soybean, palm oil), change in technology, urbanization and rural exodus, among others (Rey-Benayas et al., 2007; Lambin and Meyfroidt, 2010; Espírito-Santo et al., 2016; Stan and Sanchez-Azofeifa, 2019). However, the frequency of land abandonment is influenced by biophysical characteristics that affect productivity, such as terrain slope, soil fertility, and climate (Díaz et al., 2011; Aide et al., 2013; Xie et al., 2020). Local and regional socioeconomic factors are also important, including access to bank loans, government subsidies, distance to consuming markets and transport infrastructure, among others (Laue and Arima, 2016; Trigueiro et al., 2020).
High deforestation and degradation rates were observed for TDFs in the Americas (Miles et al., 2006; Portillo-Quintero and Sánchez-Azofeifa, 2010; Grinand et al., 2013; Rudel, 2017; Dupin et al., 2018), a situation that is worsened in Brazil by the neglection of these ecosystems in terms of research and conservation efforts, especially when compared to tropical wet forests (Sánchez-Azofeifa et al., 2005; Santos et al., 2011; Blackie et al., 2014). The present study aimed to estimate the extent of LCC (with focus on forest recovery, deforestation and net forest cover change) in Brazilian TDFs during 10 years (from 2007 to 2016). Based on previous studies at different scales (Aide et al., 2013; Beuchle et al., 2015; Dupin et al., 2018), we predict that TDF recovery is extremely important to offset the huge deforestation rates observed in this ecosystem. Furthermore, we hypothesize that deforestation and forest recovery (and also the balance between them), which are motivated by distinct reasons, are associated to different biophysical and socioeconomic factors. For these purposes, we mapped an area of 917,768 km2 in the states of Minas Gerais, Bahia and Piauí, where most TDFs are concentrated (143,813 km2, 52.5%), using counties as analytical units. We expect that deforestation will be higher in large, flat, and humid counties with high density of roads, human population, and cattle herd. Regeneration will also be higher in large, flat, and humid counties, but negatively associated to the density of roads, human population, and cattle herd. Finally, we hypothesize that human welfare indicators are associated with LCC. In this case, we predict that counties with high deforestation from 2007 to 2016 will exhibit an increase in inequality and a decrease in gross domestic product and human development index.
In this study, we use the tropical dry forest definition of the Brazilian Institute for Geography and Statistics (IBGE), which is based on vegetation structure and phenology [Instituto Brasileiro de Geografia e Estatística (IBGE), 2012]. As such, TDFs are considered to have four strata (herbs, shrubs, treelets, and trees), with dominance of trees with 20–30 m in height, and are composed by deciduous plants that lose more than 50% of their leaves during the dry season. This definition is also concurrent with those of Murphy and Lugo (1986) and Sánchez-Azofeifa et al. (2005). According to this stricto sensu definition, Brazilian TDFs cover ca. 273,678 km2, and do not include most of the Caatinga biome which does not have a forest structure [Figure 1; Instituto Brasileiro de Geografia e Estatística (IBGE), 2012].
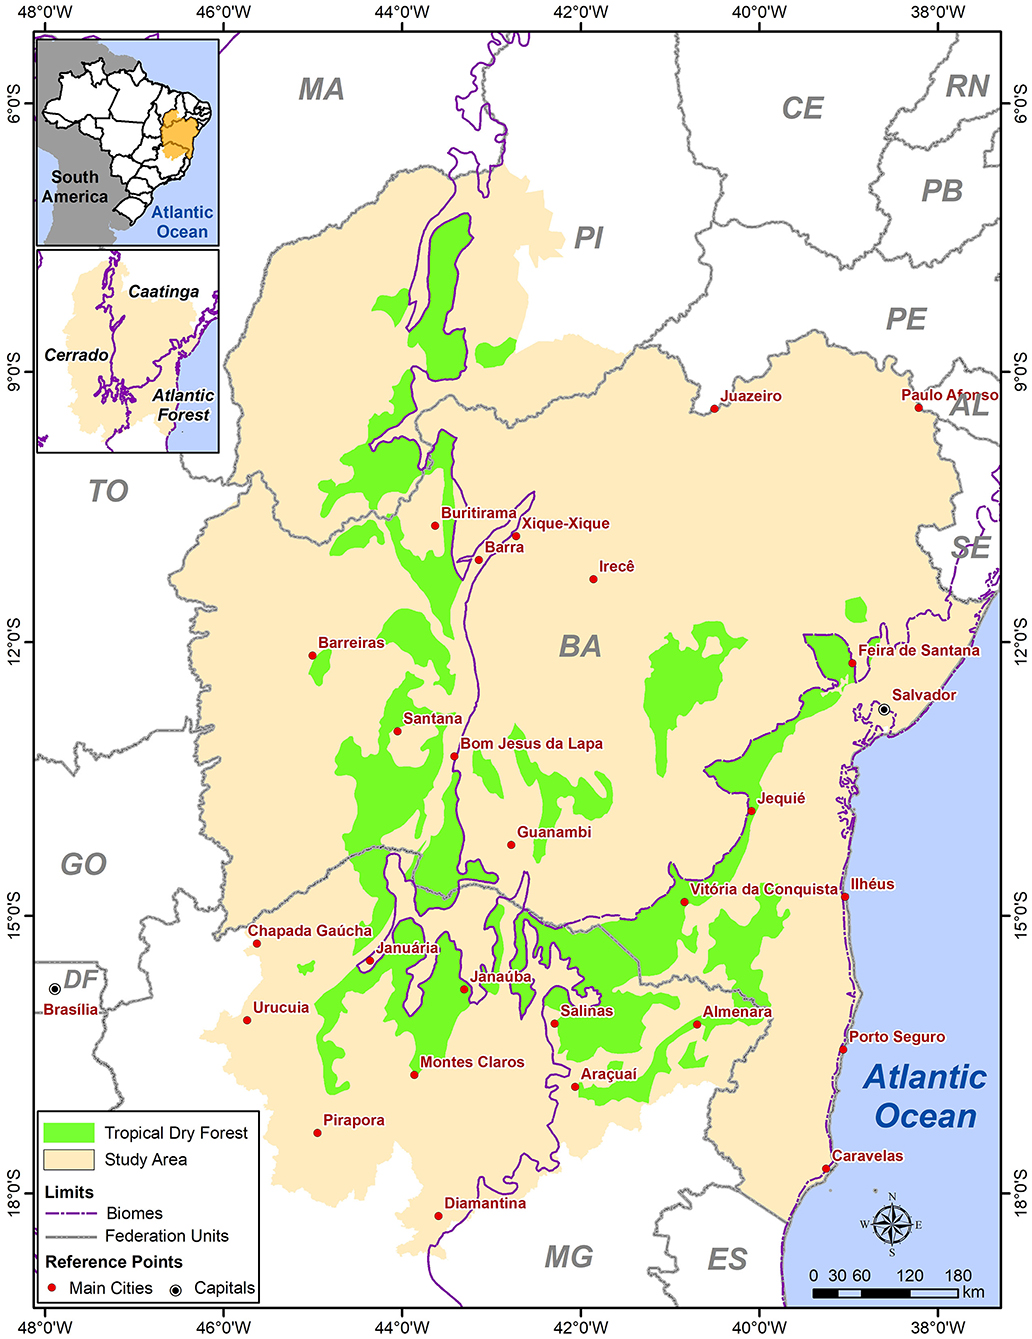
Figure 1. Distribution of tropical dry forests (TDFs) in the northeastern region of Brazil, as legally defined by the Brazilian Institute of Geography and Statistics (IBGE, Federal Decree 6660/2008) to the enforcement of the Atlantic Rain Forest law (see text for further details). Lines represent state (gray) and meso-region (black) limits.
Since 1993 TDFs are considered “associated ecosystems” to the Brazilian Atlantic Rain Forest (Federal Decree 750), due to their floristic similarity with coastal forests. In 2006, such status was ratified by the so-called Atlantic Rain Forest Law (Federal Law 11428), and a map with the distribution of legally protected TDFs (218,662 km2) was published (Federal Decree 6660) (Espírito-Santo et al., 2011; Muylaert et al., 2018), which we used in the present study (Figure 1). Thus, most TDFs are fully protected under the umbrella of the Atlantic Rain Forest, with much stronger restrictions on land clearing (only permitted for early successional stages or in cases of public utility or social interest) (Dupin et al., 2018). TDFs are distributed along three Brazilian biomes that cover the study region: Atlantic Rain Forest (18.3%), composed by coastal ecosystems ranging from mangroves to evergreen, tall closed-canopy forests; Caatinga, a semi-arid woodland composed mostly of thorny and deciduous plants (39.9%); and Cerrado, a savannic ecosystem characterized by a grass layer and fire-adapted shrubs and trees (41.8%). These states are composed by 10 meso-regions encompassing 619 counties, with a total population of 18 million inhabitants [Instituto Brasileiro de Geografia e Estatística (IBGE), 2016].
To determine the land cover changes in the study region, we obtained MODIS (Moderate Resolution Imaging Spectroradiometer, MOD13Q1) visible and infrared reflectance data at 250 m spatial resolution from January to December of 2007 and 2016. The select time frame refers to 10 years after the Atlantic Rain Forest law took effect (December 2006). Four MODIS tiles encompassing the whole study region were integrated to compose a single Raster product, a procedure that was repeated for each month for 2007 and 2016, coming to 24 mosaics (Supplementary Table 1). As an initial standardization process, these mosaics were reprojected from sinusoidal projection to 1984 World Geodetic System—WGS/World Mercator using the MODIS Reprojection Tool (available from http://lpdaac.usgs.gov/; Justice et al., 2002) and resampled to 250 m original spatial resolution (minimum mapping unit of 6.25 ha). In order to reduce the number of products applied in the classification scheme, monthly datasets were converted into seasonal averages. This step was fundamental for determining the periods in which the vegetation classes mainly recorded the best seasonal contrast. By such criterion, the summer (December–March) and winter (July–September) seasonal averages were employed to derive the majority of inputs used in the Decision Tree (see below).
We defined eight land cover classes: TDFs, other native vegetation types, urban areas, water, croplands, pastures/bare soil, burned areas, and ecotones (a transitional native vegetation type). Given the large extent of the study region and the fact that many of the land cover classes exhibited spatial variations in spectral responses, we decided to compartmentalize the study region into 10 control sub-regions based on spectral (red and near-infrared bands) and topographic criteria (Carvalho et al., 2006), in order to cope with the spatial-spectral variability inside the Decision Tree. For the specific purpose of region compartmentalization, we derived slope and elevation using the Digital Elevation Model—DEM from Shuttle Radar Topographic Mission—SRTM (1:250,000 scale).
We used the Decision Tree as the supervised classification method, in which a varied number of inputs can be employed to assign each pixel to the most adequate class through binary decisions (ENVI, 2004; Otukei and Blaschke, 2010). We assessed pixel changes from 2007 to 2016 to describe the large-scale patterns investigated at the county level. The red and near-infrared bands of the winter and summer mosaics were used in the classification, as well as the following derived vegetation indices: Normalized Difference Vegetation Index—NDVI (Rouse et al., 1973), Soil-Adjusted Vegetation Index—SAVI (Huete, 1988), and Normalized Difference Built-up Index—NDBI (Zha et al., 2003). The final classification was improved by visually checking confusing areas with digitized ground control points for all land cover types obtained from medium to high spatial resolution imagery (Landsat TM, OLI, and Google Earth products). Finally, we performed a ground-truth validation during March 2017 by visiting 23 different areas in the study region where classification was difficult. To assess the accuracy of our classification, we constructed an Error Matrix (Congalton and Green, 2008) comparing our validation points with our land cover map, which was used for the calculation of general (Overall Accuracy and Kappa Coefficient) and individual (User's Accuracy) validation metrics. Image processing and classification were conducted with ArcGIS 10.2.1, ENVI 5.3 and Google Earth 7.1.5.
In the present study, forest recovery was considered as both unassisted and assisted natural regeneration (i.e., secondary succession) and active restoration (i.e., full planting of native species) of TDFs in areas without this land cover class in a previous period. Thus, it represents gross gains in TDF cover during the studied period, henceforth “TDF area gained.” We considered deforestation as the change in land cover from the class “TDF” to all other classes, except other types of natural vegetation, including ecotones. In this sense, it indicated losses in TDF cover (henceforth “TDF area lost”). We did not consider forestry areas (plantations of exotic species such as Eucalyptus and Pinus) as forest recovery. These areas were included in the “croplands” class during the classification process, meaning that conversion of TDFs to forestry was computed as deforestation. Finally, we calculated the TDF net area change as the balance between deforestation (gross loss in area) and forest recovery (gross gain in area). Because of the large scale of the analysis and the resolution of MODIS imagery, we did not assess the ecological integrity of the mapped TDFs.
Using a map of the Brazil's administrative regions [Instituto Brasileiro de Geografia e Estatística (IBGE), 2010a] and the SRTM, we obtained the following variables per county: total area (km2), average slope (%) and average elevation a.s.l. (m). We also calculated the road density (m/m2) using the IBGE's transport system database [Instituto Brasileiro de Geografia e Estatística (IBGE), 2010b], and the humidity index using the IBGE's climatic map [Instituto Brasileiro de Geografia e Estatística (IBGE), 2002]. IBGE defined nine climate classes based on the number of dry months per year, ranging from semi-arid (−100) to super-humid (+100) (Supplementary Table 2). When the county area contained more than one climate class, we calculated a weighted average humidity index, considering the proportion of the county covered by each climate class. Socioeconomic parameters for each county were acquired from two different databases (demographic and agricultural) from IBGE's censuses. We used demographic censuses from 2000 and 2010 [Instituto Brasileiro de Geografia e Estatística (IBGE), 2010c] to obtain population density (individuals/km2). Finally, we used agricultural censuses from the IBGE to obtain the cattle herd density (heads per km2) per county in 2006 and 2016 [Instituto Brasileiro de Geografia e Estatística (IBGE), 2017b]. These variables were selected because they were considered as important drivers of LCC in previous studies that used counties as analytical units (e.g., Aide et al., 2013; Espírito-Santo et al., 2016; Dupin et al., 2018; Trigueiro et al., 2020).
We used demographic censuses from 2000 and 2010 [Instituto Brasileiro de Geografia e Estatística (IBGE), 2010c] to obtain the Gini Inequality Index. We also generated the disaggregated version of the Human Development Index (HDI-I) that considers only income [Programa das Nações Unidas para o Desenvolvimento (PNUD), 2015], as it reflects more directly the economic gains from the conversion of the TDFs at the county level (Espírito-Santo et al., 2016). The Gross Domestic Product (GDP in Brazilian reais; standardized for the year 2010) was extracted from the IBGE databases for 2006 and 2017 [Instituto Brasileiro de Geografia e Estatística (IBGE), 2017a].
LCC was assessed by calculating the total TDF area lost (deforestation) and gained (forest recovery), and the TDF net area change per county between 2007 and 2016 (three response variables). We included seven explanatory variables as potential factors associated with LCC: total county area, average slope, average elevation, road density, humidity index, and percentage variation in population and cattle density. To evaluate whether the LCC variables and their associated factors (except for county area, average slope, average elevation, and humidity index) differ between 2007 and 2016, paired t-tests based on permutations were used because the samples were temporally dependent. The spatial autocorrelation (SAC) was estimated using spatial filters (MEMs, Moran's eigenvector maps; Dray et al., 2006) that were selected progressively (Blanchet et al., 2008). For these analyses, we followed the R code proposed by Eisenlohr (2014). The same analyses were conducted for human welfare indicators (Gini Index, GDP, and HDI-I).
We used multiple linear regressions through generalized linear models (GLMs) to test the effects of the seven factors on the three LCC response variables. We built three complete GLM models with Gaussian error distribution, and the models for TDF area gained and lost were additionally adjusted for a log-link function (Crawley, 2012). The variance inflation factor (VIF) was used as measure of multicollinearity. We verified that there was no collinearity between the predictor variables (variance inflation factor <10; Quinn and Keough, 2002), which were all maintained in the complete models. The models were adjusted for orthogonal partitioning of variance (type III sum of squares), to verify the proportion of variance attributed to each explanatory variable regardless of their sequential order in the models (Crawley, 2012). None of the variables (either response or explanatory) was scaled for these analyses.
We tested our models for SAC of the residuals through minimal adequate GLMs using correlograms, with Moran's I coefficient as an indicator of SAC (obtained by package “pgirmess” in the R software; R Development Core Team, 2020). The minimal adequate models were submitted to residual analyses to verify the adequacy of the error distribution. The significance of SAC in the residuals was detected by the sequential Bonferroni criteria (Fortin and Dale, 2005). We found SAC in all the minimal adequate GLMs. To address SAC, we obtained spatial filters (MEMs; Dray et al., 2006) using the “adespatial” and “spacemakeR” packages in the R software. We performed a forward selection of spatial filters, following the double stopping and R2 adjusted criteria recommended by Blanchet et al. (2008). Finally, the best-fit model for each response variable was selected based on the minimum Akaike's information criterion adjusted for small sampled size (AICc) (Burnham and Anderson, 2002), using the function “dredge” in the package MuMin (R Development Core Team, 2020). We compared 231 competing models for each LCC response variable, including a null model with no explanatory variables. In these analyses, the best model has a ΔAICc value of 0, but all models with ΔAICc ≤2 have substantial support and may be considered equally plausible when the null model has an ΔAICc >2. However, alternative models that differ from the best model by one additional parameter with unchanging maximized log-likelihood should not be considered competitive (i.e., larger models with uninformative parameters) (Burnham and Anderson, 2002; Arnold, 2010). No significant SAC was detected for these models (see Supplementary Tables 3, 4; Supplementary Figures 1–3). The R code used for these analyses was modified from Eisenlohr (2014) and is available at https://github.com/pedroeisenlohr/variancepartition.
We evaluated the potential association of LCC variables with human welfare following the same procedure previously described for the analyses of potential factors associated with LCC. For this purpose, we calculated the percentage change per county in the Gini Index and HDI-I between 2000 and 2010, and in the GDP between 2006 and 2016. These parameters were inserted as response variables in separate GLMs, with three explanatory variables: TDF area gained, TDF area lost and TDF net area change per county. All three models were adjusted with a Gaussian error distribution. We tested the multicollinearity between the predictor variables and, after detecting a VIF >10, we removed TDF net area change from the complete models (Quinn and Keough, 2002). To address SAC, we obtained spatial filters (MEMs; Dray et al., 2006) using the “spatialreg” package in R, because one region has no neighbors at the 1 km threshold. This means that the general weights sum is zero for this region (see Borcard et al., 2011; Legendre and Legendre, 2012). Model selection for environmental and spatial variables and residual inspection for SAC were performed as described in the previous models, using the R code proposed by Eisenlohr (2014). No significant SAC was detected for these models (see Supplementary Table 5; Supplementary Figures 4–6).
The overall accuracy of the generated map was estimated to be 89.4%, with a Kappa coefficient of 86.8%. Accuracy varied among LCC classes, being 85% for tropical dry forests (Supplementary Table 6). We detected large changes in land cover during 10 years in the study region. From 2007 to 2016, TDF cover increased from 76,690 to 80,960 km2 (+5.57%), which was proportionally higher than the observed for other natural vegetation types (+1.62%) (Figure 2; Table 1). This positive net change resulted from a remarkable forest recovery of 19,018 km2 (24.8%), offsetting a large deforested area (14,748 km2; 19.2%). Practically all these cover changes were a consequence of TDF-pasture transitions: 18,459 km2 of pastures recovered to TDFs and 14,394 km2 of TDFs were converted to pastures (Table 1). Pasturelands cover a much larger area than croplands in the region, but decreased from 200,170 to 181,580 km2 (−9.2%) during the study period. On the other hand, croplands exhibited the greatest change from 2007 to 2016, increasing from 32,952 to 47,414 km2 (43.9%), mostly replacing other vegetation types and pasturelands, but affecting a very limited TDF area. Although a large area of other vegetation types was converted to pasturelands (68,809 km2; 11.2%), the relative impact of this LCC was higher for TDFs (18.9%) (Table 1).
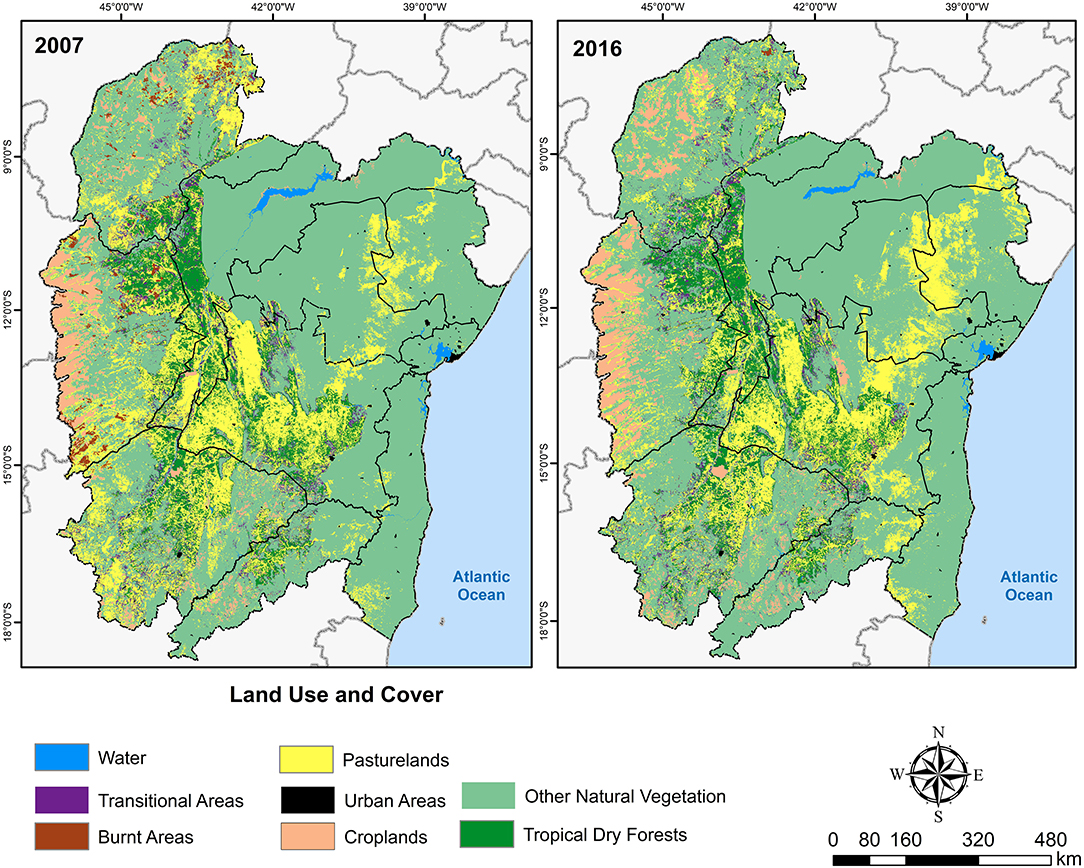
Figure 2. Land cover changes in the studied region from 2007 to 2016. Forestry was included in the Cropland class. Lines represent state (gray) and meso-region (black) limits.
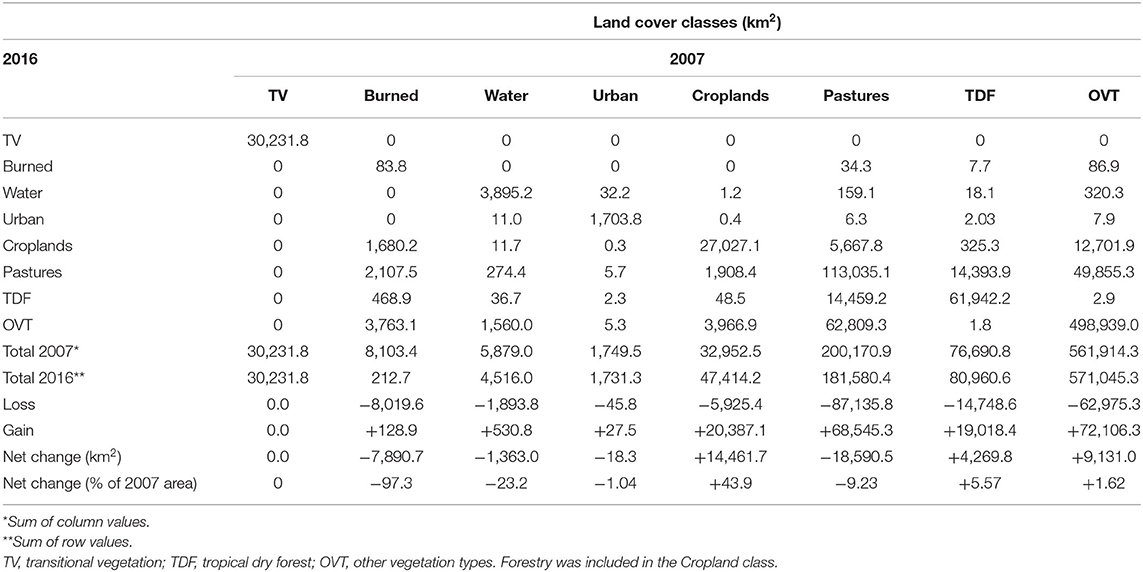
Table 1. Changes among land cover classes in the studied TDF region from 2007 to 2016.
TDFs were unevenly distributed across the 10 studied meso-regions. For the three coastal meso-regions (5, 6, and 9), TDF occurrence (as indicated in Figure 1) was very small and not detected in our mapping. TDFs were mostly concentrated in Central South and São Francisco Valley in Bahia state, and in the North of Minas Gerais state (Figure 1; Table 2). A positive TDF net area change was detected in six out of seven studied meso-regions, varying greatly from more than +1,650 km2 (Southern Piauí state) to only +24 km2 (Central-North Bahia state) (Table 2). In relative terms, the Southern Piauí state and the Center-West of Bahia exhibited the highest forest recovery, with TDF net gain of 97 and 76% higher than TDF loss. The only meso-region with net TDF loss was the north of Minas Gerais state (−229 km2). This pattern was reflected at the state level, with Minas Gerais being the only state with a negative TDF net area change (Supplementary Table 7).
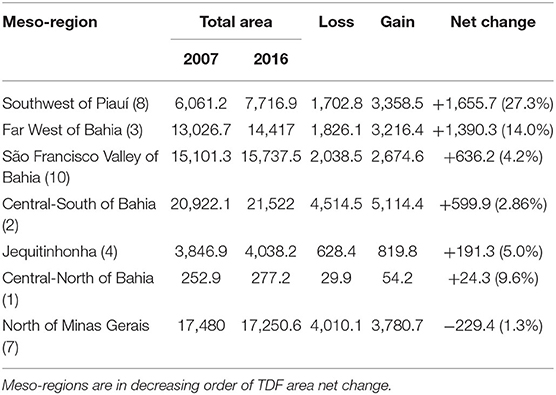
Table 2. Changes in the area (km2) of tropical dry forests per meso-region from 2007 to 2016.
In the whole studied region, 294 out of 619 counties presented TDFs either in 2007 or 2016. The number of counties with positive TDF net area change (196) was twice the number of counties with negative TDF net area change (98) (Figure 3). In average, the TDF area per county showed a slight but statistically significant increase (+0.5%) from 2007 to 2016 (Table 3). Temporal differences were also observed for the two potential socioeconomic factors associated with LCC: population density slightly increased and cattle density slightly decreased during the study period (Table 3).
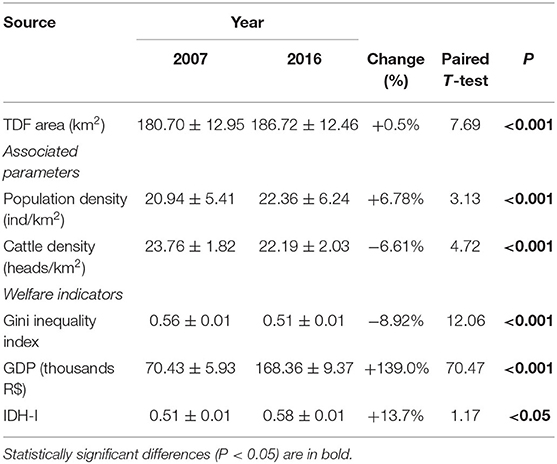
Table 3. Average tropical dry forest (TDF) area, factors associated with land cover change and welfare indicators for the years 2007 and 2016 per county (mean ± standard error).
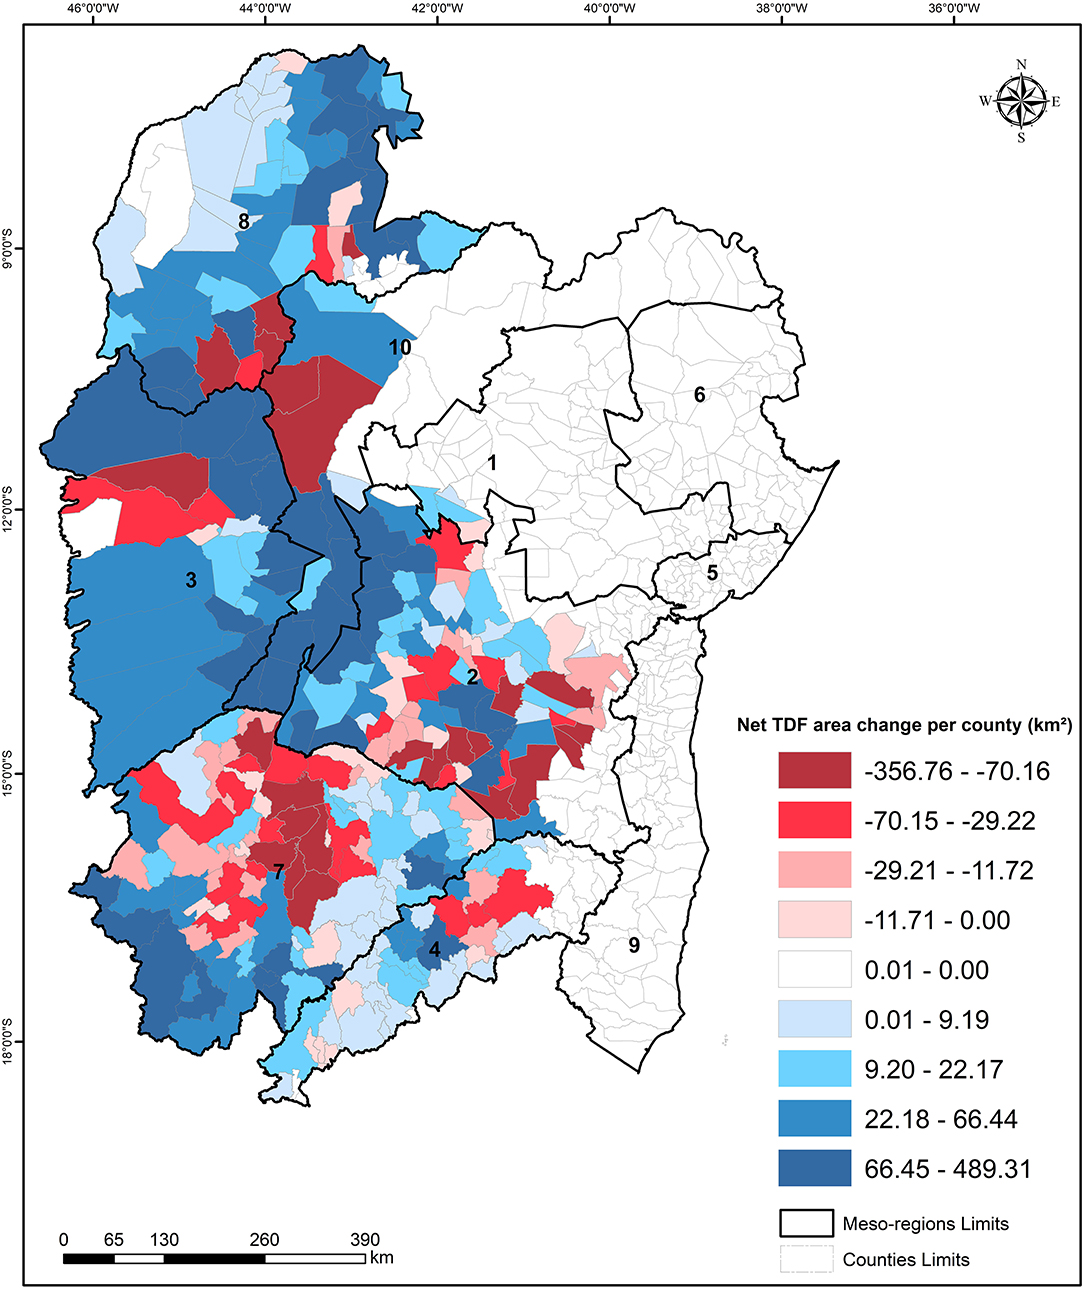
Figure 3. Net change in tropical dry forest (TDF) cover along the 619 counties in each of 10 meso-regions, encompassing three Brazilian states (Minas Gerais, Bahia and Piauí). 1 = Central-North of Bahia; 2 = Central-South of Bahia; 3 = Far West of Bahia; 4 = Jequitinhonha; 5 = Metropolitan Region of Salvador; 6 = Northeast of Bahia; 7 = North of Minas Gerais; 8 = Southwest of Piauí; 9 = South of Bahia; 10 = São-Francisco Valley of Bahia. The eight classes of net change, from net deforestation in red to net regeneration in blue, were defined based on four positive and negative quartiles for the 619 counties.
Our model selection indicated 10 models with ΔAICc ≤ 2 that explain the relationship between TDF recovery (area gained) per county and its potential associated factors in the study region. Our best-fit model (i.e., with the lowest ΔAICc; Supplementary Table 3) showed that three biophysical factors were significantly associated to TDF recovery: county area (positively), slope (negatively), and the humidity index (negatively) (Figure 4). These variables reduced the AIC of the null model from 1116.6 to 1032.8 (Supplementary Table 3). The remaining models were not considered because they contained additional uninformative parameters. Thus, forest recovery was higher in flat and more arid areas. The minimal adequate model had an adjusted R2 of 0.51, and each factor explained only a small proportion of the observed variance (Supplementary Table 4; Supplementary Figure 7). The same pattern was observed for the effects of county area and slope on deforestation (TDF area lost). In contrast, TDF loss was negatively associated to the increase in population density but not to the humidity index (Figure 5). In this case, only three models had ΔAICc ≤2, and the three explanatory variables of the best-fit model reduced the AIC of the null model from 1243.0 to 1205.3 (Supplementary Table 3). Alternative models were not considered competitive due to their lower weight. The minimal adequate model had an adjusted R2 of 0.50 (Supplementary Table 4). Finally, our model selection indicated 12 models with ΔAICc ≤2 that explain TDF net area change. The best-fit model showed that this variable was associated only to the humidity index (negatively; Figure 6), which reduced the AIC of the null model from 3471.3 to 3462.1 (Supplementary Table 3). The remaining models were not considered because they contained additional uninformative parameters. The minimal adequate model had an adjusted R2 of 0.58 (Supplementary Table 4).
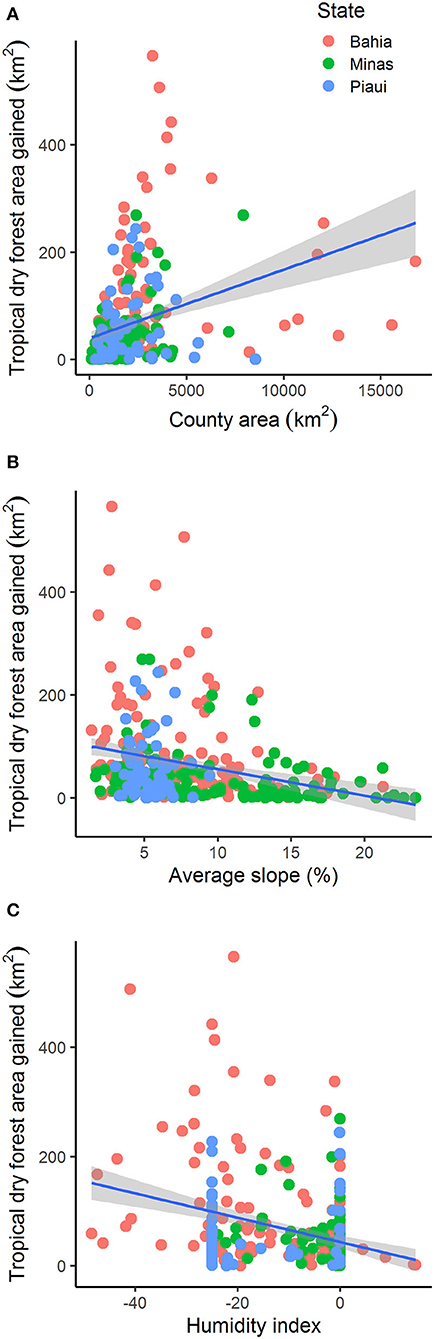
Figure 4. Effects of the (A) county area, (B) average slope, and (C) humidity index on tropical dry forest area gained (km2) at the county level for three Brazilian states. These explanatory variables were retained in the minimal adequate generalized linear model with a Gaussian error distribution (adjusted R2 = 0.51, p < 0.05) after stepwise model selection (n = 294). Circles represent values obtained after summation of raw residuals with the predict values for each variable, assuming average values for other covariates. Partial model parameters: (A) Y = log(2.693 + 0.0001*area), R2 = 0.109; (B) Y = log(3.969 – 0.081*slope), R2 = 0.011; (C) Y = log(3.103 – 0.021*humidity), R2 = 0.090. Additional parameters for complete and minimal adequate models are given in Supplementary Table 3.
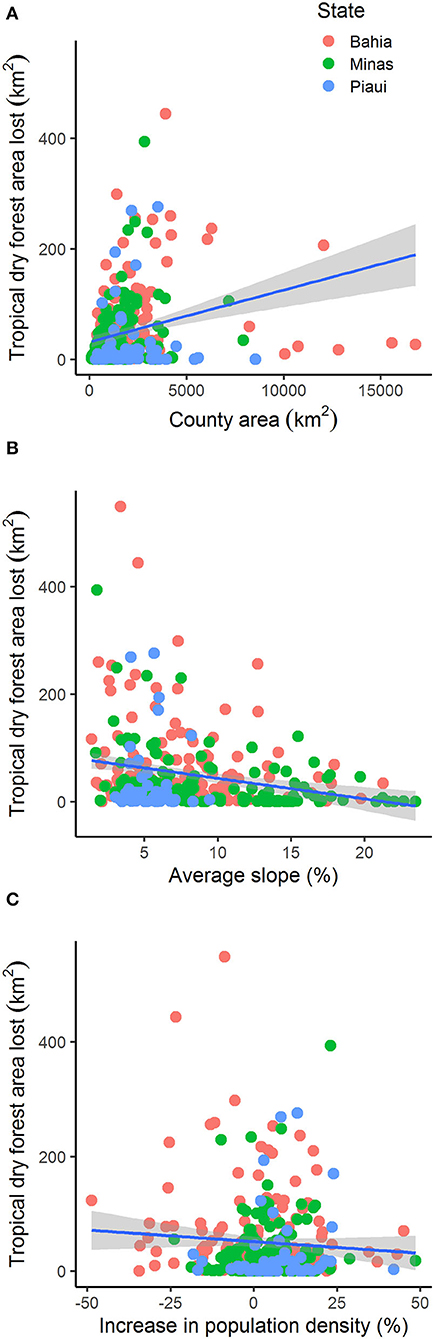
Figure 5. Effects of the (A) county area, (B) average slope, and (C) increase in population density (%) on tropical dry forest area lost (km2) at county level for three Brazilian states. These explanatory variables were retained in the minimal adequate generalized linear model with a Gaussian error distribution (adjusted R2 = 0.50, p < 0.05) after stepwise model selection (n = 294). Circles represent values obtained after summation of raw residuals with the predict values for each variable, assuming average values for other covariates. Partial model parameters: (A) Y = log(2.653 + 2.22E-05*area), R2 = 0.060; (B) Y = log(3.583 – 1.08E-01*slope), R2 = 0.021; (C) Y = log(2.753 – 1.65E-02*populational density), R2 = 0.011. Additional parameters for complete and minimal adequate models are given in Supplementary Table 3.
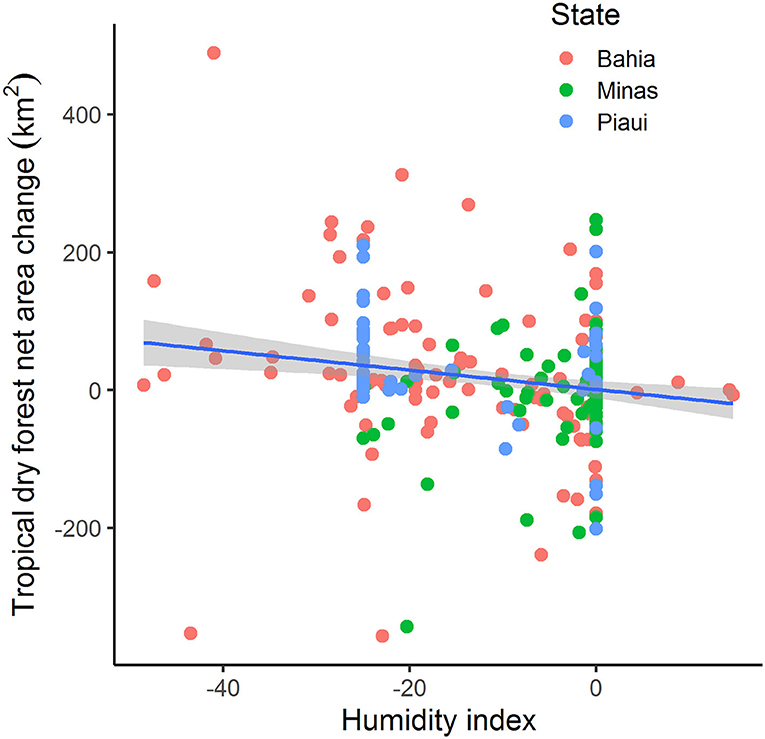
Figure 6. Effects of the humidity index on the net change in tropical dry forest (TDF) area for three Brazilian states. This was the only explanatory variable retained in the minimal adequate generalized linear model with a Gaussian error distribution (adjusted R2 = 0.50, p < 0.05) after stepwise model selection (n = 294). Positive values indicate net area gain (natural regeneration) whereas negative values indicate net area loss (deforestation) at county level between 2007 and 2016. Circles represent values obtained after summation of raw residuals with the predict values for each variable, assuming average values for other covariates. Partial model parameters: Y = 3.468 – 1.146*humidity, R2 = 0.027). Additional parameters for complete and minimal adequate models are given in Supplementary Table 3.
The human welfare indicators considered in the present study changed significantly from 2007 to 2016, reflecting improvements in socioeconomic conditions in all three states (Table 3; Supplementary Table 7). The GDP showed the greatest change (+139% in average) in 10 years, increasing in all counties but one. The HDI-I increased 13.7% (in all counties but two) and the Gini inequality index decreased 8.92% (Table 3). For the latter, variation per county was more pronounced: 13 counties had no change in the Gini inequality index, whereas 61 showed an increase in this indicator. Human welfare indicators were not associated with TDF area gained or lost (Supplementary Table 5).
Tropical dry forests in the studied region experienced very dynamic land cover changes from 2007 to 2016, with 33,766 km2 (23.5% of the original extent considered here) under some type of transition among land cover classes. Deforestation was unexpectedly high, considering that TDFs are fully protected by the Atlantic Rain Forest law. However, such loss was offset by an impressive extent of forest recovery, although we could not assess the ecological integrity of recovered areas (e.g., if deforestation of old-growth forests was offset by the recovery of early-successional forests). Despite that, our results highlight the importance of this process to the maintenance of forest cover and associated ecosystem services (e.g., water provision, soil fertility, carbon sequestration, climate regulation and pollination, among others). We observed meso-regional differences in LCC, and the main factors associated to deforestation and forest recovery at the county level were county area, slope, humidity, and population density. Although these results are important to inform policy-makers on developing conservation strategies to Brazilian TDFs, the trends detected in the present study should be confirmed by multiple time-steps and updated frequently to reveal detailed LCC dynamics.
The vast majority of TDF recovery in the study region occurred in pastures used predominantly for cattle raising, reinforcing that this economic activity deserves special attention for the design of restoration policies (Strassburg et al., 2014; Latawiec et al., 2015; Poore, 2016; Xie et al., 2020). This observed TDF regrowth can be the result of (i) passive or active restoration to conform to the Brazilian Native Vegetation Protection Law (Federal Law 12727/2012); (ii) management practices such as pasture rotation and (iii) land abandonment for socioeconomic reasons. In the first case, the mentioned law indicates that every rural private property must preserve at least 20% of its total area as a “legal reserve” in the Atlantic Rain Forest (Brancalion et al., 2016). Although this restriction existed for decades, it was barely enforced in most regions, leading to a huge deficit in legal reserves in this biome (Soares-Filho et al., 2014; Freitas et al., 2017). Compliance to legal reserve requirements would demand the restoration of 5.17 million hectares (Soares-Filho et al., 2014) and, although the first steps toward this goal are ongoing (i.e., formally delimiting and registering areas to be permanently assigned as legal reserves in each property in a standardized database—the Rural Environmental Registry System—CAR in Portuguese; Brancalion et al., 2016; Oakleaf et al., 2017), actual TDF restoration initiatives are still limited. Recent reviews indicate a large knowledge gap on TDF restoration in Brazil, given that only 4–5% of the studies on this subject were conducted in this ecosystem (Gardon et al., 2020; Guerra et al., 2020).
In the second case, it is possible that some extent of short-term TDF recovery is related to pasture rotation. The Atlantic Rain Forest law prohibits the clearing of any TDF (i.e., the areas indicated in Figure 1) except those in early successional stages. Indeed, the Brazilian government has established technical criteria to differentiate TDF successional stages based on species composition, forest structure, plant life forms, and even the amount of litterfall [e.g., CONAMA Resolution #392 for Minas Gerais state; Ministério do Meio Ambiente (MMA), 2007]. For example, TDFs with an average diameter at breast height (DBH) higher than 8 cm can be considered as intermediate successional forests and thus become fully protected under the Atlantic Rain Forest law. As a consequence, it is likely that farmers in this region would prevent TDFs to regrow, or adopt short rotation intervals to keep the forest at a very early successional stage and avoid being prohibited to clear fallow areas to establish new pasturelands. Because our study period encompasses only 9 years (2007–2016), it is possible that regenerated areas result from a rotational system for pasture management with a short fallow period of natural regeneration. However, long-term TDF recovery is less likely in this case because of possible legal restrictions on the future use of regrowing areas. Thus, further studies are needed to evaluate the persistence of recovered TDFs in the landscape.
In this way, it is reasonable to assume that most TDF recovery in northeastern Brazil during the study period is unlikely related to active willingness to restore. Instead, TDF regrowth probably occurred after land abandonment for socioeconomic and/or biophysical reasons, and also as a consequence of management practices (i.e., pasture rotation). In the northeastern region of Brazil, which encompasses most of our study, estimates indicate that approximately 73% of the pasturelands are degraded and prone to abandonment (Dias-Filho, 2014). Indeed, our LCC analyses demonstrated that pasture area decreased 10% from 2007 to 2016 (see Table 1), which can reflect either land abandonment or an intensification of cattle raising (i.e., an increase in the number of animals per hectare). However, the total size of the cattle herd in the study region decreased 11.2%, from 7.2 to 6.4 million heads [Instituto Brasileiro de Geografia e Estatística (IBGE), 2017b], suggesting that economic factors are causing land abandonment thus opening space for natural regeneration. This reduction was probably intensified by the prolonged drought that occurred in the northeastern region from 2011 to 2016 (Mariano et al., 2018), causing land abandonment and/or the replacement of cattle by goats, which are more resistant to the semi-arid conditions and demand less pasture area per head (Carvalho et al., 2005; Sousa-Júnior et al., 2008).
Such changing economic scenario can create opportunities for large-scale restoration programs based on natural regeneration. According to Dias-Filho (2014), the recovery of 25% of degraded pastures in Brazil would be enough to sustain current cattle raising levels, with the remaining area being released for other purposes. If we consider that 73% of the pasture area in our study region is degraded (=132,553 km2), we can estimate that 99,415 km2 would be available for restoration initiatives. However, it is important to highlight that, despite the importance of forest recovery (either through natural regeneration or planting) to the potential reestablishment of biodiversity and ecosystem services (Melo et al., 2013; Crouzeilles et al., 2017), secondary forests are usually functionally different from old-growth forests (Espírito-Santo et al., 2014; Crouzeilles et al., 2017; Rozendaal et al., 2019). Indeed, the speed of natural regeneration in abandoned areas and the ecological integrity of the resulting secondary forests depends on the proportion of old-growth forests at the landscape level (Chazdon et al., 2009; Jakovac et al., 2015; Rozendaal et al., 2019). Thus, environmental policies that stimulate forest recovery should be coupled to strategies to avoid further clearing and degradation of old-growth forests.
At the county level, we observed that deforestation and forest recovery are mainly associated to the county area and slope. However, deforestation was additionally associated to changes in population density, whereas forest recovery was associated to the humidity index. These results partially corroborate other studies that used the same approach at different spatial scales (Aide et al., 2013; Espírito-Santo et al., 2016; Dupin et al., 2018; Crouzeilles et al., 2020; Trigueiro et al., 2020). The positive relationship between both TDF area gained and lost with county area and slope indicates that large, flat counties have very dynamic LCC, a pattern already reported for TDFs in the north of Minas Gerais (Dupin et al., 2018). It is likely that large counties also possessed greater extent of TDFs and abandoned pastures in 2007, making them prone to further deforestation and forest recovery. Indeed, the previous existence of vegetation remnants (Aide et al., 2013; Trigueiro et al., 2020) and the county forest proportion (Crouzeilles et al., 2020) are important drivers of forest recovery, which is strongly influenced by the distance to forest edges (Jakovac et al., 2015; Rozendaal et al., 2019). The negative relationship observed between deforestation and slope is common, indicating that flat areas are preferred for cattle raising because mechanization is facilitated (Jasinski et al., 2005; Aide et al., 2013; Espírito-Santo et al., 2016; Dupin et al., 2018; Trigueiro et al., 2020). Thus, it is likely that flat counties also have larger areas of abandoned pastures prone to forest recovery.
TDF area lost was slightly higher in counties with a decrease in population density during the studied period, but no relationship was observed with TDF area gained or net area change. The effects of demographic variables on LCC reported in studies using counties as analytical unit have been inconsistent. Although no influence of population density was described for the Brazilian Cerrado (Espírito-Santo et al., 2016; Trigueiro et al., 2020) and the Atlantic Rain Forest (Crouzeilles et al., 2020), a negative effect of population increase on forest recovery was detected for TDFs in the north of Minas Gerais state (Dupin et al., 2018). In their study for all Latin America and the Caribbean, Aide et al. (2013) found a negative effect of population density on forest recovery, but only for counties with more than 50% of forest cover in the beginning of the study period. These authors also found that low population counties, which were in the beginning of the colonization process, had higher rates of deforestation, whereas densely populated counties had already been deforested, exhibiting high forest recovery rates.
The humidity index was negatively associated to both TDF area gained and net area change, indicating that arid counties had higher forest recovery. This is an important finding because some studies on the definition of priority areas for restoration programs suggested that active restoration may be more appropriated in regions with low precipitation levels (Crouzeilles et al., 2017, 2019a, but see Holl and Aide, 2011), where natural regeneration is too slow or not very successful (Chazdon and Guariguata, 2016; Poorter et al., 2016). It is possible that, in more arid counties, the frequency of land abandonment is higher, a pattern already reported in other studies in northeastern Brazil (Redo et al., 2013; Sampaio et al., 2017). Nevertheless, the remote sensing techniques used here only indicate structural vegetation recovery, and other parameters related to biodiversity and ecosystem functioning are necessary to determine the potential of forest recovery in low humidity TDF areas. Studies using high resolution images (García-Millán et al., 2014; Almeida et al., 2020) to discriminate between TDF successional stages are also important, as the causes of deforestation may differ from early to old-growth forests.
It important to highlight that, in general, our models explained 50–60% of the total variance in LCC variables, suggesting that other biophysical and socioeconomic factors need further investigation. Alternatively, it is possible that the limited predictive power of the models was caused by the observed spatial variation on the effects of each factor. We found that most factors were differently associated to TDF area gained, lost and net area change in Minas Gerais, Bahia and Piauí (Supplementary Figures 8–10). Indeed, such spatially structured effect of factors associated to LCC have already been reported in large scales studies encompassing several contrasting regions (e.g., Aide et al., 2013; Trigueiro et al., 2020). These findings reinforce the importance of analyzing causes of LCC, preferably using high-resolution imagery and multiple time-steps, to develop environmental and development policies finely adjusted to different counties and regions in Brazil.
The temporal variation in welfare indicators was not associated with LCC at the county level in the study region, suggesting that the relationship between deforestation and socioeconomic development is complex and deserves further investigation. The developmentalist association between deforestation and well-being is usually based on the Kuznets environmental curve, which illustrate an increasing environmental degradation in the first stages of development, when per capita income also increases until a turning point is reached (Bhattarai and Hammig, 2004). After that, usually the dependence on the primary sector (e.g., agriculture, mining) decreases with industrialization (as predicted by the forest transition theory), and human welfare would continue to improve with decreasing degradation and even regeneration of natural ecosystems (Barbier et al., 2017). Although the study region experienced an improvement in all evaluated welfare indicators and an increase in TDF area, the lack of association between these variables at the county level do not support the conclusion that Brazilian TDFs are in a steady, consistent transition. Thus, the establishment of alternative development policies based on sustainable practices and social justice are still necessary.
Our results provide valuable basic information on the factors associated to land cover change in Brazilian TDFs, which can help supporting the design of environmental and development policies aimed at reducing deforestation and maximizing forest recovery. Further studies with fine spatial and temporal resolution need to focus on the reversibility (see Schwartz et al., 2020) and ecological integrity of regenerated areas in order to assess their potential to provide long-term ecosystem services. Such approach would also allow to more precisely determine the causal relations between biophysical and socioeconomic factors and LCC at the county level and their spatial structure at larger scales (e.g., the state level), which is important to adjust restoration strategies to different regional political scenarios. In TDF regions, large, flat and more arid counties with very dynamic LCC deserve special attention. Given that TDF-pasture transitions vastly dominate LCC in the studied region (and also other vegetation types in Brazil), environment-friendly practices are urgently needed to avoid soil exhaustion and optimize cattle raising efficiency. Such goal can be achieved in regional planning programs through sustainable intensification in high productivity areas and TDF restoration in marginal agricultural lands with low opportunity costs (Latawiec et al., 2015). Although TDFs are mostly neglected in restoration programs compared to wet forests, the net forest recovery observed in the present study was expressive (427,106 ha) and provides a significant contribution to Brazil's commitment under the Bonn agreement (3.6% of 12 million ha by 2030) and the Atlantic Rain Forest pact (42.7% of 1 million ha by 2020) (Crouzeilles et al., 2019b). Considering that the total TDF recovery in 10 years was 1,901,800 ha, most of these goals would be achieved with efficient enforcement of current environmental laws and clear policies for passive restoration.
The raw data supporting the conclusions of this article will be made available by the authors, without undue reservation.
ME-S, GS-A, ML, and AR conceptualized the article. ML, AR, and LS obtained and processed satellite imagery. AR, ME-S, and LS organized the database. JS and ME-S analyzed the data. All authors contributed to data acquisition, data interpretation, manuscript revision, read and approved the submitted version, and wrote sections of the manuscript.
This work was carried out with the aid of grants from Inter-American Institute for Global Change Research (IAI-CRN 3025) and Fundacão de Amparo à Pesquisa de Minas Gerais (FAPEMIG PPM-00726-16). Coordenação de Aperfeiçoamento de Pessoal de Nível Superior (CAPES 88881.337120/2019-01) and the Conselho Nacional de Desenvolvimento Científico e Tecnológico (CNPq 308471/2017-2) provided research scholarships to ME-S.
The authors declare that the research was conducted in the absence of any commercial or financial relationships that could be construed as a potential conflict of interest.
The handling editor declared a past co-authorship with one of the authors ME-S.
The Supplementary Material for this article can be found online at: https://www.frontiersin.org/articles/10.3389/ffgc.2020.569184/full#supplementary-material
Aide, T. M., Clark, M. L., Grau, H. R., López-Carr, D., Levy, M. A., Redo, D., et al. (2013). Deforestation and reforestation of Latin America and the Caribbean (2001-2010). Biotropica 45, 262–271. doi: 10.1111/j.1744-7429.2012.00908.x
Almeida, D. R. A., Almeyda Zambrano, A. M., Broadbent, E. N., Wendt, A. L., Foster, P., Wilkinson, B. E., et al. (2020). Detecting successional changes in tropical forest structure using GatorEye drone-borne lidar. Biotropica. 52, 1156–1168. doi: 10.1111/btp.12814
Armenteras, D., Espelta, J. M., Rodríguez, N., and Retana, J. (2017). Deforestation dynamics and drivers in different forest types in Latin America: three decades of studies (1980–2010). Glob. Environ. Chang. 46, 139–147. doi: 10.1016/j.gloenvcha.2017.09.002
Arnold, T. W. (2010). Uninformative parameters and model selection using Akaike's information criterion. J. Wildl. Manage. 74, 1175–1178. doi: 10.1111/j.1937-2817.2010.tb01236.x
Barbier, E. B., Delacote, P., and Wolfersberger, J. (2017). The economic analysis of the forest transition: a review. J. For. Econ. 27, 10–17. doi: 10.1016/j.jfe.2017.02.003
Barlow, J., Berenguer, E., Carmenta, R., and França, F. (2020). Clarifying Amazonia's burning crisis. Glob. Chang. Biol. 26, 319–321. doi: 10.1111/gcb.14872
Barona, E., Ramankutty, N., Hyman, G., and Coomes, O. T. (2010). The role of pasture and soybean in deforestation of the Brazilian Amazon. Environ. Res. Lett. 5:024002. doi: 10.1088/1748-9326/5/2/024002
Beuchle, R., Grecchi, R. C., Shimabukuro, Y. E., Seliger, R., Eva, H. D., Sano, E., et al. (2015). Land cover changes in the Brazilian Cerrado and Caatinga biomes from 1990 to 2010 based on a systematic remote sensing sampling approach. Appl. Geogr. 58, 116–127. doi: 10.1016/j.apgeog.2015.01.017
Bhattarai, M., and Hammig, M. (2004). Governance, economic policy, and the environmental Kuznets curve for natural tropical forests. Environ. Dev. Econ. 9, 367–382. doi: 10.1017/S1355770X03001293
Blackie, R., Baldauf, C., Gautier, D., Gumbo, D., Kassa, H., Parthasarathy, N., et al. (2014). Tropical dry forests: the state of global knowledge and recommendations for future research. Cifor 2:38. doi: 10.17528/cifor/004408
Blanchet, G., Legendre, P., and Borcard, D. (2008). Forward selection of spatial explanatory variables. Ecology 89, 2623–2632. doi: 10.1890/07-0986.1
Bonilla-Moheno, M., and Aide, T. M. (2020). Beyond deforestation: land cover transitions in Mexico. Agric. Syst. 178, 102734. doi: 10.1016/j.agsy.2019.102734
Brancalion, P. H. S., Garcia, L. C., Loyola, R., Rodrigues, R. R., Pillar, V. D., and Lewinsohn, T. M. (2016). A critical analysis of the native vegetation protection law of Brazil (2012): updates and ongoing initiatives. Nat. e Conserv. 14, 1–15. doi: 10.1016/j.ncon.2016.03.003
Burnham, K. P., and Anderson, D. R. (2002). Model Selection and Multimodel Inference: A Practical Information Theoretic Approach. New York, NY: Springer.
Carvalho, l. M. T., Scolforo, J. R., Oliveira, A. D., Mello, J. M., Oliveira, l. T., Acerbi Júnior, F. W., et al. (2006). “Procedimentos para mapeamento” in Mapeamento e Inventário da Flora e dos Reflorestamentos de Minas Gerais, eds J. R. Scolforo and l. M. T. Carvalho (Lavras: Editora UFLA), 37–57.
Carvalho, P. C. F., Santos, D. T., Barbosa, C. M. P., Lubisco, D. S., and Lang, C. R. (2005). Otimizando o Uso da Pastagem pela Integração de Ovinos e Bovinos. Available online at: https://www.ufrgs.br/agronomia/materiais/otimizando%20o%20uso%20da%20pastagem%20pela%20integracao%20de%20ovinos%20e%20bovinos.pdf (accessed May 27, 2020).
Catterall, C., and Harrison, D. A. (2006). Rainforest Restoration Activities in Australia's Tropics and Subtropics. Cairns, QLD: Cooperative Research Centre for Tropical Rainforest Ecology and Management.
Chazdon, R. L., and Guariguata, M. R. (2016). Natural regeneration as a tool for large-scale forest restoration in the tropics: prospects and challenges. Biotropica 48, 716–730. doi: 10.1111/btp.12381
Chazdon, R. L., Peres, C. A., Dent, D., Sheil, D., Lugo, A. E., Lamb, D., et al. (2009). The potential for species conservation in tropical secondary forests. Conserv. Biol. 23, 1406–1417 doi: 10.1111/j.1523-1739.2009.01338.x
Congalton, R. G., and Green, K. (2008). Assessing the Accuracy of Remotely Sensed Data: Principles and Practice. New York, NY: Taylor and Francis.
Crouzeilles, R., Barros, F. S. M., Molin, P. G., Ferreira, M. S., Junqueira, A. B., Chazdon, R. L., et al. (2019a). A new approach to map landscape variation in forest restoration success in tropical and temperate forest biomes. J. Appl. Ecol. 56, 2675–2686. doi: 10.1111/1365-2664.13501
Crouzeilles, R., Beyer, H. L., Monteiro, L. M., Feltran-Barbieri, R., Pessôa, A. C. M., Barros, F. S. M., et al. (2020). Achieving cost-effective landscape-scale forest restoration through targeted natural regeneration. Conserv. Lett. 13:e12709. doi: 10.1111/conl.12709
Crouzeilles, R., Ferreira, M. S., Chazdon, R. L., Lindenmayer, D. B., Sansevero, J. B. B., Monteiro, L., et al. (2017). Ecological restoration success is higher for natural regeneration than for active restoration in tropical forests. Sci. Adv. 3:e1701345. doi: 10.1126/sciadv.1701345
Crouzeilles, R., Santiami, E., Rosa, M., Pugliese, L., Brancalion, P. H. S., Rodrigues, R. R., et al. (2019b). There is hope for achieving ambitious Atlantic Forest restoration commitments. Perspect. Ecol. Conserv. 17, 80–83. doi: 10.1016/j.pecon.2019.04.003
Curtis, P. G., Slay, C. M., Harris, N. L., Tyukavina, A., and Hansen, M. C. (2018). Classifying drivers of global forest loss. Science 361, 1108–1111.doi: 10.1126/science.aau3445
Díaz, G. I., Nahuelhual, L., Echeverría, C., and Marín, S. (2011). Drivers of land abandonment in Southern Chile and implications for landscape planning. Landsc. Urban Plan. 99, 207–217. doi: 10.1016/j.landurbplan.2010.11.005
Dray, S., Legendre, P., and Peres-Neto, P. R. (2006). Spatial modelling: a comprehensive framework for principal coordinate analysis of neighbour matrices (PCNM). Ecol. Modell. 196, 483–493. doi: 10.1016/j.ecolmodel.2006.02.015
Dupin, M. G. V., Espírito-Santo, M. M., Leite, M. E., Silva, J. O., Rocha, A. M., Barbosa, R. S., et al. (2018). Land use policies and deforestation in Brazilian tropical dry forests between 2000 and 2015. Environ. Res. Lett. 13:035008. doi: 10.1088/1748-9326/aaadea
Eisenlohr, P. V. (2014). Persisting challenges in multiple models: a note on commonly unnoticed issues regarding collinearity and spatial structure of ecological data. Braz. J. Bot. 37, 365–371. doi: 10.1007/s40415-014-0064-3
ENVI (2004). ENVI 4.1. User's Guide. Available online at: http://aviris.gl.fcen.uba.ar/Curso_SR/biblio_sr/ENVI_userguid.pdf (accessed June 15, 2016).
Escobar, H. (2020). Deforestation in the Brazilian Amazon is still rising sharply. Science 369:613. doi: 10.1126/science.369.6504.613
Espírito-Santo, M. M., Fernandes, G. W., Barbosa, R. S., and Anaya, F. C. (2011). Mata seca é mata atlântica? Ciênc. Hoje 288, 74–76. Available online at: https://periodicos.ufpb.br/index.php/rcpa/article/view/42731
Espírito-Santo, M. M., Leite, M. E., Silva, H. O., Barbosa, R. S., Rocha, A. M., Anaya, F. C., et al. (2016). Understanding patterns of land-cover change in the Brazilian Cerrado from 2000 to 2015. Philos. Trans. R. Soc. B Biol. Sci. 371:20150435. doi: 10.1098/rstb.2015.0435
Espírito-Santo, M. M., Olívio-Leite, L., Neves, F. S., Nunes, Y. R. F., Borges, M. A. Z., Falcão, L. A. D., et al. (2014). “Tropical dry forests of Northern Minas Gerais, Brazil: diversity, conservation status and natural regeneration”, in Tropical Dry Forests in the Americas: Ecology, Conservation, and Management, eds G. A. Sánchez-Azofeifa, J. S. Powers, G. W. Fernandes, and M. Quesada (Boca Raton, FL: CRC), 69–82.
Fortin, M. J., and Dale, M. R. T. (2005). Spatial Analysis: A Guide for Ecologists. Cambridge: Cambridge University Press.
Freitas, F. L. M., de Sparovek, G., Mörtberg, U., Silveira, S., Klug, I., and Berndes, G. (2017). Offsetting legal deficits of native vegetation among Brazilian landholders: effects on nature protection and socioeconomic development. Land Use Policy 68, 189–199. doi: 10.1016/j.landusepol.2017.07.014
García-Millán, V. E., Sánchez-Azofeifa, A., Málvarez García, G. C., and Rivard, B. (2014). Quantifying tropical dry forest succession in the Americas using CHRIS/PROBA. Remote Sens. Environ. 144, 120–136. doi: 10.1016/j.rse.2014.01.010
Gardon, F. R., Santos, R. F., and Rodrigues, R. R. (2020). Brazil's forest restoration, biomass and carbon stocks: a critical review of the knowledge gaps. For. Ecol. Manage. 462:117972. doi: 10.1016/j.foreco.2020.117972
Grinand, C., Rakotomalala, F., Gond, V., Vaudry, R., Bernoux, M., and Vieilledent, G. (2013). Estimating deforestation in tropical humid and dry forests in Madagascar from 2000 to 2010 using multi-date Landsat satellite images and the random forests classifier. Remote Sens. Environ. 139, 68–80. doi: 10.1016/j.rse.2013.07.008
Guerra, A., Reis, L. K., Borges, F. L. G., Ojeda, P. T. A., Pineda, D. A. M., Miranda, C. O., et al. (2020). Ecological restoration in Brazilian biomes: identifying advances and gaps. For. Ecol. Manage. 458:117802. doi: 10.1016/j.foreco.2019.117802
Holl, K. D., and Aide, T. M. (2011). When and where to actively restore ecosystems? For. Ecol. Manage. 261, 1558–1563. doi: 10.1016/j.foreco.2010.07.004
Huete, A. R. (1988). A soil-adjusted vegetation index (SAVI). Remote Sens. Environ. 25, 295–309. doi: 10.1016/0034-4257(88)90106-X
Instituto Brasileiro de Geografia e Estatística (IBGE) (2002). Mapa de Clima do Brasil. Rio de Janeiro: Fundação Instituto Brasileiro de Geografia e Estatística.
Instituto Brasileiro de Geografia e Estatística (IBGE) (2010a). Mapas Municipais do Brasil. Rio de Janeiro: Fundação Instituto Brasileiro de Geografia e Estatística.
Instituto Brasileiro de Geografia e Estatística (IBGE) (2010b). BCIM-Sistema de Transportes. Rio de Janeiro: Fundação Instituto Brasileiro de Geografia e Estatística.
Instituto Brasileiro de Geografia e Estatística (IBGE) (2010c). Censo Demográfico. Rio de Janeiro: Fundação Instituto Brasileiro de Geografia e Estatística.
Instituto Brasileiro de Geografia e Estatística (IBGE) (2012). Manual Técnico da Vegetação Brasileira. 2nd Edn. Brasília: Ministério do Planejamento, Orçamento e Gestão.
Instituto Brasileiro de Geografia e Estatística (IBGE) (2016). Estimativa da População Brasileira. Rio de Janeiro: Fundação Instituto Brasileiro de Geografia e Estatística.
Instituto Brasileiro de Geografia e Estatística (IBGE) (2017a). Produto Interno Bruto Municipal, 1999 a 2012. Rio de Janeiro: Fundação Instituto Brasileiro de Geografia e Estatística.
Instituto Brasileiro de Geografia e Estatística (IBGE) (2017b). Produção Agrícola, Pecuária, Extração Vegetal e Silvicultura. Rio de Janeiro: Fundação Instituto Brasileiro de Geografia e Estatística.
IPBES (2019). Global Assessment Report on Biodiversity and Ecosystem Services of the Intergovernmental Science-Policy Platform on Biodiversity and Ecosystem Services. Bonn: IPBES Secretariat.
Jakovac, C. C., Bongers, F., Kuyper, T. W., Mesquita, R. C. G., and Peña-Claros, M. (2016). Land use as a filter for species composition in Amazonian secondary forests. J. Veg. Sci. 27, 1104–1116. doi: 10.1111/jvs.12457
Jakovac, C. C., Peña-Claros, M., Kuyper, T. W., and Bongers, F. (2015). Loss of secondary-forest resilience by land-use intensification in the Amazon. J. Ecol. 103, 67–77. doi: 10.1111/1365-2745.12298
Jasinski, E., Morton, D., deFries, R., Shimabukuro, Y., Anderson, L., and Hansen, M. (2005). Physical landscape correlates of the expansion of mechanized agriculture in Mato Grosso, Brazil. Earth Interact. 9, 1–18. doi: 10.1175/EI143.1
Justice, C. O., Townshend, J. R. G., Vermote, E. F., Masuoka, E., Wolfe, R. E., Saleous, N., et al. (2002). An overview of MODIS Land data processing and product status. Remote Sens. Environ. 83, 3–15. doi: 10.1016/S0034-4257(02)00084-6
Lambin, E. F., and Meyfroidt, P. (2010). Land use transitions: Socio-ecological feedback versus socio-economic change. Land Use Policy 27, 108–118. doi: 10.1016/j.landusepol.2009.09.003
Latawiec, A. E., Strassburg, B. B. N., Brancalion, P. H. S., Rodrigues, R. R., and Gardner, T. (2015). Creating space for large-scale restoration in tropical agricultural landscapes. Front. Ecol. Environ. 13, 211–218. doi: 10.1890/140052
Laue, J. E., and Arima, E. Y. (2016). Spatially explicit models of land abandonment in the Amazon. J. Land Use Sci. 11, 48–75. doi: 10.1080/1747423X.2014.993341
Lawrence, D., Radel, C., Tully, K., Schmook, B., and Schneider, L. (2010). Untangling a decline in tropical forest resilience: constraints on the sustainability of shifting cultivation across the globe. Biotropica 42, 21–30. doi: 10.1111/j.1744-7429.2009.00599.x
Lugo, A. E. (2009). The emerging era of novel tropical forests. Biotropica 41, 589–591. doi: 10.1111/j.1744-7429.2009.00550.x
Marengo, J. A., and Bernasconi, M. (2015). Regional differences in aridity/drought conditions over Northeast Brazil: present state and future projections. Clim. Change 129, 103–115. doi: 10.1007/s10584-014-1310-1
Mariano, D. A., Santos, C. A. C., Wardlow, B. D., Anderson, M. C., Schiltmeyer, A. V., Tadesse, T., et al. (2018). Use of remote sensing indicators to assess effects of drought and human-induced land degradation on ecosystem health in Northeastern Brazil. Remote Sens. Environ. 213, 129–143. doi: 10.1016/j.rse.2018.04.048
Melo, F. P. L., Arroyo-Rodríguez, V., Fahrig, L., Martínez-Ramos, M., and Tabarelli, M. (2013). On the hope for biodiversity-friendly tropical landscapes. Trends Ecol. Evol. 28, 462–468. doi: 10.1016/j.tree.2013.01.001
Mesquita, R. D. C. G., Massoca, P. E. D. S., Jakovac, C. C., Bentos, T. V., and Williamson, G. B. (2015). Amazon rain forest succession: Stochasticity or land-use legacy? Bioscience 65, 849–861. doi: 10.1093/biosci/biv108
Miles, L., Newton, A. C., DeFries, R. S., Ravilious, C., May, I., Blyth, S., et al. (2006). A global overview of the conservation status of tropical dry forests. J. Biogeogr. 33, 491–505. doi: 10.1111/j.1365-2699.2005.01424.x
Ministério do Meio Ambiente (MMA) (2007). Definição de Vegetação Primária e Secundária de Regeneração de Mata Atlântica no Estado de Minas Gerais. Resolução CONAMA # 392. Available online at: http://www2.mma.gov.br/port/conama/legiabre.cfm?codlegi=537 (accessed May 12, 2020).
Murphy, P. G., and Lugo, A. E. (1986). Ecology of tropical dry forest. Annu. Rev. Ecol. Syst. 17, 67–88. doi: 10.1146/annurev.es.17.110186.000435
Muylaert, R. L., Vancine, M. H., Bernardo, R., Oshima, J. E. F., Sobral-Souza, T., Tonetti, V. R., et al. (2018). Uma nota sobre os limites territoriais da Mata Atlântica. Oecologia Aust. 22, 302–311. doi: 10.4257/oeco.2018.2203.09
Nunes, F. S. M., Soares-Filho, B. S., Rajão, R., and Merry, F. (2017). Enabling large-scale forest restoration in Minas Gerais state, Brazil. Environ. Res. Lett. 12:044022. doi: 10.1088/1748-9326/aa6658
Oakleaf, J. R., Matsumoto, M., Kennedy, C. M., Baumgarten, L., Miteva, D., Sochi, K., et al. (2017). LegalGEO: conservation tool to guide the siting of legal reserves under the Brazilian forest code. Appl. Geogr. 86, 53–65. doi: 10.1016/j.apgeog.2017.06.025
Organization for Economic Co-operation and Development (OECD). (2018). Biodiversity Conservation and Sustainable Use in Latin America: Evidence From Environmental Performance Reviews. Paris: OECD Publishing.
Otukei, J. R., and Blaschke, T. (2010). Land cover change assessment using decision trees, support vector machines and maximum likelihood classification algorithms. Int. J. Appl. Earth Obs. Geoinf. 12, S27–S31. doi: 10.1016/j.jag.2009.11.002
Poore, J. A. (2016). Call for conservation: abandoned pasture. Science 351, 132. doi: 10.1126/science.351.6269.132-a
Poorter, L., Bongers, F., Aide, T. M., Almeyda Zambrano, A. M., Balvanera, P., Becknell, J. M., et al. (2016). Biomass resilience of neotropical secondary forests. Nature 530, 211–214. doi: 10.1038/nature16512
Portillo-Quintero, C. A., and Sánchez-Azofeifa, G. A. (2010). Extent and conservation of tropical dry forests in the Americas. Biol. Conserv. 143, 144–155. doi: 10.1016/j.biocon.2009.09.020
Programa das Nações Unidas para o Desenvolvimento (PNUD) (2015). Atlas do Desenvolvimento Humano. Brasília: PNUD.
Queiroz, M. G., Silva, T. G. F., Zolnier, S., Jardim, A. M. R. F., Souza, C. A. A., Araújo, C. N. Jr., et al. (2020). Spatial and temporal dynamics of soil moisture for surfaces with a change in land use in the semi-arid region of Brazil. Catena 188:104457. doi: 10.1016/j.catena.2020.104457
Quinn, G. P., and Keough, M. J. (2002). Experimental Design and Data Analysis for Biologists. Cambridge: Cambridge University Press.
R Development Core Team. (2020). R: A Language and Environment for Statistical Computing. Vienna: R Foundation for Statistical Computing.
Redo, D., Aide, T. M., and Clark, M. L. (2013). Vegetation change in Brazil's dryland ecoregions and the relationship to crop production and environmental factors: Cerrado, Caatinga, and Mato Grosso, 2001-2009. J. Land Use Sci. 8, 123–153. doi: 10.1080/1747423X.2012.667448
Rey-Benayas, J. M. R., Martins, A., Nicolau, J. M., and Schulz, J. J. (2007). Abandonment of agricultural land: an overview of drivers and consequences. CAB Rev. Perspect. Agric. Vet. Sci. Nutr. Nat. Resour. 2, 1–14. doi: 10.1079/PAVSNNR20072057
Rezende, G. M., and Vieira, D. L. M. (2019). Forest restoration in southern Amazonia: Soil preparation triggers natural regeneration. For. Ecol. Manage. 433, 93–104. doi: 10.1016/j.foreco.2018.10.049
Rocha-Júnior, P. R., Andrade, F. V., Mendonça, E. S., Donagemma, G. K., Fernandes, R. B. A., Bhattharai, R., et al. (2017). Soil, water, and nutrient losses from management alternatives for degraded pasture in Brazilian Atlantic Rainforest biome. Sci. Total Environ. 583, 53–63. doi: 10.1016/j.scitotenv.2016.12.187
Rouse, J. W. Jr., Haas, R. H., Schell, J. A., and Deering, D. W. (1973). “Monitoring vegetation systems in the Great Plains with ERTS,” in Proceedings of the 3rd Earth Resources Technology Satellite (ERTS) Symposium, ed NASA (Washington, DC: NASA), 309–317.
Rozendaal, D. M. A., Bongers, F., Aide, T. M., Alvarez-Dávila, E., Ascarrunz, N., Balvanera, P., et al. (2019). Biodiversity recovery of neotropical secondary forests. Sci. Adv. 5:eaau3114. doi: 10.1126/sciadv.aau3114
Rudel, T. K. (2017). The dynamics of deforestation in the wet and dry tropics: a comparison with policy implications. Forests 8:108. doi: 10.3390/f8040108
Sampaio, E. V. S. B., Menezes, R. S. C., Sampaio, Y. S. B., and Freitas, A. D. S. (2017). “Sustainable agricultural uses in the Caatinga,” in Caatinga: The Largest Tropical Dry Forest Region in South America, eds J. M. C. Silva, I. R. Leal, and M. Tabarelli (Cham: Springer), 413–428.
Sánchez-Azofeifa, G. A., Quesada, M., Rodríguez, J. P., Nassar, J. M., Stoner, K. E., Castillo, A., et al. (2005). Research priorities for Neotropical dry forests. Biotropica 37, 477–485. doi: 10.1046/j.0950-091x.2001.00153.x-i1
Santiago, A. R., and Couto, H. T. Z. (2020). Socioeconomic development versus deforestation: considerations on the sustainability of economic and social growth in most Brazilian municipalities. Environ. Dev. 35:100520. doi: 10.1016/j.envdev.2020.100520
Santos, J. C., Leal, I. R., Almeida-Cortez, J. S., Fernandes, G. W., and Tabarelli, M. (2011). Caatinga: the scientific negligence experienced by a dry tropical forest. Trop. Conserv. Sci. 4, 276–286. doi: 10.1177/194008291100400306
Schmidt, I. B., and Eloy, L. (2020). Fire regime in the Brazilian Savanna: recent changes, policy and management. Flora 268:151613. doi: 10.1016/j.flora.2020.151613
Schwartz, N., Aide, T. M., Graesser, J., Grau, H. R., and Uriarte, M. (2020). Reversals of reforestation across Latin America limit climate mitigation potential of tropical forests. Front. For. Glob. Chang. 3:85. doi: 10.3389/ffgc.2020.00085
Soares-Filho, B., Rajão, R., Macedo, M., Carneiro, A., Costa, W., Coe, M., et al. (2014). Cracking Brazil's forest code. Science 344, 363–364. doi: 10.1126/science.1246663
Sousa, F. P., Ferreira, T. O., Mendonça, E. S., Romero, R. E., and Oliveira, J. G. B. (2012). Carbon and nitrogen in degraded Brazilian semi-arid soils undergoing desertification. Agric. Ecosyst. Environ. 148, 11–21. doi: 10.1016/j.agee.2011.11.009
Sousa-Júnior, S. C., Morais, D. A. E. F., Vasconcelos, A. M., Nery, K. M., Morais, J. H. G., and Guilhermino, M. M. (2008). Características termorreguladoras de caprinos, ovinos e bovinos em diferentes épocas do ano em região semi-árida. Rev. Cient. Prod. Anim. 10, 127–137. Available online at: https://cienciahoje.org.br/edicao/288/
Stan, K., and Sanchez-Azofeifa, A. (2019). Deforestation and secondary growth in Costa Rica along the path of development. Reg. Environ. Chang. 19, 587–597. doi: 10.1007/s10113-018-1432-5
Strassburg, B. B. N., Latawiec, A. E., Barioni, L. G., Nobre, C. A., da Silva, V. P., Valentim, J. F., et al. (2014). When enough should be enough: Improving the use of current agricultural lands could meet production demands and spare natural habitats in Brazil. Glob. Environ. Chang. 28, 84–97. doi: 10.1016/j.gloenvcha.2014.06.001
Thomaz, E. L. (2013). Slash-and-burn agriculture: establishing scenarios of runoff and soil loss for a five-year cycle. Agric. Ecosyst. Environ. 168, 1–6. doi: 10.1016/j.agee.2013.01.008
Trigueiro, W. R., Nabout, J. C., and Tessarolo, G. (2020). Uncovering the spatial variability of recent deforestation drivers in the Brazilian Cerrado. J. Environ. Manage. 275:111243. doi: 10.1016/j.jenvman.2020.111243
Wright, S. J., and Muller-Landau, H. C. (2006). The future of tropical forest species. Biotropica 38, 287–301. doi: 10.1111/j.1744-7429.2006.00154.x
Xie, Z., Game, E. T., Hobbs, R. J., Pannell, D. J., Phinn, S. R., and McDonald-Madden, E. (2020). Conservation opportunities on uncontested lands. Nat. Sustain. 3, 9–15. doi: 10.1038/s41893-019-0433-9
Keywords: restoration, conservation strategies, land use and cover changes, human welfare, natural regeneration
Citation: Espírito-Santo MMd, Rocha AM, Leite ME, Silva JO, Silva LAP and Sanchez-Azofeifa GA (2020) Biophysical and Socioeconomic Factors Associated to Deforestation and Forest Recovery in Brazilian Tropical Dry Forests. Front. For. Glob. Change 3:569184. doi: 10.3389/ffgc.2020.569184
Received: 03 June 2020; Accepted: 24 November 2020;
Published: 14 December 2020.
Edited by:
Catarina C. Jakovac, Wageningen University and Research, NetherlandsReviewed by:
Renato Crouzeilles, Instituto Internacional de Sustentabilidade (IIS), BrazilCopyright © 2020 Espírito-Santo, Rocha, Leite, Silva, Silva and Sanchez-Azofeifa. This is an open-access article distributed under the terms of the Creative Commons Attribution License (CC BY). The use, distribution or reproduction in other forums is permitted, provided the original author(s) and the copyright owner(s) are credited and that the original publication in this journal is cited, in accordance with accepted academic practice. No use, distribution or reproduction is permitted which does not comply with these terms.
*Correspondence: Mário Marcos do Espírito-Santo, bWFyaW8ubWFyY29zQHVuaW1vbnRlcy5icg==
Disclaimer: All claims expressed in this article are solely those of the authors and do not necessarily represent those of their affiliated organizations, or those of the publisher, the editors and the reviewers. Any product that may be evaluated in this article or claim that may be made by its manufacturer is not guaranteed or endorsed by the publisher.
Research integrity at Frontiers
Learn more about the work of our research integrity team to safeguard the quality of each article we publish.