 Wendy Leuenberger
 Jonathan B. Cohen
 Lindsey Rustad2
 Kimberly F. Wallin
 Dylan Parry
- 1Department of Environmental and Forest Biology, State University of New York College of Environmental Science and Forestry, Syracuse, NY, United States
- 2Northern Research Station, USDA Forest Service, Durham, NH, United States
- 3Rubenstein School of Environment and Natural Resources, University of Vermont, Burlington, VT, United States
- 4Northern Research Station, USDA Forest Service, Burlington, VT, United States
Large-scale disturbances such as ice storms may increase in frequency and intensity as climate changes. While disturbances are a natural component of forest ecosystems, climatically driven alteration to historical patterns may impart fundamental change to ecosystem function. At Hubbard Brook Experimental Forest, NH, experimental ice storms of varying severity were applied to replicate plots of mature northern hardwoods to quantify their effects on forested ecosystems. We assessed ice storm treatment effects on insectivorous foliage-gleaning birds and evaluated insectivore predation on model caterpillars in the understory vegetation. These birds are charismatic, of conservation concern, and are major predators of caterpillars. In turn, lepidopterans are the dominant herbivores in temperate forests and are integral to ecosystem function. We predicted that avian abundance would increase due to additional structural heterogeneity caused by ice treatments, with a concomitant increase in caterpillar predation. Point counts were used to measure insectivorous bird activity in the ice storm experiment plots and additional control plots before and after treatments. We deployed and retrieved plasticine model caterpillars and estimated predation from characteristic marks to these surrogates. Abundance of foliage-gleaning birds was higher in the ice storm plots and birds responded to treatments as a single diffuse disturbance rather than on an individual plot level. All species except one were observed both before and after the ice treatments. Surprisingly, predation on caterpillar models was unaffected by ice storm treatments but rather was a function of caterpillar density. The increase in avian abundance in the ice storm treatment plots corroborates other studies of bird responses to relatively small-scale disturbances in forests and the limited change in species composition was expected given the plot size. We conclude that ice storms may provide beneficial changes for foliage-gleaning birds in the growing season following the disturbance.
Introduction
Concomitant with warming temperatures, climate change is predicted to increase the frequency, intensity, and timing of extreme weather events (Cook and Seager, 2013; Wuebbles et al., 2014). These alterations to natural cycles are directly linked to increases in anthropogenic greenhouse gas emissions (Lambert and Fyfe, 2006; Cook and Seager, 2013) and will likely be more damaging to ecosystems than gradual temperature changes, at least over the short term (Dale et al., 2001; Arnone et al., 2011).
Ice storms are one such event that can have major environmental, societal, and economic consequences as they can span large areas and affect both natural ecosystems and human infrastructure and commerce. Ice storms occur when rain from warm fronts hits colder air closer to the ground (Irland, 1998), resulting in supercooled precipitation and ice accumulation ranging from a light glaze to 10 cm or more (Bruederle and Stearns, 1985; Irland, 1998). From 1832 to 1961, 14 severe ice storms were recorded in New England (Dupigny-Giroux, 2000), a large region prone to frequent icing events. Climate change may increase ice storm frequency and severity as well as shift the current ice belt northward (Dale et al., 2001; Cheng et al., 2011; Klima and Morgan, 2015; Swaminathan et al., 2018).
Ice storms have heterogeneous effects on forested ecosystems as severity depends on stand age, species composition, elevation, proximity to water, slope, aspect, ground surface temperature, precipitation, and wind (Bruederle and Stearns, 1985; Seischab et al., 1993; Irland, 2000; Rhoads et al., 2002; Degelia et al., 2016). Damage wrought by icing ranges from loss of twigs and fine branches to the destruction of the entire crown of large trees (Rogers, 1923; Smith, 2000; Nielsen et al., 2003) with concomitant change to leaf area, canopy cover, and stand height (Rhoads et al., 2002; Weeks et al., 2009). Severely damaged trees can be near trees with moderate or little damage (Rubin and Manion, 2001). Forest structure can be fundamentally altered after ice storms, with an increase in canopy gaps, snags, and a mosaic of downed or partially downed limbs, bent over trees, and coarse woody debris (Smith, 2000; Rhoads et al., 2002; Nielsen et al., 2003), and increased vegetation in the lower strata (Weeks et al., 2009). These changes in vegetation structure and three-dimensional complexity can affect population dynamics of a wide variety of organisms in both positive and negative directions (Blais et al., 2001; Ryall and Smith, 2005; Zhang et al., 2016).
Two trophically linked and ecologically important groups of organisms in temperate hardwood forests are foliage-gleaning insectivorous birds and the lepidopteran caterpillars they consume (Singer et al., 2012, 2014). Ice storms may profoundly affect both groups, through changes in food quality and predation risk for caterpillars (Hirao et al., 2008; Richards and Coley, 2008; Takafumi et al., 2010; Stoepler and Lill, 2013), and through altered prey abundance and habitat complexity for birds. Structural complexity promotes foraging and nesting opportunities for many songbirds that prey on Lepidoptera (DeGraaf et al., 1998; Doran and Holmes, 2005), particularly after disturbances that create openings in an otherwise closed-canopy forest (Blake and Hoppes, 1986; Greenberg and Lanham, 2001). Caterpillar densities and abundance also affect ecological traits of breeding birds in the eastern U.S. including territory size (Marshall and Cooper, 2004), energy intake (Goodbred and Holmes, 1996; Moorman et al., 2007), population growth rates (Townsend et al., 2016), and reproduction (Rodenhouse and Holmes, 1992; Marshall et al., 2002; Newell et al., 2014). Therefore, changes in caterpillar populations are likely to affect many bird populations, including insectivorous bird species of conservation concern (e.g., many passerine Neotropical migrants).
Insectivorous birds exert important top-down control of insect herbivory in forest ecosystems (Bereczki et al., 2015; Muiruri et al., 2015; Whelan et al., 2015). Avian detections are correlated with increased predation on insects (Bereczki et al., 2015) and increased bird abundances resulted in reduced caterpillar population density (Sanz, 2001). Measurements of both predation intensity and avian detections are higher near edges than in interior forest (Bereczki et al., 2015), thus disturbances caused by ice storms that open canopy gaps may drive increases in both variables.
While ice storms occur relatively frequently, these storms are difficult to study due to their stochastic nature, large variability in intensity, and the spatially heterogenous nature of their effects over landscapes (Millward and Kraft, 2004; Wuebbles et al., 2014; Kayler et al., 2015; Degelia et al., 2016). The implementation of experimental ice storms of realistic intensity over a mature hardwood forest canopy in the White Mountains of New Hampshire, USA provided an uncommon opportunity to quantify interactions between insectivorous birds and their lepidopteran prey after glazing events of varying severities. Evaluating the response of these groups to climatically driven disturbances such as ice storms will help us understand potential ramifications of climate changes and determine if management actions are necessary. Our objective was to investigate changes in avian abundance and caterpillar predation rates in response to experimental ice storms. We predicted that increased ice storm severity would result in higher levels of avian abundance and caterpillar predation in the treatment understory.
Materials and Methods
Study Area and Ice Storm Manipulation
To enhance our understanding of the short and long term effects of ice storm on forests, a project was developed at Hubbard Brook Experimental Forest in New Hampshire to experimentally simulate icing events of various realistic severities using high pressure, mechanical pumps to spray water into a hardwood forest canopy under weather conditions where water supercooled, resulting in ice accumulation (Rustad and Campbell, 2012; Campbell et al., 2020; Rustad et al., 2020). The methods are described in Rustad et al. (2020) and Campbell et al. (2020) and summarized in the following section. Ice storm experiment (ISE) plots encompassed ~100 yr old mixed hardwood stands co-dominated by American beech (Fagus grandifolia), sugar maple (Acer saccharum), and yellow birch (Betula alleghaniensis). Ten fixed area plots (20 × 30 m) were assigned to one of five treatments, with two plots in each treatment (Figure 1). Treatments included low (6 mm radial ice accretion), mid (13 mm), high (19 mm), mid×2 (13 mm in two consecutive years), and control (0 mm). Plots encompassed a 5-m buffer around eight 5 m × 5 m subplots and were situated such that their edges were a minimum of 10 m apart. There was some tree, sapling, and shrub removal beginning in July 2015 to create paths on two sides of each plot for vehicles during ice treatments. Ice accumulated over the course of 1–4 h during treatments and remained for five to 13 days, depending on ice thickness and ambient weather conditions. Icing was applied between 18 January 2016 and 11 February 2016. The plots slated to receive treatment in two consecutive years were iced again on 14 January 2017. Data for this study were not gathered in 2017, so the mid×2 were analyzed as replicate mid plots. Icing caused branches to bend, break, or tear from the main stem of the tree and entire trees bent and snapped in the high treatments (Campbell et al., 2020; Rustad et al., 2020). Icing increased deposition of fine and coarse woody debris in the treatment plots (Rustad et al., 2020) and reorganized the canopy with more vegetation at lower strata and a decline in leaf area index following the treatments (Fahey et al., 2020).
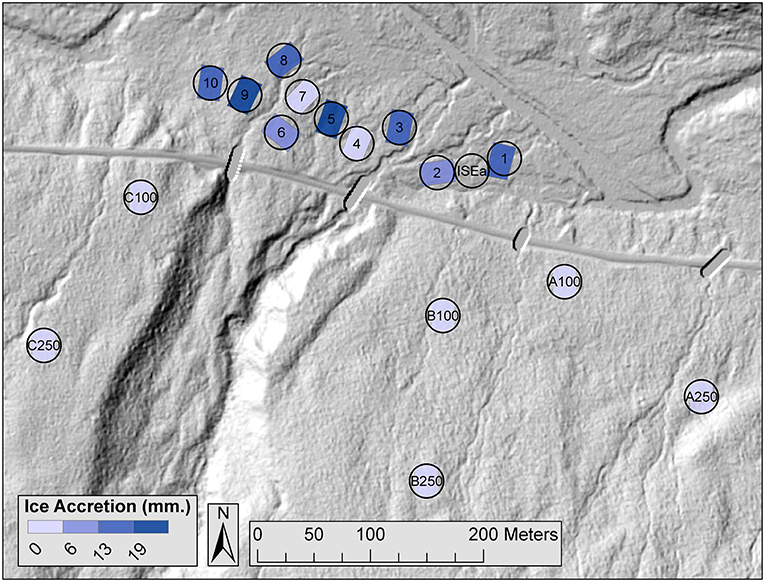
Figure 1. LiDAR map of ice storm experiment plots with colors representing the target amount of experimentally applied ice accretion. Plots are 20 × 30 m. Hubbard Brook is in the northern part of the figure and the main road is directly south of the plots. Ice storm treatments are located within plots 1–10 and icing occurred in January and February of 2016. Additional control plots include ISEa and plots A100-C250. Circles represent the 15 m point count radii. We visited each point count location six times in 2015 and 2016. The plots were located within Hubbard Brook Experimental Forest in New Hampshire.
In addition to the ten ice storm plots, we sampled six supplementary untreated plots (n = 16 plots total) to address potential edge effects. The edges of untreated plots were located 100 m away (n = 3) and 250 m away (n = 3) from the edge of the nearest ice storm plot (Figure 1). Plots contained comparable vegetation species and structure as the ten ice storm plots. For point counts and canopy cover surveys, we also sampled an additional untreated location between plots 1 and 2 (plot ISEa, Figure 1), for a total of 17 plots as these plots were spaced further apart. Unless otherwise stated, all sampling occurred in both 2015 (baseline) and 2016 (post-manipulation).
Canopy Cover
Canopy cover surveys were conducted in late July to early August. We sampled canopy cover using 15 m transects which began at the point count location (plot center) and extended in each cardinal direction. Canopy cover was sampled at points located every 3 m along each transect, including the center, for a total of 21 points (James and Shugart, 1970). At each point, we used an ocular tube to record presence or absence of canopy cover directly overhead (James and Shugart, 1970). These surveys characterized vegetation damage caused by the ice storms and were used as a covariate for avian detection rates.
Avian Point Counts
We conducted point count surveys to estimate an index of insectivorous bird activity in plots (Petit et al., 1995; Farnsworth et al., 2005). Each plot was visited twice per week from 1 June to 21 June 2016 for a total of six visits per plot per year. All plots were surveyed with 15-m fixed radius point counts. Point counts were conducted from the plot center. We approached the point with minimal disturbance and waited 1 min before beginning a 10-min point count. We identified each individual bird seen or heard during the point count. Multiple individuals of the same species were only recorded when clear evidence of counter-calling occurred (hearing 2+ individuals from different directions in a short span of time). Each round of point counts took place over two mornings, with the 11 ice storm plots on one morning and the six edge effects plots on another morning. All point counts were conducted between sunrise and 08:45 h EST. Point counts were conducted prior to 08:00 h on 96% of counts and in the first hour and half following sunrise (05:05–06:35 h) on 53% of counts. Plot order was reversed on every other visit. Start time, precipitation (none, fog, mist, light rain), cloud cover (0, 25, 50, 75, or 100%), and wind on the Beaufort scale (0–5) were recorded during every count. Counts were only conducted under suitable weather conditions for birds (no heavy rain, winds, or storms). All point counts were conducted by the same observer (WL).
Birds were partitioned into groups based on their foraging behaviors (foliage gleaners, bark foragers, ground foragers, aerial divers) according to descriptions at Cornell University's All About Birds web resource (Cornell University, 2015). We excluded birds that were only detected as flyovers and were not interacting with plots. We retained only foliage-gleaning species in our analyses, as this guild consumes lepidopteran larvae as a major component of their diet (Holmes and Schultz, 1988), alongside other insect groups like Homoptera, Coloeoptera, and Diptera (Robinson and Holmes, 1982). These species generally forage by gleaning, hovering, or hanging on leaves and bark (Robinson and Holmes, 1982).
Caterpillar Predation
To estimate relative predation rates and identify predators of lepidopteran larvae, we used model caterpillars constructed from plasticine (Leuenberger et al., 2019). Plasticine model caterpillars suffer levels of attack similar to real larvae, and thus provide a useful comparison of predation intensity, causation, and impact across treatments (Howe et al., 2009; Bereczki et al., 2014). We made and deployed 50 light green (08 light green Newplast, Newclay Products, Devon, England) geometrid (inchworm) models in each plot (n = 16) for 6 days (Figure 2). There is no consistently-timed peak in caterpillar abundance between late May and late July at Hubbard Brook (Lany et al., 2016), so we deployed caterpillars in late June, which was within the breeding season for all migratory birds at our study area and shortly after peak breeding season for resident black-capped chickadees (Poecile atricapillus) and yellow-bellied sapsuckers (Sphyrapicus varius, Billerman et al., 2020). Accumulated degree days were used to standardize the timing of deployments between years. We obtained daily maximums and minimums for North Woodstock, NH (The Weather Company LLC, 2016). Degree days were calculated beginning on 1 April and included any days with an average temperature ([max + min]/2) above 10°C (Higley et al., 1986). In 2015, we began deployment on 18 June at 262.5 cumulative degree days, and in 2016 on June 23 at 279.7 cumulative degree days.
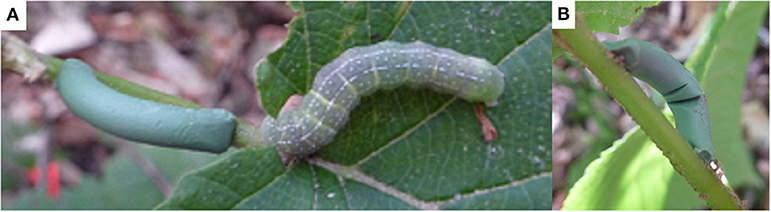
Figure 2. (A) Plasticine caterpillar (left) next to a notodontid caterpillar (right) at Hubbard Brook Experimental Forest, NH, in June 2015. (B) Caterpillar model with evidence of bird predation.
Caterpillar models were 25 mm long with a diameter of 3.5 mm and were glued to leaf petioles or next to leaves in life-like typical day time inchworm poses (Howe et al., 2009). Half of the caterpillars (n = 25) in each plot were deployed on hobblebush (Viburnum lantanoides) and half on American beech. All caterpillars were placed between 0.5 and 2 m above ground, with a minimum of 0.5 m horizontal distance between caterpillars. Caterpillars were spread evenly throughout each plot, typically with 7 or 8 caterpillars per 5 × 5 m subplot depending on the availability of host plants. Some caterpillars were placed in the buffer zone surrounding plots if there were not enough locations within the interior plot to deploy all 50 caterpillars. In 2016, we recorded approximate locations of each caterpillar to the nearest 0.25 m within the plot to allow us to account for spatial autocorrelation (Supplementary Material). Heights were recorded as one of three categories: 0.5–1 m, 1–1.5 m, or 1.5–2 m. Caterpillar locations were discretely marked so as to not provide obvious search cues for predators and checked every other day for evidence of predation attempts (Bereczki et al., 2014).
Any caterpillars with obvious markings from avian predators were removed and placed in 2 mL microcentrifuge tubes for preservation. If the caterpillar was not found on the plant, the ground surrounding the deployment site was searched for 10 min by one person or 5 min by two people. If the caterpillar was still missing after this time, we marked it as “missing.” We continued to briefly check the area on subsequent visits to attempt to recover the caterpillar. All remaining caterpillars were removed after 6 days (Bereczki et al., 2014). Retrieved caterpillars were examined under 1.75× magnification for evidence of predation by birds that could have been missed in the field (Howe et al., 2009).
Data Analyses
Canopy Cover
Canopy cover data were analyzed using logistic regression with a random effect for plot (Bates et al., 2014). Our fixed effects included treatment (Control, Low, Mid, High), site (ISE plots or edge effects plots), and year. We fit models with terms treatment × year, treatment + year, site × year, site + year, each variable as a univariate term, and a null model for a total of 8 models. We considered models with relative model likelihoods of ≥0.125 to have support (Burnham and Anderson, 2002). If multiple models met this criterion, we model-averaged the predicted values using the “AICcmodavg” package (Burnham and Anderson, 2002; Mazerolle, 2016). We simulated residuals using the most complex model (treatment × year) to assess suitability of the distribution and check for overdispersion (Hartig, 2020).
Avian Point Counts
Point count data were analyzed using N-mixture models (Royle, 2004). N-mixture models account for imperfect detection and covariates can be included to model both detection and abundance. Detection is binomially distributed, while abundance is generally Poisson distributed. We could not estimate abundance directly due to the lack of independence among points caused by their small size and tight spacing. Independence among point counts is generally considered to occur when points are located ≥200 to 250 m apart, which diminishes the probability of an individual bird being detected at multiple points (Hutto et al., 1986; Ralph et al., 1993). Therefore, “abundance” as used in this paper refers to a detection-corrected index of the number of individuals using a plot, some of which may have used multiple plots. We fit N-mixture models using the “unmarked” package and R (Fiske and Chandler, 2011; R Core Team, 2019).
We fit the detection component prior to the abundance component of the mixture model. Detection variables included time of day (minutes since midnight), precipitation, sky cover, wind, and canopy cover. All numeric variables were standardized, and detection variables were checked for Pearson's correlations. Variables with correlations >0.7 were not included in the same model (Dormann et al., 2013). Each variable was fit in a univariate model, and in bivariate models with all pairs of these variables, and in an intercept-only null model. When performing model selection for detection, we held the abundance model at one of the most complex possible structures (site × year, Doherty et al., 2012).
The best detection model was used to fit a set of models to assess the effect of treatment, site, and year on avian abundance. Abundance variables included treatment, site (ISE plots or edge effects plots), and year. Models were run for treatment × year, treatment + year, site × year, site + year, each variable as a univariate term, and a null model for a total of 8 models. Each of these sets of abundance variables were run alongside the detection covariate(s) to create the model set. We considered models with relative model likelihoods of ≥0.125 to have support (Burnham and Anderson, 2002). If multiple models met this criterion, we model-averaged the predicted values using the “AICcmodavg” package (Burnham and Anderson, 2002; Mazerolle, 2016). A covariate was considered to have useful predictive value if the 95% confidence intervals for the beta coefficients did not overlap zero. A goodness-of-fit test with 10,000 bootstrapped samples on the site × year abundance model was run to calculate a chi-square test statistic and overdispersion, also known as ĉ (Burnham and Anderson, 2002; Mazerolle, 2016). If ĉ was > 4, we ran the best model with negative binomial and zero-inflated Poisson distributions for the abundance component to see if either method corrected overdispersion (Burnham and Anderson, 2002).
Caterpillar Predation
Caterpillar predation probability was analyzed using logistic regression with a random effect for plot (Howe et al., 2009; Bates et al., 2014). Treatment was included as a covariate, in addition to six categorical and two continuous covariates to account for sources of variability. These covariates pertained to the placement of individual caterpillars (caterpillar height, vegetation), year, and plot location. We used three covariates to split plots according to location, as the density of nearby caterpillars may affect predation: (1) Site: ISE plots and edge effect plots; (2) Location: ISE plots, 100 m edge effect plots, and 250 m edge effect plots; and (3) Periphery: peripheral ISE plots (ISE 1 and 10), interior ISE plots (ISE 2-9), 100 m edge effect plots, and 250 m edge effect plots. Each covariate was run individually, each as an additive variable with treatment, treatment only, and the null model for a total of 14 models. Models with a relative likelihood of ≥0.125 were considered to have support and we model-averaged the predicted models if multiple models qualified as supported models (Burnham and Anderson, 2002). We simulated residuals using the best bivariate model to assess suitability of the distribution and check for overdispersion (Hartig, 2020). Spatial autocorrelation and caterpillar survival over time were calculated (Supplementary Material).
Results
Canopy Cover
Prior to treatment, canopy cover ranged from 71 ± 46% (mean ± SE) to 95 ± 22% for each plot. Following treatment, canopy cover ranged from 52 ± 51% to 100 ± 0% for each plot. The treatment × year model was the only supported model, indicating that the treatments showed different patterns from one another between years (Table 1). Canopy cover decreased with treatment intensity in the second year (Figure 3). Simulated residuals showed that the distribution was a good fit and that there was no overdispersion present in the model.
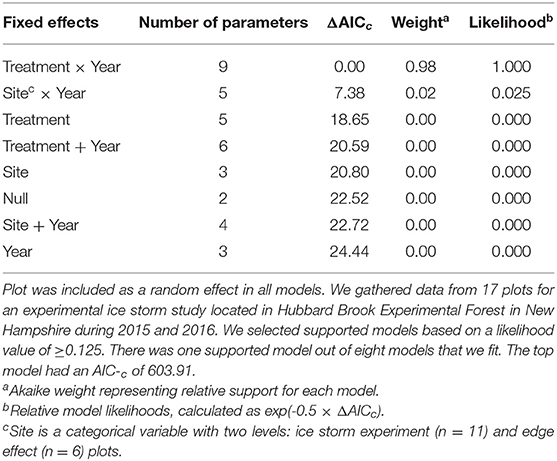
Table 1. Model descriptions, number of parameters, and information-theoretic selection criteria for logistic mixed effects models characterizing canopy cover.
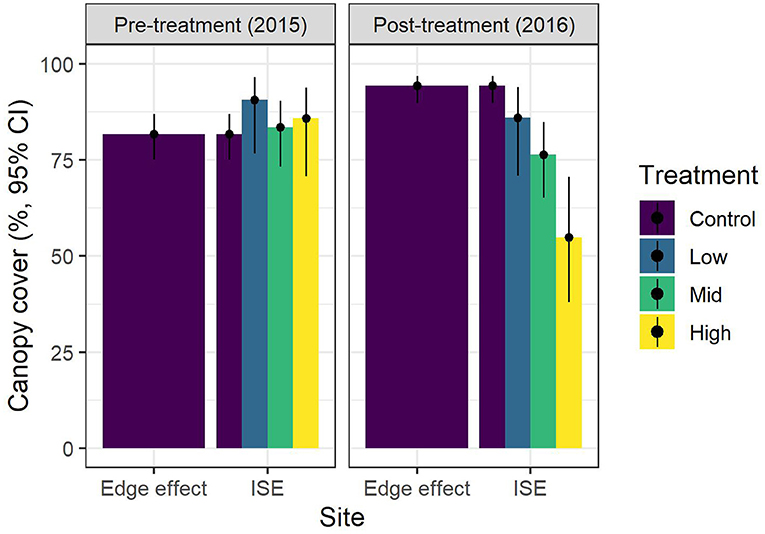
Figure 3. Canopy cover (model predictions and 95% confidence intervals) before and after ice storm experiment (ISE) treatments. Icing was applied to two 20 × 30 m plots per treatment (n = 4 for medium treatment) during January and February 2016 at Hubbard Brook Experimental Forest in New Hampshire. Additional reference plots were located 100 and 250 m away to investigate edge effects.
Avian Point Counts
We recorded 125 observations of birds from 13 species during point counts (Table 2). Of these, 99 observations from eight species were foliage gleaners with more observations in 2016 (n = 76 observations) than in 2015 (n = 23). All species of foliage gleaners except for the yellow-rumped warbler (Setophaga coronata) were observed in both years (Table 2). One individual could not be identified to species but was foraging in the canopy in a similar manner as foliage gleaners, so was included as a foliage gleaner for analyses. Another unidentifiable bird was foraging on the ground, and thus was excluded from analyses. We recorded between two and 13 observations of foliage gleaners at each point count location over the course of 10 years. We detected a mean of 0.23 ± 0.05 SE detections per count in 2015 and 0.75 ± 0.09 detections per count in 2016. The most common species were red-eyed vireos (Vireo olivaceus; n = 42), black-throated blue warblers (Setophaga caerulescens; n = 16), and black-capped chickadees (n = 10; Table 2).
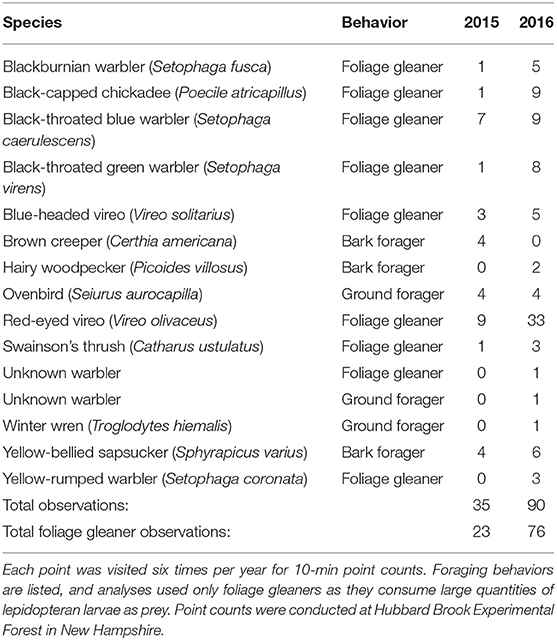
Table 2. Total observations of different bird species detected during 15 m radius point count surveys in experimental ice storm plots (n = 11) and controls (n = 6) during 2015 and 2016.
No detection variables had Pearson's correlation values >0.7. The best detection model contained only time. Only seven of the eight models were included in the final model set for abundance as variance could not be estimated in the treatment × year models, likely due to overfitting. Three of the seven models had likelihood values ≥0.125 (Table 3). The abundance components of the three supported models were site × year, site + year, and year (Table 3). Treatment was not included in any of the supported models. The 95% confidence intervals for the beta coefficients did not overlap zero for all coefficients except the abundance intercepts, and year and site in the site × year model (Table 4). Time of day had a positive effect on detection rate in all models (Table 4). Because three models had a relative likelihood ≥0.125, we employed model-averaging on the predicted values to make conclusions. Abundance was highest at the ISE plots in 2016 at 9.14 ± 6.65 SE birds per point, followed by the edge effects plots in 2016 at 4.25 ± 3.12 birds per point, the ISE plots in 2015 at 2.25 ± 1.76 birds per point, and the edge effects plots in 2015 at 2.20 ± 2.11 birds per point (Figure 4). The post-treatment ISE plots differ by <0.2 birds per plot. Time was held constant at the mean value for model-averaging. Confidence limits for all categories overlapped.
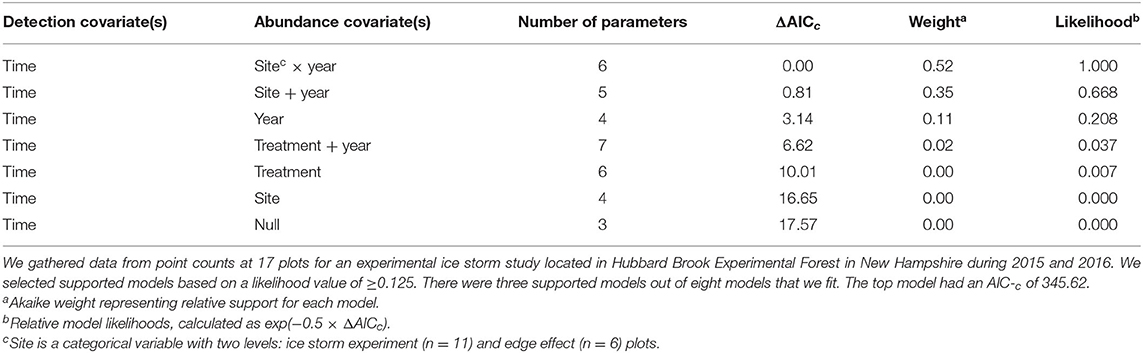
Table 3. Model descriptions, number of parameters, and information-theoretic selection criteria for N-mixture models to model an index of abundance for foliage-gleaning birds.
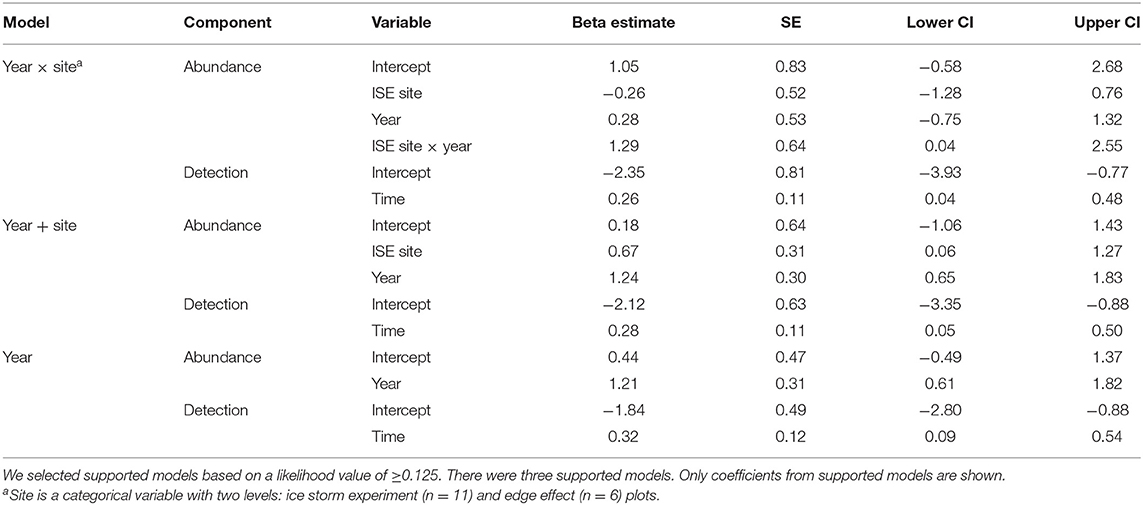
Table 4. Regression parameter (Beta) estimates, standard errors (SE), and 95% confidence intervals (CI) for parameters in supported models of an index of avian abundance following experimental ice storms at Hubbard Brook Experimental Forest in New Hampshire during 2015 and 2016.
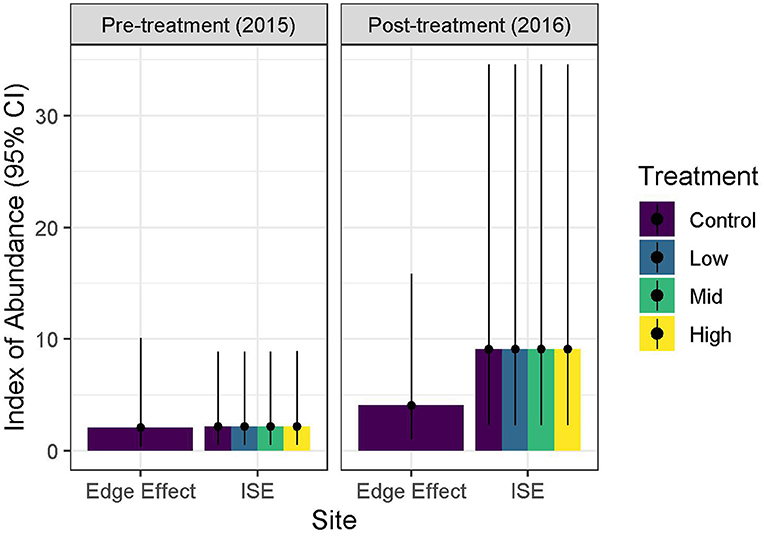
Figure 4. Detection-corrected index of avian abundance with 95% confidence intervals for foliage-gleaning birds in response to ice storm experiment (ISE) treatments. Icing was applied to two 20 × 30 m plots per treatment (n = 4 for medium treatment) during January and February 2016 at Hubbard Brook Experimental Forest in New Hampshire. Additional reference plots were located 100 and 250 m away to investigate edge effects.
We checked goodness-of-fit on the model with time, site × year. Simulated residuals showed that the distribution was suitable and that there was no overdispersion present in the model.
Caterpillar Predation
Predation rates were around 7.5% each year (n2015 = 63 caterpillars, 7.9% of total; n2016 = 59 caterpillars, 7.4% of total). We recovered 792 out of 800 caterpillars per year, for a recovery rate of 99%. Caterpillars not recovered were not found during any checks (n2015 = 5, n2016 = 4), were not found in the final check (n2015 = 3, n2016 = 1), or were accidentally stepped on (n2015 = 0, n2016 = 3). These caterpillars were not included in the analyses. Predation on most caterpillars was identified in the field, with a few examined and confirmed under magnification after the experiment (n2015 = 4, n2016 = 7).
Six models were included as supported models for caterpillar predation by birds (Table 5). These models included site, vegetation type, periphery, location, treatment + height, and treatment + site. Due to this model selection uncertainty, we model-averaged the predicted values to make inferences. No differences among heights were found when all other variables were held constant. More caterpillars were predated on hobblebush than on beech. We then set height to 1 m and vegetation to hobblebush to visually compare the model-averaged predicted values across different locations (Figure 5). Confidence intervals for all groups overlapped. The 100 m and 250 m edge effect plots had a higher predation rate than the ISE plots. The peripheral ISE plots had only slightly more predation than the other eight ISE plots. Predation rates were similar between the 2 years. ĉ of the best model was 1.00, indicating that data were not over dispersed. Caterpillar predation by birds was not autocorrelated at any of the three spatial scales we evaluated (Supplementary Material). Survival rates were higher for caterpillars in the ISE site on all days, without overlap among 95% confidence intervals for day 4 but with overlap for days 2 and 6 (Supplementary Material). Survival rates were lowest in both sites on day 2 and increased on day 4 (Supplementary Material). Survival rates increased for day 6 in the edge effect plots but decreased slightly in the ISE plots (Supplementary Material).
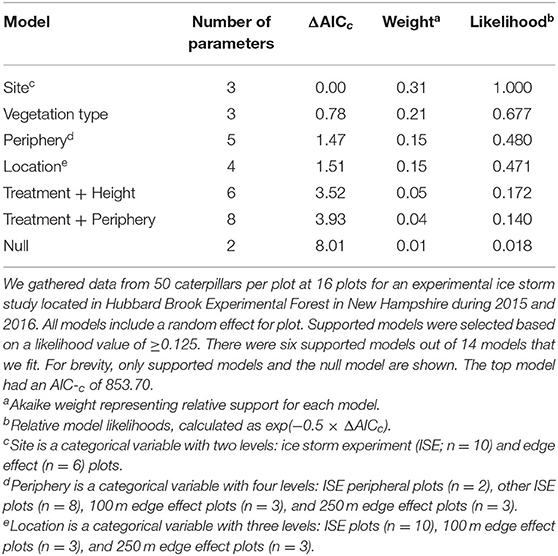
Table 5. Model descriptions, number of parameters, and information-theoretic selection criteria for logistic regression models of predation probability of plasticine model caterpillars by birds.
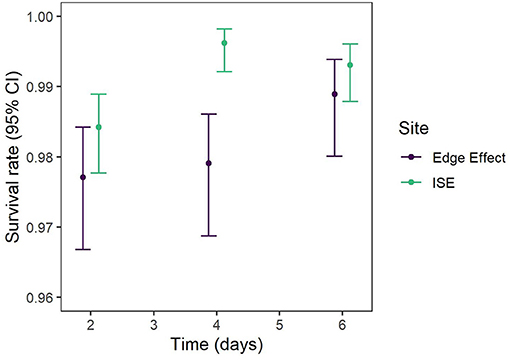
Figure 5. Model-averaged predation rates for predation by birds on plasticine model caterpillars. There were 50 caterpillars per plot. Plots were located within the ice storm experiment (ISE) plots, some of which were on the periphery (Periph) of the treatments. Other plots were located 100 m or 250 m away from ISE plots to investigate edge effects. Plasticine caterpillars were deployed in late June of 2015 and 2016 and experiments were located within Hubbard Brook Experimental Forest in New Hampshire. Ice storm treatments occurred during January and February 2016.
Discussion
The ice storm experiment resulted in a decreased amount of canopy cover and an increased abundance of foliage-gleaning birds within the ice storm-affected area. Species composition stayed relatively stable, with one additional species observed after the treatments and no other changes. We found some evidence that the increase in abundance was a response to the suite of treatments that created a diffuse disturbance in the roughly 100 × 300 m area containing all eight treated plots and two control plots, although due to model selection uncertainty the evidence is not conclusive. In some regards, these pockets of damaged forest in a matrix of mostly undamaged forest may be akin to windthrow gaps in old-growth or mature forest (Runkle, 1982; Seymour et al., 2002; Campbell et al., 2007) or to a mild natural ice storm or other patchy disturbance, as trees can vary from slightly to severely damaged within a small geographic region (Rubin and Manion, 2001; Faccio, 2003).
Increases in bird abundance following ice treatment corresponds with other regional studies of avian response to small disturbances. Group selection harvests are similar in spatial and temporal scale to these experimental ice storms, as they can be small (0.05–0.80 ha) and the patches can be revisited every 10–20 years (Costello et al., 2000), similar to the recurrence probability of a severe natural ice storm. Group selection cuts of 0.13–0.65 ha in New Hampshire included almost all bird species found in nearby mature forest (Costello et al., 2000). Timber harvests or gaps of 0.5–8 ha often increase avian abundance, species richness, and diversity in forests (Derleth et al., 1989; Forsman et al., 2010). Similar species compositions in control and treated areas are not found in all studies of small disturbances. Neotropical migrants respond differently depending on their habitat associations, as forest-interior species are replaced by interior-edge or edge-open species (Germaine et al., 1997; Moorman and Guynn, 2001; Faccio, 2003; Zhang et al., 2016). We saw little turnover among species, likely because the gap size was smaller than average territory size (Lent and Capen, 1995; Costello et al., 2000). Our study only investigated the first summer following the treatments. In analogous disturbance studies, patterns in avian response to gaps changes with time since harvest with foliage gleaners tending to have a negative relationship with gap age (Forsman et al., 2010).
Tightly spaced gaps and nearby control areas can result in the gaps having a cumulative effect rather than serving as independent replicates, and controls may not be true controls if they are near gaps (Campbell et al., 2007), as exemplified by the control ISE plots that also increased in avian abundance after icing. We saw a small increase in avian abundance at the edge effect plots in 2016. Edge effects from patch cut or group selection harvests have been observed 50–100 m into the forest and effects generally dissipate prior to 200 m (Germaine et al., 1997; Moorman and Guynn, 2001). As such, it is unlikely that the increase we saw is entirely due to edge effects since our plots are up to 250 m away from the ISE disturbance. The increased abundance in 2016 at the edge effect plots may be attributable to environmental stochasticity or to events in localities other than Hubbard Brook Experimental Forest for the migratory species.
We observed a positive relationship between time of day and detection rates in our morning point count surveys. This pattern may be attributable to the end time of our surveys as well as our as well as our species composition. Point counts were completed before 08:00 h so that other researchers could work in the plots without disrupting our point counts. This timing meant that half of our surveys were conducted in the hour and half following sunrise (05:05–06:35 h) when birds are most detectable by point count surveys and did not extend late enough into the morning to observe a decline in detection rates (Robbins, 1981). In addition, we detected more red-eyed vireos than any other species, and this species has a high detection rate throughout the morning (Robbins, 1981). As such, we did not observe the typical decline in detection rate over time seen in other avian point count studies.
We did not see differences in predation of the plasticine model caterpillars. While the density of caterpillars within each ISE or control plot was equivalent, density on a scale relevant to birds was not. Individual plots were at least an order of magnitude smaller than the territory size of the commonly observed species in this study (Steele, 1992; Cimprich et al., 2000; Sillett et al., 2004). Survival rate increased after day 2 in both sites, indicating that birds may quickly learn that model caterpillars are not food and attack fewer as time goes on. Because ISE plots were closely spaced, birds with territories overlapping the ISE plots were likely to encounter a higher density of caterpillars than birds with territories overlapping the edge effect plots. In turn, the 100 m edge effect plots saw lower predation than the 250 m edge effect plots in both years. Some birds may have had territories that overlap both the ice storm plots and the 100 m edge effect plots, but it is less likely that territories also included the 250 m edge effect plots These patterns were backed by our results, as models with categorical terms representing plot density (site, location, periphery) were all supported models and ranked higher than the null or any models including a treatment effect, exemplifying the importance of these plot density terms in explaining predation patterns. The higher survival rates in the ISE plots could be due to plot proximity. Alternative explanations include foraging height, as our model caterpillars were placed at heights of up to 2 m above ground, which was below the subcanopy and canopy levels frequented by the foliage-gleaning species that increased the most between 2015 and 2016 (≥5 more observations; red-eyed vireo, black-capped chickadee, black-throated green warbler [Setophaga virens]; Sturman, 1968, Robinson and Holmes, 1984). Black-throated blue warblers do forage in the shrub level (<2 m. Robinson and Holmes, 1984), and we observed seven in 2015 and nine in 2016. This limited change in black-throated blue numbers may partially explain why we did not see a change in predation rates in their foraging strata. Therefore, observed predation rates may have resulted from an experimental design with tightly spaced plots or the vertical location of our caterpillars in the forest and is likely not representative of foliage-gleaning bird activity. Background density of real caterpillars may also have influenced predation on our model caterpillars, but logistical challenges of enumerating caterpillar density in a mature closed canopy forest are prohibitive so we could not quantify this factor. Similarly, foliage-gleaning birds will also consume spiders and hemipterans (Holmes and Robinson, 1981), which may increase following disturbance and resulting plant growth in gaps (Schowalter et al., 2017).
The foraging ecology of the bird species we observed undoubtedly affected our caterpillar predation study and the response of different species to ice treatments. Red-eyed vireos which forage in the sub-canopy (Holmes and Robinson, 1981) increased in abundance during our study as did black-capped chickadees which are known to search damaged and dead foliage and wood (Robinson and Holmes, 1982). These two species may have increased in abundance due to the altered vegetation structure and increase in dead and damaged wood that resulted from ice storms. Higher predation on caterpillars attached to hobblebush may be a function of an aversion to foraging on beech by several common insectivorous birds at Hubbard Brook (Holmes and Robinson, 1981).
The relatively small plots that formed our experimental units constrained our ability to draw meaningful conclusions about large scale effects of ice storms on avian abundance and foraging. Given the logistical limits of ice storm simulation, it was important to document the response of this feeding guild to the disturbance we created. These spatial challenges are not unique to our study, as Campbell et al. (2007) studied bird abundance and species richness in natural gaps and group-selection timber harvests at Holt Research Forest in Maine and experienced similar mismatches between the experimental design and the appropriate scale to study the organism of interest. In fact, the most frequent natural disturbances in northeastern North America are small canopy gaps typically 0.0024–0.0126 ha (Seymour et al., 2002). These natural gaps are usually caused by tree senescence, wind, mortality from pathogens or insects and have return intervals of 50–200 years (Seymour et al., 2002). Larger, stand-replacing events such as severe ice storms, as well as wind and fire, occur much less frequently (Seymour et al., 2002). As such, our findings provide insight into avian responses to a common size of gap.
Conclusion
Extreme weather events can alter ecosystems but are unpredictable, greatly hampering efforts to understand their effects. Our replicated experimental ice storms provided rare insight into ecological responses after disturbance. Canopy cover decreased and avian abundance increased in the ice storm-affected area following the ice applications. The small size of the treatments meant that we were unable to observe treatment-specific results for birds, but instead showed a general response in the area where the treatments occurred. Few changes in overall species composition were observed. The increase in avian abundance indicates that foliage-gleaning birds may benefit after ice storms, which is likely due to increased structural heterogeneity following such a disturbance. We also showed both the utility and limitations of plasticine model caterpillars in evaluating changes in relative predation intensity.
Data Availability Statement
The datasets presented in this study can be found in online repositories. The names of the repository/repositories and accession number(s) can be found below: Canopy cover data from the Ice Storm Experiment (ISE) plots ver 1. Environmental Data Initiative. https://doi.org/10.6073/pasta/9ba3206dd451ff4547bf50a75813ca12. Plasticine caterpillar predation data from the Ice Storm Experiment (ISE) plots ver 1. Environmental Data Initiative. https://doi.org/10.6073/pasta/da21d491d547876b62d9fee2ed06b635. Avian point count data from the Ice Storm Experiment (ISE) plots ver 1. Environmental Data Initiative. https://doi.org/10.6073/pasta/a3b6394bb75893b076dce82158b74f5c.
Ethics Statement
Ethical review and approval was not required for the animal study because research did not involve an invasive procedure, harm, or materially alter the behavior of an animal under study. No animals were captured or handled.
Author Contributions
WL: conceptualization, data curation, formal analysis, funding acquisition, investigation, methodology, project administration, resources, software, supervision, validation, visualization, writing—original draft, review, and editing. JC: formal analysis, methodology, software, validation, visualization, and writing—review and editing. LR: conceptualization, funding acquisition, project administration, resources, and writing—review and editing. KW: conceptualization, funding acquisition, methodology, project administration, and writing—review and editing. DP: conceptualization, funding acquisition, methodology, project administration, resources, supervision, writing—original draft, review, and editing. All authors: contributed to the article and approved the submitted version.
Funding
Henrietta and John Simeone Fellowship in Forest Entomology (Received by WL; funded WL stipend and research expenses), SUNY-ESF Seed Grant (Received by DP; funded technician stipend), Leroy C. Stegeman Award in Invertebrate Ecology (Received by WL; Funded research expenses), and SUNY-ESF Graduate Student Association Research Grant (Received by WL; funded research expenses).
Conflict of Interest
The authors declare that the research was conducted in the absence of any commercial or financial relationships that could be construed as a potential conflict of interest.
Acknowledgments
Special thanks to S. Hollister, E. Proutey, G. Schwaner, G. Winant, the Ice Storm Experiment team, and the many individuals who assisted with deployment of plasticine caterpillars. Funding for this project was provided by the Edna Bailey Sussman Foundation (WL), Henrietta and John Simeone Fellowship in Forest Entomology (WL), SUNY-ESF Seed Grant (DP), Leroy C. Stegeman Award in Invertebrate Ecology (WL), and SUNY-ESF Graduate Student Association Research Grant (WL). Funding for the main Ice Storm Experiment was provided by NSF (Grant #1457675). Contents of this manuscript also appeared in WL's Master's thesis (Leuenberger, 2017). We appreciate the feedback from the editor and reviewers of this manuscript.
Supplementary Material
The Supplementary Material for this article can be found online at: https://www.frontiersin.org/articles/10.3389/ffgc.2020.566376/full#supplementary-material
Supplementary Material. It contains methods and results investigating spatial autocorrelation and survival rates of plasticine model caterpillars.
References
Arnone, J. A., Jasoni, R. L., Lucchesi, A. J., Larsen, J. D., Leger, E. A., Sherry, R. A., et al. (2011). A climatically extreme year has large impacts on C4 species in tallgrass prairie ecosystems but only minor effects on species richness and other plant functional groups. J. Ecol. 99, 678–688. doi: 10.1111/j.1365-2745.2011.01813.x
Bates, D., Mächler, M., Bolker, B., and Walker, S. (2014). Fitting linear mixed-effects models using lme4. J. Stat. Softw 67, 1–48. doi: 10.18637/jss.v067.i01
Bereczki, K., Hajdu, K., and Báldi, A. (2015). Effects of forest edge on pest control service provided by birds in fragmented temperate forests. Acta Zool. 61, 289–304. doi: 10.17109/AZH.61.3.7.2015
Bereczki, K., Ódor, P., Csóka, G., Mag, Z., and Báldi, A. (2014). Effects of forest heterogeneity on the efficiency of caterpillar control service provided by birds in temperate oak forests. For. Ecol. Manage 327, 96-105. doi: 10.1016/j.foreco.2014.05.001
Billerman, T. S. M., Keeney, B. K., Rodewald, P. G., and Schulenberg, T. S. (2020). Birds of the World. Ithaca, NY: Cornell Laboratory of Ornithology. Available online at: https://birdsoftheworld.org/bow/support/citations-and-references (accessed April 7, 2020).
Blais, J., Savard, J.-P. L., and Gauthier, J. (2001). Impact of an ice storm on resident bird populations in eastern North America. Forestry Chron. 77, 661–666. doi: 10.5558/tfc77661-4
Blake, J. G., and Hoppes, W. G. (1986). Influence of resource abundance on use of tree-fall gaps by birds in an isolated woodlot. Auk 103, 328–340. doi: 10.1093/auk/103.2.328
Bruederle, L. P., and Stearns, F. W. (1985). Ice storm damage to a southern Wisconsin mesic forest. Bull. Torr. Bot. Club 112, 167–175. doi: 10.2307/2996413
Burnham, K. P., and Anderson, D. R. (2002). Model Selection and Multimodel Inference: A Practical Information-Theoretic Approach. New York, NY: Springer Science & Business Media.
Campbell, J. L., Rustad, L. E., Driscoll, C. T., Halm, I., Fahey, T. J., Fakhraei, H., et al. (2020). Simulating ice storm impacts on forest ecosystems. J. Visual. Exp. 91:e61492. doi: 10.3791/61492
Campbell, S. P., Witham, J. W., and Hunter, J. R. M. L. (2007). Long-term effects of group-selection timber harvesting on abundance of forest birds. Conserv. Biol. 21, 1218–1229. doi: 10.1111/j.1523-1739.2007.00768.x
Cheng, C. S., Li, G., and Auld, H. (2011). Possible impacts of climate change on freezing rain using downscaled future climate scenarios: updated for eastern Canada. Atmos. Ocean 49, 8–21. doi: 10.1080/07055900.2011.555728
Cimprich, D. A., Moore, F. R., and Guilfoyle, M. P. (2000). Red-eyed Vireo (Vireo olivaceus). Birds of North America Online. doi: 10.2173/bna.527
Cook, B. I., and Seager, R. (2013). The response of the North American monsoon to increased greenhouse gas forcing. J. Geophys. Res. 118, 1690–1699. doi: 10.1002/jgrd.50111
Cornell University (2015). All About Birds: Online Bird Guide, Bird ID Help, Life History, Bird Sounds From Cornell. All About Birds. Available online at: https://www.allaboutbirds.org/ (accessed November 26, 2016).
Costello, C. A., Yamasaki, M., Pekins, P. J., Leak, W. B., and Neefus, C. D. (2000). Songbird response to group selection harvests and clearcuts in New Hampshire hardwood forest. For. Ecol. Manage 127, 41–54. doi: 10.1016/S0378-1127(99)00131-0
Dale, V. H., Joyce, L. A., McNulty, S., Neilson, R. P., Ayres, M. P., Flannigan, M. D., et al. (2001). Climate change and forest disturbances: climate change can affect forests by altering the frequency, intensity, duration, and timing of fire, drought, introduced species, insect and pathogen outbreaks, hurricanes, windstorms, ice storms, or landslides. Bioscience 51, 723–734. doi: 10.1641/0006-3568(2001)051[0723:CCAFD]2.0.CO;2
Degelia, S. K., Christian, J. I., Basara, J. B., Mitchell, T. J., Gardner, D. F., Jackson, S. E., et al. (2016). An overview of ice storms and their impact in the United States. Int. J. Climatol. 36, 2811–2822. doi: 10.1002/joc.4525
DeGraaf, R. M., Hestbeck, J. B., and Yamasaki, M. (1998). Associations between breeding bird abundance and stand structure in the White Mountains, New Hampshire and Maine, USA. For. Ecol. Manage 103, 217–233. doi: 10.1016/S0378-1127(97)00213-2
Derleth, E. L., McAuley, D. G., and Dwyer, T. J. (1989). Avian community response to small-scale habitat disturbance in Maine. Can. J. Zool. 67, 385–390. doi: 10.1139/z89-057
Doherty, P. F., White, G. C., and Burnham, K. P. (2012). Comparison of model building and selection strategies. J. Ornithol. 152, 317–323. doi: 10.1007/s10336-010-0598-5
Doran, P. J., and Holmes, R. T. (2005). Habitat occupancy patterns of a forest dwelling songbird: causes and consequences. Can. J. Zool. 83, 1297–1305. doi: 10.1139/z05-127
Dormann, C. F., Elith, J., Bacher, S., Buchmann, C., Carl, G., Carré, G., et al. (2013). Collinearity: a review of methods to deal with it and a simulation study evaluating their performance. Ecography 36, 27–46. doi: 10.1111/j.1600-0587.2012.07348.x
Dupigny-Giroux, L.-A. (2000). Impacts and consequences of the ice storm of 1998 for the North American north-east. Weather 55, 7–15. doi: 10.1002/j.1477-8696.2000.tb04012.x
Faccio, S. D. (2003). Effects of ice storm-created gaps on forest breeding bird communities in central Vermont. For. Ecol. Manage 186, 133–145. doi: 10.1016/S0378-1127(03)00232-9
Fahey, R. T., Atkins, J. W., Campbell, J. L., Rustad, L. E., Duffy, M., Driscoll, C. T., et al. (2020). Effects of an experimental ice storm on forest canopy structure. Can. J. For. Res. 50, 136–145. doi: 10.1139/cjfr-2019-0276
Farnsworth, G. L., Nichols, J. D., Sauer, J. R., Fancy, S. G., Pollock, K. H., Shriner, S. A., et al. (2005). Statistical approaches to the analysis of point count data: a little extra information can go a long way. USDA Forest Serv. 191, 735–743. Available online at: https://www.fs.fed.us/psw/publications/documents/psw_gtr191/psw_gtr191_0736-0743_farnsworth.pdf
Fiske, I., and Chandler, R. (2011). unmarked: An R package for fitting hierarchical models of wildlife occurrence and abundance. J. Stat. Softw. 43, 1–23. doi: 10.18637/jss.v043.i10
Forsman, J. T., Reunanen, P., Jokimäki, J., and Mönkkönen, M. (2010). The effects of small-scale disturbance on forest birds: a meta-analysis. Canad. J. For. Res. 40, 1833–1842. doi: 10.1139/X10-126
Germaine, S. S., Vessey, S. H., and Capen, D. E. (1997). Effects of small forest openings on the breeding bird community in a Vermont hardwood forest. Condor 99, 708–718. doi: 10.2307/1370482
Goodbred, C. O., and Holmes, R. T. (1996). Factors affecting food provisioning of nestling Black-throated Blue Warblers. Wilson Bull 108, 467–479.
Greenberg, C. H., and Lanham, J. D. (2001). Breeding bird assemblages of hurricane-created gaps and adjacent closed canopy forest in the southern Appalachians. For. Ecol. Manage 154, 251–260. doi: 10.1016/S0378-1127(00)00631-9
Hartig, F. (2020). DHARMa: Residual Diagnostics for Hierarchical (Multi-Level/Mixed) Regression Models. R package version 0.3.2.0. Available online at: https://CRAN.R-project.org/package=DHARMa
Higley, L. G., Pedigo, L. P., and Ostlie, K. R. (1986). DEGDAY: a program for calculating degree-days, and assumptions behind the degree-day approach. Environ. Entomol. 15, 999–1016. doi: 10.1093/ee/15.5.999
Hirao, T., Murakami, M., Iwamoto, J., Takafumi, H., and Oguma, H. (2008). Scale-dependent effects of windthrow disturbance on forest arthropod communities. Ecol. Res. 23, 189–196. doi: 10.1007/s11284-007-0370-3
Holmes, R. T., and Robinson, S. K. (1981). Tree species preferences of foraging insectivorous birds in a northern hardwoods forest. Oecologia 48, 31–35. doi: 10.1007/BF00346985
Holmes, R. T., and Schultz, J. C. (1988). Food availability for forest birds: effects of prey distribution and abundance on bird foraging. Can. J. Zool. 66, 720–728. doi: 10.1139/z88-107
Howe, A., Lövei, G. L., and Nachman, G. (2009). Dummy caterpillars as a simple method to assess predation rates on invertebrates in a tropical agroecosystem. Entomol. Exp. Appl. 131, 325–329. doi: 10.1111/j.1570-7458.2009.00860.x
Hutto, R. L., Pletschet, S. M., and Hendricks, P. (1986). A fixed-radius point count method for nonbreeding and breeding season use. Auk 103, 593–602. doi: 10.1093/auk/103.3.593
Irland, L. C. (1998). Ice storm 1998 and the forests of the northeast: a preliminary assessment. J. Forest. 96, 32–40.
Irland, L. C. (2000). Ice storms and forest impacts. Sci. Total Environ. 262, 231–242. doi: 10.1016/S0048-9697(00)00525-8
James, F. C., and Shugart, H. H. (1970). A quantitative method of habitat description. Audobon Field Notes 24, 727–736.
Kayler, Z. E., De Boeck, H. J., Fatichi, S., Grünzweig, J. M., Merbold, L., Beier, C., et al. (2015). Experiments to confront the environmental extremes of climate change. Front. Ecol. Environ. 13, 219–225. doi: 10.1890/140174
Klima, K., and Morgan, M. G. (2015). Ice storm frequencies in a warmer climate. Clim. Change 133, 209–222. doi: 10.1007/s10584-015-1460-9
Lambert, S. J., and Fyfe, J. C. (2006). Changes in winter cyclone frequencies and strengths simulated in enhanced greenhouse warming experiments: results from the models participating in the IPCC diagnostic exercise. Climate Dynamics 26, 713–728. doi: 10.1007/s00382-006-0110-3
Lany, N. K., Ayres, M. P., Stange, E. E., Sillett, T. S., Rodenhouse, N. L., and Holmes, R. T. (2016). Breeding timed to maximize reproductive success for a migratory songbird: the importance of phenological asynchrony. Oikos 125, 656–666. doi: 10.1111/oik.02412
Lent, R. A., and Capen, D. E. (1995). Effects of small-scale habitat disturbance on the ecology of breeding birds in a Vermont (USA) hardwood forest. Ecography 18, 97–108. doi: 10.1111/j.1600-0587.1995.tb00329.x
Leuenberger, W. (2017). Response of larval lepidoptera and their avian predators to experimental ice storms in a northeastern forest (Master's thesis), State University of New York College of Environmental Science and Forestry, Syracuse, NY. doi: 10.1603/ICE.2016.115298
Leuenberger, W., Larsen, E., Leuenberger, J., and Parry, D. (2019). Predation on plasticine model caterpillars: engaging high school students using field-based experiential learning & the scientific process. Am. Biol. Teacher 81, 334–339. doi: 10.1525/abt.2019.81.5.334
Marshall, M. R., and Cooper, R. J. (2004). Territory size of a migratory songbird in response to caterpillar density and foliage structure. Ecology 85, 432–445. doi: 10.1890/02-0548
Marshall, M. R., Cooper, R. J., DeCecco, J. A., Strazanac, J., and Butler, L. (2002). Effects of experimentally reduced prey abundance on the breeding ecology of the Red-eyed Vireo. Ecol. Appl. 12, 261–280. doi: 10.1890/1051-0761(2002)012[0261:EOERPA]2.0.CO;2
Mazerolle, M. J. (2016). AICcmodavg: Model selection and multimodel inference based on (Q)AIC(c). Available at: http://CRAN.R-project.org/package=AICcmodavg
Millward, A. A., and Kraft, C. E. (2004). Physical influences of landscape on a large-extent ecological disturbance: the northeastern North American ice storm of 1998. Landsc. Ecol. 19, 99–111. doi: 10.1023/B:LAND.0000018369.41798.2f
Moorman, C. E., Bowen, L. T., Kilgo, J. C., Sorenson, C. E., Hanula, J. L., Horn, S., et al. (2007). Seasonal diets of insectivorous birds using canopy gaps in a bottomland forest. J. Field Ornithol. 78, 11–20. doi: 10.1111/j.1557-9263.2006.00081.x
Moorman, C. E., and Guynn, D. C. (2001). Effects of group-selection opening size on breeding bird habitat use in a bottomland forest. Ecol. Appl. 11, 1680–1691. doi: 10.1890/1051-0761(2001)011[1680:EOGSOS]2.0.CO;2
Muiruri, E. W., Rainio, K., and Koricheva, J. (2015). Do birds see the forest for the trees? Scale-dependent effects of tree diversity on avian predation of artificial larvae. Oecologia. 180, 619–630. doi: 10.1007/s00442-015-3391-6
Newell, F. L., Beachy, T.-A., Rodewald, A. D., Rengifo, C. G., Ausprey, I. J., and Rodewald, P. G. (2014). Foraging behavior of Cerulean Warblers during the breeding and non-breeding seasons: evidence for the breeding currency hypothesis. J. Field Ornithol. 310–320. doi: 10.1111/jofo.12070
Nielsen, C., Van Dyke, O., and Pedlar, J. (2003). Effects of past management on ice storm damage in hardwood stands in eastern Ontario. Forest. Chron. 79, 70–74. doi: 10.5558/tfc79070-1
Petit, D. R., Petit, L. J., Saab, V. A., Martin, T. E., and others (1995). Fixed-Radius Point Counts in Forests: Factors Influencing Effectiveness and Efficiency. Monitoring Bird Populations By Point Counts. United States Forest Service, General Technical Report, PSW-GTR-149, Albany, CA, 49–56.
R Core Team (2019). R: A Language and Environment for Statistical Computing. Vienna: R Foundation for Statistical Computing. Available online at: http://www.R-project.org/
Ralph, C. J., Geupel, G. R., Pyle, P., Martin, T. E., and DeSante, D. F. (1993). Handbook of Field Methods for Monitoring Landbirds. USDA Forest Service/UNL Faculty Publications Paper 105. Available online at: https://works.bepress.com/thomas_e_martin/8/ (accessed September 17, 2016).
Rhoads, A. G., Hamburg, S. P., Fahey, T. J., Siccama, T. G., Hane, E. N., Battles, J., et al. (2002). Effects of an intense ice storm on the structure of a northern hardwood forest. Canad J. Forest Res. 32, 1763–1775. doi: 10.1139/x02-089
Richards, L. A., and Coley, P. D. (2008). Combined effects of host plant quality and predation on a tropical Lepidopteran: A comparison between treefall gaps and the understory in Panama. Biotropica 40, 736–741. doi: 10.1111/j.1744-7429.2008.00438.x
Robinson, S. K., and Holmes, R. T. (1982). Foraging behavior of forest birds: the relationships among search tactics, diet, and habitat structure. Ecology 63, 1918–1931. doi: 10.2307/1940130
Robinson, S. K., and Holmes, R. T. (1984). Effects of plant species and foliage structure on the foraging behavior of forest birds. Auk 101, 672–684. doi: 10.2307/4086894
Rodenhouse, N. L., and Holmes, R. T. (1992). Results of experimental and natural food reductions for breeding Black-throated Blue Warblers. Ecology 73, 357–372. doi: 10.2307/1938747
Royle, J. A. (2004). N-Mixture models for estimating population size from spatially replicated counts. Biometrics 60, 108–115. doi: 10.1111/j.0006-341X.2004.00142.x
Rubin, B. D., and Manion, P. D. (2001). Landscape-scale forest structure in northern New York and potential successional impacts of the 1998 ice storm. Forestry Chronicle 77, 613–618. doi: 10.5558/tfc77613-4
Runkle, J. R. (1982). Patterns of disturbance in some old-growth mesic forests of eastern North America. Ecology 63, 1533–1546. doi: 10.2307/1938878
Rustad, L. E., and Campbell, J. L. (2012). A novel ice storm manipulation experiment in a northern hardwood forest. Canad. J. Forest Res. 42, 1810–1818. doi: 10.1139/x2012-120
Rustad, L. E., Campbell, J. L., Driscoll, C. T., Fahey, T. J., Groffman, P. M., Schaberg, P. G., et al. (2020). Experimental approach and initial forest response to a simulated ice storm experiment in a northern hardwood forest. PLoS ONE 15:e0239619. doi: 10.1371/journal.pone.0239619
Ryall, K. L., and Smith, S. M. (2005). Patterns of damage and mortality in red pine plantations following a major ice storm. Canad. J. For. Res. 35, 487–493. doi: 10.1139/x04-180
Sanz, J. J. (2001). Experimentally increased insectivorous bird density results in a reduction of caterpillar density and leaf damage to Pyrenean oak. Ecol. Res 16, 387–394. doi: 10.1046/j.1440-1703.2001.00403.x
Schowalter, T. D., Willig, M. R., and Presley, S. J. (2017). Post-hurricane successional dynamics in abundance and diversity of canopy arthropods in a tropical rainforest. Environ. Entomol. 93:155. doi: 10.1093/ee/nvw155
Seischab, F. K., Bernard, J. M., and Eberle, M. D. (1993). Glaze storm damage to western New York forest communities. Bull. Torrey Bot. Club 120, 64–72. doi: 10.2307/2996665
Seymour, R. S., White, A. S., and deMaynadier, P. G. (2002). Natural disturbance regimes in northeastern North America - evaluating silvicultural systems using natural scales and frequencies. For. Ecol. Manage 155, 357–367. doi: 10.1016/S0378-1127(01)00572-2
Sillett, T. S., Rodenhouse, N. L., and Holmes, R. T. (2004). Experimentally reducing neighbor density affects reproduction and behavior of a migratory songbird. Ecology 85, 2467–2477. doi: 10.1890/03-0272
Singer, M. S., Farkas, T. E., Skorik, C. M., and Mooney, K. A. (2012). Tritrophic interactions at a community level: effects of host plant species quality on bird predation of caterpillars. Am. Natural. 179, 363–374. doi: 10.1086/664080
Singer, M. S., Lichter-Marck, I. H., Farkas, T. E., Aaron, E., Whitney, K. D., and Mooney, K. A. (2014). Herbivore diet breadth mediates the cascading effects of carnivores in food webs. Proc. Natl. Acad. Sci. U.S.A. 111, 9521–9526. doi: 10.1073/pnas.1401949111
Steele, B. B. (1992). Habitat selection by breeding black-throated blue warblers at two spatial scales. Ornis Scand. 23, 33–42. doi: 10.2307/3676425
Stoepler, T. M., and Lill, J. T. (2013). Direct and indirect effects of light environment generate ecological trade-offs in herbivore performance and parasitism. Ecology 94, 2299–2310. doi: 10.1890/12-2068.1
Sturman, W. A. (1968). The foraging ecology of Parus atricapillus and P. rufescens in the breeding season, with comparisons with other species of Parus. Condor 70, 309–322. doi: 10.2307/1365925
Swaminathan, R., Sridharan, M., and Hayhoe, K. (2018). A computational framework for modelling and analyzing ice storms. arXiv:1805.04907.
Takafumi, H., Kawase, S., Nakamura, M., and Hiura, T. (2010). Herbivory in canopy gaps created by a typhoon varies by understory plant leaf phenology. Ecol. Entomol 35, 576–585. doi: 10.1111/j.1365-2311.2010.01216.x
The Weather Company LLC (2016). Weather History for Plymouth, NH | Weather Underground. Available online at: https://www.wunderground.com/history/airport/K1P1/2016/4/1/CustomHistory.html?dayend=23&monthend=6&yearend=2016&req_city=&req_state=&req_statename=&reqdb.zip=&reqdb.magic=&reqdb.wmo= (accessed December 6, 2016).
Townsend, A. K., Cooch, E. G., Sillett, T. S., Rodenhouse, N. L., Holmes, R. T., and Webster, M. S. (2016). The interacting effects of food, spring temperature, and global climate cycles on population dynamics of a migratory songbird. Glob. Chang. Biol. 22, 544–555. doi: 10.1111/gcb.13053
Weeks, B. C., Hamburg, S. P., and Vadeboncoeur, M. A. (2009). Ice storm effects on the canopy structure of a northern hardwood forest after 8 years. Canad. J. For. Res. 39, 1475–1483. doi: 10.1139/X09-076
Whelan, C. J., Sekercioglu, Ç. H., and Wenny, D. G. (2015). Why birds matter: from economic ornithology to ecosystem services. J. Ornithol. 156, 227–238. doi: 10.1007/s10336-015-1229-y
Wuebbles, D., Meehl, G., Hayhoe, K., Karl, T. R., Kunkel, K., Santer, B., et al. (2014). CMIP5 climate model analyses: climate extremes in the United States. Bull. Am. Meteor. Soc. 95, 571–583. doi: 10.1175/BAMS-D-12-00172.1
Keywords: abundance, avian community, disturbance, extreme weather events, ice storms, lepidoptera, northern hardwood forest, predation
Citation: Leuenberger W, Cohen JB, Rustad L, Wallin KF and Parry D (2021) Short-Term Increase in Abundance of Foliage-Gleaning Insectivorous Birds Following Experimental Ice Storms in a Northern Hardwood Forest. Front. For. Glob. Change 3:566376. doi: 10.3389/ffgc.2020.566376
Received: 27 May 2020; Accepted: 24 November 2020;
Published: 26 February 2021.
Edited by:
Jess K. Zimmerman, University of Puerto Rico, Puerto RicoReviewed by:
Steven D. Faccio, Vermont Center for Ecostudies (VCE), United StatesJoseph Wunderle, United States Forest Service (USDA), United States
Copyright © 2021 Leuenberger, Cohen, Rustad, Wallin and Parry. This is an open-access article distributed under the terms of the Creative Commons Attribution License (CC BY). The use, distribution or reproduction in other forums is permitted, provided the original author(s) and the copyright owner(s) are credited and that the original publication in this journal is cited, in accordance with accepted academic practice. No use, distribution or reproduction is permitted which does not comply with these terms.
*Correspondence: Wendy Leuenberger, d2xldWVuYmVAc3lyLmVkdQ==
†Present address: Wendy Leuenberger, Department of Integrative Biology and the Ecology, Evolution, and Behavior Program, Michigan State University, East Lansing, MI, United States
Kimberly F. Wallin, College of Science and Mathematics, North Dakota State University, Fargo, ND, United States