 Phil C. Saksa1,2*
 Roger C. Bales
- 1Sierra Nevada Research Institute, University of California, Merced, Merced, CA, United States
- 2Now at Blue Forest, Sacramento, CA, United States
- 3Bren School of Environmental Science & Management, University of California, Santa Barbara, Santa Barbara, CA, United States
We used a hydro-ecologic model (RHESSys) constrained by measurements of stream discharge, and spatially distributed snow and soil moisture, to simulate the impacts of operational forest treatments, historical wildfire and climate warming on productive mixed-conifer forests. We compared the response of two headwater catchments at the rain-snow-transition elevation in the wetter central Sierra and more water-limited southern Sierra. The variability of precipitation exerted a greater influence on annual evapotranspiration and runoff than vegetation changes from operational fuels treatment or historical wildfire. The short-term impacts of vegetation changes associated with wildfire, however, did have a greater effect on evapotranspiration and runoff than temperature increases in a warming climate. The average central-Sierra headwater response of evapotranspiration and runoff to fuels treatments (−12%, +12%, respectively) and wildfire (−43%, +46%) were greater than the projected responses to a 4.5°C temperature increase (+2 and −7%). The response in the southern Sierra was limited by lower annual precipitation and showed no response to fuels treatments; but the catchment showed respective changes of −11 and +17% in evapotranspiration and runoff for wildfire, versus +9 and −3% to a 4.5°C temperature increase. These results suggest that in the central Sierra, reductions in vegetation from either fuels treatments or historical wildfire can, temporarily, offset reductions in streamflow from a warming climate. In the southern Sierra, impacts of fuels treatments were small, and only more-extensive vegetation removal as would occur with wildfire, results in significant changes in hydrologic fluxes. Further research is needed to investigate how initial hydrologic changes and climate effects evolve as vegetation adapts and regrows following disturbance.
Introduction
It has long been known that mountain watersheds such as those on the western slopes of the Sierra Nevada, and the critical water supplies originating in these areas, are sensitive to climate warming (Pupacko, 1993; Jeton et al., 1996). Many of the winter storms that provide the deep seasonal snowpack in the western Sierra occur at temperatures above −3°C (Bales et al., 2006), making precipitation vulnerable to a transition toward a higher rainfall fraction and reduced snowpack storage in a warmer climate (Knowles, 2002; Miller et al., 2003). The frequency of wildfires is also increasing in western U.S. forests as the temperatures warm, and fuel loads remain high, the legacy of a century-long history of suppressing the frequent low-intensity fires that previously kept vegetation densities low (Westerling et al., 2006). Climate warming is changing the timing, amount and quality of mountain water supplies, as demand pressures grow and as policy requires balancing statewide water supply and demand.
Climate projections for California point to a 3.1–5.0°C increase in temperatures by the year 2100, with annual precipitation increasing or decreasing as much as 15% (Pierce et al., 2018). Greater changes in Sierra Nevada precipitation are possible by 2050–2100, as indicated under a high-emissions scenario (Garfin et al., 2013). While confidence in precipitation projections is low to medium, taken together the projected temperature and precipitation reinforce the need to consider climate scenarios that are hotter and drier than even the most-severe droughts of the past 1100 years (Griffin and Anchukaitis, 2014).
One of the impacts from climate warming is an increase in the fraction of precipitation falling as rain versus snow and effects on runoff will depend on both climate and land use attributes (Bales et al., 2018). However, Berghuijs et al. (2014) suggested that catchments with a higher fraction of snowfall have higher streamflow than would otherwise be expected from precipitation and potential evaporation. A number of studies focusing on watershed response to changes in climate have been completed for the western slope of the Sierra Nevada, which has been identified as more sensitive to changes in temperature than the eastern slope due to the larger area of lower elevation (Pupacko, 1993). For projected temperature increases of 2–5°C in the American and Merced river basins, and no change in precipitation amount or timing, Dettinger et al. (2004) reported that average-annual runoff generally remained constant, despite changes in the fraction of precipitation falling as rain and earlier snowmelt. These trends that have already been observed in the last half of the twentieth century (Stewart et al., 2004). An analysis of historical streamflow in the Sacramento River basin found that the interannual variability in precipitation explained 95% of differences in annual streamflow volumes while only 3% was explained by temperature (Risbey and Entekhabi, 1996), consistent with the minimum 80% of streamflow explained by precipitation reported by Duell (1994).
Wildfire is one of the key risks to North American ecosystems from climate change (Romero-Lankao et al., 2014). Westerling et al. (2006) discuss the competing influences of climate and forest management on increasing wildfire occurrence across the western U.S., suggesting that although recent climate change was the primary driver in Northern California, fire exclusion is also an important contributing factor in this region. In response to these changing conditions, Millar et al. (2007) encourage a proactive planning approach for forest management. Fuels treatments are an effective forest-management tool for mitigating wildfire risk in Sierra Nevada forests (Stephens, 1998; Collins et al., 2011; Stephens et al., 2013), and include selective thinning and prescribed burning for promoting fire-resilient landscapes (Agee and Skinner, 2005).
Forest-vegetation density and structure impact the interception of precipitation (Storck et al., 2002; Moeser et al., 2015), evapotranspiration amounts (Dore et al., 2010, 2012; Hawthorne et al., 2013), and the surface energy balance for snowmelt (Essery et al., 2008; Ellis et al., 2011; Mahat and Tarboton, 2012; Lundquist et al., 2013). Molotch and Meromy (2014) found elevation, temperature and precipitation were more influential than vegetation, using regression-tree analysis to rank relative physiographic and climatic influence on snow cover for the major Sierra Nevada watersheds. A modeling study using the Distributed Hydrology Soil Vegetation Model (DHSVM; Wigmosta et al., 1994) suggested that both forest cover and temperature increases will have significant, non-linear effects on snowpack and streamflow in the upper Tuolumne (Cristea et al., 2014). The relative effects of temperature and vegetation may then depend on the specific montane elevation range, vegetation type, and annual precipitation received in a watershed, requiring more-localized analyses to determine the dominant influences on evapotranspiration and runoff.
The specific aim of this study was to project the interacting effects of climate warming with forest treatments and disturbance on the annual water balance of productive Sierra Nevada mixed-conifer forests in the elevation range that transitions from rain- to snow-dominated precipitation (1500–2500 m). We focus on the extent to which reductions in vegetation that are consistent with relatively light thinning prescriptions and historical wildfire versus increasing temperatures will affect the partitioning of precipitation between evapotranspiration versus runoff.
Materials and Methods
This study used a hydro-ecologic model, the Regional Hydro-Ecologic Simulation System (RHESSys version 5.14.7; Tague and Band, 2004), to integrate distributed-snow, distributed-soil-moisture and stream-discharge measurements, and to project water-balance response of two Sierra Nevada mixed-conifer headwater catchments to temperature and vegetation perturbations. Extensive catchment and model descriptions are available in Saksa et al. (2017), with the most-relevant information provided here. Two types of vegetation change were simulated, a forest-thinning treatment implemented in 2012, and impacts of wildfires modeled with and without the thinning. Projected temperature increases from two climate scenarios were also simulated, Representative Concentration Pathways (RCP) 4.5 and 8.5, at 2050 and 2100. The climate and vegetation scenarios were then simulated together to determine the dominant factors controlling evapotranspiration and runoff, assessed over the range of dry-to-wet precipitation conditions observed during a 4-year period (2010–2013) for which field measurements were carried out.
Study Sites
Two headwater catchments at different latitudes along the western slope of the Sierra Nevada were monitored for climate, stream discharge, distributed snow depth and soil moisture during water years 2010–2013 (Figure 1). Bear Trap Creek (1.4 km2, 1560–1826 m elev) is located in the headwaters of the American River basin, in the central Sierra, and Big Sandy Creek (2.2 km2, 1776–2475 m elev) is located in the Merced River Basin, in the southern Sierra. Observed discharge was calculated from stream-level data recorded every 15 min, and a stage-discharge relationship developed for each stream. The catchments are dominated by mixed-conifer forests, a forest type covering 13–14% (∼52,500–56,500 km2) of California (Barbour and Minnich, 2000), and have well-drained soils, classified as loamy-sand in Bear Trap and sandy or sandy-loam in the Big Sandy catchment. The headwaters receive a mix of rain and snow precipitation at the elevation of the catchment outlet, but are snow dominated at the upper elevations, suggesting these basins would be sensitive to lower snowfall and higher rainfall from increases in temperature.
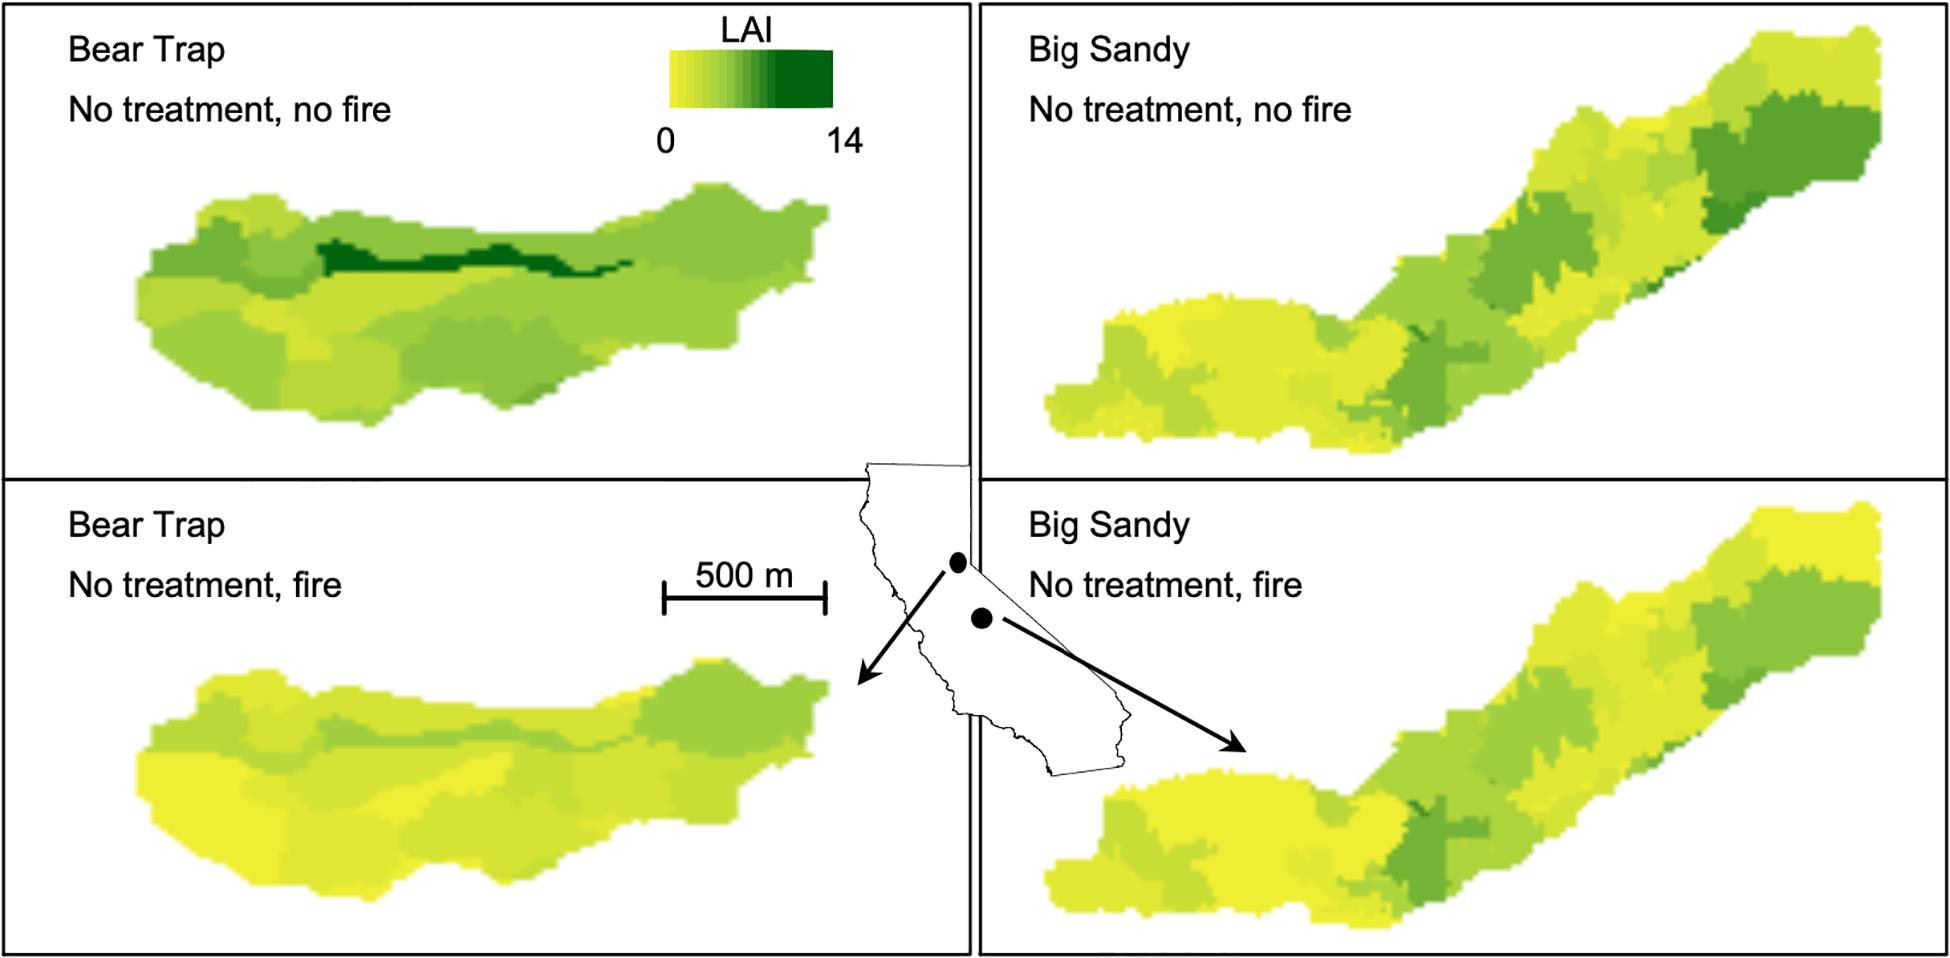
Figure 1. Leaf Area Index (LAI) values in the Bear Trap and Big Sandy catchments in the highest (no treatment, no fire) and lowest (no treatment, fire) vegetation density scenarios.
Model Scenarios
Four vegetation scenarios were combined with climate projections to determine dominant influences in forest hydrology: no-treatment, thinning-treatment, no-treatment with wildfire, and thinning-treatment with wildfire. Strategically Placed Landscape Treatments (SPLATs; Finney, 2001), a fuels treatment strategy to lower the risk of high-severity fire by treating part of the landscape, were implemented at the fireshed scale during the summer of 2012. As part of SPLAT implementation on a larger fireshed, the mixed-conifer forest was selectively thinned in 95% of the Bear Trap catchment and in 32% of the Big Sandy catchment. It should be noted that these treatments reflect operational decisions of the local forest managers, which are constrained by topography, wildlife habitat, public input, budgets and other factors (North et al., 2015; Lydersen et al., 2019). LiDAR data, described in Kelly and Guo (2015), was used to determine vegetation-community type, and forest-plot measurements were performed before and after SPLAT implementation. Forest plot data were used to impute forest-structure characteristics into the individual vegetation areas (Su et al., 2016), to capture vegetation changes in both horizontal (canopy cover) and vertical (Leaf Area Index) (Saksa et al., 2017).
Understory-vegetation cover was also estimated using a linear equation developed from forest-plot data relating basal area and canopy cover with shrub-cover fraction (Hopkinson and Battles, 2015). The vegetation densities before and after fuels treatments were used to run the Forest Vegetation Simulator (FVS; Dixon, 2002) with the Fire and Fuels Extension (FFE; Reinhardt and Crookston, 2003) and the Fire Area Simulator (FARSITE; Finney, 2004) to project treatment impacts on wildfire severity and vegetation mortality (Fry et al., 2015). As the fire model was calibrated with recent observations, the post-fire vegetation scenarios reflect fire behavior under current climate conditions. FVS was then used to estimate forest-vegetation regrowth for 10 years after the simulated fire events. Following the 10 years of regrowth, overstory canopy cover was transferred directly from FVS, and LAI was calculated from tree lists using allometric estimates.
The model did not consider changes in surface characteristics such as soil hydrophobicity, reduced soil-infiltration capacity, and diminished litter cover that can occur immediately after fire. While these can be important in more semi-arid regions, the impacts are likely to be small in this region where hydraulic conductivity is quite high in the loamy-sand to sandy-soil textures, and infiltration excess runoff production is relatively rare. Wildfire simulations were based on current 95th percentile weather and fuel moisture conditions, as more extreme weather and wildfire events are expected with climate warming, we consider this a conservative scenario.
The climate scenarios were based on changes projected in the minimum and maximum daily temperatures for RCP 4.5, defined as a 4.5 W m–2 increase in radiative forcing relative to pre-industrialization with stabilization by 2100; and for RCP 8.5, which represents an 8.5 W m–2 radiative increase by 2100 that continues to rise (van Vuuren et al., 2011). Mean-annual minimum and maximum temperature anomalies were calculated using the 4-year annual mean of 2010–2013 as a baseline. The 4-year baseline period was + 0.4°C (−0.2°C to +0.9°C) and + 0.1°C (−0.8°C to + 0.9°C) of the long-term climate mean for minimum and maximum temperature in the Sierra climate region, respectively (California Climate Tracker; Abatzoglou et al., 2009). A 4-year trailing ensemble mean was calculated using the Coupled Model Intercomparison Project Phase 5 (CMIP5) output for the Community Climate System Model version 4 (CCSM4) and the Model for Interdisciplinary Research on Climate version 5 (MIROC5) (Figure 2). These models were chosen because they showed low error in bias analyses (Kattsov et al., 2013), and both were archived in the CMIP5 database with the required daily minimum and maximum temperatures. Using the temperature anomalies to produce a uniform offset in minimum and maximum temperatures on our observed-temperature data set aside the need for downscaling climate projections. Vapor pressure and relative humidity were derived using standard air temperature relationships in the model simulations (Tague and Band, 2004), and respond accordingly with increasing temperatures. Impacts on snowpack from vapor pressure and relative humidity are minor, with greater differences during the ablation period in higher elevations and wetter years (Roche et al., 2018a).
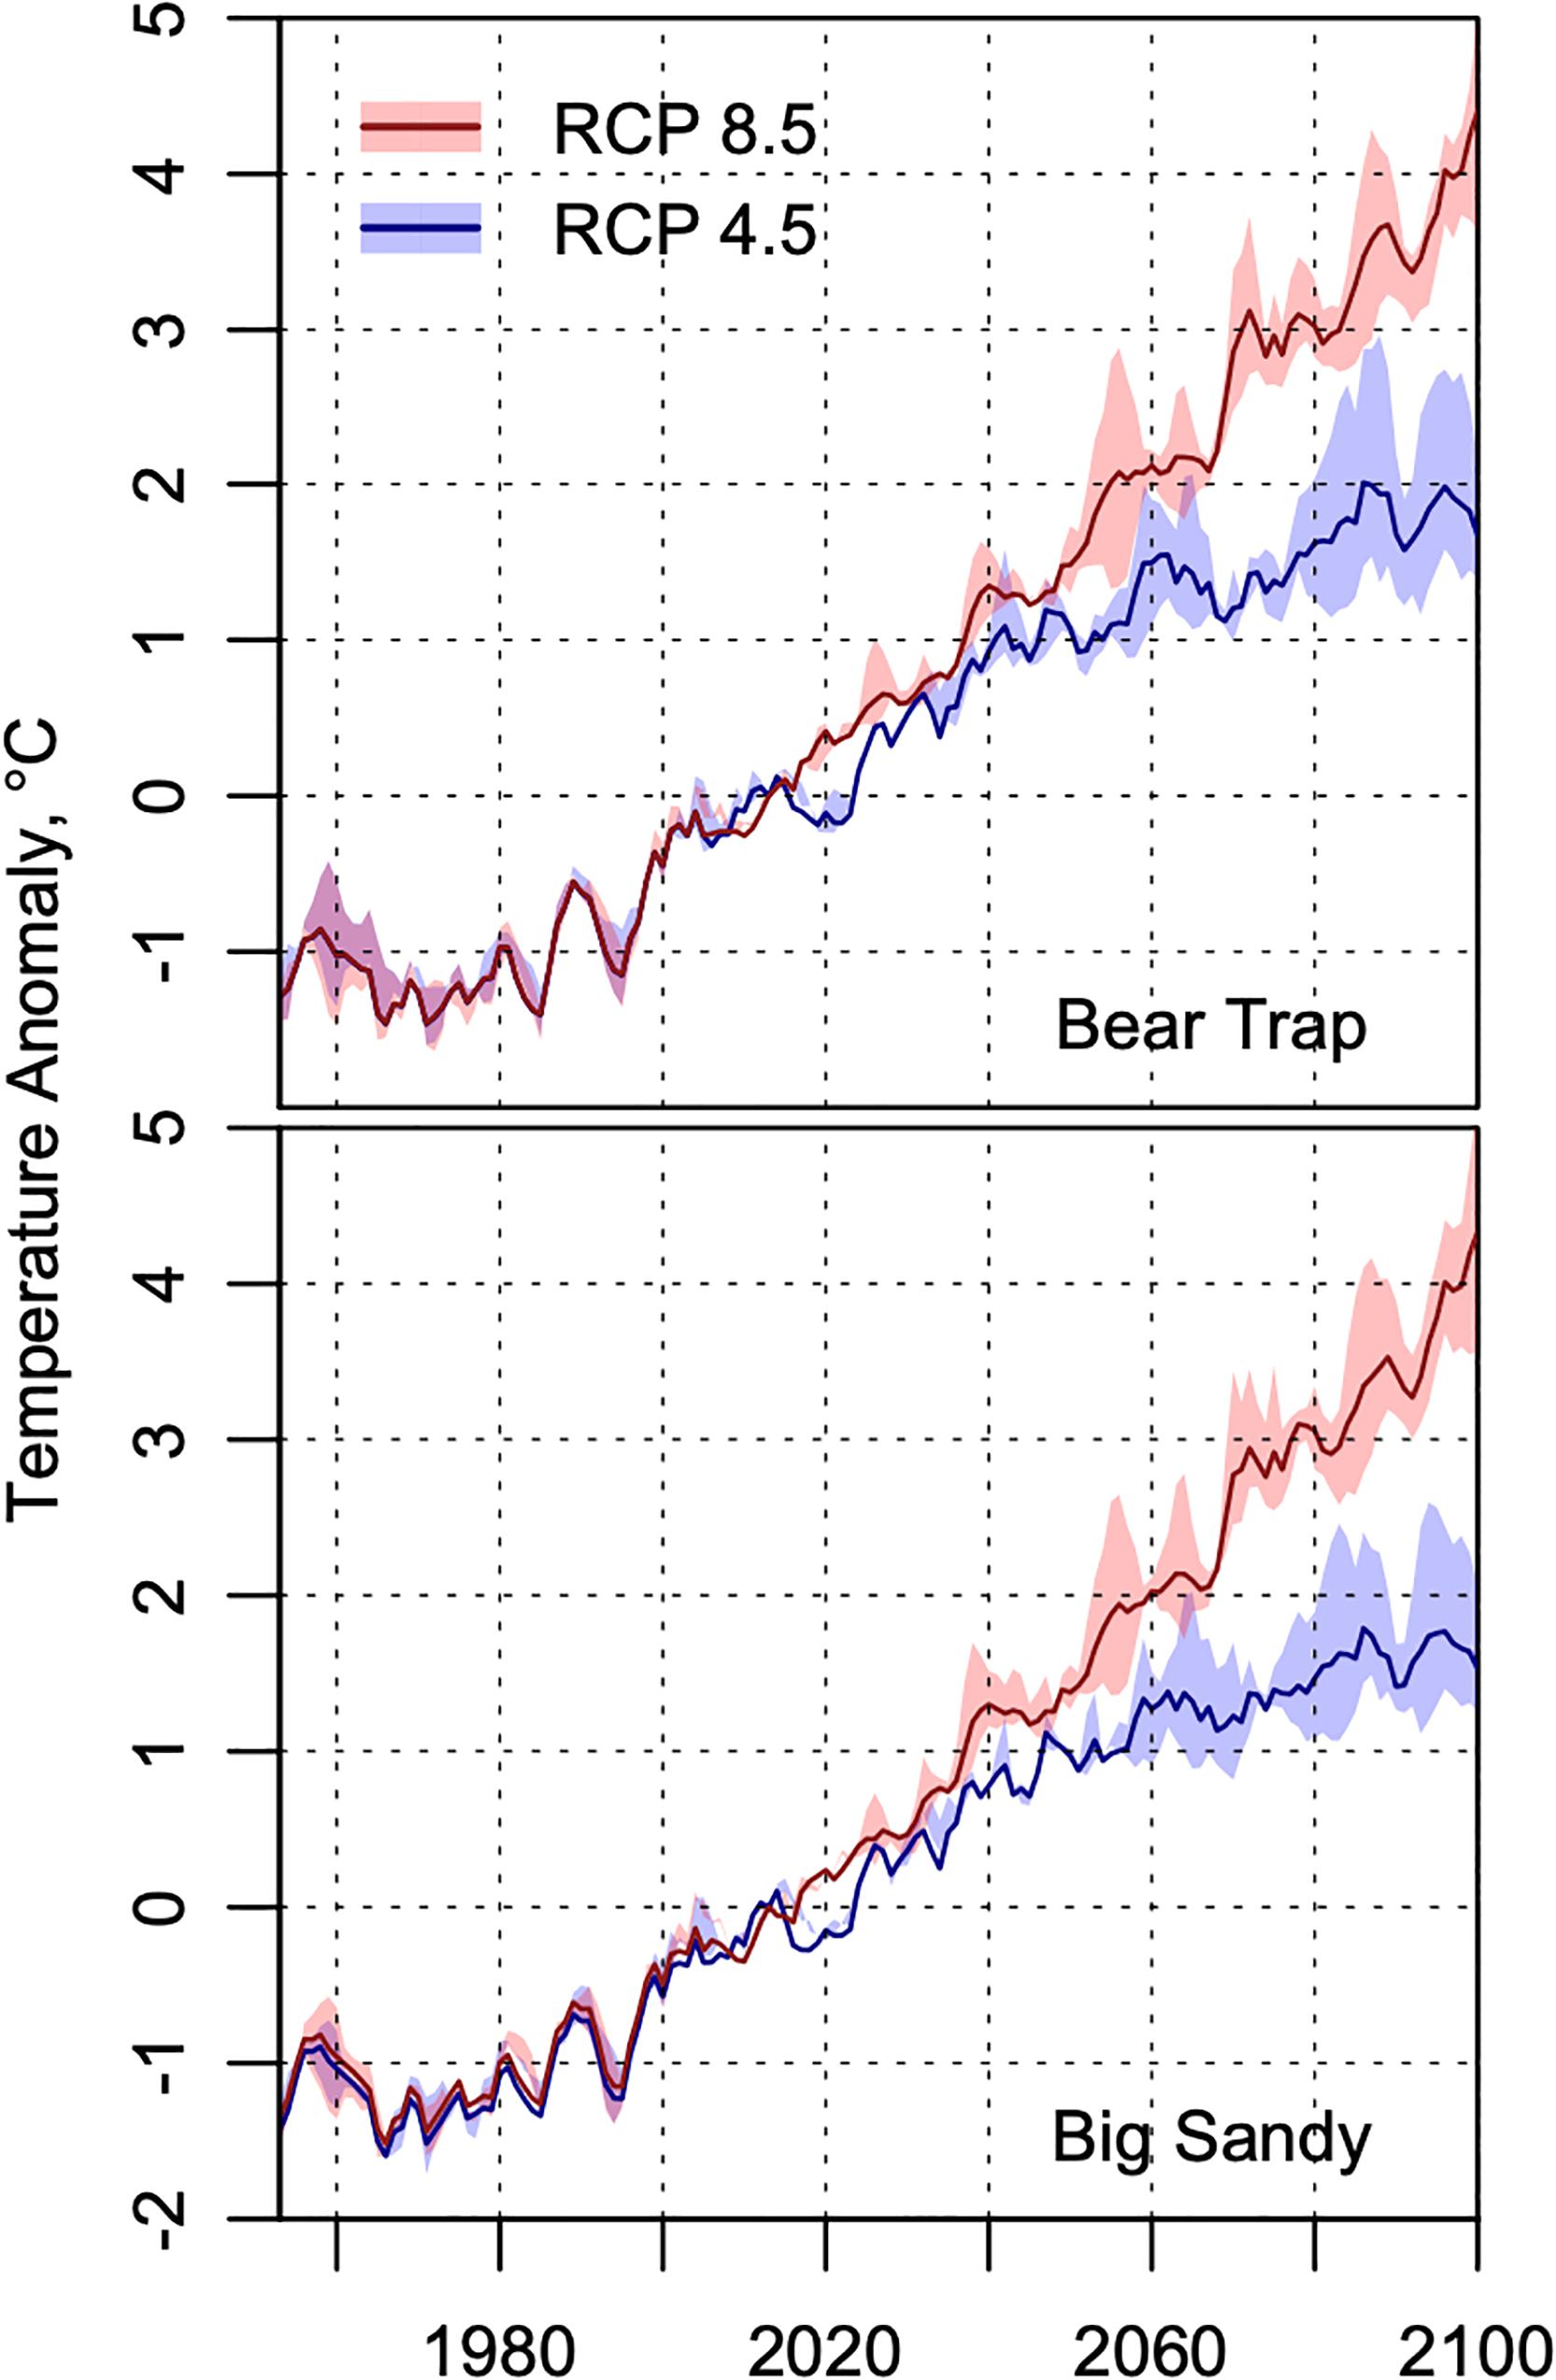
Figure 2. Climate-scenario temperature anomalies based on the 2010–2013 4-year mean. Each line connects data points for annual-mean temperature anomalies calculated as a 4-year trailing mean from 1950 to 2100. Shaded areas note the range of daily minimum and maximum temperature anomalies from the two climate scenarios used to calculate the mean.
Water-Balance Model
RHESSys was used to simulate the hydrologic response to vegetation and climate scenarios. Model calibration was completed for the pre-thinning water years of 2010–2012, during which annual precipitation varied from drier than normal (−39%) to wetter than normal (+60%) conditions in the Sierra Nevada (Saksa et al., 2017). Drainage and subsurface-storage processes were calibrated by comparing simulated and observed streamflow at a daily time step, with precipitation not attributed to evapotranspiration or runoff considered subsurface bypass flow, a comprehensive term to account for all subsurface storage and routing, as in Saksa et al. (2017). Garcia et al. (2013) provides additional details on RHESSys storage and drainage parameters and standard calibration. Monte-Carlo style calibrations were completed by running 5000 sets of random parameters and selecting the parameter sets that conformed to a Nash-Sutcliffe and log-transformed Nash-Sutcliffe statistic higher than 0.60, as well as annual and August streamflow rates within 25% of observed values. Six parameter sets met the criteria for the Bear Trap catchment and 17 sets were acceptable for the Big Sandy catchment, providing a range of modeled responses to temperature and vegetation perturbations.
Increasing temperatures at the elevation range of these catchments will have a significant impact on the amount of precipitation received as snow versus rain, and the persistence of snowpack during the winter and into spring. RHESSys calibration was completed using a separate rain and snow precipitation input, and changes to initial snowfall rates were implemented using the linear transition of snowfall temperatures in the model, from −1 to 3°C. Three inputs contribute to snowmelt rates: temperature, precipitation falling as rain, and radiation. All three components are affected by air temperature, and the relevant top-level equations are listed below from Tague and Band (2004). Melt attributed to temperature is based on an empirical relationship to sensible and latent heat, and is calculated as:
where βMT is the temperature-index melt coefficient, calibrated to 0.0005 for Bear Trap and 0.001 for Big Sandy, Tair is the temperature in Celsius and F is the fraction of forest cover. Snowmelt from advection due to rainfall is calculated as:
where ρwater is the density of water, TF is net throughfall onto the snowpack, cpwater is the heat capacity of water, and λf is the latent heat of fusion. Lastly, melt due to radiation is calculated as:
where Kdirect and Kdiffuse are direct and diffuse net shortwave radiation, and L is net longwave radiation. Melt only occurs when the snowpack is ripe, but snow loss also can occur by sublimation from radiation energy input, calculated by adding the latent heat of vaporization to the latent heat of fusion in Eq. 3 (λf + λv).
RHESSys was also used to estimate overstory and understory transpiration and evaporation of water intercepted by forest canopy and litter, as well as soil evaporation and snow sublimation. RHESSys simulates vertical infiltration and drainage between surface storage, plant rooting zone, and unsaturated and saturated zones. Lateral redistribution of water follows topography. Previous application of RHESSys in snow-dominated mountain environments demonstrates that the model can capture the impact of climate variation on eco-hydrologic processes such as streamflow (Zierl et al., 2007; Garcia et al., 2013), the impact of increases in atmospheric carbon dioxide concentration on conifer net primary productivity and water use efficiency (Vicente-Serrano et al., 2015), and snowpack (Christensen et al., 2008; Godsey et al., 2013; Morán-Tejeda et al., 2014; Bart et al., 2016). Additional details on RHESSys process representation can be found in these studies, plus Tague and Band (2004), and the open-access code maintained online1.
Results
Vegetation and Climate Changes
Mean-annual water-balance components of evapotranspiration and runoff were assessed in response to vegetation and climate scenarios over the complete observation period (water years 2010–2013). Mean annual precipitation for this period was 1990 mm in Bear Trap and 1300 mm in Big Sandy. Selective thinning implemented in Bear Trap reduced mean LAI (Canopy Cover) from 9.9 (0.51) to 9.1 (0.49), with reductions from modeled wildfire being 8.8 (0.37) with SPLATs and 7.7 (0.29) without SPLATs. Wildfire in the catchment had a mean flame length of 2.2 m and crowning in 42% of the area without SPLATs, reduced to a mean flame length of 1.2 m and crowning in 19% of the area with SPLATs.
Mean LAI in Big Sandy was 5.0 (0.55 Canopy Cover), and the limited commercial thinning did not reduce the mean catchment LAI substantially (change of < 0.1). A small section of Big Sandy was thinned, with LAI being reduced by as much as 4.0; but the minor amount of area thinned combined with incremental increases in growth elsewhere led to the small changes in basin-scale LAI. Wildfire in Big Sandy reduced LAI to 3.8 (0.47 Canopy Cover), with thinning prior to wildfire having an insignificant effect. Because of the limited catchment-scale thinning impacts on Big Sandy, results are only reported for the no-treatment and post-fire vegetation change. Wildfire in the catchment had a mean flame length of 1.5 m and crowning in 22% of the area.
Observed mean-daily winter temperatures during the months of heaviest precipitation (Nov-Apr), were 4.3°C in both Bear Trap and Big Sandy catchments. Projected increases in mean-annual temperature with RCP 4.5 were 1.2°C by 2050 and 1.6°C by 2100 in Bear Trap, with slightly smaller increases at Big Sandy, 1.0°C by 2050 and 1.4°C by 2100. In the RCP 8.5 projections, temperature increases by 2050 and 2100 are 1.8 and 4.7°C in Bear Trap and 1.6 and 4.4°C in Big Sandy, respectively.
Water-Balance Simulations
Simulations showed that vegetation changes had much greater effects on runoff and evapotranspiration than did the changes in temperature (Figure 3). Ninety-five percent confidence intervals were calculated for the 6 Bear Trap and 17 Big Sandy model calibrations, with runoff and evapotranspiration responses reported as fractions of precipitation. Confidence intervals were small for both pre-treatment and post-fire scenarios in Big Sandy. Confidence intervals in Bear Trap increased with decreasing vegetation and resulted in higher uncertainty of water-balance response with greater vegetation disturbance. In Bear Trap, the scenario of greatest vegetation change (no treatment, fire) increased the mean runoff fraction by 0.20 (from 0.44 to 0.64) and decreased the mean fraction of evapotranspiration by 0.20 (from 0.47 to 0.27), in response to the 22% LAI decrease (from 9.9 to 7.7) and 42% canopy decrease (0.51 to 0.29). This is equivalent to a drop in ET of about 398 mm yr–1, from 935 to 537 mm yr–1 (Figure 4). In comparison, the climate scenario of greatest temperature increases (RCP 8.5, 2100) with no change in vegetation resulted in a smaller reduction in runoff, from 0.44 to 0.41, and smaller evapotranspiration increase, from 0.47 to 0.48. Responses of mean runoff and evapotranspiration fractions in 2050 and 2100 to RCP 4.5 temperature increases were limited to less than 0.03, as was the response to RCP 8.5 in 2050.
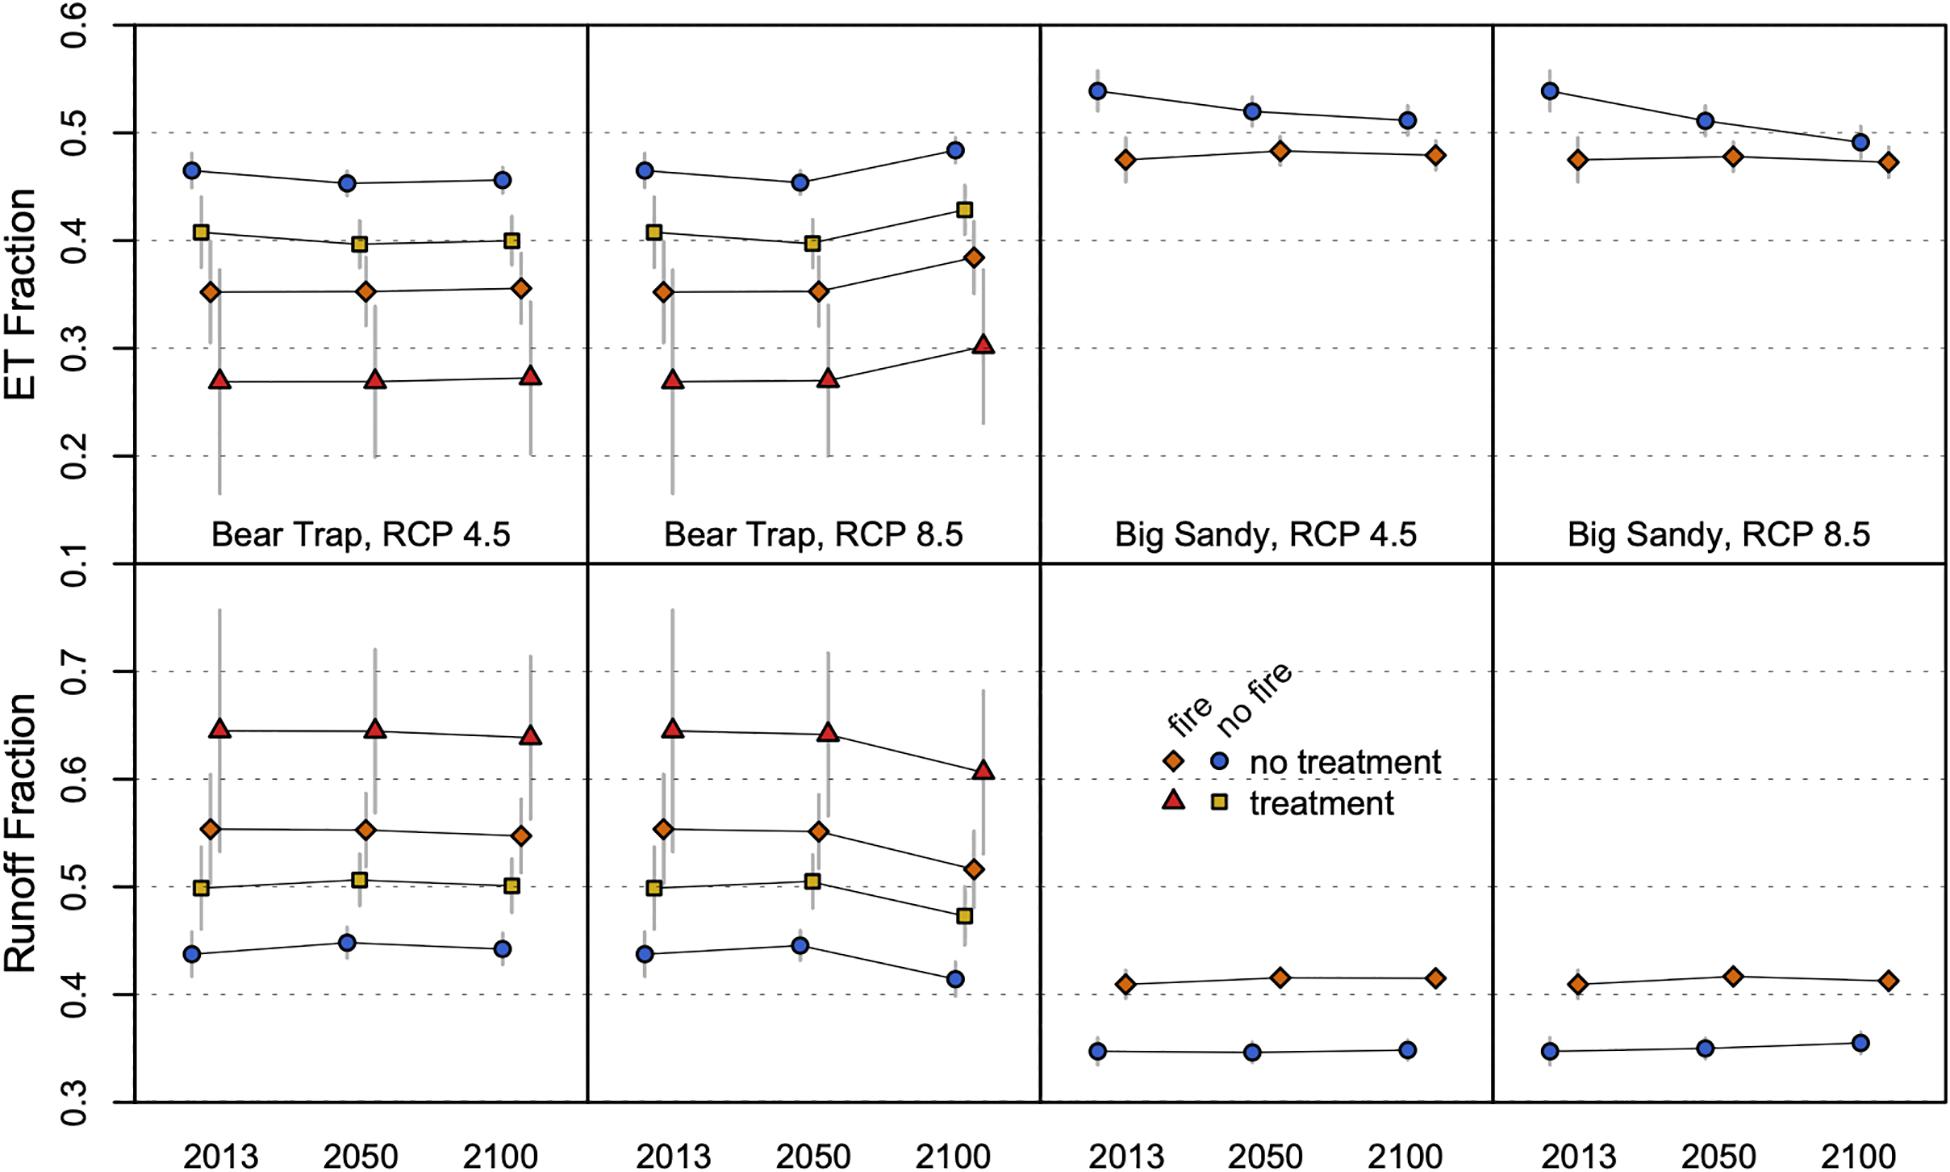
Figure 3. Simulation results of the runoff and evapotranspiration fractions for vegetation scenarios and projected temperature increases in 2050 and 2100. Basin-mean LAI in Big Sandy following treatment, with and without fire, were not different from the no-treatment scenarios and are not shown. Simulations are for water-year 2010–2013 conditions, during which mean precipitation was 1990 mm in Bear Trap and 1300 mm in Big Sandy. Vertical bars indicate the 95% confidence interval based on the multiple parameter sets for each catchment.
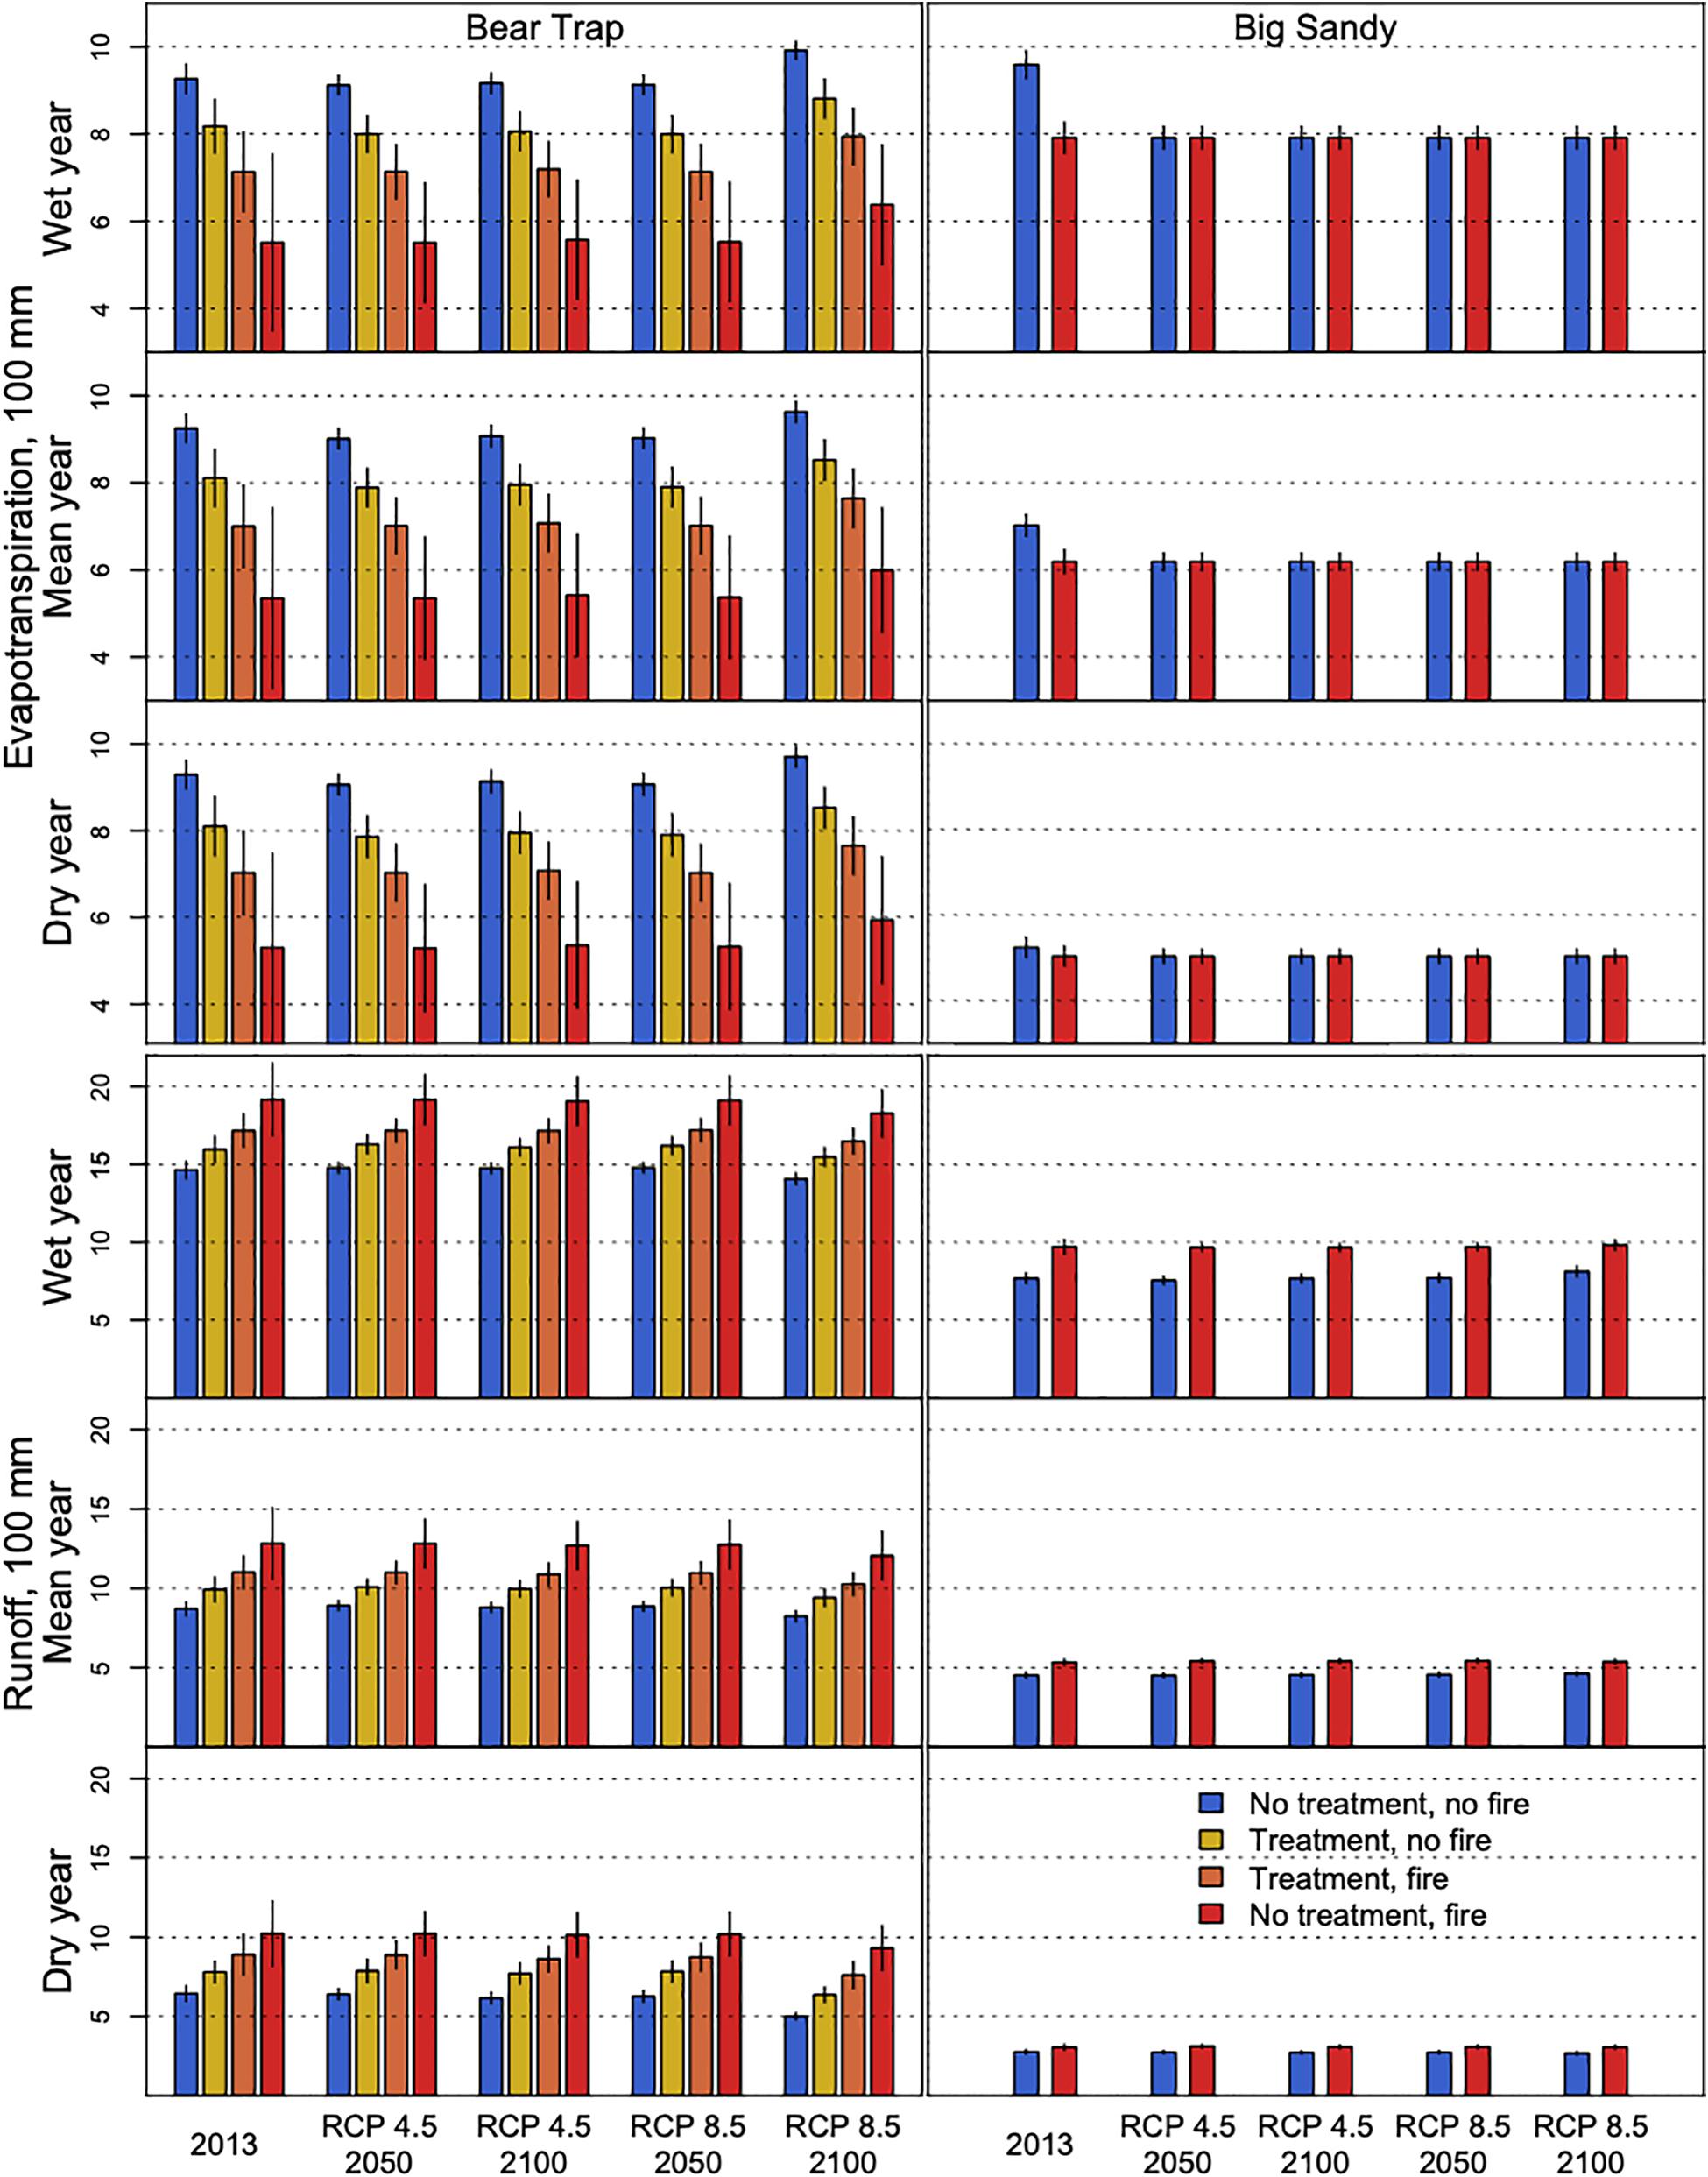
Figure 4. Evapotranspiration (upper 6 panels) and runoff (lower 6 panels) for forest-treatment and disturbance scenarios during dry (2012), mean (all years), and wet (2011) precipitation conditions for current and projected temperatures Vertical bars indicate the 95% confidence interval based on the multiple parameter sets for each catchment. Left column of panels is Bear Trap and right column of panels is Big Sandy. Big Sandy mean basin LAI following treatments were not different than having no treatment and are not shown.
In the Big Sandy catchment, the simulated response of evapotranspiration and runoff to the 26% LAI decrease (from 5.0 to 3.7) and 14% canopy decrease (0.55–0.47) from modeled wildfire was more limited than in Bear Trap, increasing the runoff fraction by 0.06 (from 0.35 to 0.41) and decreasing the evapotranspiration fraction by 0.06 (from 0.54 to 0.48). This is equivalent to a drop in ET of about 78 mm yr–1, from 702 to 624 mm yr–1 (Figure 4). A similar response in the reduction of evapotranspiration of 0.05 (from 0.54 to 0.49) was simulated due to the RCP 8.5 temperature increase by 2100, but the response of runoff was not significant, only increasing from 0.35 to 0.36. Precipitation not accounted for in runoff or evapotranspiration is routed to deeper groundwater storage and thus changes in evapotranspiration do not necessarily translate directly into runoff change in the model. Response to all other climate scenarios also resulted in changes of less than 0.03 in evapotranspiration and runoff fractions, similar to Bear Trap, even though Big Sandy has a higher overall evapotranspiration fraction due to the lower precipitation.
Precipitation Variability
Runoff in Bear Trap varied between wet, average, and dry years, and runoff response also varied across vegetation scenarios (fire and treatment). The difference in runoff between wet and dry years exceeded 750 mm while the runoff difference between no treatment/fire runoff and runoff from the most-substantial vegetation disturbance was limited to less than 500 mm (Figure 4). Trends of runoff and evapotranspiration response with increasing temperatures were the same in all climate scenarios except for RCP 8.5 in 2100, where evapotranspiration increases were greater in the wet years (<50 mm). In Big Sandy, precipitation variability between wet and dry years had a greater effect on evapotranspiration and runoff than the reductions in vegetation from wildfire (Figure 4). The differences in annual precipitation resulted in evapotranspiration differences near 400 mm without treatment or fire, and runoff differences close to 700 mm with post-fire vegetation. Water-balance response to reductions in LAI from wildfire were smaller, with evapotranspiration decreases and runoff increases of <200 mm. Elevated temperatures in 2050 and 2100 increased ET during mean to high precipitation years, offsetting some of the ET decline due to fire.
Hydrologic Timing and Storage
Precipitation falling as rain or snow, along with the accumulation and melt of the seasonal snowpack, determines the timing of soil infiltration, runoff and availability of water in the soil for use by vegetation. Projected temperature increases affected both precipitation phase and melt rate, and changes in vegetation density impacted snowmelt by modifying the surface-energy balance. Simulations of temperature and vegetation impacts on hydrologic storage and timing were assessed for 2010, a mean precipitation year (Figure 5).
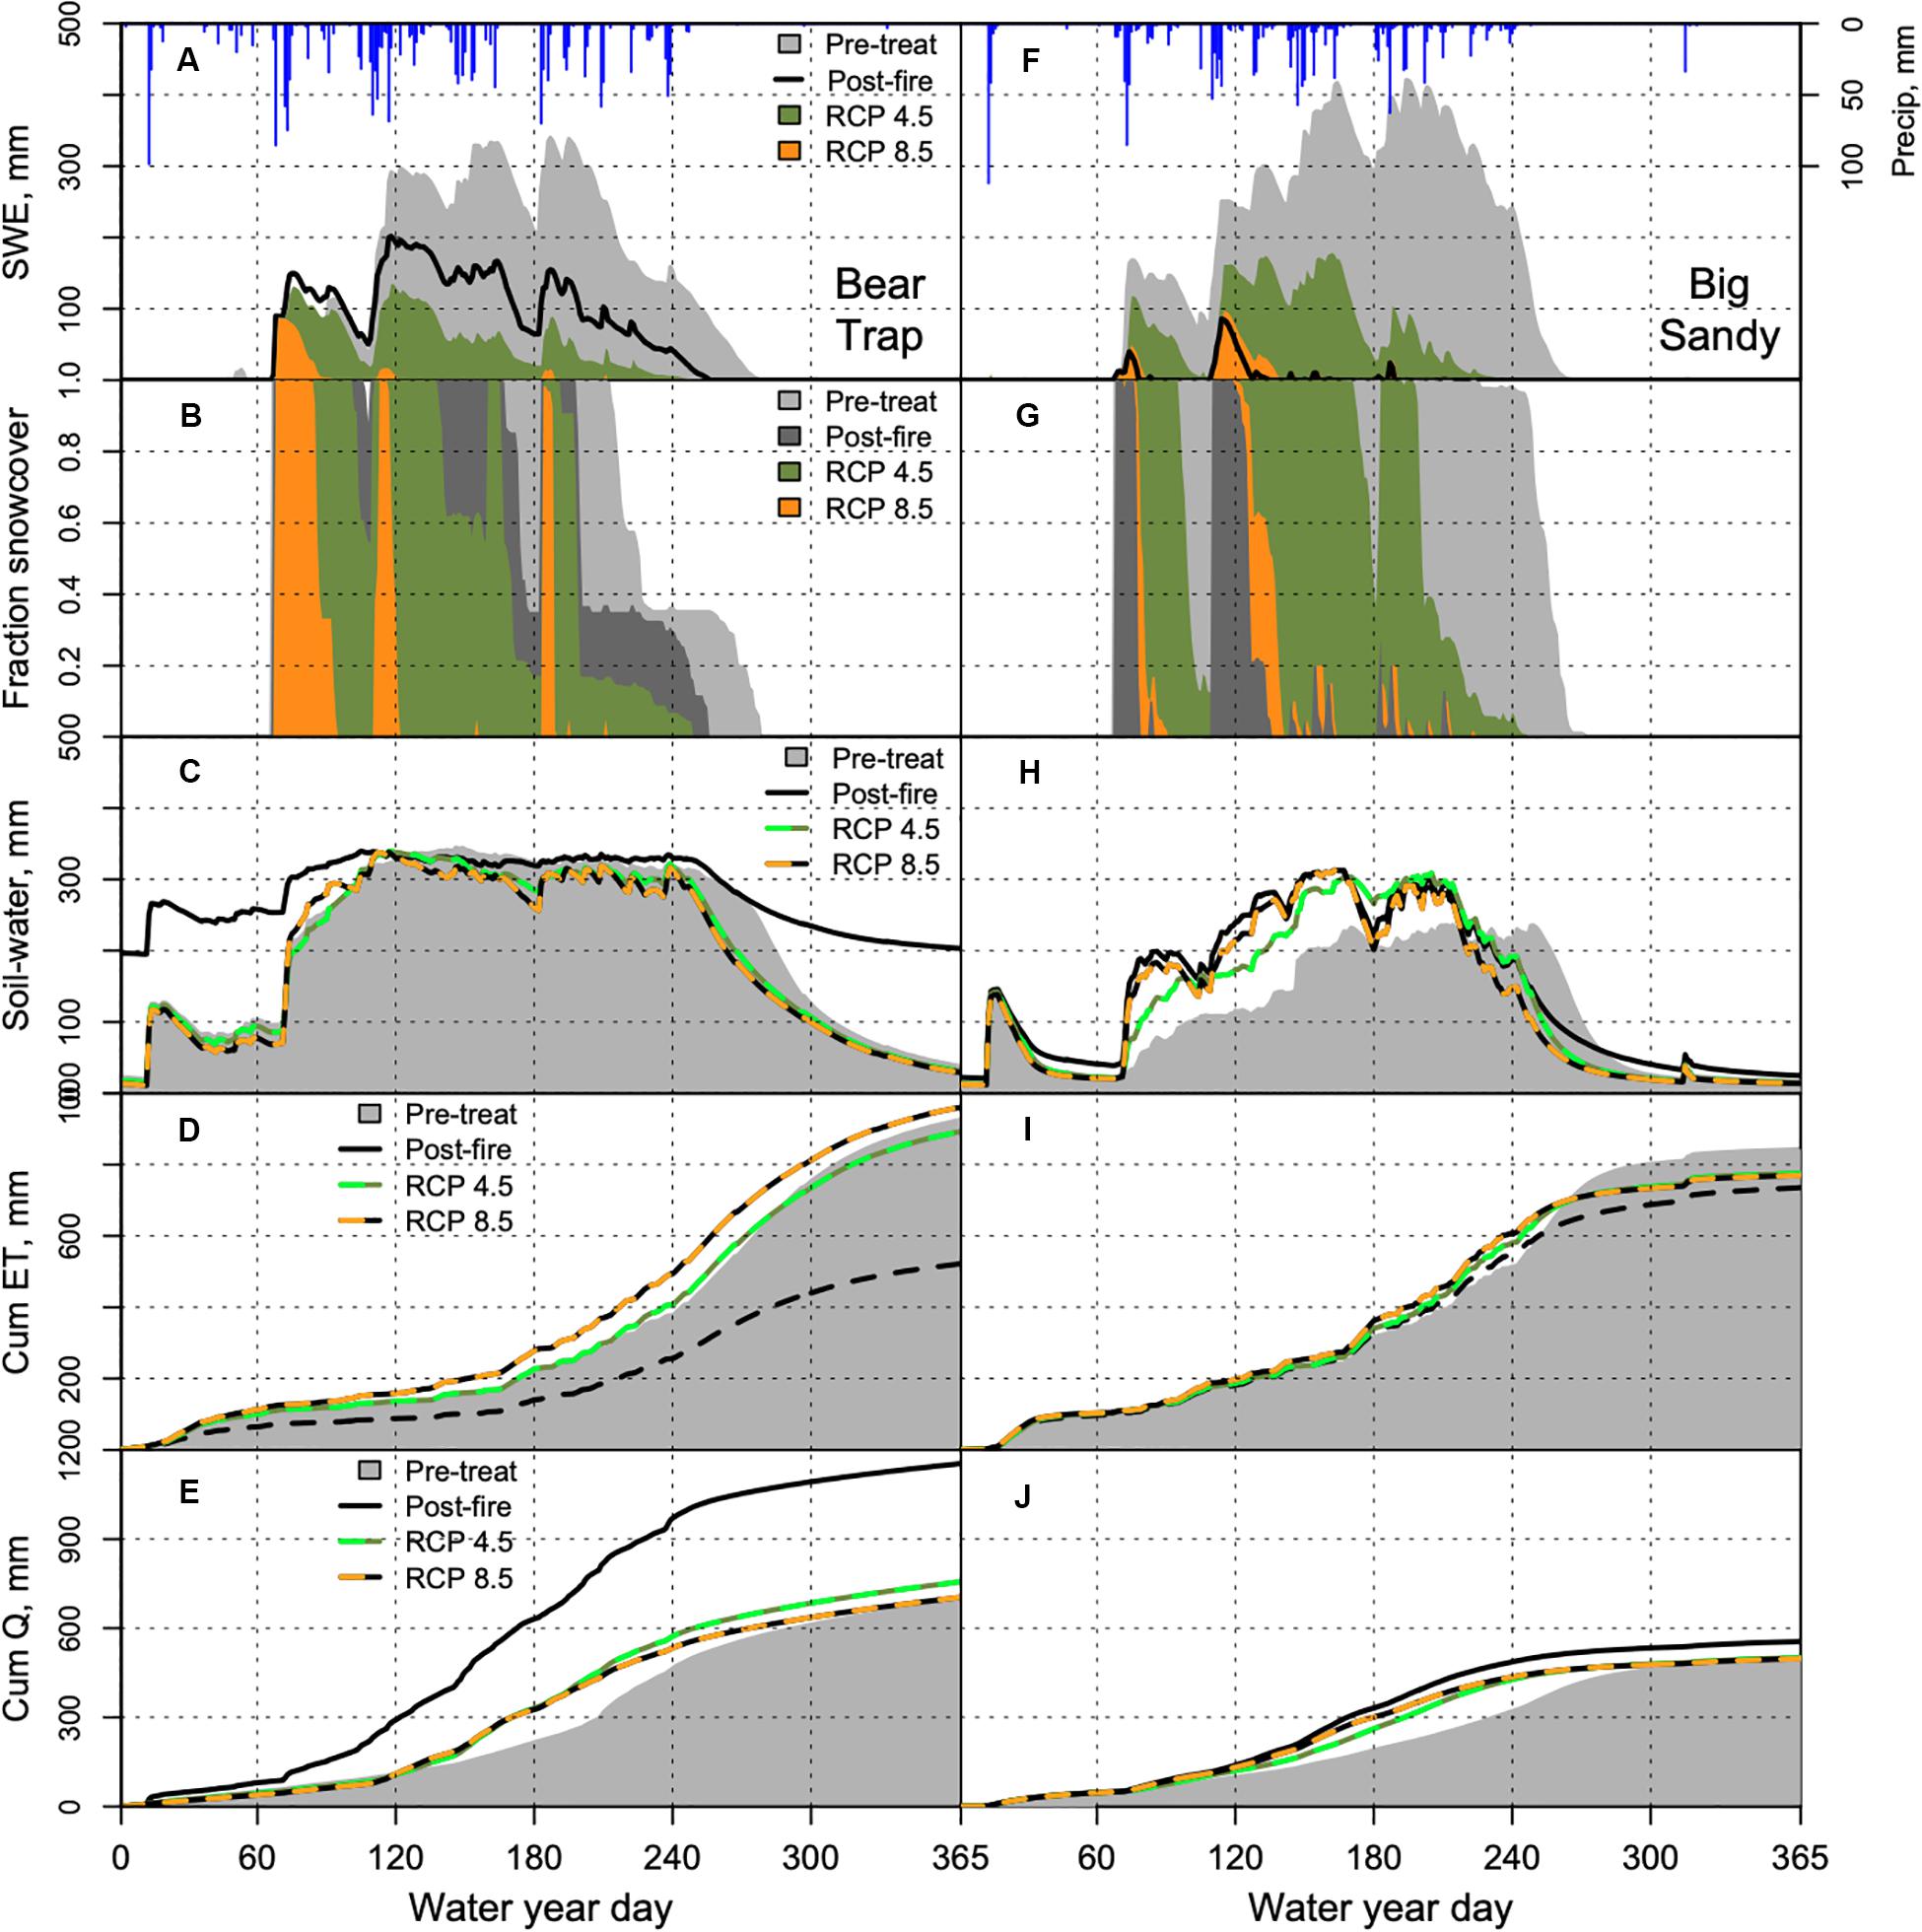
Figure 5. Daily precipitation and snowpack storage (A,F), basin snow-cover fraction (B,G), soil-water storage (C,H), evapotranspiration (D,I), and stream discharge (E,J) in the Bear Trap and Big Sandy catchments with vegetation and temperature perturbations. Vegetation densities are from control and post-fire conditions, and temperature increases are from year 2100 projections with RCP 4.5 and 8.5 climate scenarios.
In Bear Trap, post-fire vegetation losses advanced the snowpack melt-out date by about 3 weeks, while temperature increases by 2100 in RCP 4.5 advanced the melt-out date by about 4 weeks (Figures 5A,B). Increases in temperature by 2100 in RCP 8.5 showed no persistent snowpack, with the fraction of precipitation falling as snow decreasing from 0.40 to 0.10 (Table 1). The reduced vegetation after fire increased soil-water storage during the dry season from minimal storage to within 150 mm of saturated winter conditions (∼350 mm). Increased temperatures resulted in an earlier start of the soil-water storage recession from wet winter to dry summer conditions by approximately 1.5 weeks, associated with the reduced snowpack. Evapotranspiration with increased temperatures becomes more limited in the early summer because of the earlier soil drying. The reduced post-fire vegetation resulted in evapotranspiration reductions during all seasons and was not limited by soil-water storage. Runoff timing was accelerated with both scenarios of increased temperatures and reduced vegetation, with peak runoff about 8 weeks earlier. Post-fire vegetation resulted in 67% higher annual runoff, with increased peak (+54%) and frequency (5–14 events) of high-flow events, where increased-temperature scenarios resulted in lower peak flow (−35%) at similar frequency.
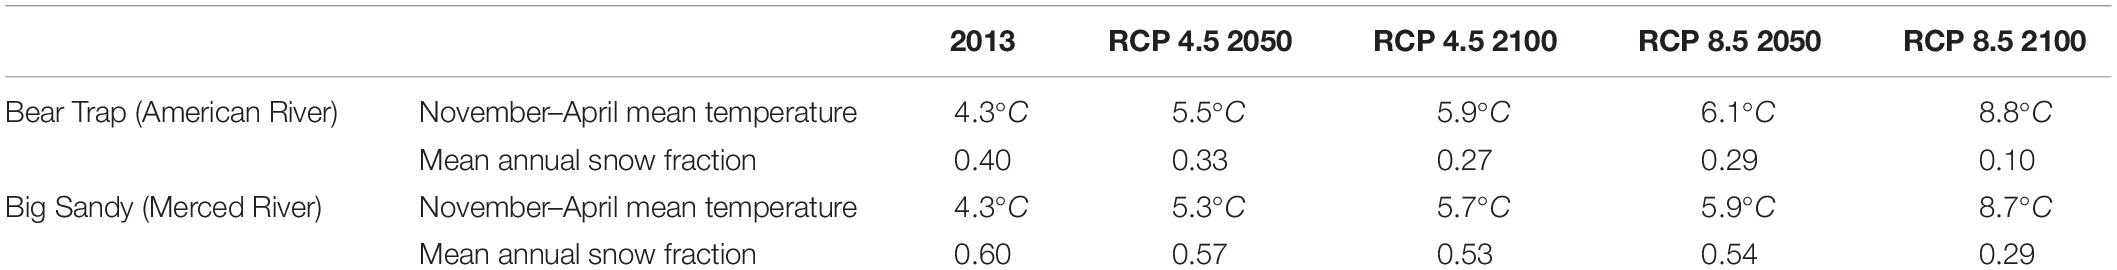
Table 1. Mean daily temperatures for the months of highest precipitation (November–April) and the fraction of precipitation falling as snow under each climate scenario.
In Big Sandy, post-fire vegetation resulted in the loss of a persistent winter snowpack, similar to temperature increases by 2100 with RCP 8.5 (Figures 5F,G). Increases in temperature by 2100 with RCP 4.5 and 8.5 reduced the snowfall fraction from 0.60 to 0.53 and 0.29 of precipitation, respectively. Soil-water storage from infiltration increased earlier in the winter and became more saturated with temperature increases (300 mm) than in the control (230 mm), but the dry season recession curve also started about 4 weeks earlier than in the control scenario. Evapotranspiration response to the vegetation reductions was muted, but evapotranspiration was reduced in all vegetation and temperature simulations from the earlier drawdown in soil-water storage. Peak runoff timing was shifted about 12 weeks, from early June to early March, in the post-fire and RCP 8.5 scenarios, with higher peak flow (+29%) in the post-fire vegetation simulation than with projected increases in temperature (−9% to +4%). The earlier peak runoff in the RCP 4.5 scenario was only shifted about 8 weeks, to mid-April.
Discussion
These are highly productive ecosystems compared to other temperate conifer forests (Millar, 1996), where vegetation change from wildfire, and to a lesser extent forest management, impacted evapotranspiration and streamflow more than projected temperature increases from climate warming. On the other hand, impacts from inter-annual climate variation between relatively wet and dry years were greater than the impacts of vegetation change or climate warming. The hydrologic impacts of wildfire were greater than those associated with fuel treatments and the magnitude of vegetation change impacts were greater in the wetter central-Sierra study site. These results are based on two relatively small Sierra Nevada watersheds that enable the incorporation of substantial observation data for constraining a physically based model, but that also limit the ability to fully capture the wide range of geoclimatic variation within the Sierra. Nonetheless, our findings demonstrate how climate and vegetation change effects can interact to produce significant, short term hydrologic changes, but also show why it can be challenging to meaningfully generalize about these impacts in the context of climate and site differences.
Estimated hydrologic responses to vegetation change in this study were relatively high, particularly for the wetter Bear Trap catchment. Boisramé et al. (2019) found streamflow increases of about 20–40 mm as managed fires were allowed to return to the Illilouette Creek Basin, which is lower than the ∼75 mm change in the climatically similar Big Sandy Creek catchment. The difference can likely be attributed to a greater vegetation change from a reduction in forest cover in the Big Sandy headwater simulated wildfire, a single event that burned the entire catchment during 95th percentile weather conditions (e.g., high temperature, low humidity) in which high-severity wildfires are more likely to occur. Vegetation change in the Illilouette Creek catchment is a result of the ongoing managed wildfires that burned portions of the larger Illilouette Creek catchment in various weather conditions over 40 years, and incorporated conversion of forested areas to shrubs and meadows. Bart et al. (2016) showed the potential for water balance changes in the southern Sierra region in excess of 100 mm with reduced vegetation, and changes in vegetation type from forest to shrubs. The greater 400 mm yr–1 decline in ET with high-intensity wildfire in the high-precipitation, mixed-conifer region of the central-Sierra American River basin was approximately 70 mm higher than the findings of Roche et al. (2018b) and Roche et al. (2020). For example, the nearby 2014 King Fire resulted in a 330 mm (±80 mm) ET reduction in areas burned by high-severity fire, averaged over 4 years after the fire event. Saksa et al. (2020) also demonstrated the higher response of the water balance to horizontal forest structure changes in RHESSys, as such the 42% reduction in canopy cover contributed substantially to the change in ET.
Water-Balance Simulations
Ficklin and Barnhart (2014) suggest using multiple parameter sets and General Circulation Model outputs, as significant differences in hydrologic projections will occur from uncertainty in model parameterization and climate scenario. In this study, we used the ensemble means from two climate models and two emissions scenarios, with 6 (Bear Trap, American River Basin) and 17 (Big Sandy, Merced River Basin) parameter sets to incorporate some accounting of uncertainty. Additional uncertainties can originate from climate downscaling, which was not done in this study, and model structure (Wilby and Harris, 2006). We simulated a uniform increase in the minimum and maximum daily temperatures, using projected temperature anomalies for 2050 and 2100. Studies often use a single mean-temperature adjustment to project effects of climate warming on Sierra Nevada watersheds (e.g., Young et al., 2009; Meyers et al., 2010), but minimum and maximum temperatures may have periods of non-linear increases, which can modify the diurnal temperature range (Easterling, 1997; Vose et al., 2005).
In the RCP 4.5 projections, minimum and maximum temperatures increased an average of 0.017 and 0.020°C yr–1 in the American and 0.016 and 0.019°C yr–1 in the Merced between 2013 and 2100, respectively. RCP 8.5 projections of minimum and maximum temperatures resulted in mean increases of 0.044 and 0.055°C yr–1 in the American and 0.045 and 0.053°C yr–1 in the Merced between 2013 and 2100, respectively. The rate differences of minimum and maximum temperature will impact snow accumulation and melt estimates, along with ecological estimates in RHESSys, such as the estimation of vapor-pressure deficit and the Jarvis-based calculations of stomatal conductance (Jarvis, 1976) used to estimate transpiration in RHESSys, which incorporates functions of mean and minimum daily temperatures to limit maximum conductance.
The simulation results of temperature perturbations generally agree with the findings of Dettinger et al. (2004) that without statistically significant changes in precipitation, annual volumes of streamflow will generally remain steady in the American and Merced River basin areas with increasing temperatures. Dettinger et al. (2004) did find a general trend of +8% precipitation per year with climate warming, but the effect was small compared to the interannual variation, which was also found to have a large effect on runoff in this study (Figure 4). Previous work in the Merced River basin (Christensen et al., 2008) also showed the sensitivity of transpiration to precipitation at an elevation range similar to Big Sandy, with their model extending into higher elevations where transpiration became increasingly sensitive to changes in temperature. The sensitivity to transpiration at higher elevations may also be why Bales et al. (2018) estimated a greater increase in evapotranspiration (+12–15%) with a +1°C temperature increase in the Kings River Basin during the recent California drought, leading to a −5% change in runoff over the basin, calculated as precipitation minus evapotranspiration. Null et al. (2010) used the Water Evaluation and Planning (WEAP21) water-balance model that includes supply, demand, and policy scenario capabilities to project progressively decreasing mean annual flows in all major Sierra Nevada basins with increasing temperature, including a respective −5.6 and −6.3% for the Merced and American with +4°C. Temperature increases in this study were similar for the RCP 8.5 scenario in 2100, resulting in a similar response for projected mean runoff in Bear Trap (American) of −5.3%, but a lesser runoff response in Big Sandy (Merced) of −1.2%. Changes in Water Use Efficiency and evapotranspiration with increasing atmospheric CO2 concentrations were not considered in this study (De Kauwe et al., 2013).
Precipitation Variability
The strong response of evapotranspiration to vegetation density in Bear Trap, and to annual precipitation in Big Sandy, suggests that within a Budyko (1974) framework of competing water and energy limitations of transpiration, the Big Sandy region tends to be more water limited (Figure 6). The difference in energy and water limitations will affect the magnitude of the water-balance response to changes in vegetation and temperature, consistent with Zhang et al. (2001), who showed the potential for increased response of evapotranspiration with reduced forest cover in regions with higher precipitation. In both sites, yearly runoff was influenced by interannual precipitation variability more than temperature, similar to results from previous work in the western Sierra (Duell, 1994; Risbey and Entekhabi, 1996).
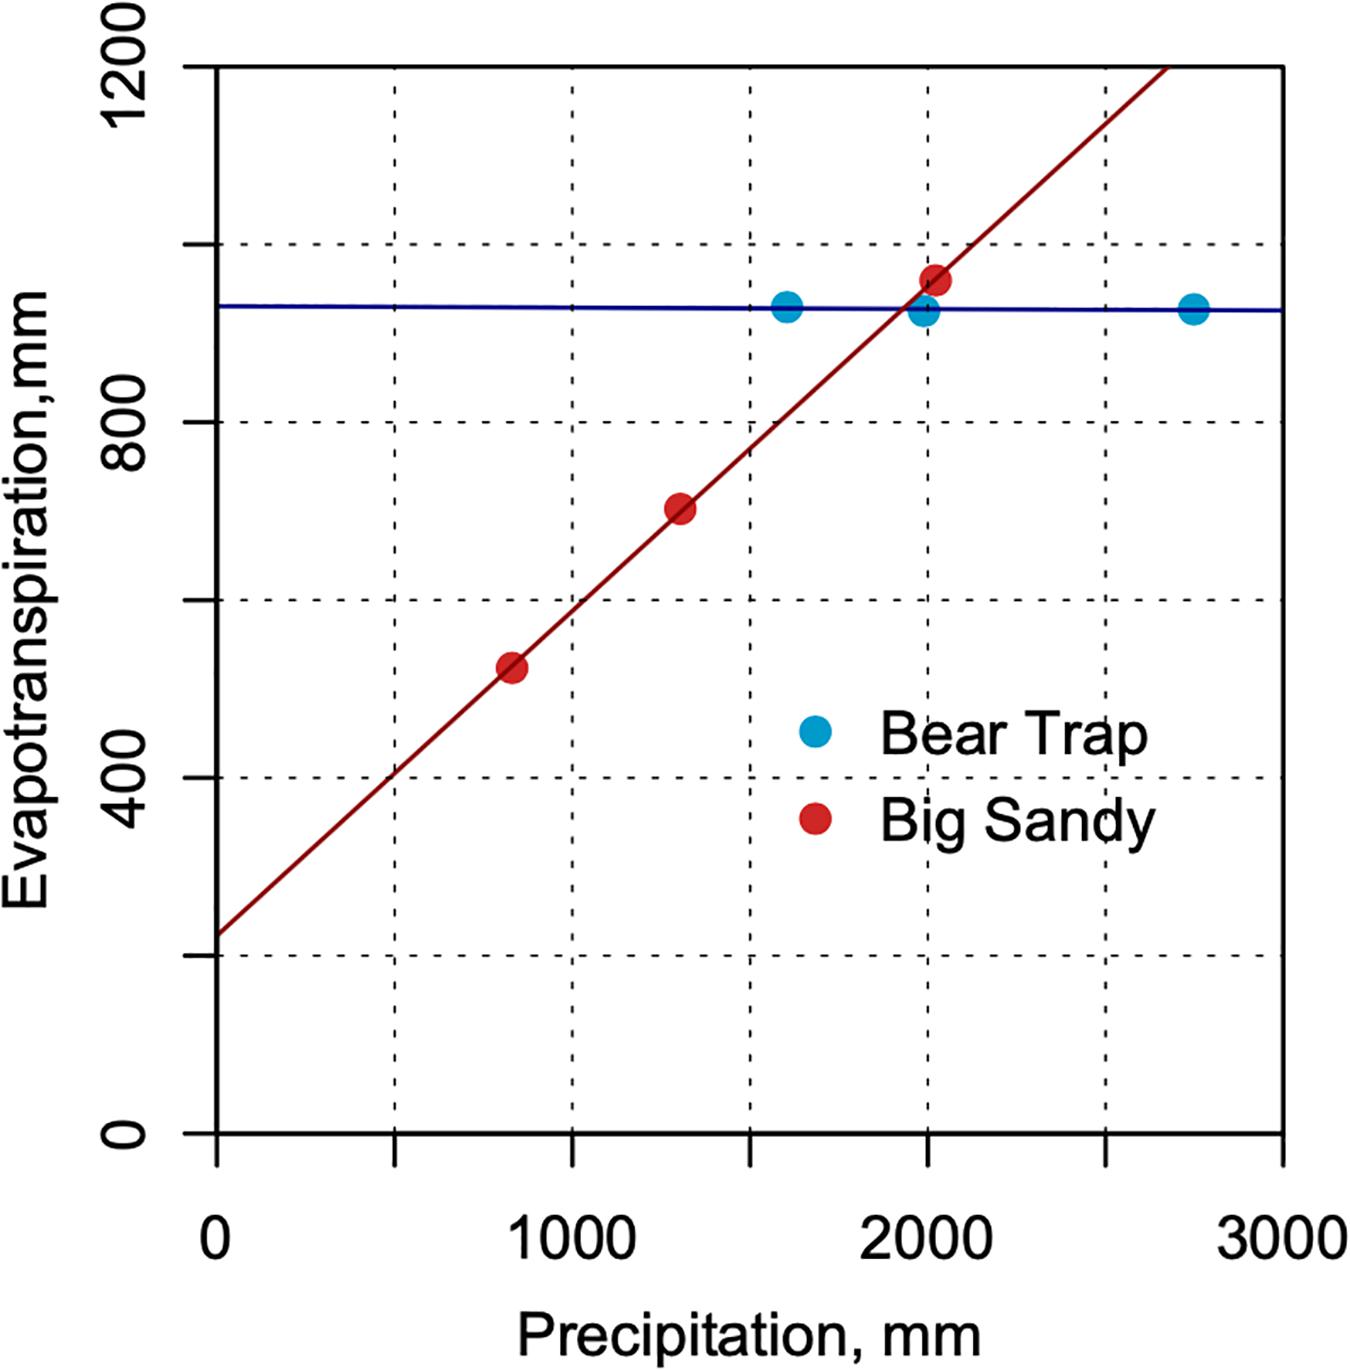
Figure 6. Annual evapotranspiration as a function of dry to wet precipitation conditions in Bear Trap and Big Sandy. Forest vegetation was constant (pre-treatment), with fitted lines highlighting the different trends between the two catchments.
The individual years of 2011 and 2012 were selected from the 4 years of simulation (2010–2013) to provide a spectrum of response to climate and vegetation perturbations during a wet and dry year, respectively. Antecedent-moisture conditions can modify watershed response to disturbance, so the progression of dry to wet years may be important. Precipitation in 2010 was close to the long-term mean for both regions, followed by the wet year of 2011, and dry years of 2012 and 2013. Shallow subsurface water-storage capacity and the rates of soil drainage versus evapotranspiration will impact the magnitude of summer-baseflow response in low-precipitation years and where temperature increases lead to earlier snowmelt (Jefferson et al., 2008; Tague and Grant, 2009; Huntington and Niswonger, 2012). The uncertainty associated with the calibrated model parameter sets of subsurface flow increased in Bear Trap Creek with simulated reductions in vegetation (Figures 3, 4). Improved characterization of subsurface properties in Sierra watersheds are needed to enhance our understanding and predictive capability of runoff response to climate (Shaw et al., 2014), which could be used to further constrain the simulation uncertainty of vegetation scenarios in this study. The total subsurface storage capacity, and plant-available water storage (Garcia and Tague, 2015; Tague et al., 2019), could limit the evapotranspiration increases seen in warmer Sierra Nevada watersheds that have been used as a proxy for temperature increases with climate change (Goulden and Bales, 2014).
Hydrologic Timing and Storage
Both reduced vegetation and increased temperatures resulted in more energy being absorbed by the snowpack, with persistent snow cover eliminated by 2100 in RCP 8.5 (Figures 5B,H). In contrast to results from Berghuijs et al. (2014) that indicated streamflow will generally decrease with decreasing snowfall, these results are consistent with studies such as Tague and Peng (2013) that argue that snowmelt inputs can in some cases support higher rates of evapotranpiration than winter precipitation. In this study, the increased winter (November–April) snowmelt led to higher water storage in the soil and increased streamflow, while evapotranspiration generally remained unchanged. The earlier melt reduced soil-water storage, evapotranspiration and streamflow in May through July in both Bear Trap and Big Sandy (Figure 5). These results agree with Tague and Peng (2013), showing that evapotranspiration response to temperature increases will depend on timing of snowmelt. Forrest et al. (2018) also project higher winter flows by 2050 for watersheds supplying California hydropower facilities, a significant source of renewable-power-generation – but noted that due to increased spillage events, higher flows did not necessarily yield additional power generation.
The response of snowmelt to vegetation loss from wildfire in Big Sandy was much greater than in Bear Trap. LAI drives radiation attenuation (Varhola and Coops, 2013), and in RHESSys, radiation transferred through the canopy to the snowpack follows a Beer’s Law type of exponential curve. In Bear Trap, LAI was reduced from 9.9 to 7.7 in the post-fire scenario, is within the saturated range of radiation absorption by the canopy, and is similar to previous reported LAI values for ponderosa pine forests in the area (Goldstein and Hultman, 2000; Gersonde et al., 2004; Campbell et al., 2009). In Big Sandy, the LAI was reduced from 5.0 to 3.7, which is similar to previous LiDAR LAI estimates for the Sierra National Forest (Zhao et al., 2012; Tang et al., 2014). The lower LAI in Big Sandy is within the exponential increase of radiation with changes in vegetation, resulting in snowpack patterns more similar to RCP 8.5 in 2100. The combination of reduced vegetation and elevated snowmelt led to the highest peak runoff in the post-fire scenario, compared to the control or climate projections, but will be further influenced by forest gap size and slope orientation (Ellis et al., 2013).
Changes in the timing of snowmelt and runoff also have implications for fish habitat and other aquatic species that rely on summer baseflow. Using the end of the 2010 water year (Sep 30) as an indicator of low flow in this study showed in baseflow reduced more following wildfire (−19%) than temperature increases (−4 to −8%) in Bear Trap Creek. In Big Sandy Creek, however, baseflow was reduced more following temperature increases (−29 to −33%) than wildfire (−25%). Godsey et al. (2013) note than low flows in this region depend on both Snow Water Equivalent level of both current and previous years, and impacts are influenced by subsurface storage capacity and underlying bedrock. Meyers et al. (2010) further extend their temperature warming assessment to winter and spring flooding in the region, which may negatively impact both brook and rainbow trout, but the greater proportion of winter flooding may impact brook trout more severely.
Conclusion
The water-balance responses to simulations of temperature and vegetation perturbations in productive mixed-conifer forests with wildfire disturbances showed that vegetation changes from operational fuel treatments and historical wildfire exerted a greater influence on annual evapotranspiration and runoff than did projected temperature increases in a warming climate. However, inter-annual variation in precipitation had a greater influence on runoff than did effects due to either fuels treatments or wildfire. Hydrologic impacts associated with historic wildfire were generally greater than those associated with operational fuel treatments. In the wetter central Sierra, headwater evapotranspiration decreased, and runoff increased 40–50% for a simulated wildfire event. In the more water-limited southern Sierra, the headwaters response was constrained to a respective −11 and +17% change in evapotranspiration and runoff following a simulated wildfire event. In contrast, evapotranspiration increases and runoff decreases to a 4.4°C temperature increase were less than 10% of current values for all headwaters.
Climate warming will eliminate the persistent seasonal snowpack at these elevations (1500–2500 m) by 2100 in the RCP 8.5 projections, becoming rain dominated as the amount of precipitation falling as snow was reduced from the current 40–60% down to 10–29%. The early snowmelt has cascading effects on the rate and timing of soil-water storage, and thus on evapotranspiration and runoff. Increases in temperatures resulted in peak streamflow occurring up to 12 weeks earlier, but post-fire vegetation conditions also increased peak runoff, especially in the American River headwaters of Bear Trap Creek. These results suggest that in the central Sierra, reductions in vegetation from either light thinning and fuels treatment or historical wildfire generate increases in flow, however, only wildfire or more-extensive fuels treatments provide significant increases in the southern Sierra. In both cases, these reductions are premised on vegetation changes that can be sustained. Further work to examine the dynamics of vegetation regrowth following fuels treatments, wildfire, and vegetation adaptation to a warming climate are needed to determine longer-term impacts of vegetation change on runoff and evapotranspiration.
Data Availability Statement
The datasets generated for this study are available on request to the corresponding author.
Author Contributions
PS contributed to the study design, data processing, modeling, and drafted the manuscript. MC and RB contributed to the study design, modeling approach, and manuscript revisions. CT contributed to the modeling approach and execution, and manuscript revisions. All authors contributed to the article and approved the submitted version.
Funding
This is SNAMP publication #59. The Sierra Nevada Adaptive Management Project (SNAMP) was funded by USDA Forest Service Region 5, USDA Forest Service Pacific Southwest Research Station, U.S. Fish and Wildlife Service, California Department of Water Resources, California Department of Fish and Game, California Department of Forestry and Fire Protection, and the Sierra Nevada Conservancy. This research was also supported by the U.S. National Science Foundation, through the Southern Sierra Critical Zone Observatory (EAR-0725097).
Conflict of Interest
The authors declare that the research was conducted in the absence of any commercial or financial relationships that could be construed as a potential conflict of interest.
Acknowledgments
We would like to thank California Department of Water Resources, United States Forest Service, Sierra Nevada Research Institute, and Sierra Nevada Adaptive Management Project personnel for their support and assistance. We thank Patrick Womble and Sarah Martin for their significant work in field data collection at UC Merced, and to Norm Miller at UC Berkeley for assistance with the climate datasets. We thank John Battles and Danny Fry at UC Berkeley for the forest vegetation and wildfire modeling components incorporated in this study. We acknowledge the World Climate Research Programme’s Working Group on Coupled Modelling, which is responsible for CMIP, and we thank the climate modeling groups for producing and making available their model output. For CMIP the U.S. Department of Energy’s Program for Climate Model Diagnosis and Intercomparison provides coordinating support and led development of software infrastructure in partnership with the Global Organization for Earth System Science Portals.
Footnotes
References
Abatzoglou, J. T., Redmond, K. T., and Edwards, L. M. (2009). Classification of regional climate variability in the state of California. J. Appl. Meteorol. Climatol. 48, 1527–1541. doi: 10.1175/2009JAMC2062.1
Agee, J. K., and Skinner, C. N. (2005). Basic principles of forest fuel reduction treatments. For. Ecol. Manag. 211, 83–96. doi: 10.1016/j.foreco.2005.01.034
Bales, R. C., Goulden, M. L., Hunsaker, C. T., Conklin, M. H., Hartsough, P. C., O’Geen, A. T., et al. (2018). Mechanisms controlling the impact of multi-year drought on mountain hydrology. Sci. Rep. 8:690. doi: 10.1038/s41598-017-19007-19000
Bales, R. C., Molotch, N. P., Painter, T. H., Dettinger, M. D., Rice, R., and Dozier, J. (2006). Mountain hydrology of the western United States. Water Resour. Res. 42, 1–13. doi: 10.1029/2005WR004387
Barbour, M., and Minnich, R. (2000). “California upland forests and woodlands,” in North American Terrestrial Vegetation, eds M. Barbour and W. Billings (Cambridge: Cambridge University Press), 159–200.
Bart, R. R., Tague, C. L., and Moritz, M. A. (2016). Effect of tree-to-shrub type conversion in lower montane forests of the Sierra Nevada (USA) on Streamflow. PLoS One 11:e0161805. doi: 10.1371/journal.pone.0161805
Berghuijs, W. R., Woods, R. A., and Hrachowitz, M. (2014). A precipitation shift from snow towards rain leads to a decrease in streamflow. Nat. Clim. Chang. 4, 583–586. doi: 10.1038/nclimate2246
Boisramé, G. F. S., Thompson, S. E., Tague, C., Naomi, L., and Stephens, S. L. (2019). Restoring a natural fire regime alters the water balance of a Sierra Nevada catchment. Water Resour. Res. 55, 5751–5769. doi: 10.1029/2018WR024098
Campbell, J., Alberti, G., Martin, J., and Law, B. E. (2009). Carbon dynamics of a ponderosa pine plantation following a thinning treatment in the northern Sierra Nevada. For. Ecol. Manag. 257, 453–463. doi: 10.1016/j.foreco.2008.09.021
Christensen, L., Tague, C. L., and Baron, J. S. (2008). Spatial patterns of simulated transpiration response to climate variability in a snow dominated mountain ecosystem. Hydrol. Process. 22, 3576–3588. doi: 10.1002/hyp
Collins, B., Stephens, S., Roller, G., and Battles, J. (2011). Simulating fire and forest dynamics for a landscape fuel treatment project in the Sierra Nevada. For. Sci. 57, 77–88. doi: 10.1093/forestscience/57.2.77
Cristea, N. C., Lundquist, J. D., Loheide, S. P., Lowry, C. S., and Moore, C. E. (2014). Modelling how vegetation cover affects climate change impacts on streamflow timing and magnitude in the snowmelt-dominated upper Tuolumne Basin, Sierra Nevada. Hydrol. Process. 28, 3896–3918. doi: 10.1002/hyp.9909
De Kauwe, M. G., Medlyn, B. E., Zaehle, S., Walker, A. P., Dietze, M. C., Hickler, T., et al. (2013). Forest water use and water use efficiency at elevated CO2: a model-data intercomparison at two contrasting temperate forest FACE sites. Glob. Chang. Biol. 19, 1759–1779. doi: 10.1111/gcb.12164
Dettinger, M. D., Cayan, D. R., Meyer, M. K., and Jeton, A. E. (2004). Simulated hydrologic responses to climate variations and change in the Merced, Carson, and American River Basins, Sierra Nevada, California, 1900-2099. Clim. Change 62, 283–317. doi: 10.1023/B:CLIM.0000013683.13346.4f
Dixon, G. E. (2002). Essentail FVS: A User’s Guide to the Forest Vegetation Simulator. Collins, CO: U. S. Department of Agriculture.
Dore, S., Kolb, T. E., Eckert, S. E., Sullivan, B. W., Hungate, B. A., Hart, S. C., et al. (2010). Carbon and water fluxes from ponderosa pine forests disturbed by wildfire and thinning. Ecol. Appl. 20, 663–683. doi: 10.1890/09-0934.1
Dore, S., Montes-Helu, M., Hart, S. C., Hungate, B. A., Koch, G. W., Moon, J. B., et al. (2012). Recovery of ponderosa pine ecosystem carbon and water fluxes from thinning and stand-replacing fire. Glob. Chang. Biol. 18, 3171–3185. doi: 10.1111/j.1365-2486.2012.02775.x
Duell, L. F. W. (1994). The sensitivity of northern Sierra Nevada streamflow to climate change. J. Am. Water Resour. Assoc. 30, 841–859. doi: 10.1111/j.1752-1688.1994.tb03333.x
Easterling, D. R. (1997). Maximum and minimum temperature trends for the globe. Science 277, 364–367. doi: 10.1126/science.277.5324.364
Ellis, C. R., Pomeroy, J. W., Essery, R. L. H., and Link, T. E. (2011). Effects of needleleaf forest cover on radiation and snowmelt dynamics in the Canadian rocky mountains. Can. J. For. Res. 41, 608–620. doi: 10.1139/X10-227
Ellis, C. R., Pomeroy, J. W., and Link, T. E. (2013). Modeling increases in snowmelt yield and desynchronization resulting from forest gap-thinning treatments in a northern mountain headwater basin. Water Resour. Res. 49:89. doi: 10.1002/wrcr.20089
Essery, R., Pomeroy, J., Ellis, C., and Link, T. (2008). Modelling longwave radiation to snow beneath forest canopies using hemispherical photography or linear regression. Hydrol. Process. 2800, 2788–2800. doi: 10.1002/hyp.6930
Ficklin, D. L., and Barnhart, B. L. (2014). SWAT hydrologic model parameter uncertainty and its implications for hydroclimatic projections in snowmelt-dependent watersheds. J. Hydrol. 519, 2081–2090. doi: 10.1016/j.jhydrol.2014.09.082
Finney, M. (2001). Design of regular landscape fuel treatment patterns for modifying fire growth and behavior. For. Sci. 47, 219–228. doi: 10.1093/forestscience/47.2.219
Finney, M. (2004). FARSITE: Fire Area Simulator-Model Development and Evaluation. RMRS-RP-4. Fort Collins, CO: USDA Forest Service, Rocky Mountain Research Station.
Forrest, K., Tarroja, B., Chiang, F., AghaKouchak, A., and Samuelsen, S. (2018). Assessing climate change impacts on California hydropower generation and ancillary services provision. Clim. Change 151, 395–412. doi: 10.1007/s10584-018-2329-5
Fry, D., Battles, J., Collins, B., and Stephens, S. (2015). “Appendix A: fire and forest ecosystem health report,” in Learning How to Apply Adaptive Management in Sierra NEVADA Forests, an Integrated Assessment, eds P. Hopkinson and J. Battles (Berkeley, CA: Univeristy of California).
Garcia, E. S., and Tague, C. L. (2015). Subsurface storage capacity influences climate-evapotranspiration interactions in three western United States catchments. Hydrol. Earth Syst. Sci. 19, 4845–4858. doi: 10.5194/hess-19-4845-2015
Garcia, E. S., Tague, C. L., and Choate, J. S. (2013). Influence of spatial temperature estimation method in ecohydrologic modeling in the Western Oregon Cascades. Water Resour. Res. 49, 1611–1624. doi: 10.1002/wrcr.20140
Garfin, G., Jardine, A., Merideth, R., Black, M., and LeRoy, S. (eds) (2013). Assessment of Climate Change in the Southwest United States: A Report Prepared for the National Climate Assessment. Washington, DC: Island Press.
Gersonde, R., Battles, J. J., and O’Hara, K. L. (2004). Characterizing the light environment in Sierra Nevada mixed-conifer forests using a spatially explicit light model. Can. J. For. Res. 34, 1332–1342. doi: 10.1139/X04-013
Godsey, S. E., Kirchner, J. W., and Tague, C. L. (2013). Effects of changes in winter snowpacks on summer low flows: case studies in the Sierra Nevada, California, USA. Hydrol. Process. 28, 5048–5064. doi: 10.1002/hyp.9943
Goldstein, A., and Hultman, N. (2000). Effects of climate variability on the carbon dioxide, water, and sensible heat fluxes above a ponderosa pine plantation in the Sierra Nevada (CA). Agric. For. Meteorol. 101, 113–129. doi: 10.1016/S0168-1923(99)00168-169
Goulden, M. L., and Bales, R. C. (2014). Mountain runoff vulnerability to increased evapotranspiration with vegetation expansion. Proc. Natl. Acad. Sci. 111, 1–5. doi: 10.1073/pnas.1319316111
Griffin, D., and Anchukaitis, K. J. (2014). How unusual is the 2012 - 2014 California drought? Geophys. Res. Lett. 41, 9017–9023. doi: 10.1002/2014GL062433.1
Hawthorne, S. N. D., Lane, P. N. J., Bren, L. J., and Sims, N. C. (2013). The long term effects of thinning treatments on vegetation structure and water yield. For. Ecol. Manag. 310, 983–993. doi: 10.1016/j.foreco.2013.09.046
Hopkinson, P., and Battles, J. J. (2015). Learning How to Apply Adaptive Management in Sierra Nevada forests: An integrated Assessment. Berkeley, CA: Center for Forestry, University of California.
Huntington, J. L., and Niswonger, R. G. (2012). Role of surface-water and groundwater interactions on projected summertime streamflow in snow dominated regions: an integrated modeling approach. Water Resour. Res. 48:319. doi: 10.1029/2012WR012319
Jarvis, P. (1976). The interpretation of the variations in leaf water potential and stomatal conductance found in canopies in the field. Philos. Trans. R. Soc. Lond. 273, 593–640. doi: 10.1098/rstb.1976.0035
Jefferson, A., Nolin, A., Lewis, S., and Tague, C. (2008). Hydrogeologic controls on streamflow sensitivity to climate variation. Hydrol. Process. 4385, 4371–4385. doi: 10.1002/hyp.7401
Jeton, A. E., Dettinger, M. D., and Smith, J. L. (1996). Potential Dffects of Climate Change on Streamflow, Eastern and Western Slopes of the Sierra Nevada, California and Nevada. Sacramento, CA: U. S. Geological Survey Water-Resources Investigations Report.
Kattsov, V., Federation, R., Reason, C., Africa, S., Uk, A. A., Uk, T. A., et al. (2013). “Evaluation of climate models,” in Climate Change 2013 - the Physical Science Basis: Working Group I Contribution to the Fifth Assessment Report of the Intergovernmental Panel on Climate Change, eds V. Bex and P. M. Midgley (Cambridge: Cambridge University Press), 741–866. doi: 10.1017/CBO9781107415324.020
Kelly, M., and Guo, Q. (2015). “Appendix B: spatial team final report,” in Learning How to Apply Adaptive Management in Sierra Nevada Forests, An Integrated Assessment, eds P. Hopkinson and J. Battles (Berkeley, CA: Center for Forestry, Univeristy of California).
Knowles, N. (2002). Potential effects of global warming on the Sacramento/San Joaquin watershed and the San Francisco estuary. Geophys. Res. Lett. 29, 2–5. doi: 10.1029/2001GL014339
Lundquist, J. D., Dickerson-Lange, S. E., Lutz, J. A., and Cristea, N. C. (2013). Lower forest density enhances snow retention in regions with warmer winters: a global framework developed from plot-scale observations and modeling. Water Resour. Res. 49, 6356–6370. doi: 10.1002/wrcr.20504
Lydersen, J. M., Collins, B. M., and Hunsaker, C. T. (2019). Implementation constraints limit benefits of restoration treatments in mixed-conifer forests. Int. J. Wildl. Fire 28, 495–511. doi: 10.1071/WF18141
Mahat, V., and Tarboton, D. G. (2012). Canopy radiation transmission for an energy balance snowmelt model. Water Resour. Res. 48:W01534. doi: 10.1029/2011WR010438
Meyers, E. M., Dobrowski, B., and Tague, C. L. (2010). Climate change impacts on flood frequency, intensity, and timing may affect trout species in Sagehen Creek, California. Trans. Am. Fish. Soc. 62, 1657–1664. doi: 10.1577/T09-192.1
Millar, C. I. (1996). Sierra Nevada Ecosystem Project, Final Report to Congress, Vol. I, Assessment Summaries and Management Strategies. Centers for Water and Wildlife Resource, Report No. 36. Davis, CA: University of California.
Millar, C. I., Stephenson, N. L., and Stephens, S. L. (2007). Climate change and forests of the future: managing in the face of uncertainty. Ecol. Appl. 17, 2145–2151. doi: 10.1890/06-1715.1
Miller, N. L., Bashford, K. E., and Strem, E. (2003). Potential impacts of climate change on California hydrology. J. Am. Water Resour. Assoc. 39, 771–784. doi: 10.1111/j.1752-1688.2003.tb04404.x
Moeser, D., Stahli, M., and Jonas, T. (2015). Improved snow interception modeling using cnaopy parameters derived from airborn LiDAR data. Water Resour. Res. 51, 5041–5059. doi: 10.1002/2014WR016724
Molotch, N. P., and Meromy, L. (2014). Physiographic and climatic controls on snow cover persistence in the Sierra Nevada mountains. Hydrol. Process. 28, 4573–4586. doi: 10.1002/hyp.10254
Morán-Tejeda, E., Zabalza, J., Rahman, K., Gago-silva, A., López-moreno, J. I., Vicente-serrano, S., et al. (2014). Hydrological impacts of climate and land-use changes in a mountain watershed: uncertainty estimation based on model comparison. Ecohydrology 8:1590. doi: 10.1002/eco.1590
North, M., Brough, A., Long, J., Collins, B., Bowden, P., Yasuda, D., et al. (2015). Constraints on mechanized treatment significantly limit mechanical fuels reduction extent in the sierra nevada. J. For. 113, 40–48. doi: 10.5849/jof.14-058
Null, S. E., Viers, J. H., and Mount, J. F. (2010). Hydrologic response and watershed sensitivity to climate warming in California’s Sierra Nevada. PLoS One 5:9932. doi: 10.1371/journal.pone.0009932
Pierce, D. W., Kalansky, J. F., and Cayan, D. R. (2018). Climate, Drought, and Sea Level Rise Scenarios for the Fourth California Climate Assessment. Available online at: www.climateassessment.ca.gov
Pupacko, A. (1993). Variations in Northern sierra nevada streamflow: implications of climate change. J. Am. Water Resour. Assoc. 29, 283–290. doi: 10.1111/j.1752-1688.1993.tb03208.x
Reinhardt, E., and Crookston, N. (2003). The Fire and Fuels Extension to the Forest Vegetation Simulator. RMRS-GTR-116. Ogden, UT: USDA Forest Service Rocky Mountain Research Station.
Risbey, J. S., and Entekhabi, D. (1996). Observed sacramento basin streamflow response to precipitation and temperature changes and its relevance to climate impact studies. J. Hydrol. 184, 209–223. doi: 10.1016/0022-1694(95)02984-2982
Roche, J. W., Bales, R. C., Rice, R., and Marks, D. G. (2018a). Management implications of snowpack sensitivity to temperature and atmospheric moisture changes in yosemite National Park, CA†. J. Am. Water Resour. Assoc. 54, 724–741. doi: 10.1111/1752-1688.12647
Roche, J. W., Goulden, M. L., and Bales, R. C. (2018b). Estimating evapotranspiration change due to forest treatment and fire at the basin scale in the Sierra Nevada, California. Ecohydrology 11:e1978. doi: 10.1002/eco.1978
Roche, J. W., Ma, Q., Rungee, J., and Bales, R. C. (2020). Evapotranspiration Mapping for Forest Management in California’s Sierra Nevada. Front. For. Glob. Chang. 3:69. doi: 10.3389/ffgc.2020.00069
Romero-Lankao, P., Smith, J. B., Davidson, D. J., Diffenbaugh, N. S., Kinney, P. L., Kirshen, P., et al. (2014). “North America,” in Climate Change 2014: Impacts, Adaptation, and Vulnerability. Part B: Regional Aspects. Contribution of Working Group II to the Fifth Assessment Report of the Intergovernmental Panel on Climate Change, eds V. R. Barros, C. B. Field, D. J. Dokken, M. D. Mastrandrea, K. J. Mach, and T. E. Bilir (Cambridge: Cambridge University Press), 1439–1498.
Saksa, P., Conklin, M. H., Battles, J. J., Tague, C. L., and Bales, R. C. (2017). Forest thinning impacts on the water balance of Sierra Nevada mixed-conifer headwater basins. Water Resour. Res. 53:2016WR019240.
Saksa, P. C., Bales, R. C., Tague, C. L., Battles, J. J., and Conklin, M. H. (2020). Forest fuels treatment and wildfire effects on Sierra Nevada mixed-conifer runoff. Ecohydrology 13, 1–16. doi: 10.1002/eco.2151
Shaw, G. D., Conklin, M. H., Nimz, G. J., and Liu, F. (2014). Groundwater and surface water flow to the Merced River, Yosemite Valley, California: 36Cl and Cl- evidence. Water Resour. Res. 50, 1943–1959. doi: 10.1002/2013WR014222
Stephens, S. L. (1998). Evaluation of the effects of silvicultural and fuels treatments on potential fire behaviour in Sierra Nevada mixed-conifer forests. For. Ecol. Manag. 105, 21–35. doi: 10.1016/S0378-1127(97)00293-294
Stephens, S., Agee, J., Fule, P., North, M. P., Romme, W., Swetnam, T., et al. (2013). Managing forest and fire in changing climates. Science 342, 41–42. doi: 10.1126/science.1240294
Stewart, I. T., Cayan, D. R., and Dettinger, M. D. (2004). Changes in snowmelt runoff timing in western North America under a “business as usual” climate change scenario. Clim. Chang. 62, 217–232. doi: 10.1023/b:clim.0000013702.22656.e8
Storck, P., Lettenmaier, D. P., and Bolton, S. M. (2002). Measurement of snow interception and canopy effects on snow accumulation and melt in a mountainous maritime climate, Oregon, United States. Water Resour. Res. 38:1123. doi: 10.1029/2002WR001281
Su, Y., Guo, Q., Fry, D. L., Collins, B. M., Kelly, M., Flanagan, J. P., et al. (2016). Vegetation mapping strategy for conifer forests by combining airborne lidar data and aerial imagery. Can. J. Remote Sens. 42, 1–15. doi: 10.1080/07038992.2016.1131114
Tague, C., and Grant, G. E. (2009). Groundwater dynamics mediate low-flow response to global warming in snow-dominated alpine regions. Water Resour. Res. 45, 1–12. doi: 10.1029/2008WR007179
Tague, C., and Peng, H. (2013). The sensitivity of forest water use to the timing of precipitation and snowmelt recharge in the California Sierra: implications for a warming climate. J. Geophys. Res. Biogeosci. 118, 875–887. doi: 10.1002/jgrg.20073
Tague, C. L., and Band, L. E. (2004). RHESSys: regional hydro-ecologic simulation system—an object-oriented approach to spatially distributed modeling of carbon, water, and nutrient cycling. Earth Interact. 8, 1–42. doi: 10.1175/1087-3562(2004)8<1:rrhsso>2.0.co;2
Tang, H., Brolly, M., Zhao, F., Strahler, A. H., Schaaf, C. L., Ganguly, S., et al. (2014). Deriving and validating Leaf Area Index (LAI) at multiple spatial scales through lidar remote sensing: a case study in Sierra National Forest, CA. Remote Sens. Environ. 143, 131–141. doi: 10.1016/j.rse.2013.12.007
Tague, C. L., Moritz, M., and Hanan, E. (2019). The changing water cycle: the eco-hydrologic impacts of forest density reduction in Mediterranean (seasonally dry) regions. Wiley Interdiscip. Rev. Water 6:e1350. doi: 10.1002/wat2.1350
van Vuuren, D. P., Edmonds, J., Kainuma, M., Riahi, K., Thomson, A., Hibbard, K., et al. (2011). The representative concentration pathways: an overview. Clim. Change 109, 5–31. doi: 10.1007/s10584-011-0148-z
Varhola, A., and Coops, N. C. (2013). Estimation of watershed-level distributed forest structure metrics relevant to hydrologic modeling using LiDAR and Landsat. J. Hydrol. 487, 70–86. doi: 10.1016/j.jhydrol.2013.02.032
Vicente-Serrano, S. M., Camarero, J. J., Zabalza, J., Sanguesa-Barreda, G., Lopez-Moreno, J. I., and Tague, C. L. (2015). Evapotranspiration deficit controls net primary production and growth of silver fir: implications for Circum-Mediterranean forests under forecasted warmer and drier conditions. Agric. For. Meteorol. 206, 45–54. doi: 10.1016/j.agrformet.2015.02.017
Vose, R. S., Easterling, D. R., and Gleason, B. (2005). Maximum and minimum temperature trends for the globe: an update through 2004. Geophys. Res. Lett. 32, 1–5. doi: 10.1029/2005GL024379
Westerling, A. L., Hidalgo, H. G., Cayan, D. R., and Swetnam, T. W. (2006). Warming and earlier spring increase western U.S. forest wildfire activity. Science 313, 940–943. doi: 10.1126/science.1128834
Wigmosta, M. S., Vail, L. W., and Lettenmaier, D. P. (1994). A distributed hydrology-vegetation model for complex terrain. Water Resour. Res. 30:1665. doi: 10.1029/94WR00436
Wilby, R. L., and Harris, I. (2006). A framework for assessing uncertainties in climate change impacts: low-flow scenarios for the River Thames. UK. Water Resour. Res. 42, 1–10. doi: 10.1029/2005WR004065
Young, C., Escobar_Arias, M., Fernandes, M., Joyce, B., Kiparsky, M., Mount, J., et al. (2009). Modeling the hydrology of climate change in California’s Sierra Nevada for subwatershed scale adaptation1. J. Am. Water Resour. Assoc. 45, 1409–1423. doi: 10.1111/j.1752-1688.2009.00375.x
Zhang, L., Dawes, W. R., and Walker, G. R. (2001). Response of mean annual evapotranspiration to vegetation changes at catchment scale. Water Resour. Res. 37, 701–708. doi: 10.1029/2000WR900325
Zhao, F., Strahler, A. H., Schaaf, C. L., Yao, T., Yang, X., Wang, Z., et al. (2012). Measuring gap fraction, element clumping index and LAI in Sierra Forest stands using a full-waveform ground-based lidar. Remote Sens. Environ. 125, 73–79. doi: 10.1016/j.rse.2012.07.007
Keywords: vegetation change, climate variability, simulation, forested watersheds, hydrologic cycle
Citation: Saksa PC, Conklin MH, Tague CL and Bales RC (2020) Hydrologic Response of Sierra Nevada Mixed-Conifer Headwater Catchments to Vegetation Treatments and Wildfire in a Warming Climate. Front. For. Glob. Change 3:539429. doi: 10.3389/ffgc.2020.539429
Received: 01 March 2020; Accepted: 14 August 2020;
Published: 09 September 2020.
Edited by:
Stephen Douglas Sebestyen, United States Forest Service (USDA), United StatesReviewed by:
Timothy Link, University of Idaho, United StatesMasanori Katsuyama, Kyoto Prefectural University, Japan
Copyright © 2020 Saksa, Conklin, Tague and Bales. This is an open-access article distributed under the terms of the Creative Commons Attribution License (CC BY). The use, distribution or reproduction in other forums is permitted, provided the original author(s) and the copyright owner(s) are credited and that the original publication in this journal is cited, in accordance with accepted academic practice. No use, distribution or reproduction is permitted which does not comply with these terms.
*Correspondence: Phil C. Saksa, cGhpbEBibHVlZm9yZXN0Lm9yZw==