 Huei Ying Gan
 Ingo Schöning
 Peter Schall
 Christian Ammer
 Marion Schrumpf
95% of researchers rate our articles as excellent or good
Learn more about the work of our research integrity team to safeguard the quality of each article we publish.
Find out more
ORIGINAL RESEARCH article
Front. For. Glob. Change , 03 September 2020
Sec. Forest Soils
Volume 3 - 2020 | https://doi.org/10.3389/ffgc.2020.00099
This article is part of the Research Topic Carbon-Nitrogen-Phosphorus Coupling in Forests View all 6 articles
Nutrient contents of soil organic matter in forests vary with regional differences in soil types and parent material, and can be modified by forest type and management intensity. Variation of organic carbon (OC)-to-nutrient ratios in soils supposedly alters microbial carbon and nutrient use efficiencies and the rates of OC-to-nutrient mineralization. Here, we studied mineralization rates of carbon (C), nitrogen (N), phosphorus (P), and sulfur (S) for topsoil samples from differently managed forest plots in Germany. Samples were incubated for two weeks in microlysimeters under controlled conditions. CO2 respiration, leachable dissolved organic carbon (DOC), nitrate (NO3–), ammonium (NH4+), sulfate (SO42–), and phosphate (PO43–) were determined as net organic C (OC) and nutrient mineralization rates. We hypothesized that in soils with high C-to-nutrient ratios, soil microbes may mobilize relatively more OC as CO2 or DOC than nutrients to meet their nutrient requirements. Further, we hypothesized that forest management practices, such as tree species selection and harvest intensity, potentially affect the stoichiometry of SOM mineralization by altering the ratios of C-to-nutrients in soils. Results showed that CO2-release rates were proportional to soil OC, but when normalized to microbial biomass C, they increased, similar to DOC leaching rates, with soil OC-to-N ratios. However, contrary to our expectation, higher soil OC-to-nutrient ratios did not go along with reduced nutrient leaching. Instead, when normalized to soil OC, the largest amounts of N, P, and S were leached in the most nutrient poor region, so that sites with highest soil OC-to-nutrient ratios had the smallest OC-to-nutrient mineralization ratio. Forest type and tree species selection affected soil stoichiometry only in the most nutrient poor region with higher OC-to-nutrient ratios under coniferous than deciduous forest sites. This potentially caused the significantly enhanced OC-normalized DOC leaching rates under coniferous forests. However, in the two other study regions tree species had a significant effect on N and S leaching rates and the ratio of OC-to-nutrient leaching despite similar stoichiometry. Overall, our study suggests that increasing nutrient scarcity enhances microbial based CO2 and DOC production, possibly because of increased energy demand for enzyme production and to remove excess OC to reach and mobilize more nutrients, thereby allowing for high nutrient leaching rates despite small total stocks. Forest management affected OC-to-nutrient mineralization rates mostly via tree species selection, but observed differences were not obviously caused by soil stoichiometry but rather by other ecological differences between forest types.
Soil organic matter (SOM) mineralization is an important process in which carbon (C) and nutrients are transformed to CO2 and plant-available forms of nitrogen (N), phosphorus (P), and sulfur (S) (Schimel and Bennett, 2004; Chapin et al., 2011). Carbon mineralization is tightly coupled to the release of mineral N, P, and S and can be driven by microbial requirements for C and nutrients for their maintenance, growth, and the production of extracellular metabolites including enzymes (Jonasson et al., 1999; LeBauer and Treseder, 2008; Vitousek et al., 2010).
Soil organic matter and plant litter often have organic carbon (OC)-to-nutrient ratios highly exceeding that of microbial C stoichiometry (McGroddy et al., 2004). This leads to a stoichiometric imbalance even though microbes need C and nutrients in excess to their mere biomass requirements to produce energy and extracellular enzymes. Accordingly, microbes utilize relatively more SOM and mineralize more OC to fulfill their nutrient requirements at sites containing large OC-to-nutrient ratios than at more nutrient-rich sites. This probably requires also a higher investment of extracellular enzymes resulting in a reduced carbon use efficiency (CUE) and an increased nutrient use efficiency (Tracy et al., 1990; Mooshammer et al., 2014a). Accordingly, OC-to-nutrient ratios of various organic materials and SOM in deciduous forest topsoils have been shown to be positively related to C mineralization and negatively to N mineralization (Janssen, 1996; Bengtsson et al., 2003).
Alternatively, excess OC can also be left behind and released to the soil solution as dissolved organic carbon (DOC) after the breakdown of large macromolecules when nutrients rather than C are limiting microbial growth (Hessen and Anderson, 2008). Under nutrient limitation, microbial mineralization of organic S from sulfate esters and organic P may also occur independently of OC mineralization, thus decoupling C from P and S mineralization (McGill and Cole, 1981). Decoupling of C and N could also be observed in N-limited soils where N-containing monomers such as amino acids, amino sugars, and nucleic acids are depolymerized through enzymatic reactions and directly taken up by microbes without prior conversion to inorganic nutrients (Schimel and Bennett, 2004).
Although extensive studies have investigated the effects of soil properties and litter stoichiometry on SOM mineralization, few experimental studies addressed the interactions between the mineralization rates of C and different nutrients in different soils simultaneously (Kowalenko and Lowe, 1975; Tracy et al., 1990; Bridgham et al., 1998). Specifically, few studies have linked the ratios of OC-to-nutrients in SOM to the ratios of mineralized C-to-nutrients (Burke et al., 1989), which may be a better indicator for microbial C and nutrient use efficiencies than the mineralization rates of C and nutrients separately. Consequently, a comprehensive study of effects of nutrient stoichiometry on SOM mineralization and on the potential release of plant available nutrients is still missing.
Forest management practices such as tree species selection, thinning, harvesting, and dead wood removal have the potential to alter the ratios of C-to-nutrients in forest soils and subsequently SOM mineralization and the release of plant-available nutrients (Bauhus et al., 1998; Vesterdal and Raulund-Rasmussen, 1998; Johnson and Curtis, 2001; Nave et al., 2010). Different from experimental settings, various aspects of forest management can vary independently from each other in real landscapes, hampering the comparison of different forest management classes. One way to quantitatively address forest management intensity in real landscapes are forest management indexes like the silvicultural management intensity (SMI) index (Schall and Ammer, 2013). It is based on two different components describing the most important management decisions. The first component assesses the risk of stand loss (SMIr) by calamities before the stand reaches an age of 180 years and is related to tree species identity and stand age. Higher management intensity values are indicative of young spruce forests and small values of unmanaged beech forest. The second component indicates the stand density (SMId) and measures the actual total basal area of trees on a site relative to its potential maximum density (Schall and Ammer, 2013). These indexes offer a potential way to disentangle (i) the effects due to tree species differences such as litter chemistry and quality, and (ii) the effects of harvest and thinning intensity such as the quantity of litter input, but have so far not been tested for this purpose. Forest management effects on SOM properties and mineralization can further differ between regions with different soil properties and fertility (Vesterdal et al., 1995). It was shown before that regional differences in climate, topography, and soil abiotic conditions affect soil biotic properties (Birkhofer et al., 2012) and therefore likely also soil C and nutrient transformations.
The overall objective of this study was to examine how soil stoichiometry and forest management affect C, N, P, and S mineralization in temperate forest ecosystems. The study is based on topsoil samples taken from 150 forest sites of three regions in Germany [Schwäbische Alb (ALB), Hainich-Dün (HAI), and Schorfheide-Chorin (SCH)] under the framework of the Biodiversity Exploratories, where large-scale and long-term research sites were established to study the effects of land use and management on multiple ecological processes (Fischer et al., 2010). Soil incubations were performed under controlled conditions for 14 days to determine the rates of CO2 respiration and NO3–, NH4+, SO42–, and PO43– released as indicators for net C and nutrient mineralization rates, as well as the rates of DOC leaching. Thereby we tested the following hypotheses:
1. In soils with increasing OC-to-nutrient ratios, microbial nutrient acquisition requires more energy and results in the removal of “excess” C, which is done by increasing respiration rates and DOC production per unit microbial biomass.
2. Increasing nutrient limitation at sites with high soil OC-to-nutrient ratios leads to an overall decrease in net nutrient release to the soil solution as more nutrients are being immobilized. Accordingly, CO2-to-nutrient release ratios should increase with soil OC-to-nutrient ratios as a result of increasing CO2 production per microbial biomass (H1), but nutrient release rates should decline with increasing nutrient limitation.
3. Larger forest management intensity, which prefers short-rotating coniferous over deciduous tree species, will affect SOM mineralization by increasing soil OC-to-nutrient ratios. This leads to a relative increase in CO2 release per OC, but a decline in nutrient mineralization and thus increasing the ratios of CO2-to-nutrient release with conifer cover and increasing SMIr. Increased harvesting and thinning on more intensively used sites should result in reduced litter input and thus affect total mineralization rates, but not their stoichiometry.
The study sites are distributed across three regions in Germany: the (i) SCH in the lowlands of North-eastern Germany; (ii) the HAI in the hilly landscape of Central Germany; and (iii) the ALB in the low mountain range of South-western Germany (Fischer et al., 2010). The study regions differ in climate and soil parent materials and accordingly have different dominant soil types. Soils in the ALB region developed mainly on Jurassic limestone and were clay-rich Leptosols or Cambisols (IUSS Working Group WRB, 2014). Soils in the HAI region had a loamy or clayey texture due to the dominant geological substrate of loess over limestone. The main soil types were Luvisols and Stagnosols. In the SCH region, soils had a sandy soil texture as the geological substrate was glacial till covered by glacio-fluvial or aeolian sand. The soils were classified as Arenosols or Cambisols. Soils in SCH contained low amounts of clay, while the clay content was intermediate in HAI and high in the ALB soils. Although the soil texture was different across study regions, there were no significant differences in soil texture between coniferous and deciduous forest in all study regions (Table 1; Solly et al., 2014).
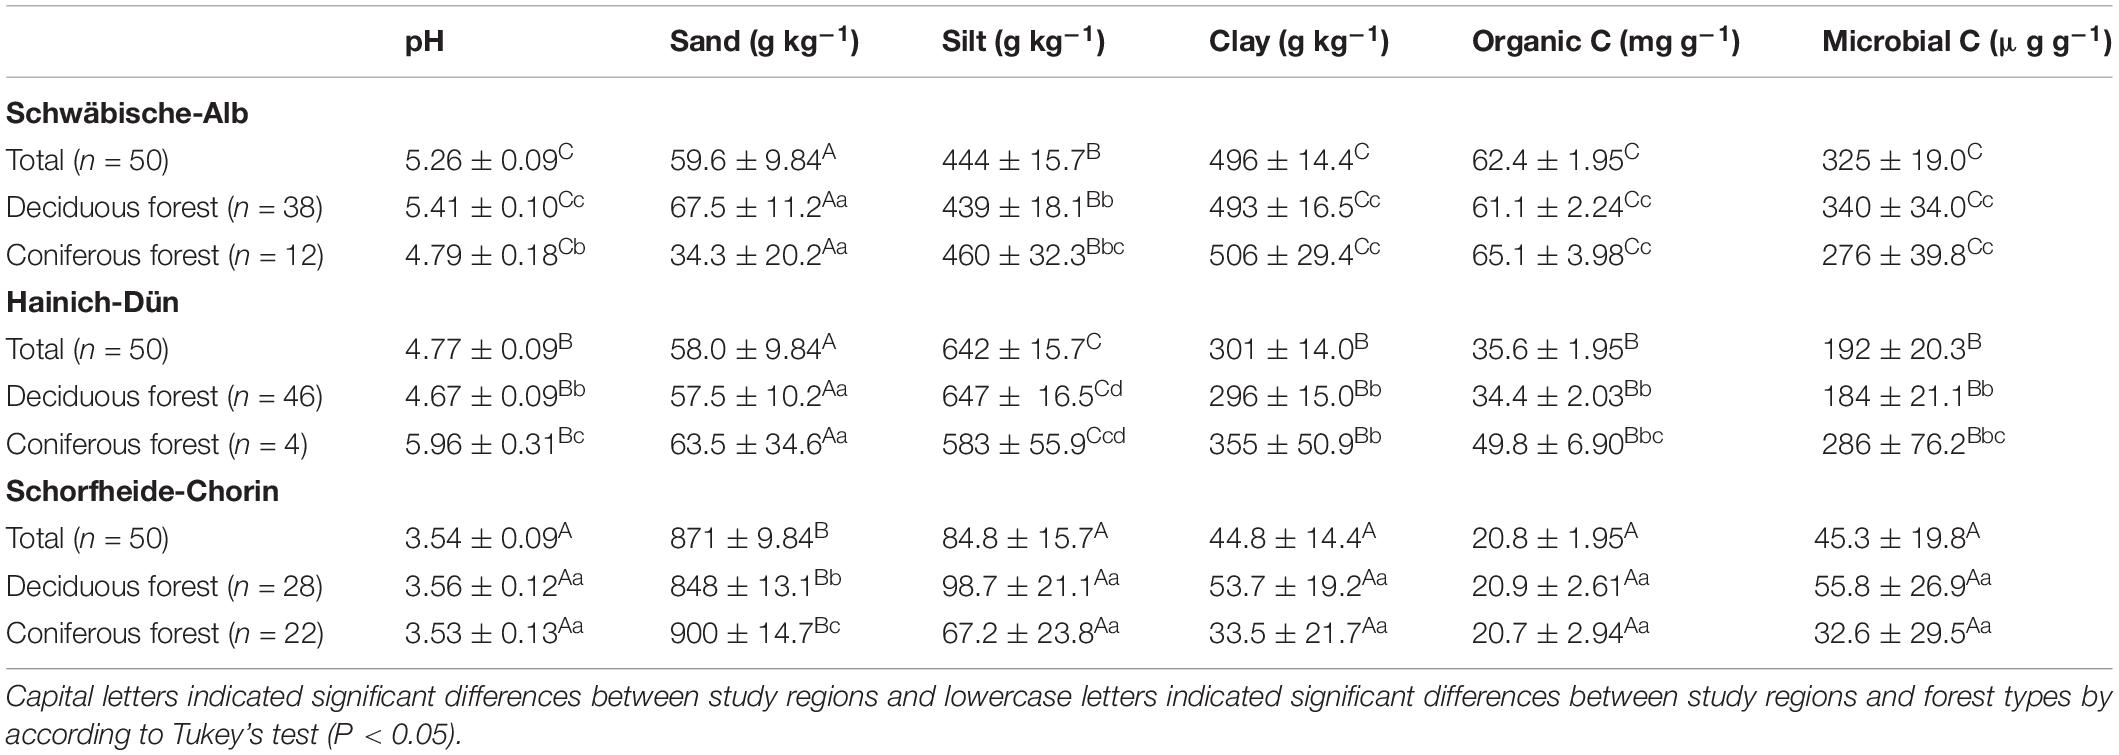
Table 1. Soil pH, sand, silt and clay contents, organic carbon (C), and microbial C concentrations under different study regions and managements (mean ± SE).
In each study region, 50 forest plots were sampled resulting in a total of 150 study sites. The forests were dominated by European beech (Fagus sylvatica), oak (Quercus robur and Quercus petraea), Norway spruce (Picea abies), or Scots pine (Pinus sylvestris) and varied in management intensity. They included unmanaged forests, even-aged forests and uneven-aged stand types (Schall et al., 2018). In order to determine effects of different tree functional types, forests were categorized into deciduous and coniferous forest plots based on the dominant tree species.
In addition to using the broad categories coniferous and deciduous forests, forest management effects were studied using the SMI index (Schall and Ammer, 2013). To calculate the SMI, the average values of two components were assessed: (i) the risk of stand loss (SMIr) and (ii) the stand density (SMId). The risk component (SMIr) quantifies the effects of tree species identity and stand age on the probability of a stand loss. It is calculated as the probability of a stand loss before the age of 180 years (P180), which is used as a reference for old-growth forests, conditional to the age already achieved (t0):
with S defined as a species-specific survivor function. SMIr is higher for Norway spruce and Scots pine than for European beech and decreases nonlinearly with stand age. The stand density component (SMId) quantifies the deviation of the actual stand stocking from the carrying capacity of the site reflecting the intensity of harvests and thinnings. It is calculated as:
where G is the actual basal area (G in m2 ha–1) of a stand at a specific site and Gnat, max is the carrying capacity of the site, i.e., the maximum natural basal area. SMId is high for young stands and decreases with biomass accumulation by stand growth, being modulated by thinning intensity. A detailed description of the SMI and its components is provided in Schall and Ammer (2013).
Mineral soil samples (0–10 cm) in each forest site were taken in May 2011 and 2014. Each time a total of 14 soil cores were collected with a split tube sampler (diameter of 5 cm) along two 40 m transects. Organic layers were removed with a 225 cm2 metal frame before coring. We then prepared a composite mineral soil sample for each forest plot by mixing the upper 10 cm of the mineral soil. Only the mineral soil samples were used in this study. Soil samples were sieved to <2 mm. One aliquot of the mineral soil was kept field moist and stored at −20°C, a second aliquot was air-dried.
For pH measurement, air-dried soil was mixed with 0.01 M CaCl2 solution with a ratio of 1:2.5. Afterwards the pH of the soil suspension was measured twice using a glass electrode (pH meter 538, WTW, Weilheim, Germany). Soil texture was determined using the pipette method (DIN ISO 11277,2002). Texture analysis included three main steps: (i) destruction of SOM with hydrogen peroxide, (ii) dispersion of soil aggregates into discrete units, and (iii) separation of soil particles of different size by sieving and sedimentation. Total C and N concentrations were determined by dry combustion using an elemental analyser (VarioMax, Elementar, Hanau, Germany). After the removal of OC by ignition of soil samples at 450°C for 16 h, inorganic C (IC) was determined with the same elemental analyser. Organic C concentrations were calculated as the difference between total C and IC. Total P and S concentrations were determined by ICP-OES (Acros, Spectro, Kleve) after the extraction of the air-dry soil with aqua regia at a temperature of 96°C for 3 h. The soilOC-to-N, OC-to-P and OC-to-S ratios were calculated as the mass of OC against the mass of total N, total P, and total S.
Microbial (biomass) C was quantified using chloroform fumigation extraction (CFE) method as modified from Jenkinson and Powlson (1976) and Vance et al. (1987) at the beginning of the incubation to study the relations between microbial C and nutrient mineralization. CFE was performed by extracting two separate soil aliquots from the same sample. For the extraction of total soil DOC without microbial C, 30 ml of 0.05 M K2SO4 solution were added to 6 g of fresh soil in PE tubes and were shaken horizontally for 30 min followed by centrifugation (2890 × g) for 2 min. The supernatants were filtered using Whatman N° 1 filter paper pre-rinsed with 50 ml of 0.05 M K2SO4 and stored immediately at 4°C prior to analysis. Soil DOC concentrations in extracts were measured with a TOC analyzer (“high TOC,” Elementar Analysensysteme GmbH, Hanau). For the extraction of total soil DOC including microbial C, 6 g of fresh soil were first fumigated in a desiccator containing CHCl3 for 24 h followed by the extraction of DOC, which was performed in the same way as the non-fumigated soils. The concentrations of microbial biomass C were calculated as the difference between DOC in fumigated and non-fumigated soils.
For the measurement of N, P, and S mineralization, field moist soil samples (40 g) were incubated in microlysimeters (Figure 1) in the dark at 20°C for 14 days. All samples were adjusted to 60% of water holding capacity (WHC) and pre-incubated at 20°C for 4 days. After 4 days of pre-incubation, the soil samples were leached with 80 ml of 0.01 M CaCl2 solution to remove the accumulated nutrients during this period. The microlysimeters were constructed according to the method of Nadelhoffer (1990) using 250 ml two-chamber filter holders with receiver (Nalgene 300–4000 Polysulfone Graduated Filter Holder, Thermo Fisher Scientific, Waltham, MA, United States) and high-purity and plasticizer-free tubes (Tygon S3TM E-3603 Flexible Tubings, Saint-GobainTM). Non-biodegradable glass fiber filters with a particle retention size of 1.2 μm (Glass Microfiber Filters, Sartorius, Göttingen, Germany) were placed on the filter unit of the microlysimeters. Dissolved OC from the collected filtrate was measured using TOC analyzer “high TOC” (Elementar Analysensysteme GmbH, Hanau), NH4+ and NO3– using flow injection analysis “Quikchem QC85S5” (Lachat Instruments, Hach Company, Loveland, CO, United States) and SO42– using ion chromatography “DX 500” (Thermo Fisher Scientific GmbH, Idstein, Germany). In the following we define the released CO2 and nutrients as net mineralization, which is an important indicator of plant-available nutrients. The microlysimeter units were pressure-tested for leakage using a vacuum pump. To avoid clogging of soil samples on the filter during long term incubations, 40 g of acid-washed sand was placed on top of the glass fiber filters, followed by the soil samples. The microlysimeter volume was calculated using Boyle’s law and the following equation:
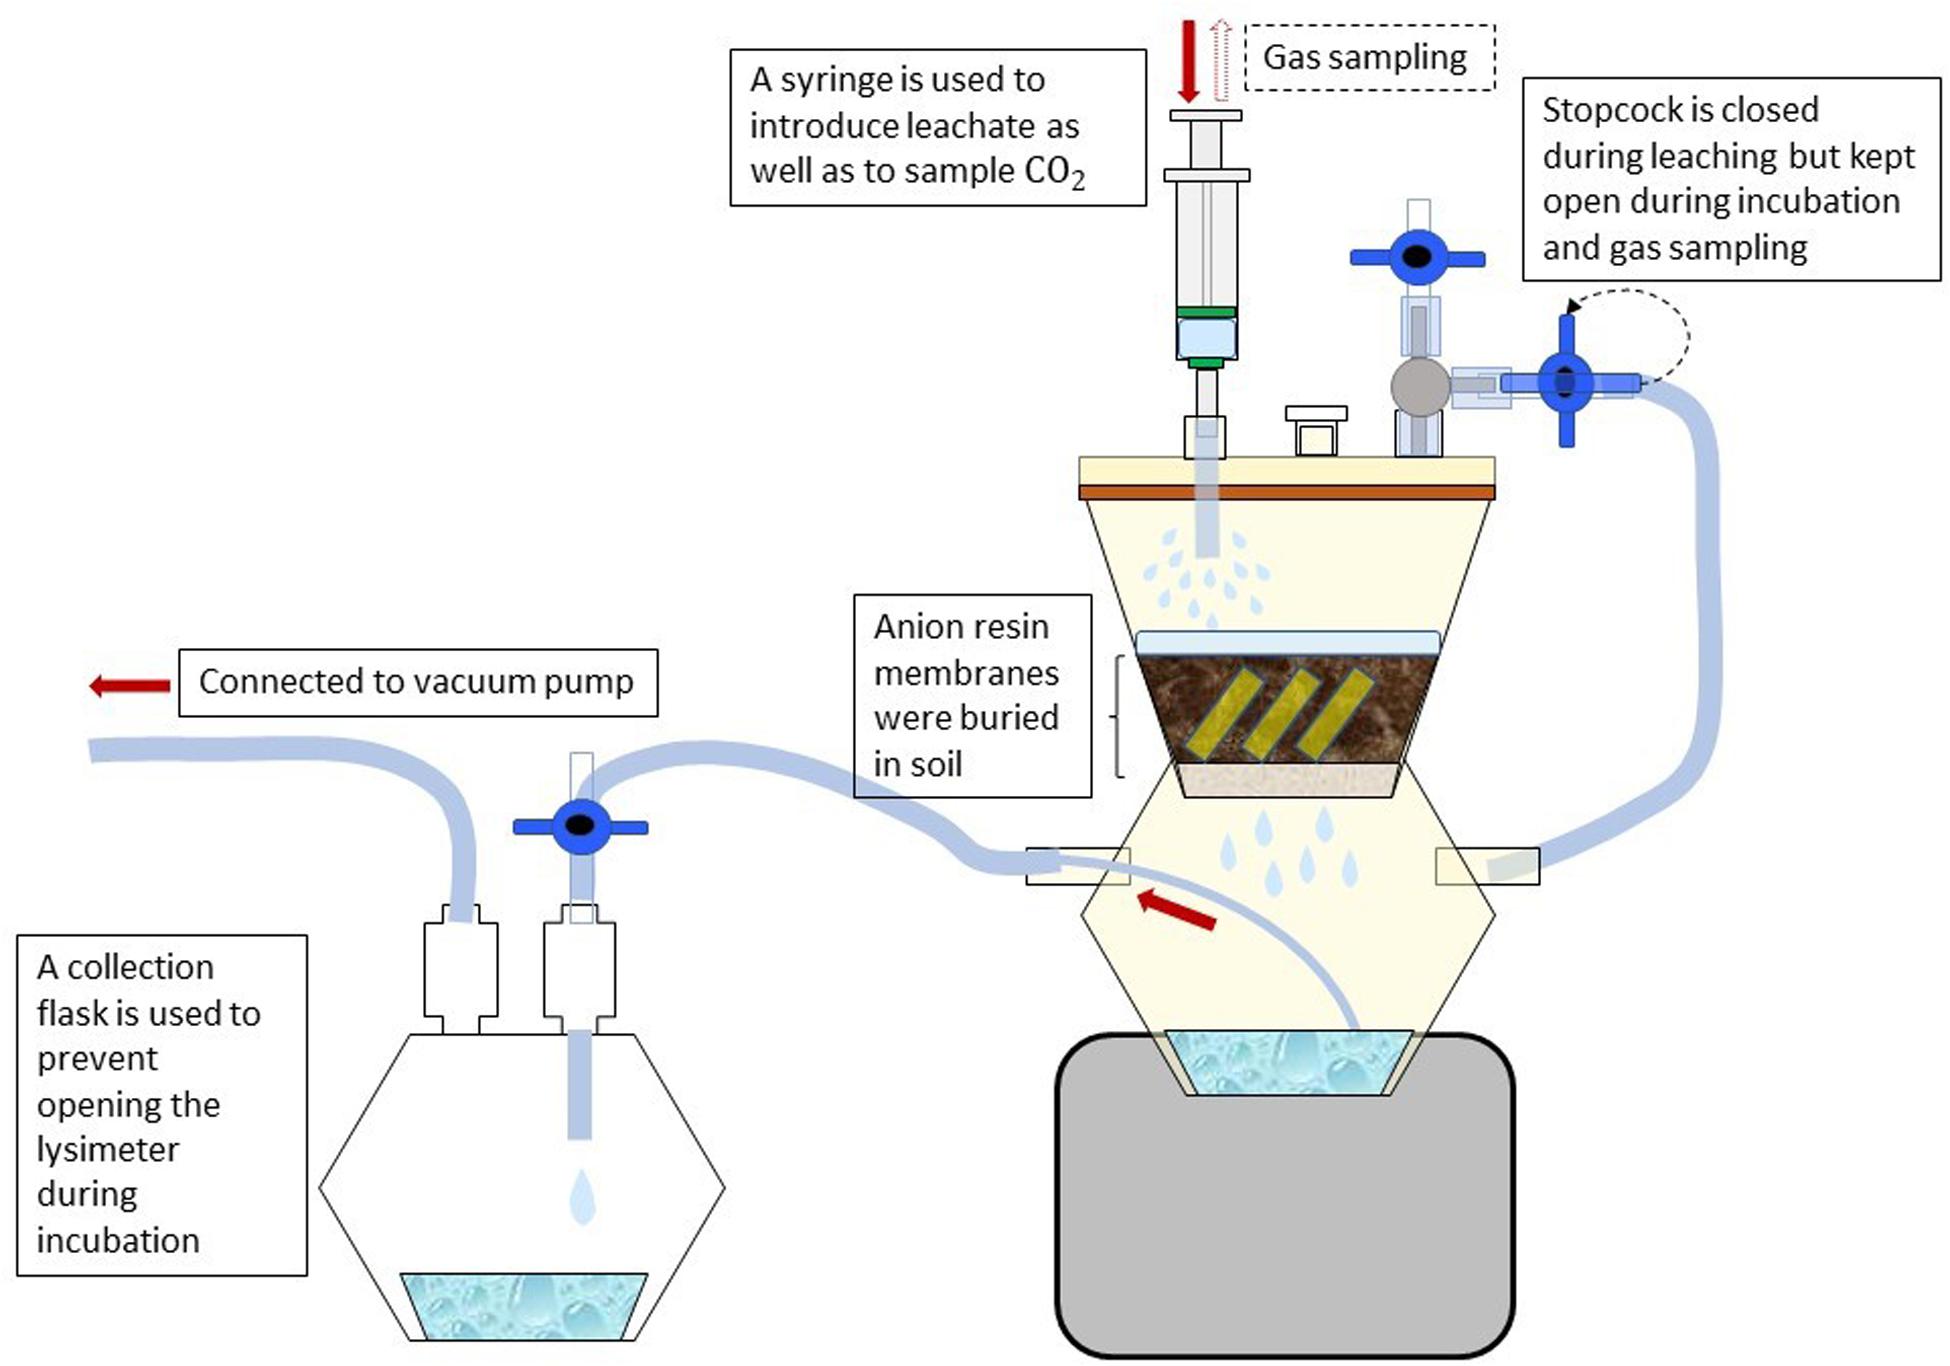
Figure 1. Design of soil incubation and nutrient leaching using a microlysimeter. Samples were leached with weak salt solution to remove nutrients mineralized during incubation. A collection flask is used to retain the leachate from the bottom chamber of the microlysimeter using a vacuum pump. Resin membranes were used to capture phosphate mineralized during the incubation.
where VS is the volume of the microlysimeter, Patm is the atmospheric pressure, VP is the volume of a vacuum pump and PS is the pressure in the microlysimeter.
The rates of OC mineralization were obtained from an independent soil incubation carried out in 2011 for soils from the same sites, which were collected following identical sampling protocols as in 2014. The OC mineralization showed nevertheless strong correlations with soil OC concentrations measured from the soil samples collected in 2014, which were comparable to those incubated in 2011 (Supplementary Figure 1). Soil incubation for OC mineralization was carried out in modified 1 L marmalade jars with two gas outlets and was measured after 7 and 14 days of incubation using a differential, non-disperse infrared (NDIR) CO2-analyzer (LI- 6262, Licor, Lincoln, NE, United States). The metabolic quotient (qCO2) was calculated by dividing the average rates of OC mineralization after 14 days by the microbial biomass C. To measure the mineralization potentials of N, P, and S as well as leachable DOC, soil samples were leached with 80 ml of 0.01 M CaCl2 solution. To leach the soil sample, a short tube with holes was inserted in the outlet of the upper chamber through which the rinsing water was applied to obtain a gentle shower effect. This was done to reduce disturbance of the soil aggregates by the leaching solution, which could clog the filter. The filtrate from leaching was collected through vacuum suction (700 mbar) using mason jars with two gas outlets modified from marmalade glass jars; one attached to the vacuum pump and one attached to the lower chamber of the microlysimeters. The filtrate collected from leaching was frozen immediately and kept at −20°C until analysis. After leaching, the microlysimeters were flushed with CO2-free synthetic gas (20.5 Vol.-% O2, rest N2, Westfalen AG, Germany) for at least 2 min (psi) and sealed for further incubation. As control treatment for nutrient leaching, the same microlysimeter was set up and sampled without soil samples.
Due to the potential sorption of mineral P to soil surfaces, anion exchange resin membranes were used to absorb PO43– from the soil solution Kouno et al. (1995). For each microlysimeter, a total of 6 resin membranes cut into 2 × 1 cm stripes were buried for two weeks in the soil samples after the pre-incubation. To elude the mineralized PO43–, the resin stripes were removed from the soil, rinsed thoroughly with deionized water to remove soil particles attached to the membrane surface, and shaken for 2 h (150 rpm) in 20 ml of 0.2 M nitric acid (HNO3). PO43– released into the acid solution was quantified colorimetrically using flow injection analysis (Murphy and Riley, 1962).
Statistical analysis was conducted using the R version 3.3.2 (R Core Team, 2016). Results for C, N, P, and S mineralization and soil properties are presented as mean ± SE. To examine if the mineralization rates were statistically different among forest types and management, analysis of variance (ANOVA) with the function “aov” was used. Prior to ANOVA analysis, normality and homogeneity of residual variances were checked visually with diagnostic plots. Data that did not fulfill the conditions for normality and homogeneity of residual variances were log transformed. Redundancy analysis (RDA) was performed with the function “rda” of the Vegan work package (Oksanen et al., 2006) to identify the correlations between response variables (the mineralization rates of C, N, P, and S) and predictor variables (soil clay content, SOC, soil TN, TP, TS, microbial C, soil pH, soil C:N, C:P, and C:S ratios, as well as SMIr and SMId). From RDA biplot, predictor variables that showed significant correlations with soil mineralization were selected to run an analysis of covariance (ANCOVA) using the “aov” function in R.
Soil properties varied between study regions due to different parent materials and climatic conditions. Soil pH, clay content, OC, and microbial C content all increased in the order SCH < HAI < ALB (Table 1). Similarly, total N, P, and S concentrations were significantly different between all three study regions (SCH < HAI < ALB). In terms of soil stoichiometry, HAI and ALB had similar OC-to-N and OC-to-S ratios, while SCH had significantly larger values. For the OC-to-P ratio on the other hand, ALB had significantly smaller values than HAI and SCH (Table 2). Accordingly, the SCH region had overall the smallest nutrient contents with smallest absolute amounts and largest OC-to-nutrient ratios.
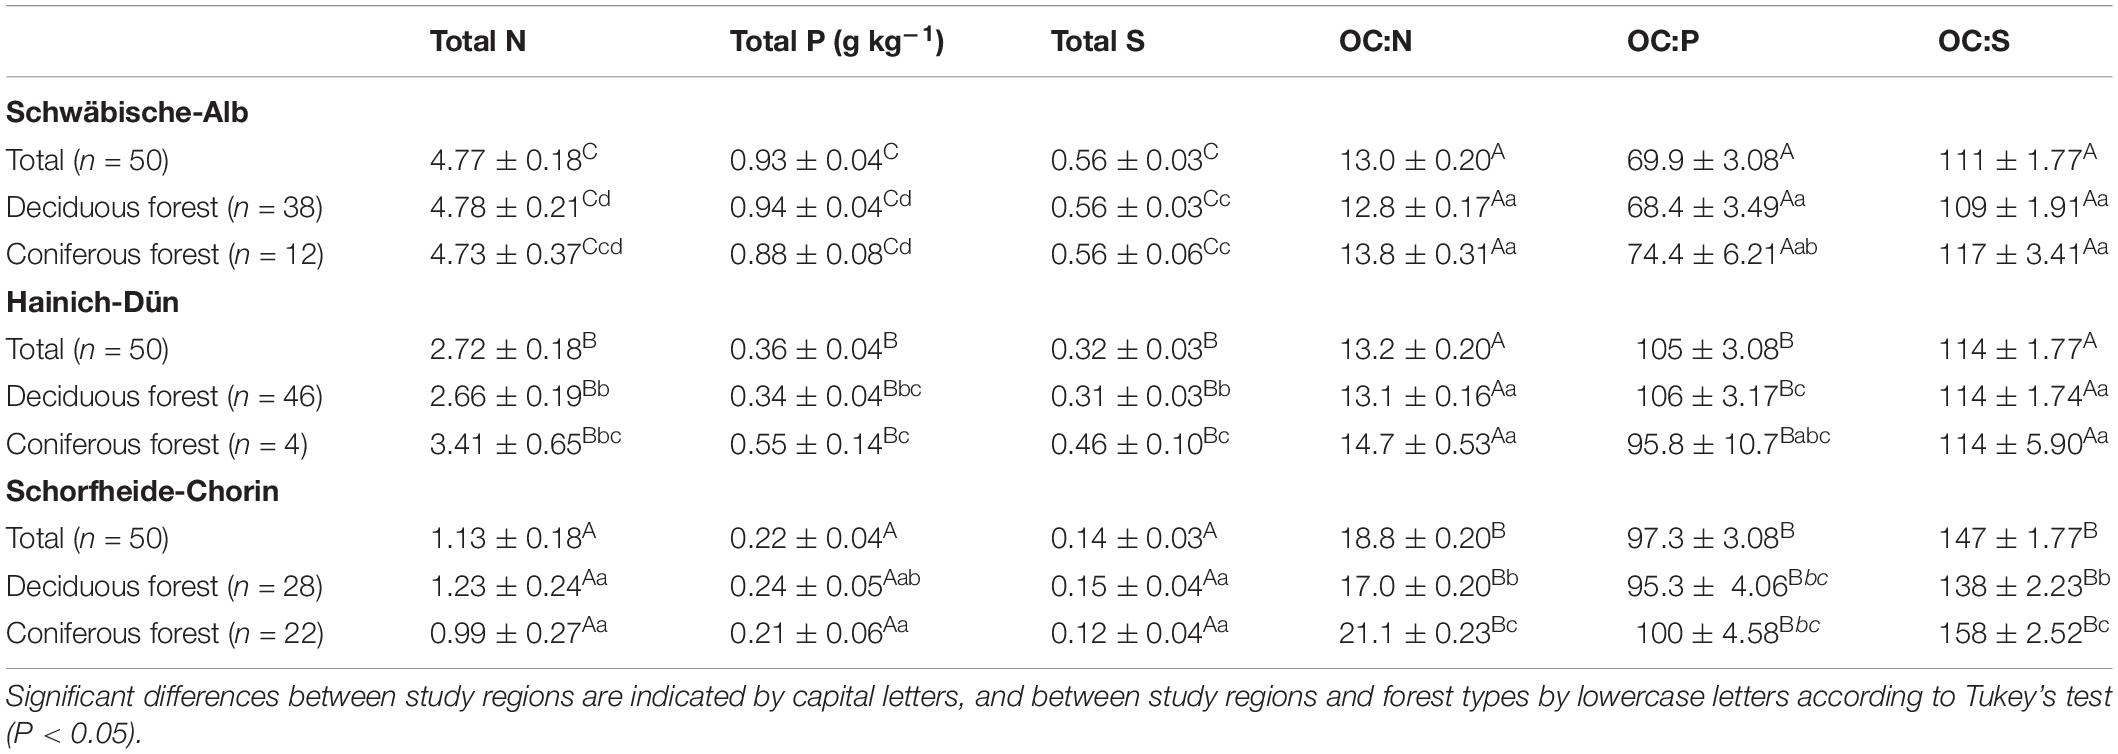
Table 2. Mean values of soil total N, P, and S concentrations and OC:N, OC:P, and OC:S ratios under different study regions and managements (mean ± SE).
Forest type had no significant effect on OC, total nutrient, or microbial C contents (Table 1). It had, however, and effect on soil nutrient stoichiometry with higher OC-to-N and OC-to-S ratios for soils under coniferous forest, but mostly and only significantly in the SCH region (Table 2). The OC-to-P ratio was not consistently affected by forest type.
The rates of C, N, P, and S mineralization per g dry weight soil showed considerable variations between study regions and forest types (Figure 2). In accordance with soil OC, average C mineralization rates increased in the order: SCH < HAI < ALB. This was, however, not the case for DOC and nutrient leaching. In the most nutrient poor region SCH, N-leaching was also the smallest. S-leaching in SCH was, however, similar to leaching rates in the ALB region, despite smaller absolute S amounts in soil samples at SCH, and leaching rates in SCH were even significantly higher for P than in the other two regions.
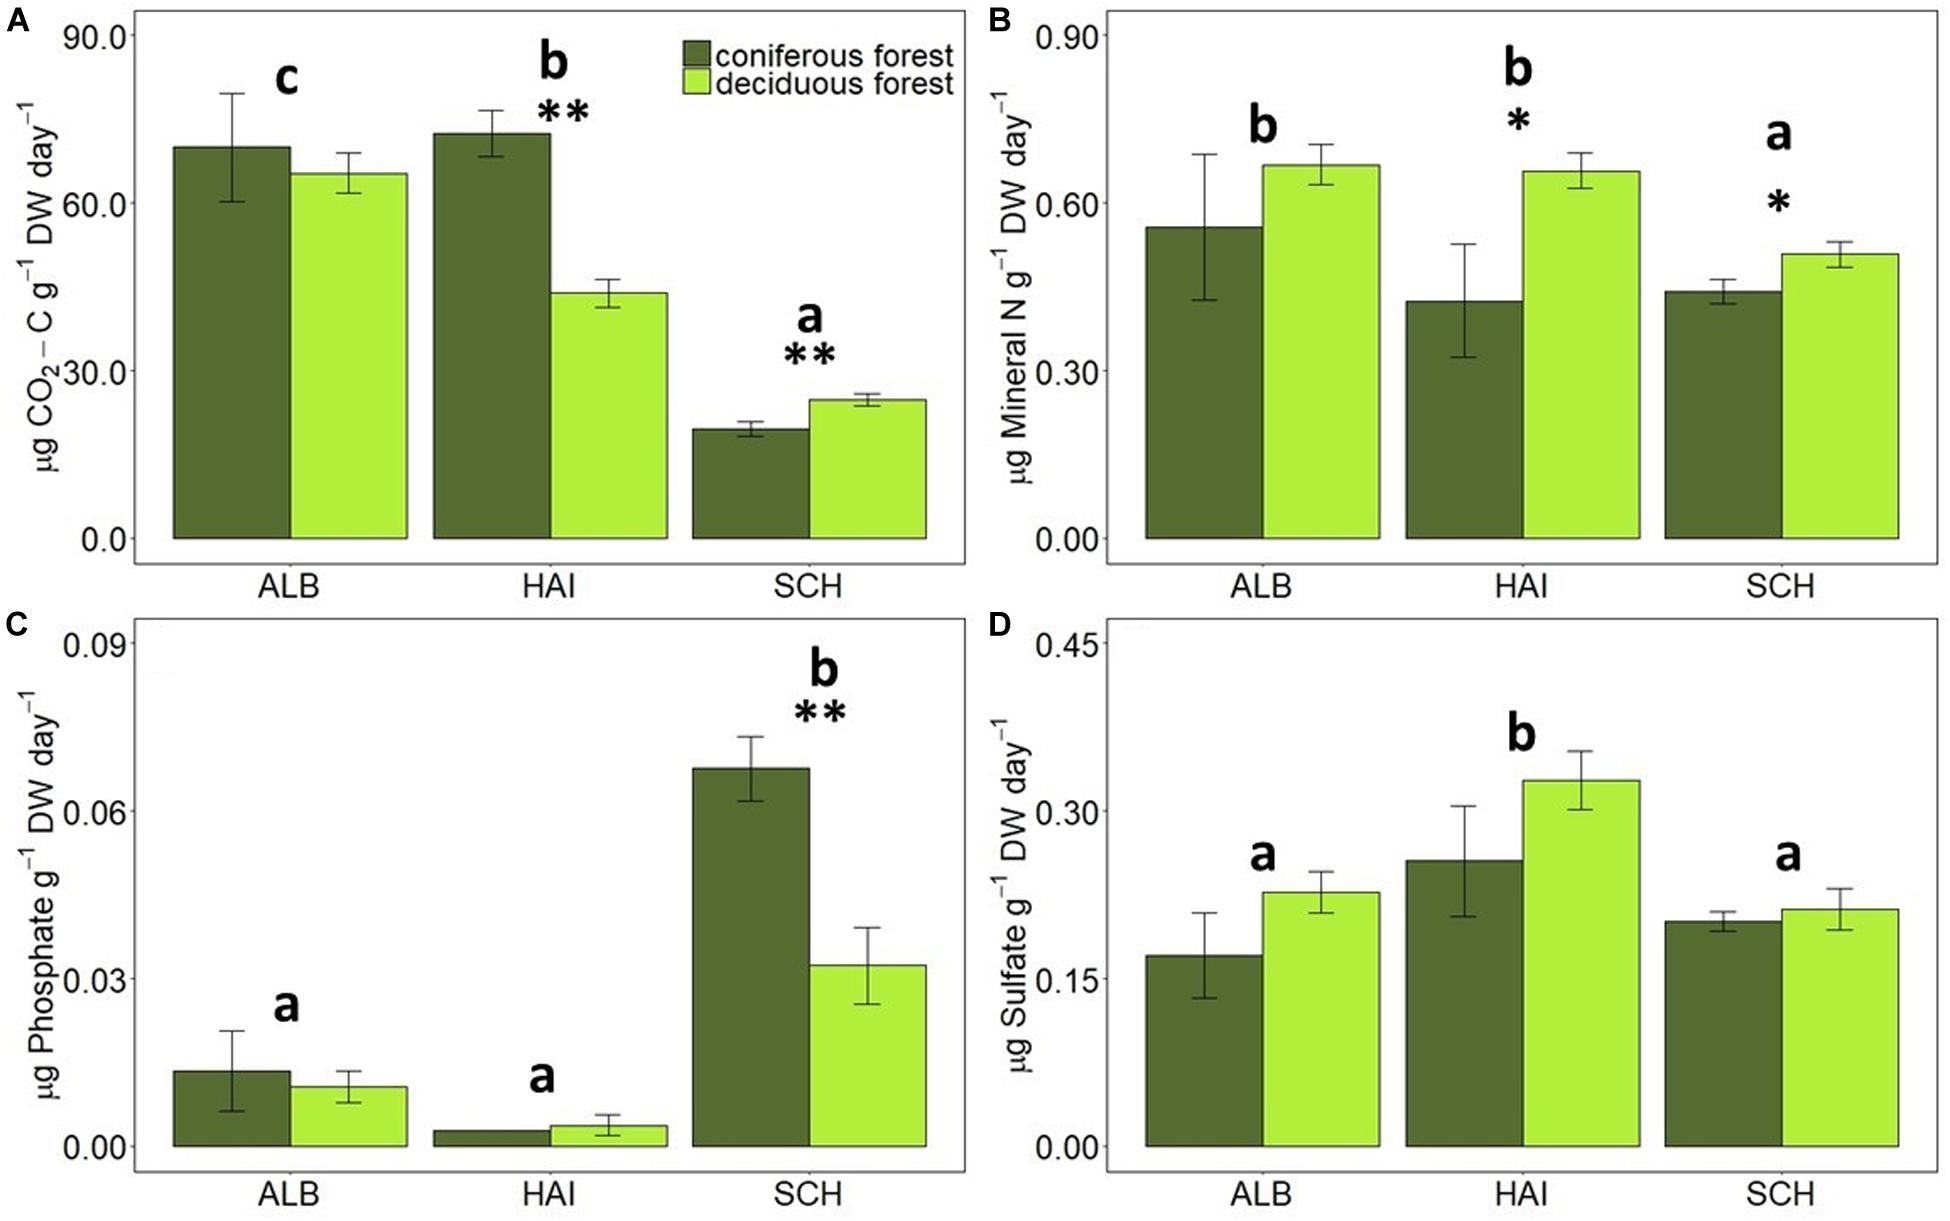
Figure 2. Comparison of average mineralization rates of (A) C, (B) N, (C) P, and (D) S in different study regions and forest types. Error bars represent SE of means. X-axis represents study regions where ALB, Schwäbische-Alb; HAI, Hainich-Dün; SCH, Schorfheide-Chorin. Significant differences of variance between study regions are denoted by small letters, and between coniferous and deciduous forests by ∗P < 0.05 and ∗∗P < 0.01. Number of study sites included: ALB (deciduous forests, n = 38 and coniferous forest, n = 12), HAI (deciduous forests, n = 46 and coniferous forest, n = 4) and SCH: (deciduous forests, n = 28 and coniferous forest, n = 22).
When normalized to the amount of OC in the soil, CO2 release rates were the highest in HAI and the smallest in ALB, with SCH exhibiting intermediate rates. OC-normalized nutrient leaching rates were similar as for non-standardized rates where the P mineralization was observed in SCH, but for N and S they increased now from ALB < HAI < SCH, so that SCH had the highest OC-normalized nutrient leaching rates. This is also reflected in the stoichiometric ratio of OC-to-nutrient mineralization, which were consistently the lowest for the most nutrient- and OC-poor region SCH, and were the highest for the most nutrient- and OC-rich region ALB. The HAI region exhibited in accordance with its soil properties intermediate values, but different from soil OC-to-nutrient stoichiometry, the ratios for mineralization rates were more similar to SCH for OC-to-N and OC-to-S, but more similar to ALB for OC-to-P mineralization.
Forest type affected CO2-release rates for the HAI and SCH region, but these differences were not significant any more, when rates were normalized to soil OC contents. Deciduous forests had on average larger N- and S-mineralization rates than coniferous forests, but these differences were only significant for N-leaching in HAI and SCH, when expressed per g of soil, and for N-leaching in HAI and S-leaching in ALB, when normalized to soil OC (Figures 2, 3). P-leaching was on the other hand significantly higher under coniferous than deciduous forests, but only in the SCH region and for both, non- and OC-normalized rates. Accordingly, the stoichiometric ratios of OC-to-N and OC-to-S mineralization were higher for coniferous than deciduous forests in ALB and HAI, while OC-to-P mineralization was significantly higher in deciduous than coniferous forests in SCH (Figure 4).
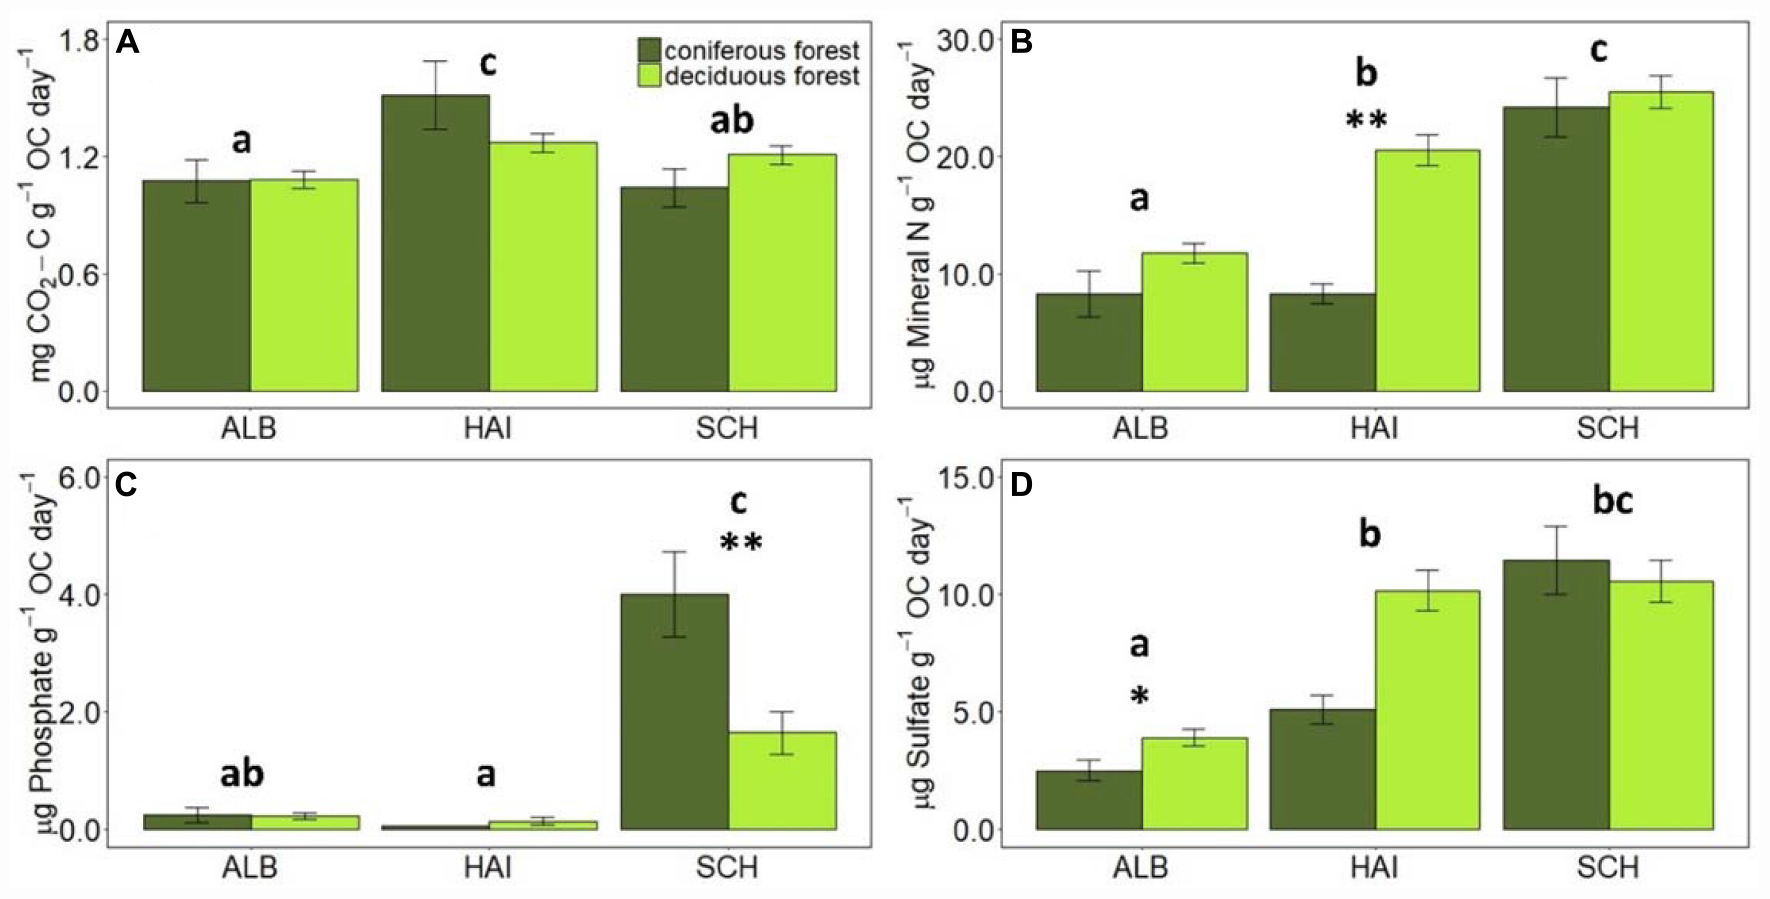
Figure 3. Comparison of average mineralization rates of C, N, P, and S normalized to SOC values in different study regions and forest types. Error bars represent SE of means. X-axis represents study regions where ALB, Schwäbische-Alb; HAI, Hainich-Dün; SCH, Schorfheide-Chorin. Significant differences of variance between study regions are denoted by small letters, and between coniferous and deciduous forests by ∗P < 0.05 and ∗∗P < 0.01. Number of study sites included: ALB (deciduous forests, n = 38 and coniferous forest, n = 12), HAI (deciduous forests, n = 46 and coniferous forest, n = 4), and SCH: (deciduous forests, n = 28 and coniferous forest, n = 22).
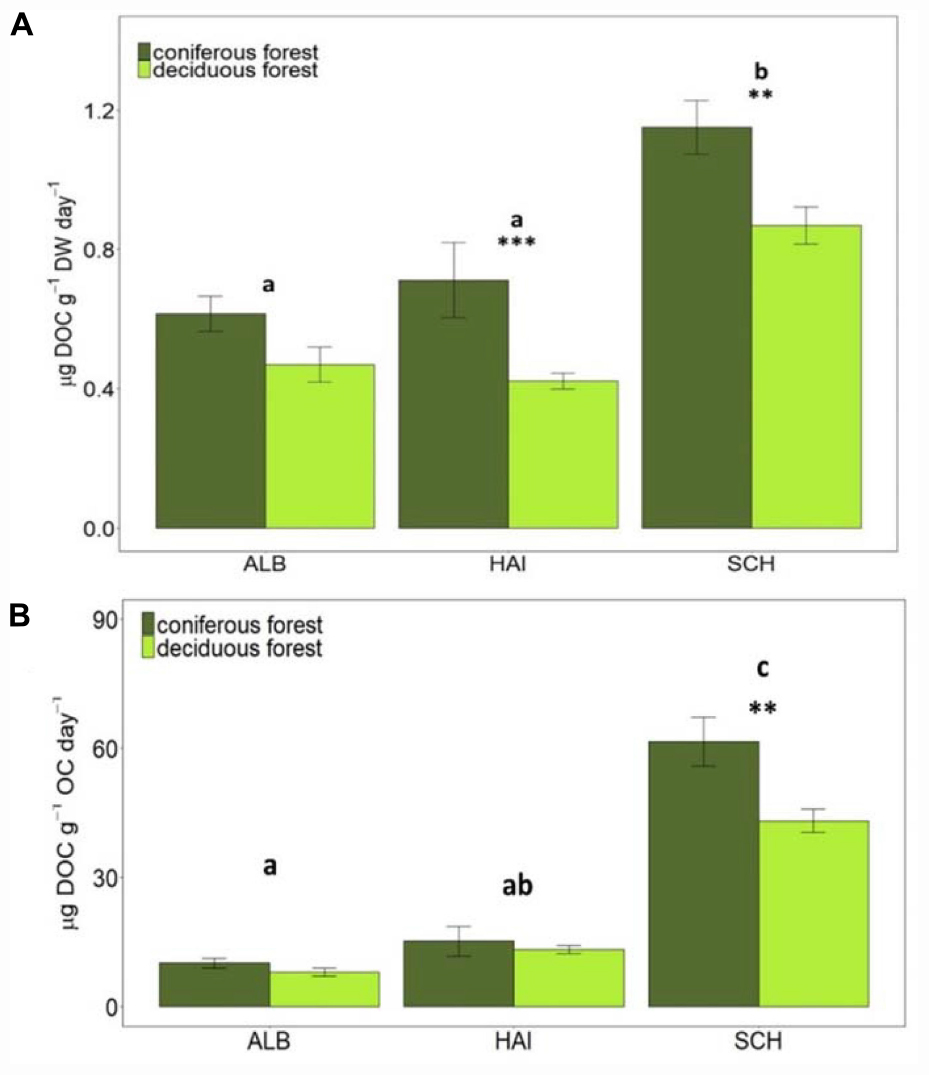
Figure 4. Dissolved organic carbon (DOC) (A) per g soil (dry weight) and (B) per g SOC leached in different study regions and forest types. Error bars represent SE of means. X-axis represents study regions where ALB, Schwäbische-Alb; HAI, Hainich-Dün; SCH, Schorfheide-Chorin. Significant differences of variance between study regions are denoted by small letters, and between coniferous and deciduous forests by ∗∗P < 0.01 and ∗∗∗P < 0.001. Number of study sites included: ALB (deciduous forests, n = 38 and coniferous forest, n = 12), HAI (deciduous forests, n = 46 and coniferous forest, n = 4), and SCH (deciduous forests, n = 28 and coniferous forest, n = 22).
Additional to SOM mineralization a release of DOC was observed. Among study regions, the highest DOC leaching occurred in the nutrient poor SCH region, also after normalization to soil OC (Figure 4). Between forest types, DOC leaching rates were overall higher in coniferous than deciduous forests. These differences were significant for HAI (P < 0.001) and SCH (P < 0.01) for non-normalized and for SCH only for OC-normalized rates. Since DOC fluxes are, however, significantly smaller than respiration fluxes, they are quantitatively less important for stoichiometric calculations than CO2-release.
Redundancy analysis showed that study regions were clustered together more strongly than forest types, indicating that differences associated with study regions (i.e., soil properties) have stronger effects on C, N, P, and S mineralization than management (Figure 6). OC, microbial biomass C, total N, P, S concentrations and soil pH were positively correlated. Carbon mineralization rates were clearly separated from N, P, and S mineralization. Instead, C mineralization was positively correlated with OC and microbial C. Dissolved OC leaching negatively correlated to soil pH and was the highest at the sandy and acidic soils in SCH. Similarly, high P mineralization was linked to the sandy soils in SCH and was positively correlated to DOC leaching. Nitrogen mineralization rates were positively correlated to S mineralization rates and both were negatively correlated to P mineralization. The stand density forest management index SMId showed only very weakly relations to all studied soil properties or mineralization rates, while SMIr was negatively related to N and S mineralization, suggesting smaller N and S leaching with higher management intensity and thus a higher contribution of coniferous species.
The effects of study region, microbial C and forest management were further examined using linear models (Table 3). Results showed that study region (42–59%) explained the largest part of variation in C and P mineralization as well as DOC leaching across sites. For N and S mineralization, however, the effects from study regions were smaller (8 and 18%). After accounting for differences from study regions, soil microbial C showed significant effects for all nutrients mineralized including DOC leaching. Further, the risk component of the silvicultural management intensity (SMIr) had significant effects on DOC leaching as well as N and S mineralization. Significant interaction effects were also observed between SMIr and microbial C on N and S mineralization.
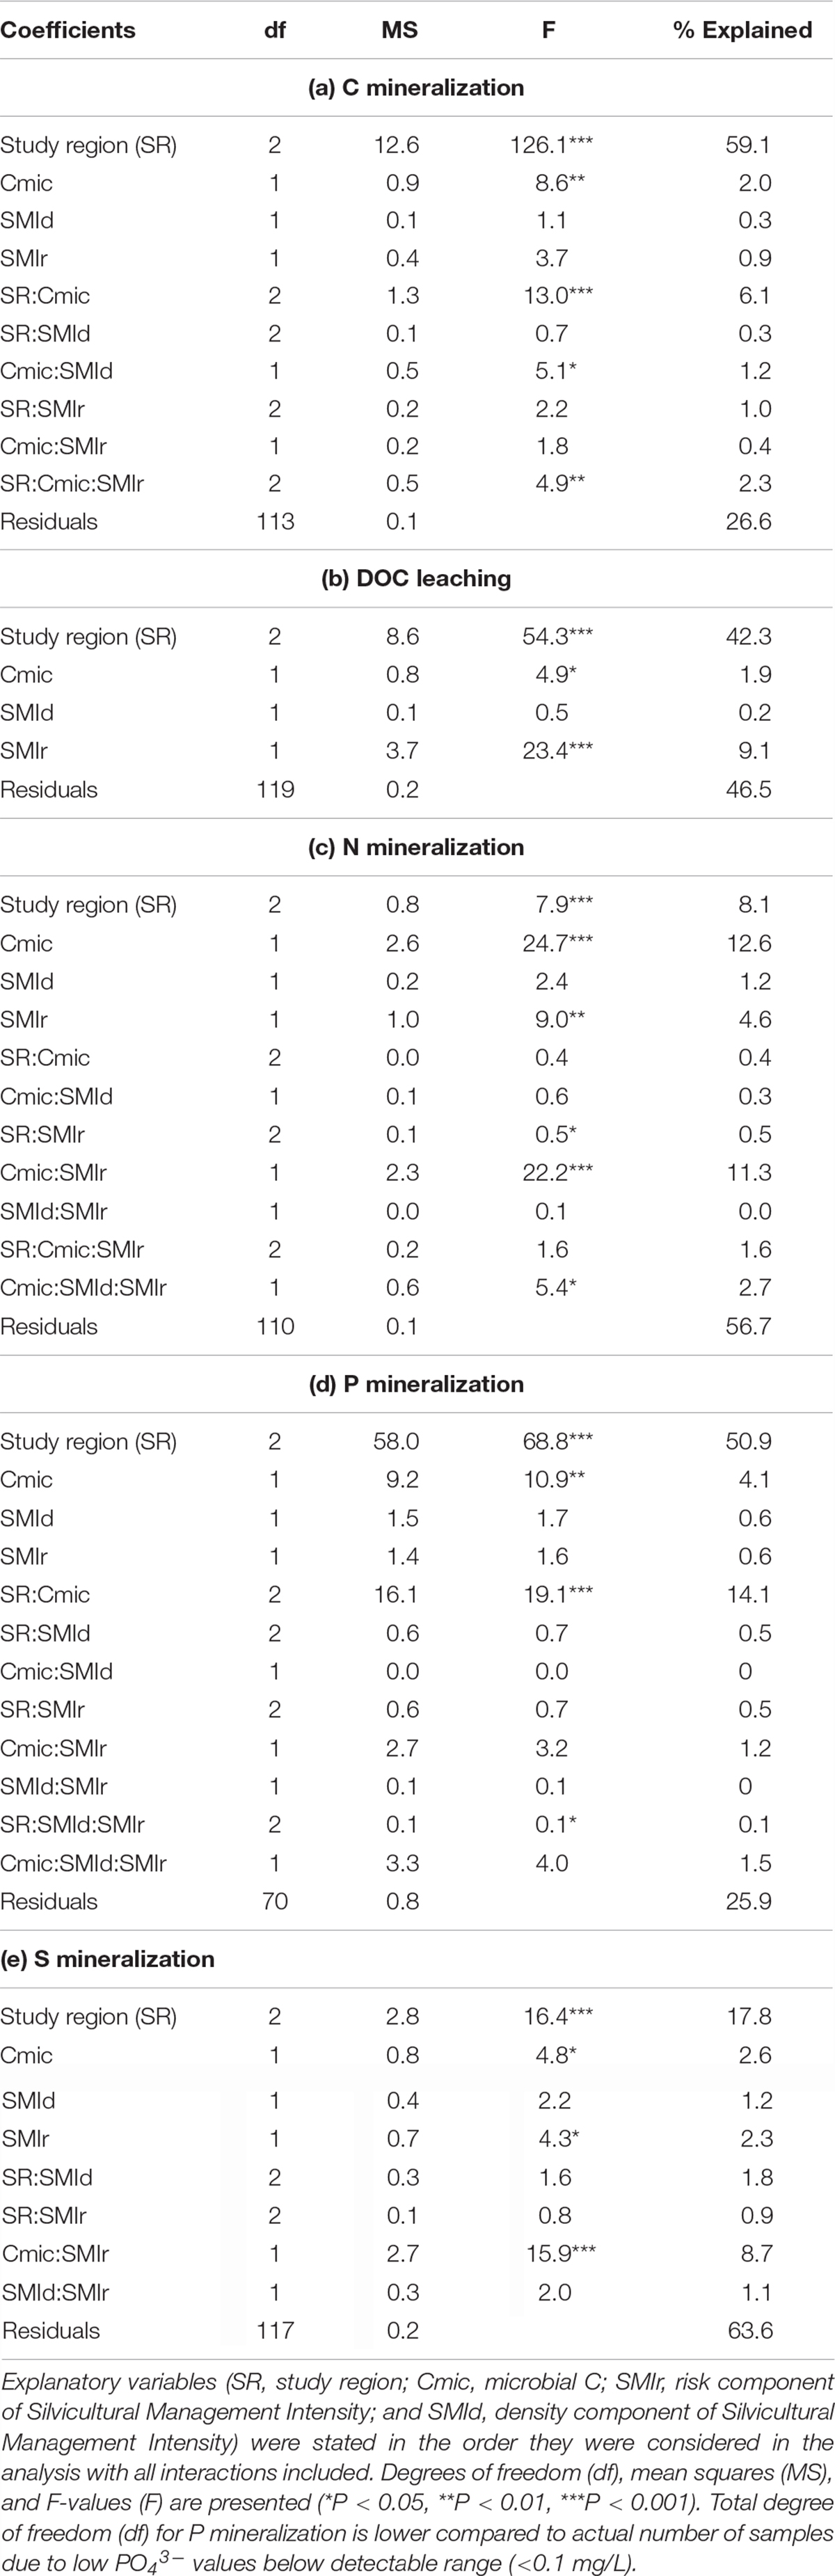
Table 3. Results of the best predictive models on net soil mineralization rates (C,N,P and S).
Microorganisms are supposedly the main driver of the observed SOM mineralization rates at our study sites. While microbial biomass C was overall positively related to soil OC (Figure 6), the ratio of microbial C to soil OC was smaller in the nutrient poor SCH region than at the other regions (Table 1 and Figure 7D), so that we also tested stoichiometry effects on microbial based mineralization rates as indicators for microbial CUE and activity. The correlations between C and N mineralization normalized to microbial C and soil C:N ratios are shown in Figure 7. Carbon mineralization, DOC leaching and N mineralization per unit microbial C were positively correlated to soil C:N (Figures 7A–C). Carbon and N mineralized per microbial C were clearly higher in SCH soils compared to the other two regions, and were higher under coniferous than deciduous forests within SCH. OC-normalized microbial C concentrations were negatively correlated to soil OC-to-N, indicating that nutrient poor soils can only sustain a smaller microbial community for the same amount of SOM than nutrient rich soils (Figure 7D).
The nutrient mining theory suggests that besides OC concentrations in soil, OC mineralization could also be driven by soil stoichiometry. Indeed, we found that while absolute CO2-release rates were smaller in SCH due to relatively lower SOC concentrations in this region (Figure 4), the CO2-release rates normalized to microbial biomass C were higher compared to the other two regions and increased with soil OC-to-N ratios (Figure 7A). Higher C release at nutrient poor sites could be explained by the overall greater investment of energy in nutrient acquisition and extracellular enzymes by soil microorganisms, thus reducing the microbial CUE (Manzoni et al., 2012). The nutrient mining theory also states that microbes decompose more recalcitrant OC at sites with high OC-to-nutrient ratios to get access to nutrients (Craine et al., 2007; Chen et al., 2014). Correspondingly, we observed in a previous study on the same sites that the ratio of beta-glucosidase-to-phenol oxidase was smaller in SCH than ALB and HAI (Herold et al., 2014), indicating the presence and degradation of more recalcitrant C in the nutrient poor SCH soils (Sinsabaugh and Follstad Shah, 2011). In addition to soil stoichiometry, differences in the microbial community could have affected microbial C removal and CUE in our study regions, since communities with high fungal to bacteria ratios, as expected to be the case in the SCH region, were shown to have an overall smaller CUE (Silva-Sánchez et al., 2019).
We also observed a high DOC production in SCH (Figure 4). Accordingly, it seems that with increasing soil C:N, extra SOC, which is either not required for energy production or has little available energy, is not only respired as “overflow” respiration, but incompletely decomposed and released as DOC to the soil solution. Positive relations between DOC production and soil C:N ratios for sites with small mineral sorption capacity for DOC were observed before (Gödde et al., 1996; Kindler et al., 2011; Camino-Serrano et al., 2014). Since the relation between DOC and soil C:N was mainly driven by SCH in our study (Figure 6), possibly either a critical C:N ratio of around 15 has to be reached for extra C release to occur, or as suggested earlier, DOC leaching might be limited to sandy sites with low pH and low DOC sorption capacity (Kalbitz and Knappe, 1997). Accordingly, high soil OC-to-N ratios and thus soil stoichiometry affected SOC decomposition at our sites by increased mineralization to CO2, and enhanced incomplete decomposition to DOC. Both could be the result of microbial strategies to increase the accessibility, mineralization, and uptake of nutrients at sites with low nutrient availability.
We hypothesized that nutrient leaching would decline with declining nutrient contents or increasing C-to-nutrient ratios of soils. In accordance with the overall smaller total soil N concentrations (Table 2), N mineralization in SCH was therefore smaller than in the other two regions (Figure 2B). However, when normalized per OC or microbial biomass, N mineralization rates in SCH exceeded those of the other regions (Figure 7C). This is not in agreement with the nutrient mining theory, where an increase in microbial nitrogen use efficiency (NUE) would be expected in soils with increasing OC-to-N ratios (Mooshammer et al., 2012, 2014a). However, most of our soils should be below or around the presumed threshold of resource OC-to-N ratios of 20, above which microbes are expected to switch from C to N limitation (Mooshammer et al., 2014b). Smaller ratios of OC-to-N acquiring extracellular enzymes in nutrient poor soils of the SCH relative to the other regions indicate that microorganisms already started to investmore enzymes into N acquisition at soil OC-to-N ratios of <20 (Herold et al., 2014). This investment could have compensated for lower resource N availability and contribute to the high N-release rate per microbial biomass in SCH relative to the other regions. Also longer turnover times of nutrients in the microbial biomass, which would reduce microbial nutrient demand and uptake, could help explaining net nutrient mineralization despite high substrate OC-to-nutrient ratios (Spohn et al., 2016).
Different from N mineralization, ester bonds could be cleaved with the help of extracellular enzymes for S mineralization, making it independent from microbial SOM uptake and C mineralization (McGill and Cole, 1981; Chapin et al., 2011). The overall very similar patterns of S and N mineralization in our study, however, suggest that this was not the dominant pathway for S mineralization at our study sites. This indicates that no S mineralization in excess to C was required for microbial S nutrition, and that S was probably also not strongly limited.
In contrast to N and S, absolute P release rates showed an almost opposite pattern to OC mineralization, with the highest P mineralization in SCH and the smallest in HAI (Figures 2, 3). Low P availability in soil has been shown to increase microbial P acquisition from organic P sources mainly via phosphatase activities, which increases P mineralization (Olander and Vitousek, 2000). Using a Hedley fractionation approach, Alt et al. (2011) showed that despite low total P concentrations, SCH soils had higher portions of total P in plant available form (NaHCO3-P) than the other two regions (around 30% in SCH and <10% in HAI and ALB), suggesting a higher contribution of actively recycled P in SCH. While specific phosphatase activities (normalized by OC) were reported to be smaller in SCH than ALB and HAI, the ratio of C-to-P-acquiring enzymes was also smaller, suggesting that microorganisms invested relatively more in P than in C acquisition at SCH, despite smaller OC contents. This indicates that preferential mobilization and recycling of P from organic resources at P poor sites contributed to the observed smaller OC-to-P mineralization ratios in SCH than ALB and HAI. At the P richer sites, this process could be less relevant since extra P may also be acquired from inorganic sources (Lang et al., 2017).
Accordingly, for all studied nutrients higher OC-to-nutrient ratios of soils did not result in a corresponding increase in OC-to-nutrient mineralization rates as initially hypothesized. Different from our expectation, OC-normalized nutrient release was enhanced rather than reduced in the most nutrient poor region. At least for samples where nutrients are apparently not severely limiting, microbial mechanisms to mobilize nutrients seem to be able to compensate for smaller soil nutrient contents.
The overall contrasting behavior of N and P mineralization across regions and forest types was nevertheless an unexpected result of our study. Mooshammer et al. (2012) observed negative relations between soil C:N and phosphatase and between soil C:P and protease activity. They suggested that the production of P acquiring enzymes was favored under high N conditions (low C:N) and more N acquiring enzymes were produced at sites with high P contents (low C:P). While the present study rather suggests high P mineralization at sites with high soil C:N and high N mineralization at sites with high soil C:P across regions (Figure 6), identifying potential mechanisms explaining the opposing behavior of N (and S) and P mineralization rates seems to be an interesting future task.
We hypothesized that forest management would affect SOC and nutrient mineralization via tree species effects on SOM stoichiometry, as well as via harvest and thinning effects on OM input to the soil. While we found no effects of harvest and thinning on the stoichiometry of C-to-nutrient release which is in agreement with our expectations, we also observed no effect of the stand density index (SMId) on individual mineralization rates (Table 3). These were, however, expected to increase with higher stand density and biomass. This is possibly the case because overall differences in SMId were small across sites, so that the full possible range of harvest intensities could not be explored (Supplementary Figure 2). After all, even though harvest intensity and thinning are both expected to affect soil C stocks, identifying their role in non-experimental forests remains a challenge, possibly because of small effects against an inherently high variation in large forest soil C stocks (Grüneberg et al., 2013; Wäldchen et al., 2013; Clarke et al., 2015). The same might be true for SOM mineralization, if the sites were not recently disturbed.
Tree species selection can affect C mineralization rates via differences in litter amount and quality, with typically higher OC-to-nutrient ratios in coniferous than deciduous stands (Vesterdal et al., 2012). Such an effect of tree species on soil stoichiometry was, however, only observed for the SCH region in our study (Table 1 and Figure 2). Higher C mineralization in coniferous forests in ALB and HAI, but smaller ones in SCH were not observed anymore when the rates were normalized to soil OC (Figure 3). This suggests that differences in soil OC contents between sites, which were possibly not only caused by tree species but also other soil properties, like clay contents, were contributing to species effects on OC mineralization. However, also the smaller microbial biomass per OC in coniferous than deciduous forest sites in SCH (Figure 7D) could have contributed to reduced OC mineralization of coniferous forest soils, which was also observed in previous studies (Raich and Tufekciogul, 2000).
Different from OC mineralization, DOC leaching rates were more consistently affected by forest types across regions with higher leaching rates for soils under coniferous than deciduous stands, especially in SCH (Figure 4). This was supported by the results of the linear model, where the species-specific risk component of the forest management index (SMIr) significantly affected DOC production (Table 3b). This was previously observed in both, laboratory and field studies (Kalbitz and Knappe, 1997; Camino-Serrano et al., 2014). When normalized to OC, forest type affected DOC leaching rates most strongly in SCH, suggesting that besides OC, soil C:N, pH and overall litter chemistry could be responsible for the observed result. In addition, differences in microbial communities between forest types, for example a higher fungal biomass in coniferous forests (Awad et al., 2019), might be important for DOC production as suggested before (Møller et al., 1999).
Litter chemistry from different tree species has been reported to vary widely, thereby affecting soil N mineralization (Gower and Son, 1992; Hobbie, 1992; Reich et al., 1997). We therefore assumed that a higher soil C:N ratio under coniferous than deciduous sites could also drive higher OC over N mineralization in mineral soils of our study. However, soil C:N ratios differed only in SCH between tree species but not in ALB and HAI (Table 2). Nevertheless, the rates of N and S mineralization were higher in deciduous than coniferous forests (Figures 2B,D) and significantly related to the species-specific component of the forest management index (SMIr) (Tables 3c,e). This finding is in agreement with previous studies in boreal forests, where higher N mineralization in the mineral soil as well as in the forest floor under deciduous compared to coniferous stands was observed (Côté et al., 2000; Jerabkova et al., 2006). In agreement with this result, C-to-nutrient release rates were higher under coniferous than deciduous forests in the more fertile regions ALB and HAI (Figures 5A–C). Only in SCH, the region with observed species-specific differences in soil C:N, no difference between C-to-nutrient release rates between species was observed (Figures 5A–C). Accordingly, N and S mineralization seem to be not simply controlled by SOM stoichiometry in forest soils, but possibly by other components of litter chemistry as well as by differences in the microbial community.
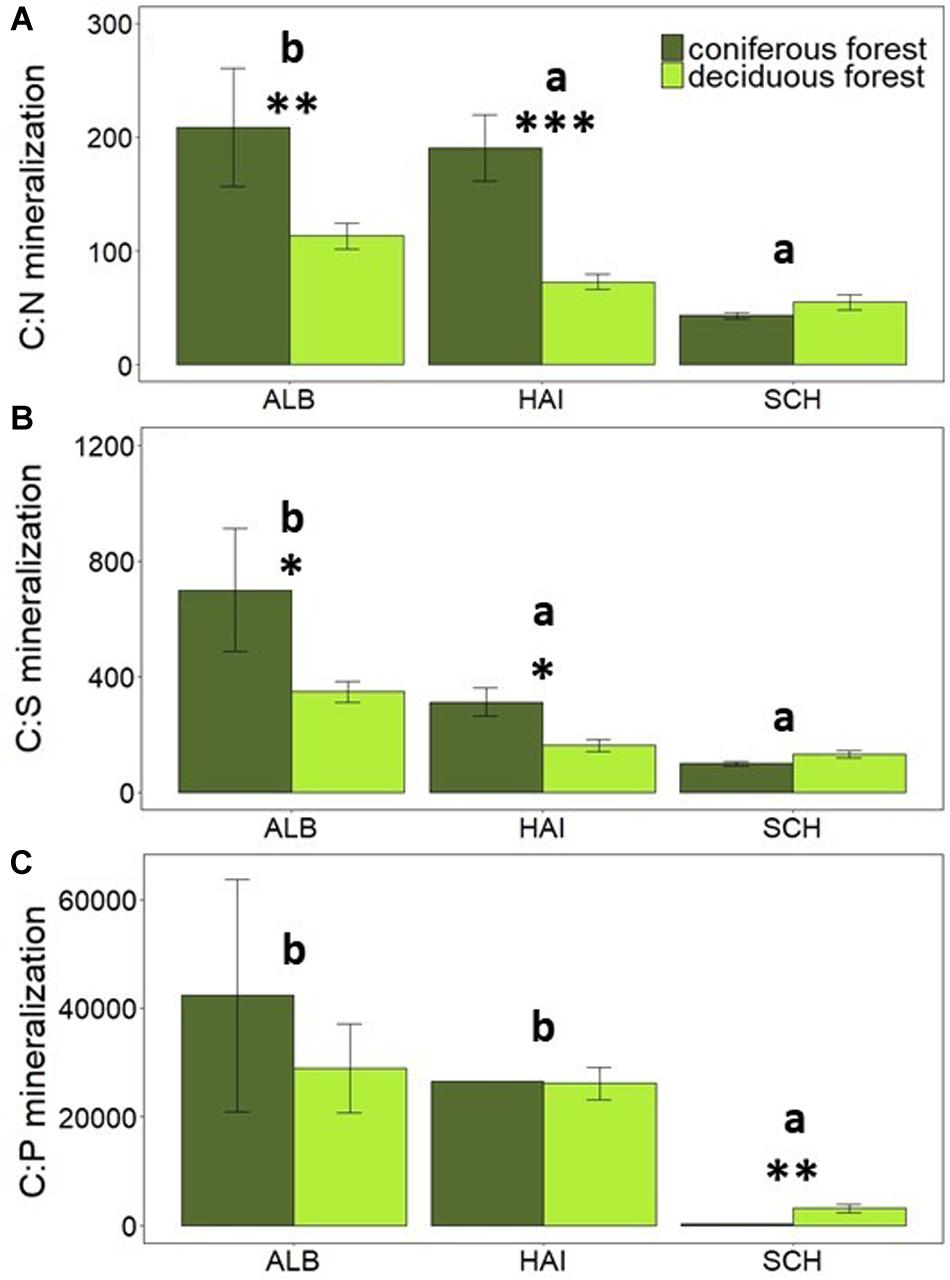
Figure 5. Comparison of average mineralization rates of C-to-nutrients: (A) C:N mineralization, (B) C:S mineralization and (C) C:P mineralization in different forest types. Error bars represent SE of means. X-axis represents study regions where ALB, Schwäbische-Alb; HAI, Hainich-Dün; SCH, Schorfheide-Chorin. Significant differences of variance between study regions are denoted by small letters, and between coniferous and deciduous forests are denoted by ∗P < 0.05, ∗∗P < 0.01, and ∗∗∗P < 0.001. Number of study sites included: ALB (deciduous forests, n = 38 and coniferous forest, n = 12), HAI (deciduous forests, n = 46 and coniferous forest, n = 4), and SCH (deciduous forests, n = 28 and coniferous forest, n = 22).
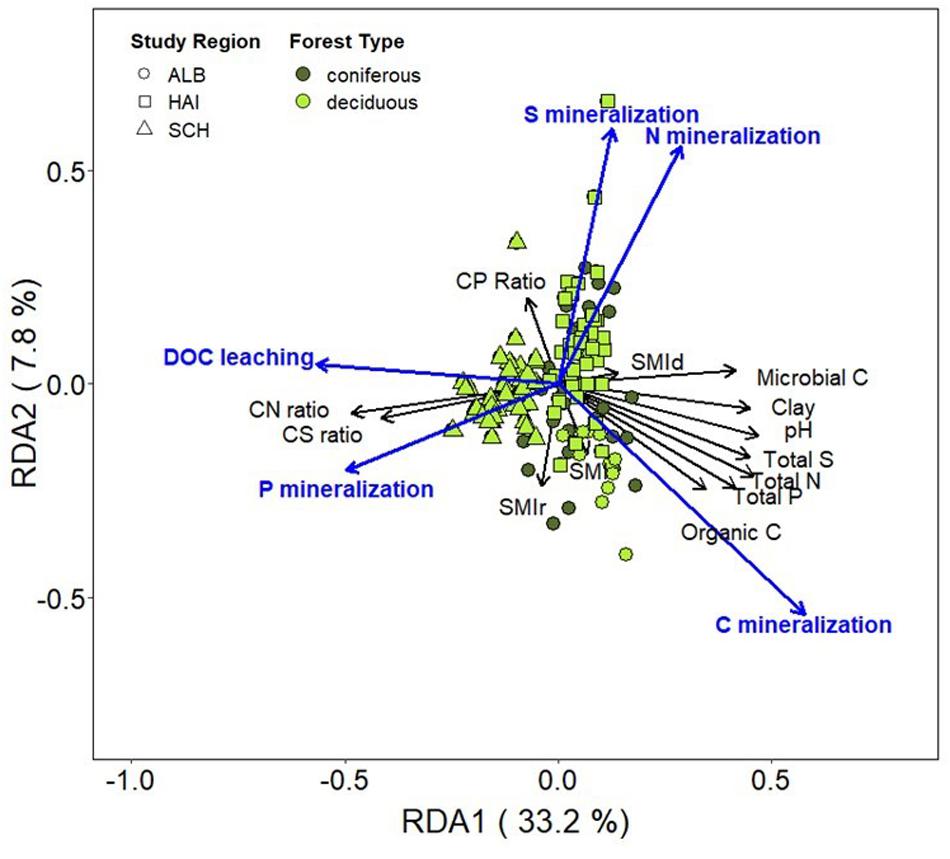
Figure 6. Biplot of redundancy analysis (RDA) showing net C, N, P, and S mineralization rates (μg DW–1 day–1) as responses variables and soil properties (organic C, microbial C, soil pH, total N, P, and S concentrations, and soil C:N, C:P, and C:S ratios) and the SMI as predictor variables. Study regions are denoted by: ALB, Schwäbische-Alb; HAI, Hainich-Dün; SCH, Schorfheide-Chorin.
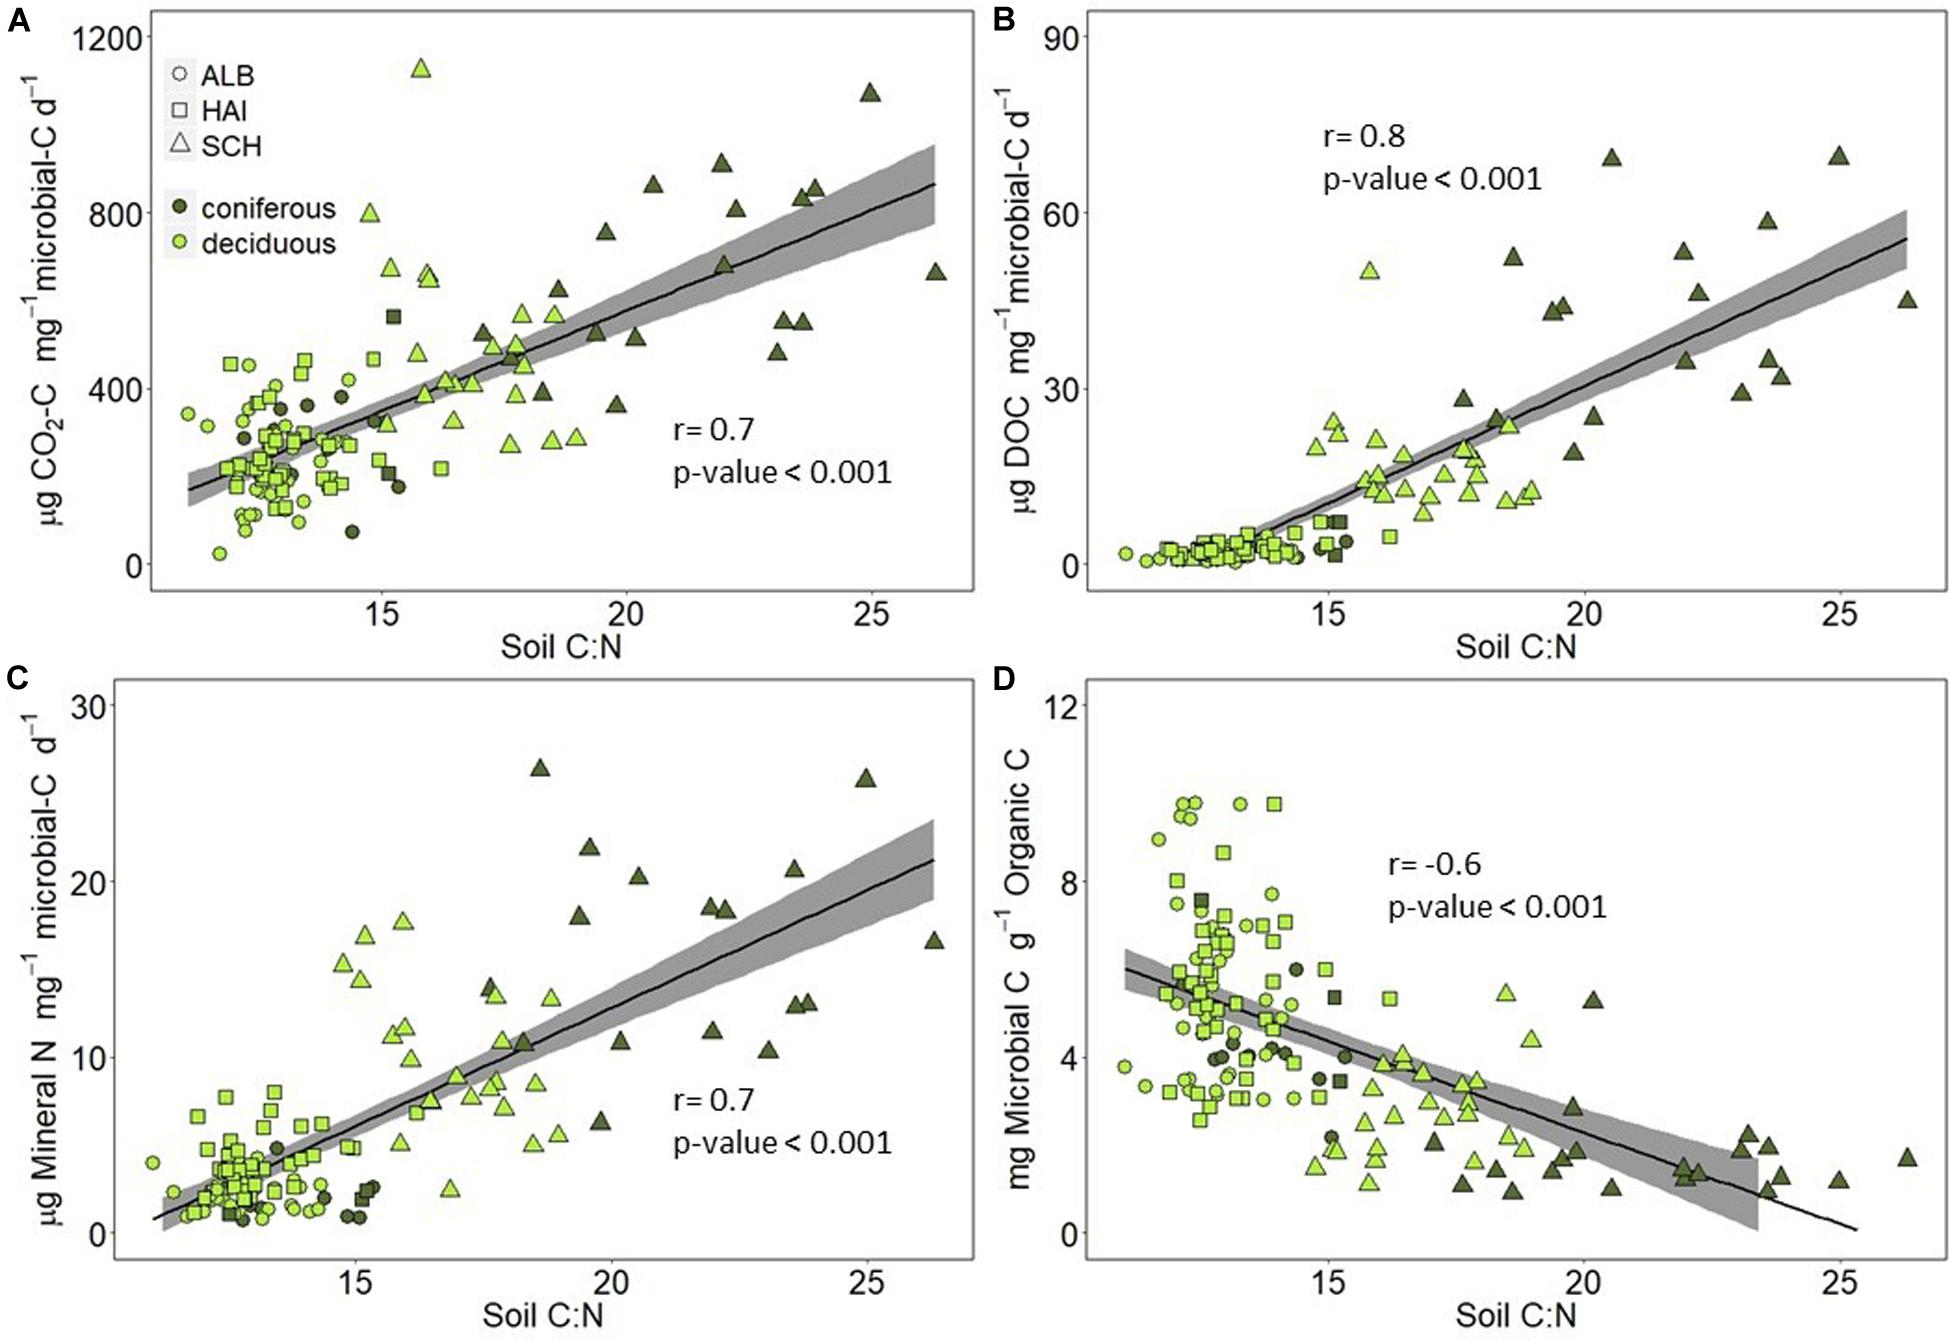
Figure 7. Correlations between (A) C mineralization per microbial C, (B) DOC leached per microbial C, (C) N mineralization per microbial C, and (D) microbial C per organic C and soil C:N ratio. Study regions are denoted by: ALB, Schwäbische-Alb; HAI, Hainich-Dün; SCH, Schorfheide-Chorin.
Interestingly, and contrary to N and S mineralization, P mineralization was also affected by forest type, but with higher P mineralization in coniferous than deciduous forests (Figure 2C). This was only observed in the SCH region with the lowest soil P content, but apparently the highest P mobilization. This leads to smaller OC-to-P-mineralization in the coniferous than the deciduous forests at SCH. Mooshammer et al. (2012) observed a negative relation between litter C:P and P mineralization, but C:P ratios of deciduous and coniferous forests did not differ in SCH in this study. Across sites, no relation between P mineralization and soil C:P ratios was observed (Figure 6). This could be because we used total P for our stoichiometric calculations, while total organic P or P in the non-mineral protected organic fraction might be the better indicator for stoichiometric considerations. Overall, our results suggest that forest management can affect soil stoichiometry via tree species selection, especially in nutrient poor regions, but that this effect is not due to soil stoichiometry.
Our results support the assumption that, on a microbial biomass basis, C mineralization in forests soils is affected by differences in SOM stoichiometry. When microbial activity apparently switches from C to nutrient limitation with increasing soil OC-to-nutrient ratios, more CO2 and DOC is released. This indicates that in nutrient poor soils, with possibly also larger contributions of more recalcitrant OC, some OC is also incompletely decomposed and leached instead of being mineralized.
This did, however, not result in our expected increase in OC-to-nutrient mineralization rates with declining soil nutrient content. Instead, soil N, S, and P mineralization rates were rather constant or even increased on a per soil OC basis from high to low fertility sites. This was possibly because most of the sites were not strongly nutrient limited so that smaller nutrient contents could be compensated by an increase in the ratio of nutrient-to-C acquiring enzymes. High P release rates in the most P-poor region are probably due to the largest share of total P being in more easily available and organic forms in the sandy soils of the SCH region than in the more clay rich other regions.
Forest management effects were only observed for tree species composition but not thinning or harvest intensity, possibly because the latter had no strong effect on total OM content at the studied sites. Tree species effects differed between nutrient rich and poor regions, with higher N and S mineralization in deciduous than coniferous forests in the nutrient rich regions HAI and ALB, and higher DOC and P release in coniferous forests of the sandy and nutrient poor region SCH. Different from our hypothesis, these results were not in accordance with expected tree-species effects on soil OM stoichiometry. Observed tree species effects on SOM stoichiometry and mineralization were therefore probably also affected by other factors like overall litter quality or chemistry, soil microbial community composition and regional differences in other soil properties. The unexpected contrasting behavior of P from N and S mineralization for both regional and tree species effects, indicates that not only interactions between C and nutrient cycles in soils but also those between nutrients are so far not fully understood.
The datasets generated for this study are available on request to the corresponding author as well as via the project database of the Biodiversity Exploratories.
HG was the first author and responsible for writing this manuscript, designed and carried out the experiment, obtained the data in the laboratory, and analyzed and discussed the data. IS and MS designed the experiment and reviewed and edited drafts of the manuscript. PS and CA provided their expertise related to forest managements and reviewed and edited drafts of the manuscript. All authors contributed to the article and approved the submitted version.
The work has been funded by the DFG Priority Program 1374 “Infrastructure-Biodiversity-Exploratories” (SCHR 1181/22) and the Max Planck Society.
The authors declare that the research was conducted in the absence of any commercial or financial relationships that could be construed as a potential conflict of interest.
The Supplementary Material for this article can be found online at: https://www.frontiersin.org/articles/10.3389/ffgc.2020.00099/full#supplementary-material
FIGURE S1 | Correlations between CO2 efflux from samples taken in 2011 and soil organic C from the samples taken in 2014. Study regions are denoted by: ALB, Schwäbische-Alb; HAI, Hainich-Dün; SCH, Schorfheide-Chorin.
FIGURE S2 | Comparison of (a) risk (SMIr) and (b) density component (SMId) of the Silvicultural Management Intensity (SMI) index between forest types in different study regions. Error bars represent SE of means. The X-axis represents study regions where ALB, Schwäbische-Alb; HAI, Hainich-Dün; SCH, Schorfheide-Chorin. Significant differences between coniferous and deciduous forests were indicated by ∗P < 0.05, ∗∗P < 0.01, and ∗∗∗P < 0.001. The number of study sites was: ALB (deciduous forests, n = 38 and coniferous forest, n = 12), HAI (deciduous forests, n = 46 and coniferous forest, n = 4), and SCH (deciduous forests, n = 28 and coniferous forest, n = 22).
Alt, F., Oelmann, Y., Herold, N., Schrumpf, M., and Wilcke, W. (2011). Phosphorus partitioning in grassland and forest soils of Germany as related to land-use type, management intensity, and land use-related pH. Z. Pflanzenernähr. Bodenk. 174, 195–209. doi: 10.1002/jpln.201000142
Awad, A., Majcherczyk, A., Schall, P., Schröter, K., Schöning, I., and Schrumpf, M. (2019). Ectomycorrhizal and saprotrophic soil fungal biomass are driven by different factors and vary among broadleaf and coniferous temperate forests. Soil Biol. Biochem. 131, 9–18. doi: 10.1016/j.soilbio.2018.12.014
Bauhus, J., Paré, D., and Cot̂é, L. (1998). Effects of tree species, stand age and soil type on soil microbial biomass and its activity in a southern boreal forest. Soil Biol. Biochem. 30, 1077–1089. doi: 10.1016/s0038-0717(97)00213-7
Bengtsson, G., Bengtson, P., and Månsson, K. F. (2003). Gross nitrogen mineralization-, immobilization-, and nitrification rates as a function of soil C/N ratio and microbial activity. Soil Biol. Biochem. 35, 143–154. doi: 10.1016/s0038-0717(02)00248-1
Birkhofer, K., Schöning, I., Alt, F., Herold, N., Klarner, B., and Maraun, M. (2012). General relationships between abiotic soil properties and soil biota across spatial scales and different land-use types. PLoS One 7:e43292. doi: 10.1371/journal.pone.0043292
Bridgham, S. D., Updegraff, K., and Pastor, J. (1998). Carbon, nitrogen, and phosphorus mineralization In Northern Wetlands. Ecology 79, 1545–1561. doi: 10.1890/0012-9658(1998)079[1545:cnapmi]2.0.co;2
Burke, I., Reiners, W., and Schimel, D. (1989). Organic matter turnover in a sagebrush steppe landscape. Biogeochemistry 7, 11–31. doi: 10.1007/BF00000895
Camino-Serrano, M., Gielen, B., Luyssaert, S., Ciais, P., Vicca, S., and Guenet, B. (2014). Linking variability in soil solution dissolved organic carbon to climate, soil type, and vegetation type. Global Biogeochem. Cycles 28, 497–509. doi: 10.1002/2013gb004726
Chapin, I. F. S. I., Matson, P. A., and Vitousek, P. M. (2011). Principles of Terrestrial Ecosystem Ecology. New York, NY: Springer Science+Business Media LLC.
Chen, R., Senbayram, M., Blagodatsky, S., Myachina, O., Dittert, K., Lin, X., et al. (2014). Soil C and N availability determine the priming effect: microbial N mining and stoichiometric decomposition theories. Glob. Chang. Biol. 20, 2356–2367. doi: 10.1111/gcb.12475
Clarke, N., Gundersen, P., Jönsson-Belyazid, U., Kjønaas, O. J., Persson, T., and Sigurdsson, B. D. (2015). Influence of different tree-harvesting intensities on forest soil carbon stocks in boreal and northern temperate forest ecosystems. For. Ecol. Manag. 351, 9–19. doi: 10.1016/j.foreco.2015.04.034
Côté, L., Brown, S., Paré, D., Fyles, J., and Bauhus, J. (2000). Dynamics of carbon and nitrogen mineralization in relation to stand type, stand age and soil texture in the boreal mixedwood. Soil Biol. Biochem. 32, 1079–1090. doi: 10.1016/s0038-0717(00)00017-1
Craine, J. M., Morrow, C., and Fierer, N. (2007). Microbial nitrogen limitation increases decomposition. Ecology 88, 2105–2113. doi: 10.1890/06-1847.1
DIN ISO 11277 (2002). Soil Quality – Determination of Particle Size Distribution in Mineral Soil Material – Method by Sieving and Sedimentation. Geneva: ISO.
Fischer, M., Bossdorf, O., Gockel, S., Hänsel, F., Hemp, A., and Hessenmöller, D. (2010). Implementing large-scale and long-term functional biodiversity research: the biodiversity exploratories. Basic Appl. Ecol. 11, 473–485. doi: 10.1016/j.baae.2010.07.009
Gödde, M., David, M. B., Christ, M. J., Kaupenjohann, M., and Vance, G. F. (1996). Carbon mobilization from the forest floor under red spruce in the northeastern U.S.A. Soil Biol. Biochem. 28, 1181–1189. doi: 10.1016/0038-0717(96)00130-7
Gower, S. T., and Son, Y. (1992). Differences in soil and leaf litterfall nitrogen dynamics for five forest plantations. Soil Sci. Soc. Am. J. 56, 1959–1966. doi: 10.2136/sssaj1992.03615995005600060051x
Grüneberg, E., Schöning, I., Hessenmöller, D., Schulze, E.-D., and Weisser, W. W. (2013). Organic layer and clay content control soil organic carbon stocks in density fractions of differently managed German beech forests. For. Ecol. Manag. 303, 1–10. doi: 10.1016/j.foreco.2013.03.014
Herold, N., Schöning, I., Berner, D., Haslwimmer, H., Kandeler, E., and Michalzik, B. (2014). Vertical gradients of potential enzyme activities in soil profiles of European beech, Norway spruce and Scots pine dominated forest sites. Pedobiologia 57, 181–189. doi: 10.1016/j.pedobi.2014.03.003
Hessen, D. O., and Anderson, T. R. (2008). Excess carbon in aquatic organisms and ecosystems: physiological, ecological, and evolutionary implications. Limnol. Oceanogr. 53, 1685–1696. doi: 10.4319/lo.2008.53.4.1685
Hobbie, S. E. (1992). Effects of plant species on nutrient cycling. Trends Ecol. Evol. 7, 336–339. doi: 10.1016/0169-5347(92)90126-v
IUSS Working Group WRB (2014). World Reference Base for Soil Resources 2014, Update 2015. International Soil Classification System for Naming Soils and Creating Legends for Soil Maps. World Soil Resources Reports No. 106, Rome: FAO.
Janssen, B. H. (1996). Nitrogen mineralization in relation to C:N ratio and decomposability of organic materials. Plant Soil 181, 39–45. doi: 10.1007/bf00011290
Jenkinson, D. S., and Powlson, D. S. (1976). The effects of biocidal treatments on metabolism in soil—V. Soil Biol. Biochem. 8, 209–213. doi: 10.1016/0038-0717(76)90005-5
Jerabkova, L., Prescott, C. E., and Kishchuk, B. E. (2006). Nitrogen availability in soil and forest floor of contrasting types of boreal mixedwood forests. Can. J. For. Res. 36, 112–122. doi: 10.1139/x05-220
Johnson, D. W., and Curtis, P. S. (2001). Effects of forest management on soil C and N storage: meta analysis. For. Ecol. Manag. 140, 227–238. doi: 10.1016/s0378-1127(00)00282-6
Jonasson, S., Michelsen, A., and Schmidt, I. K. (1999). Coupling of nutrient cycling and carbon dynamics in the Arctic, integration of soil microbial and plant processes. Appl. Ecol. 11, 135–146. doi: 10.1016/s0929-1393(98)00145-0
Kalbitz, K., and Knappe, S. (1997). Einfluß der Bodeneigenschaften auf die Freisetzung der gelösten organischen Substanz (DOM) aus dem Oberboden. Z. Pflanzenernaehr. Bodenk. 160, 475–483. doi: 10.1002/jpln.19971600407
Kindler, R., Siemens, J. A. N., Kaiser, K., Walmsley, D. C., Bernhofer, C., and Buchmann, N. (2011). Dissolved carbon leaching from soil is a crucial component of the net ecosystem carbon balance. Glob. Chang. Biol. 17, 1167–1185. doi: 10.1111/j.1365-2486.2010.02282.x
Kouno, K., Tuchiya, Y., and Ando, T. (1995). Measurement of soil microbial biomass phosphorus by an anion exchange membrane method. Soil Biol. Biochem. 27, 1353–1357. doi: 10.1016/0038-0717(95)00057-l
Kowalenko, C. G., and Lowe, L. E. (1975). Mineralization Of sulfur from four soils and its relationship to soil Carbon, Nitrogen And PhosphoruS. Can. J. Soil. Sci. 55, 9–14. doi: 10.4141/cjss75-002
Lang, F., Krüger, J., Amelung, W., Willbold, S., Frossard, E., and Bünemann, E. K. (2017). Soil phosphorus supply controls P nutrition strategies of beech forest ecosystems in Central Europe. Biogeochemistry 136, 5–29. doi: 10.1007/s10533-017-0375-0
LeBauer, D. S., and Treseder, K. K. (2008). Nitrogen limitation of net primary productivity in terrestrial ecosystems is globally distributed. Ecology 89, 371–379. doi: 10.1890/06-2057.1
Manzoni, S., Taylor, P., Richter, A., Porporato, A., and Agren, G. I. (2012). Environmental and stoichiometric controls on microbial carbon-use efficiency in soils. New Phytol. 196, 79–91. doi: 10.1111/j.1469-8137.2012.04225.x
McGill, W. B., and Cole, C. V. (1981). Comparative aspects of cycling of organic C. N, S and P through soil organic matter. Geoderma 26, 267–286. doi: 10.1016/0016-7061(81)90024-0
McGroddy, M. E., Daufresne, T., and Hedin, L. O. (2004). Scaling Of C:N:P stoichiometry In forests worldwide: implications of terrestrial redfield-type ratios. Ecology 85, 2390–2401. doi: 10.1890/03-0351
Møller, J., Miller, M., and Kjøller, A. (1999). Fungal–bacterial interaction on beech leaves: influence on decomposition and dissolved organic carbon quality. Soil Biol. Biochem. 31, 367–374. doi: 10.1016/s0038-0717(98)00138-2
Mooshammer, M., Wanek, W., Hämmerle, I., Fuchslueger, L., Hofhansl, F., and Knoltsch, A. (2014a). Adjustment of microbial nitrogen use efficiency to carbon:nitrogen imbalances regulates soil nitrogen cycling. Nat. Commun. 5:3694.
Mooshammer, M., Wanek, W., Zechmeister-Boltenstern, S., and Richter, A. (2014b). Stoichiometric imbalances between terrestrial decomposer communities and their resources: mechanisms and implications of microbial adaptations to their resources. Front. Microbiol. 5:22. doi: 10.3389/fmicb.2014.00022
Mooshammer, M., Wanek, W., Schnecker, J., Wild, B., Leitner, S., and Hofhansl, F. (2012). Stoichiometric controls of nitrogen and phosphorus cycling in decomposing beech leaf litter. Ecology 93, 770–782. doi: 10.1890/11-0721.1
Murphy, J., and Riley, J. P. (1962). A modified single solution method for the determination of phosphate in natural waters. Anal. Chim. Acta 27, 31–36. doi: 10.1016/s0003-2670(00)88444-5
Nadelhoffer, K. J. (1990). Microlysimeter for Measuring Nitrogen Mineralization and Microbial Respiration in Aerobic Soil Incubations. Soil Sci. Soc. Am. J. 54, 411–415. doi: 10.2136/sssaj1990.03615995005400020019x
Nave, L. E., Vance, E. D., Swanston, C. W., and Curtis, P. S. (2010). Harvest impacts on soil carbon storage in temperate forests. For. Ecol. Manag. 259, 857–866. doi: 10.1016/j.foreco.2009.12.009
Oksanen, J. F., Blanchet, G., Friendly, M., Kindt, R., Legendre, P., McGlinn, D., et al. (2006). vegan: Community Ecology Package. R Package Version 1.8-3.
Olander, L. P., and Vitousek, P. M. (2000). Regulation of soil phosphatase and chitinase activityby N and P availability. Biogeochemistry 49, 175–191.
R Core Team (2016). A Language and Environment for Statistical. Vienna: R Foundation for Statistical Computing.
Raich, J. W., and Tufekciogul, A. (2000). Vegetation and soil respiration: correlations and controls. Biogeochemistry 48, 71–90.
Reich, P. B., Grigal, D. F., Aber, J. D., and Gower, S. T. (1997). Nitrogen mineralization and productivity In 50 hardwood and conifer stands on diverse soils. Ecology 78, 335–347. doi: 10.1890/0012-9658(1997)078[0335:nmapih]2.0.co;2
Schall, P., and Ammer, C. (2013). How to quantify forest management intensity in Central European forests. Eur. J. For. Res. 132, 379–396. doi: 10.1007/s10342-013-0681-6
Schall, P., Schulze, E.-D., Fischer, M., Ayasse, M., and Ammer, C. (2018). Relations between forest management, stand structure and productivity across different types of Central European forests. Basic Appl. Ecol. 32, 39–52. doi: 10.1016/j.baae.2018.02.007
Schimel, J. P., and Bennett, J. (2004). Nitrogen mineralization: challenges of a changing paradigm. Ecology 85, 591–602. doi: 10.1890/03-8002
Silva-Sánchez, A., Soares, M., and Rousk, J. (2019). Testing the dependence of microbial growth and carbon use efficiency on nitrogen availability, pH, and organic matter quality. Soil Biol. Biochem. 134, 25–35. doi: 10.1016/j.soilbio.2019.03.008
Sinsabaugh, R. L., and Follstad Shah, J. J. (2011). Ecoenzymatic stoichiometry of recalcitrant organic matter decomposition: the growth rate hypothesis in reverse. Biogeochemistry 102, 31–43. doi: 10.1007/s10533-010-9482-x
Solly, E. F., Schöning, I., Boch, S., Kandeler, E., Marhan, S., and Michalzik, B. (2014). Factors controlling decomposition rates of fine root litter in temperate forests and grasslands. Plant Soil 382, 203–218. doi: 10.1007/s11104-014-2151-4
Spohn, M., Klaus, K., Wanek, W., and Richter, A. (2016). Microbial carbon use efficiency and biomass turnover times depending on soil depth – Implications for carbon cycling. Soil Biol. Biochem. 96, 74–81. doi: 10.1016/j.soilbio.2016.01.016
Tracy, P. W., Westfall, D. G., Peterson, G. A., Elliott, E. T., and Cole, C. V. (1990). Carbon, Nitrogen, Phosphorus, and Sulfur Mineralization in Plow and No-Till Cultivation. Soil Sci. Soc. Am. J. 54, 457–461. doi: 10.2136/sssaj1990.03615995005400020028x
Vance, E. D., Brookes, P. C., and Jenkinson, D. S. (1987). An extraction method for measuring soil microbial biomass C. Soil Biol. Biochem. 19, 703–707. doi: 10.1016/0038-0717(87)90052-6
Vesterdal, L., Dalsgaard, M., Felby, C., Raulund-Rasmussen, K., and Jørgensen, B. B. (1995). Effects of thinning and soil properties on accumulation of carbon, nitrogen and phosphorus in the forest floor of Norway spruce stands. For. Ecol. Manag. 77, 1–10. doi: 10.1016/0378-1127(95)03579-y
Vesterdal, L., Elberling, B., Christiansen, J. R., Callesen, I., and Schmidt, I. K. (2012). Soil respiration and rates of soil carbon turnover differ among six common European tree species. For. Ecol. Manag. 264, 185–196. doi: 10.1016/j.foreco.2011.10.009
Vesterdal, L., and Raulund-Rasmussen, K. (1998). Forest floor chemistry under seven tree species along a soil fertility gradient. Can. J. For. Res. 28, 1636–1647. doi: 10.1139/x98-140
Vitousek, P. M., Porder, S., Houlton, B. Z., and Chadwick, O. A. (2010). Terrestrial phosphorus limitation: mechanisms, implications, and nitrogen-phosphorus interactions. Ecol. Appl. 20, 5–15. doi: 10.1890/08-0127.1
Keywords: SOM mineralization, nutrient stoichiometry, forest management, soil organic carbon, nitrogen mineralization, sulfur mineralization, phosphorus mineralization
Citation: Gan HY, Schöning I, Schall P, Ammer C and Schrumpf M (2020) Soil Organic Matter Mineralization as Driven by Nutrient Stoichiometry in Soils Under Differently Managed Forest Stands. Front. For. Glob. Change 3:99. doi: 10.3389/ffgc.2020.00099
Received: 17 January 2020; Accepted: 27 July 2020;
Published: 03 September 2020.
Edited by:
Nicolas Fanin, INRA Centre Nouvelle-Bordeaux Aquitaine, FranceReviewed by:
Lukas Kohl, University of Helsinki, FinlandCopyright © 2020 Gan, Schöning, Schall, Ammer and Schrumpf. This is an open-access article distributed under the terms of the Creative Commons Attribution License (CC BY). The use, distribution or reproduction in other forums is permitted, provided the original author(s) and the copyright owner(s) are credited and that the original publication in this journal is cited, in accordance with accepted academic practice. No use, distribution or reproduction is permitted which does not comply with these terms.
*Correspondence: Huei Ying Gan, Z2FuaHVlaXlpbmdAZ21haWwuY29t
Disclaimer: All claims expressed in this article are solely those of the authors and do not necessarily represent those of their affiliated organizations, or those of the publisher, the editors and the reviewers. Any product that may be evaluated in this article or claim that may be made by its manufacturer is not guaranteed or endorsed by the publisher.
Research integrity at Frontiers
Learn more about the work of our research integrity team to safeguard the quality of each article we publish.