 Boipelo Tshwene-Mauchaza
 Jesús Aguirre-Gutiérrez
- 1School of Geography and the Environment, University of Oxford, Oxford, United Kingdom
- 2Biodiversity Dynamics, Naturalis Biodiversity Center, Leiden, Netherlands
Understanding the importance of climate in determining species distribution and how it might change as a function of spatial grain size is a vital issue for species distribution modeling (SDM), yet it is often not accounted for in models and has not been extensively addressed in under sampled areas in tropical forests. Using extensive field sampled vegetation plots data on species occurrences and current climate conditions we modeled 150 vascular plant species in the Okavango River Basin, to map their current projected suitable climate space at 2, 5, 10, 20, and 50 km2 pixel resolution. Relationships between the variable importance scores and variable identity and their interaction with predictor spatial grain were investigated using Generalized Linear Models and post-hoc analysis. We found variation in the relative influence of temperature and precipitation variables across the spatial grains. The importance of the determinants of species distribution may change between species but such changes are less determined by the predictor's spatial grain. Potential evapotranspiration consistently exhibited the greatest influence in determining species and richness distribution across fine to coarse spatial grains. We found that the spatial grain of predictors had no effect on the model predictive power and that varying predictor spatial grains had only negligible effects on the model performance measured by AUC and Kappa statistics. The spatial grains of the climatic predictors used showed no effect on species richness pattern either. Our results indicate that in areas with relatively low topographic variation, modeling at coarse spatial grain for conservation purposes can be acceptable. Moreover, we show that in tropical areas that have comparatively homogeneous climatic conditions along large spatial extents the variable importance is not influenced by predictor spatial grain. For projections of contemporary species suitable climate space in relatively flat and topographically homogeneous areas which often have a climatically homogenous landscape, more attention must be given to the identity of the selected predictor variables for modeling the species distributions than to their spatial grain size. We suggest that in species distribution modeling for conservation planning, assessment of the input datasets spatial grain should be informed and guided by knowledge of the landscape level topographic conditions, as protocol.
Introduction
Species Distribution Models (SDM) have been a critical technique for investigating a variety of ecological, conservation and management issues (Garcia et al., 2012; Van Echelpoel et al., 2015; DellaSala et al., 2018) as well as in studies of paleoclimate (Reichgelt et al., 2018). The technique relies on statistically associating contemporary species occurrence data with climatic and environmental predictors (Elith and Leathwick, 2009). Since its inception, the SDM technique has advanced from simple correlative ecological niche models (Araújo and Peterson, 2012) to more complex mechanistic models, incorporating range (Fordham et al., 2013a; Zurell et al., 2016) and population dynamics, dispersal abilities (Fordham et al., 2013b) and community dynamics (Singer et al., 2016). However, ecologists and conservation practitioners are still faced with problems of spatial and temporal scale variations in the datasets used in operating SDMs.There is no consensus about the most suitable predictor spatial grain that can improve the accuracy of SDM prediction (Raven, 2002; Bradter et al., 2013; Fournier et al., 2017) and there is a lack of full understanding of the effects of building SDMs at multiple predictor spatial grains. This has an impact on management planning and conservation decision making (Porfirio et al., 2014; Yates et al., 2018).
The ecology and distribution of terrestrial plant and animal species are influenced by climatic conditions (Aguirre-Gutiérrez et al., 2015) across various spatial grains (Connor et al., 2018; Kosanic et al., 2018). Modeling of the species distributions under current and a changing climate requires spatially explicit environmental predictors. It is not surprising that one of the frequently documented sources of uncertainty in SDMs is insufficiency in the spatial grain of the climate data used, often originating from low resolution global climate models (GCM) or from downscaled by-products of those models (Weibull et al., 2003; Dunford and Freemark, 2005; Wang et al., 2016). Uncertainty in predictor variables can result from instrumental errors or methods used to collect the variables. In the case of climatic variables, this would include resampling of weather station data and gridded climate reanalysis products. The uncertainty in predictor variables can also emanate from spatial scaling (Scott et al., 2002), brought about by the disparity between the spatial grain size of the climate data and that of the species modeled, which may lead to uncertainty in the magnitude, rate and direction of changes of biodiversity imposed by the changing climate (Garcia et al., 2012; Wan et al., 2016).
The intrinsic properties of species occurrence data and their spatial grain affect model performance and prediction abilities (Thuiller et al., 2003; Guisan et al., 2007a), they affect species occurrence probabilities (Garcia et al., 2012; Wan et al., 2016) and transferability of SDMs (Manzoor et al., 2018). Differences in spatial grain have also been found to affect variations in the relative importance of environmental predictors determining plant distribution (Thuiller et al., 2003; Radinger et al., 2015). Investigating how the spatial grain of environmental predictors in SDMs affects a model's variable importance can provide ways to use expert or theoretical knowledge in the decision-making process of what input datasets to use in SDM's. Testing the sensitivity of species distribution models to the spatial grain size of predictor variables is, therefore, an important component to consider in/before applying SDMs.There is a lack of consensus on the direction and magnitude of effects of spatial grain in SDMs, but it is important for practical use of this technique that consensus is reached (Rodríguez et al., 2007).
Africa is predicted to be highly vulnerable to the impacts of climate change. Extensive areas of the region are projected to have warming exceeding 2°C by the end of the twenty-first century with a likely decline in precipitation (Collier et al., 2008; Niang et al., 2014). These changes in temperature and precipitation are already negatively impacting ecosystems and biodiversity (Biggs et al., 2008), with evidence of species ranges shifts and changes to ecosystems (Garcia et al., 2012, 2014). Despite the continent's vulnerability to a changing climate, with a potential high loss of biodiversity (IPBES, 2018), the likely impacts remain largely unstudied. In addition, the African arid tropical forests landscape has not yet been utilized to investigate intrinsic sensitivities of SDM modeling. Given the continent's vulnerability to climate change, effective, reliable and high performing SDMs within the arid forests of Africa is critical.
Recent studies have aimed to increase confidence in species occurrence projections by tackling methodological uncertainties of ecological models (Diniz-Filho et al., 2009; Buisso et al., 2010). The southern African landscape, climatic system and plant species diversity (Revermann et al., 2016; Reason, 2017), presents an ideal setting to investigate if and how the importance of environmental drivers for determining species distributions change across spatial grains. In this study, we use 194 unique intensively sampled vegetation plots (nested design of 100-m2, at the center of 1,000-m2 plot) in the Okavango River Basin, and relevant climatic information to investigate and evaluate the effects of predictor spatial grain on the variable importance of SDM predictions. We then explore if and how the variation in spatial grain affects the patterns and estimations of species richness distribution. We specifically tackle the following questions: (i) which are some of the main climatic determinants of the plant species distributions in the Okavango river basin? (ii) What are the effects of predictor spatial grain on the importance of the climatic variables determining suitable climate space? and (iii) what is the degree to which species richness estimations differ across fine to coarse predictor spatial grains?
Materials and Methods
Study Area
The study is based on the Okavango River Basin (hereafter ORB) located in Southern Africa (Figure 1) and spanning three countries: Botswana, Namibia and Angola. An interesting and important case study given its special ecological status: as biodiversity hot spot and UNESCO world heritage site (UNESCO WORLD HERITAGE SITE, 2014), as well as an ecoregion of global conservation priority (DEA, 2009). Its relatively homogenous climatic and topographic background (Figure S1), also provides a tractable model system for exploring issues of grain size in SDM. The ORB covers an area of approximately 1,860 km2 including the delta. The basin is comprised of distinctive landscape units starting with the semi-humid Angolan highlands in the north where the Okavango river originates, South of this are lowlands, followed by the Okavango Delta in Northwest Botswana (Revermann et al., 2016). The Okavango Basin has a strong rainfall gradient with a mean annual precipitation of 1,300 mm in the north east and >500 mm in the southwest. The wet season is between the austral summer months of December, January, February Climatic, geological and soil conditions control the flow regime of the river. The Okavango basin is a key conservation region as it is a major wetland system and harbors vital seasonal habitats that support a high diversity of species. The basin features a latitudinal gradient of a transitioning wet/dry type of tropical climate and landscape where the vegetation can be clustered into 13 vegetation communities (Revermann et al., 2016). This plant community composition appears to be driven by variations in wetness and soil texture and fertility (Ramberg et al., 2006).
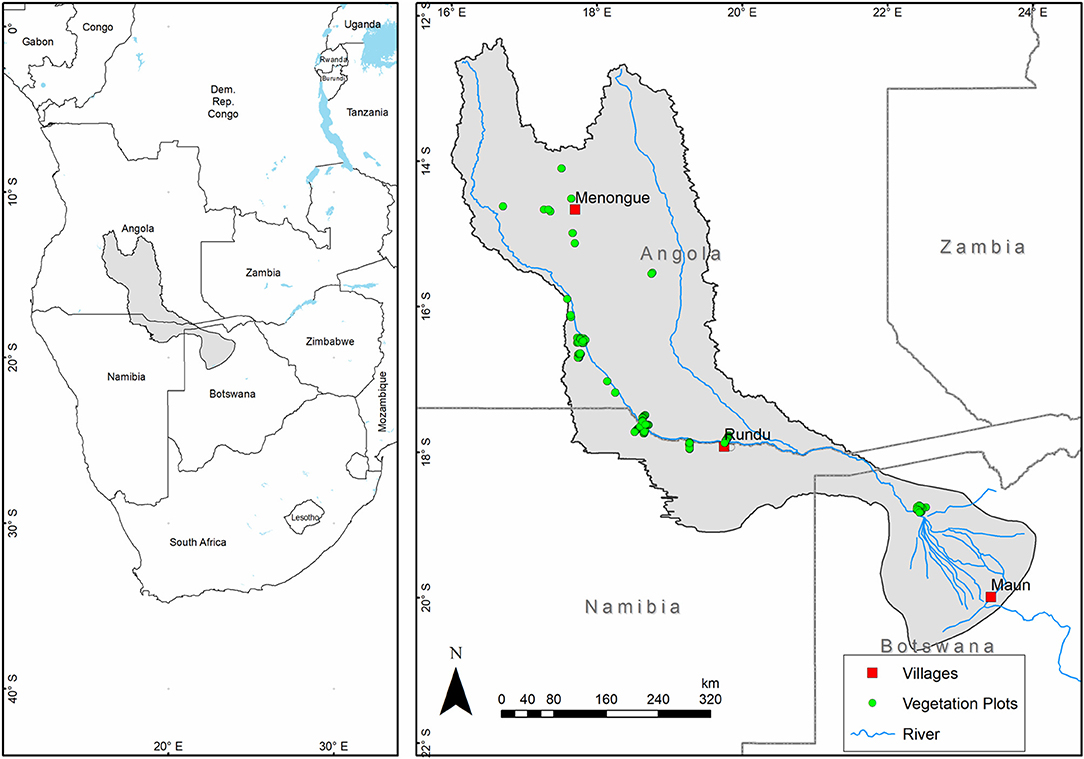
Figure 1. Location of the Okavango River Basin in southern Africa with the map of the ORB showing the location of vegetation plots used for this study.
Vegetation Species Sample
We use the Vegetation Database of the Okavango Basin (GIVD ID: AF-00-009, http://www.givd.info/ID/AF-00-009) (Revermann et al., 2016) collected through The Future Okavango (TFO) project. The database contains samples from a wide range of terrestrial vegetation, such as Miombo woodlands and forests, geoxylic grasslands, Baikiaea-Burkea woodlands, and Colophospermum mopane woodlands. The terrestrial vegetation presence/absence data comes from a plot network consisting of 194, 1,000 m2 plots.
Climate Data
The CORDEX initiative (Giorgi et al., 2009) has made available Regional Climate Models (RCM) for Africa. The RCM outputs have been empirically downscaled by CORDEX to resolutions applicable to ecological modeling. Through this, the AFRICLIM project has produced high resolution climate projections for ecological application in Africa (Platts et al., 2015). The climate data used for this study was therefore sourced from the AFRICLIM V3.0 database. The original data stems from the regional climate model RCA4 (Rossby Center regional model) forced with the global circulation models from CMIP5. Current research on the simulation of Southern Africa rainfall, uses the EC-EARTH model from CMIP5 (Pinto et al., 2018), as it reliably simulates the domain's climatology. Following on from this, within the AFRICLIM V3.0 database the study uses products from the EC-EARTH_SMHI-RCA4 model. The period from 1950 to 2000 is commonly used to represent conditions at the beginning of the impacts of anthropogenic climate change and is therefore used as the present period.
Climatic conditions are critical to plant physiological function and survival (Becklin et al., 2016), and are therefore among the most important agents in determining the distribution of vegetation. The seasonally arid tropical region of the ORB calls for variables that measure and include the intensity of the dry or wet season. Climatic variables were therefore, selected based on their significance to plant physiology. We used a combination of coldest and warmest quarter mean temperatures (mtwq), annual ratio of actual to potential evapotranspiration (pet) and a measure of the rainfall intensity of the dry /wet season (moisture index moist quarter [mimq], rainfall driest quarter [rdq], temperature seasonality [tempSea]), see Table 1. We used the climatic variables at the following four different spatial grains 2 km2 (1 arc-minute), 5 km2 (2.5 arc-minute), 10 km2(5 arc-minute), and 20 km2(20 arc-minute) [from the AFRICLIM v.30 database (https://webfiles.york.au.uk/KITE/AfriClim/] Applying the bilinear interpolation method, the mean values of the 20 km2 climatic variables were interpolated to a 50 km2 grid size. The remapping was done in Climate Data Operators (CDO 2018: Available at: http://www.mpimet.mpg.de/cdo).
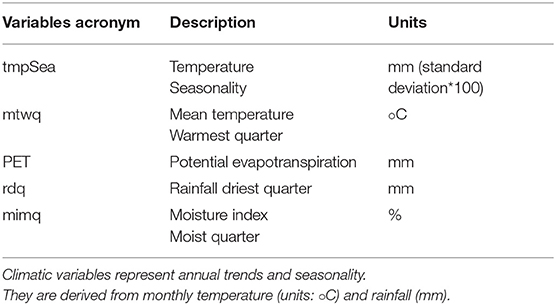
Table 1. Climatic variables used to generate species distribution models of the vascular plant species.
Prior to model calibration, a sensitivity analysis was conducted in order to identify and remove highly correlated variables, while retaining variables that are known to be important determinants of plant distribution (Braunisch et al., 2013). A Variance Inflation Factor [VIF] (Zuur et al., 2010; Naimi et al., 2014) with a threshold of 3 was used and highly collinear variables were excluded through a stepwise procedure. From the original ten variables, five had a collinearity problem; mean temperature coolest quarter, rainfall seasonality, rainfall wettest quarter, moisture index arid quarter and length of longest dry season. We retained the remaining five variables that represent climate variability and extremes for use in the study (Table 1).
Fitting Species Distribution Models
We fitted SDMs for the current period (1950–2000) across five climatic predictor spatial grains from local to regional scale (2, 5, 10, 20, 50 km2) to test whether predictor variables change in importance. The SDMs were built by assembling 6 widely-used modeling algorithms (Table 2): 3 machine learning methods, Random Forest (RF), Artificial Neural Networks (ANN) and Classification Tree Analysis (CTA); two regression methods: Generalized Additive Models (GAM) and Generalized Linear Models (GLM) and one Maximum Entropy Modeling (Maxent). The SDMs were fitted for all 150 species with the five non-collinear climatic variables (Table 1). As different sets of data are used for calibrating the model, to account for within-algorithm model variation, distribution models for each species were computed using ten model repetitions, producing a total of (150 species × 6 algorithms × 5 spatial grain × 10 replicates) 45,000 models. Evaluation of the performance of the models in terms of accuracy was based on the Area Under the curve (AUC) of the Receiver Operator Characteristic Curve. The AUC's threshold and prevalence independent nature, renders it an effective model accuracy metric (Allouche et al., 2006). We then constructed ensemble species distribution models by averaging the model predictions across the individual SDMs for each species and after excluding the models with lowest AUC values (AUC <0.60). A total of 750 ensemble SDMs were obtained (150 species x 5 grid sizes). All analysis were done in the R statistical environment version 3.5.1 (Team, 2013) using the SSDM package (Schmitt et al., 2017).
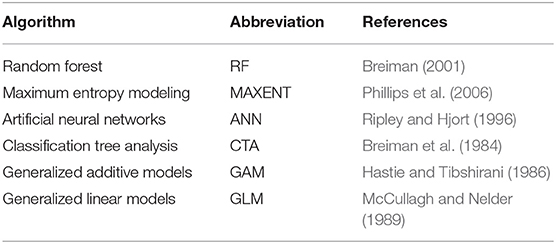
Table 2. Statistical methods used to fit the vascular plant species distributions models.
Predicting Species Richness
Local species richness and composition were predicted using a stacked species distribution modeling approach (Dubuis et al., 2011) and a macroecological model. We estimated the species richness with the SESAM framework and a Macroecological Model (MEM) (Guisan and Rahbek, 2011), using the ecological assembly probability ranking rule (PRR) (see D'Amen et al., 2015). The PRR rule follows as assumption that species with the highest habitat suitability are more competitive than those with the lowest habitat suitability (D'Amen et al., 2015; Schmitt et al., 2017). In the MEM a number of species equal to the prediction of species richness is selected on the basis of decreasing probability of presence calculated by the SDMs (Guisan and Rahbek, 2011; Del Toro et al., 2019). To set the macroecological constraints per site, the ensemble SDM models were overlaid and ranked by their habitat suitability, retaining as many species as the predicted richness of the macroecological model suggested (Schmitt et al., 2017). For observed species richness, the number of species within the 150-species pool, present in each sampling plot was taken as the observed species richness.
We constructed presence and absence species range maps to assess effects of predictor spatial grain on estimates and spatial patterns of species richness. The present time species richness maps (Figure 5) were achieved as described above and across the fine to coarse spatial grains (2, 5, 10, 20, 50 km2).
Species Richness Maps Accuracy Assesment Across Spatial Grains
We assessed the accuracy (disagreements between the prediction and reality) of the species richness maps across the sets of spatial grains, using observed occurrence data from the plots. We analyzed the proportion of accurate richness predictions and true negatives, true positives and similarities in species richness using the species richness error, prediction success, Cohen's Kappa coefficient (Schmitt et al., 2017). The five species richness prediction maps, per spatial grain, were compared against our observed control points.
Drivers of Species Richness
To identify the main determinants of species richness and explore the effects of predictor spatial grain on the species richness, variable importance values (see next section for a full description) as computed during the modeling of species richness were used.
Investigating Importance of Climatic Drivers Across Spatial Grains
The modeling of species distribution entails the operation and interaction of mechanisms at different scales: one at the response scale, the analysis /operational scale, and the study extent scale (environment spatial grains) (Mertes and Jetz, 2018). Here we evaluate the effects of operational spatial grain on the SDMs variable importance across fine to coarse spatial grains (2, 5, 10, 20, 50 km2). Using the SDM approach described above we assessed which one of the variables determine the species suitable climate space distribution. We calculated variable importance (VI) scores from each SDM and variable involved in the models. These VIs reflect the relative contribution of environmental predictor variables to the model outputs and may depend on the predictor spatial grain at which the species distributions are modeled. For the VI calculations we used the “Percentage Contribution” scores (Thuiller et al., 2009; Schmitt et al., 2017), which has been successfully used in recent similar studies (Gallardo and Aldridge, 2013; Quillfeldt et al., 2013; Aguirre-Gutiérrez et al., 2017), as a measure of variable importance. The percentage contribution is calculated by building an SDM with the original explanatory variables and then comparing it to another built by randomizing the focus variable and then investigating the correlation between those two models. Therefore, the final VI score is computed as one minus the correlation value between the two models mentioned above and standardized to percentage variable importance. The higher the percentage, the more importance the variable has on the model.
The SDM outputs were therefore evaluated in three ways: (i) variable importance scores for each variable were compared across the sets of predictor spatial grains, (ii) species richness estimates and distribution patterns were compared across spatial grains, (iii) model performance was compared across scales, based on AUC and Kappa values (Guisan et al., 2007b). In this analysis predictor spatial grain interacting with variable identity is used as a test factor and the response variables being models' variable importance scores, both for single and species richness maps, model performance and model spatial output.
Generalized Linear Models
To investigate how the relative importance of climatic predictor variables changes as a function of predictor spatial grain, we fitted a Generalized Linear Model (Venables and Ripley, 2002). The VI scores were converted to a 0 to 1 range and modeled using a binomial error structure with a logit link function which was selected following a test of both the default and the user specified complementary log-log, where the model with the lowest deviance fit was then chosen. The model was tested for overdispersion using the chi-squared method, no suggestions of over dispersion were found. The fitted GLM thus contained the VI score (of the SDMs or Species richness predictions) as a response variable and the climatic variable identity, the spatial grain and their interaction as explanatory variables.
The logistic regression analysis is used to (i) examine whether the relationship between the variable importance scores interacting with climatic predictors is significant; and (ii) to establish the contributions and roles of the different sets of climatic variables.
We then performed a multiple comparison analysis (post-hoc comparison test) in order to test for pairwise significant differences between the climatic variables interacting with spatial grains, using Tukey's Honest Significant Difference (Yandell, 2017). All statistical analyses were carried out in the R platform (Team, 2013), with the MASS (Venables and Ripley, 2002) and the lsmeans packages (Lenth, 2016).
Results
Species Distribution Models Evaluation
All species distribution models were found to be effective in predicting the vascular plant species distributions, with a fairly good median AUC score > 0.7 and an interquartile range of 0.1 (Figure 2 and Table S1). There was no effect of spatial grain in the performance of the models, as evident from the reported consistent AUC values (Table S1).
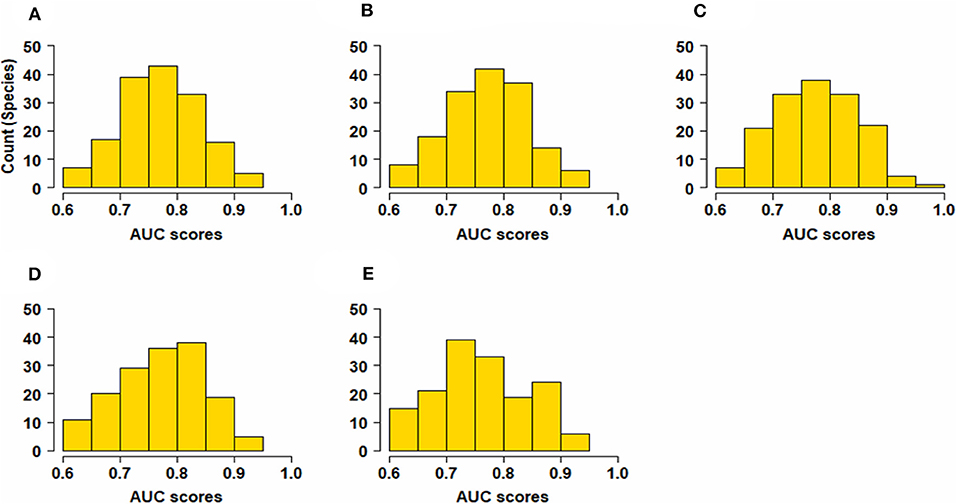
Figure 2. Histogram of Area Under the ROC Curve (AUC) scores showing model performance for all species (A) model performance at 2 km2, (B) model performance at 5 km2, (C) performance at 10 km2, (D) performance at 20 km2, and (E) at 50 km2. The figure indicates that all models are effective in predicting the plant species distribution with no effect of spatial grain in the performance of the models.
Main Climatic Determinants
Variations in environmental predictor spatial grain have effects on the importance of climatic variables in determining species suitable climate space. Our analysis (Figure 3) shows PET having the largest effect in determining the species suitable climate space of plants of the ORB at fine predictor spatial grain sizes (2, 5 km2). An aggregation of one in predictor spatial grain (5 vs. 10 km2), alters the order of the contribution of the temperature related variable to the present-day species distribution. The contribution of PET slightly reduces and mimq slightly increases at 10 km2, with mimq accounting for the highest variability with a VI of 28%. At 20 km2 the importance contribution of PET is further reduced (Figure 3). However, percentage differences leading PET to lose its key determinant position at 10 and 20 km2 are negligible. At the broader spatial grain (50 km2) PET reassumes its role as the strongest predictor (Figure 3).
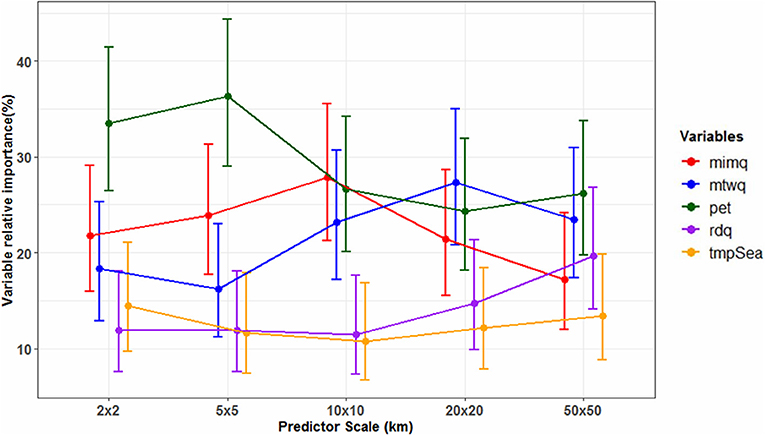
Figure 3. Climatic variable importance for the plant species distributions across predictor spatial grain (2, 5, 10, 20, 50 km2). The figure depicts average effects of predictor spatial grain on the importance of climatic variable driving species distribution (bars depict the 95% confidence interval over 150 species models). It also illustrates within and between variables, and between predictor spatial grain differences in the importance performance of the climatic variables driving the Okavango river basin plant species distribution. Climatic variables: moisture index of moist quarter (mimq), mean temperature of warmest quarter (mtwq), potential evapotranspiration (pet), rainfall of driest quarter (rdq), temperature seasonality (tmpSea). For details of the generalized linear model see Appendix S1.
Within Variables Effects of Spatial Grain
Interestingly, negative interactions are portrayed between some variable identities and predictor spatial grain. When considering the rdq, a pattern of no difference in the contribution importance is detected across all the different grain sizes, as the variable tends to have even importance values (Table S2). Results from the multiple comparisons, Tukey's p-values and GLM test across spatial grains, show no statistically significant differences in the variable's importance in driving the species climatically determined distribution, whether on fine or coarse spatial grain (Table 3 and Table S3). This pattern of no variation across spatial grains also holds for temperature seasonality (Table 3 and Table S3). Spatial grain has therefore no significant effect on the contribution of these climatic variables to plant species distribution.
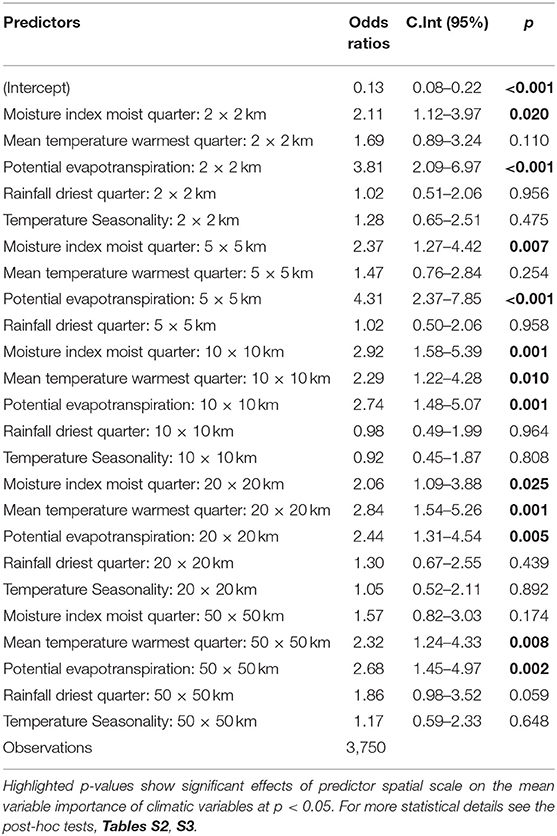
Table 3. Model results assessing changes in the mean variable importance of climatic variables across predictor grain sizes.
Decreases in predictor spatial grain causing an increase in variable importance gives a mixed response. The notion is only apparent for the mtwq where the highest importance values are observed at a coarse grain of 20 km2 (27%), 50 km2 (23%), and 10 km2 (23%) (Figure 3 and Table S2). Significant interactions (p < 0.05) for the effect of spatial grain on mtwq were observed at these coarse spatial grains (Table 3). However, when considering the local spatial grain, there is an exception to this notion as at the finest grain of 2 km2, the temperature variable gains more importance than at a coarser grain of 5 km2. Based on multiple comparisons, Turkey's p-value (p > 0.05), the difference in the importance values at both the 2 and 5 km2 is however insignificant (Tables S2, S3). At the fine spatial grains, the GLM test also displays a no significant effect (p > 0.05) of spatial grain to the temperature related variable (Table 3).
Specific climatic variables such as mimq quite clearly display less evidence of predictor spatial grains' influence on the variable importance. The rainfall variable performance at a 20 km2 distribution model is equivalent to that at the finest scale of 2 km2. Even though the predictor spatial grains are spread apart, both produced a relative importance contribution of 22% (Figure 3 and Table S2). Multiple comparisons analysis and GLM test (p > 0.05) show no significant difference in the importance of the variable in driving the species climatically determined distributions, whether at the finest spatial grain or coarser grain (Table 3 and Table S3). At the coarsest 50 km2 the spatial grain has an insignificant effect on the mimq variable importance (p = 0.254) (Table 3).
A 5 - and 10-fold increase in predictor spatial grain (10 and 20 km2) causes a significant influence in variable importance, however this was only observed in three variables; mimq, mtwq and PET (p < 0.05; Table 3). A 25-fold increase to 50 km2 exerts influence only on the importance of temperature related variables; the mtwq (p = 0.008), and PET (p = 0.002). The broadening of the spatial grain from 20 km2 to regional scale of 50 km2 does not cause any effect on mimq, or rdq and tempSea with (p > 0.05; Table 3). The fine spatial grains of 2 and 5 km2, have a statistically significant effect on PET (p < 0.001) and a significant effect on mimq (p = 0.020 and 0.007, respectively, Table 3). The results suggest that among the analyzed variables, there is a significant interaction between the mean variable importance of PET only, across all spatial grains.
Even though the importance order of the temperature and precipitation species distribution determinants, display slightly different tendency across the spatial grains (Figure 3 and Table S2), the differences in each variable's mean importance values at the fine to coarse spatial grains, are quite small (Table S2). Across the spatial grains of 5, 10, 20, and 50 km2 temperature seasonality maintains its position as the least importance contributor. An exception to this is depicted at the finest grain of 2 km2, where the temperature seasonality displays a higher importance than rainfall of the driest quarter, relative to the other spatial grain of predictors.
Overall, the results show that importance of the climatic variables does not vary consistently with predictor spatial grains.
Comparisons of Species Richness Distribution Maps Accuracy Assessment
Species richness distribution models that use different predictor spatial grains do not differ significantly as measured by the Kappa coefficient. Across all the species richness maps produced at different spatial grains, a high level of agreement with Kappa scores of 0.99 is achieved (see Table S5). However, corresponding levels of species presence and absence per given point against the observed occurrence data points, varied slightly across the different spatial grains. The variation between the predicted and observed species richness marginally increases with the increase in predictor spatial grain, where at the broader spatial grain of 50 km2, the highest average of 5.56 species richness error/250 vs 2.74/4 km is detected, and the lowest 2.51 species richness error/25 km species richness error obtained at 5 km2 (Figure 4 and Table S5).
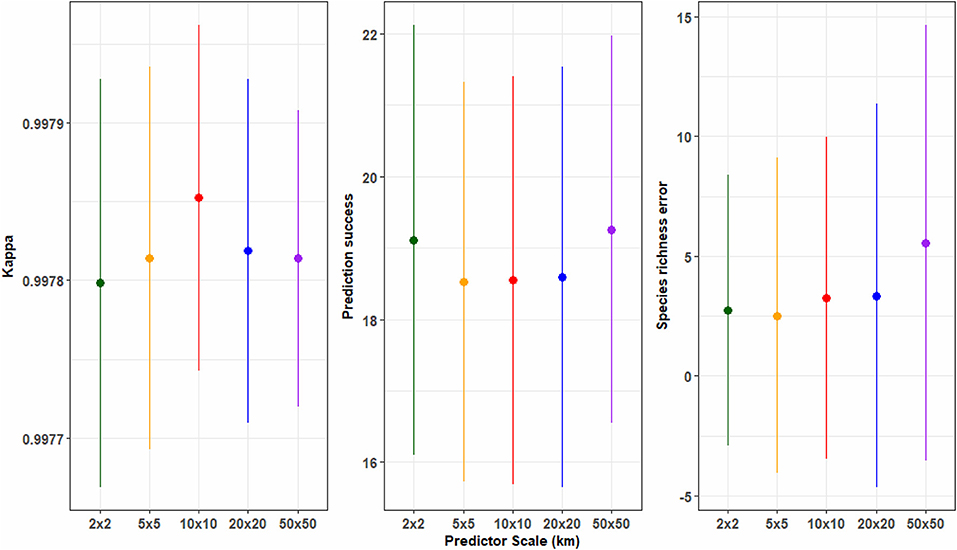
Figure 4. Species richness maps accuracy assessment. The figure explores the effect of predictor spatial scale and the accuracy of species richness maps based on 3 evaluation metrics; Cohen's Kappa, Prediction success, Species richness error (bars depict the 95% confidence interval).
The richness maps at the finest and coarsest spatial grains of 2 and 50 km2, offer the highest chance of a predicted species being found in that grid square. On average, prediction success at both the local and regional spatial grain is 19.11 and 19.26, respectively. No emerging trend is observed as the next fine spatial grain of 5 km2 gives the lowest proportion of accurate predictions with a mean of 18.53. Our analysis shows that strong predictive capacity is obtained at the coarsest species richness maps (50 km2). However, there is a very small variations in the proportions of prediction success of the models across all predictor spatial grains.
Current Patterns of Species Richness Across Predictor Spatial Grain
The distribution, patterns and estimate of richness displayed no major variation with decrease of the predictor spatial grain from local to regional scale. Within the boundaries of the case study, the maximum estimated richness of 40–60 species per km2 is in Northern Namibia, with medium (20–40 species per km2) richness predicted in the center of the domain, while the center of Angola and wider Southwards areas at the bottom of the delta depict a low estimated richness of 0–20 (Figure 5). This pattern is observed across all species richness maps from local (2 km2) to regional (50 km2) scale. When considering the area coverage of richness across the projected models, we see the coarser spatial grain (Figures 5C–E) leading to a slightly greater area predicted to contain a high richness (i.e., dark green patch increases in size 40–60 per km2). Whereas, the finer resolutions (Figures 5A,B) show that species richness is not equal within these high richness areas shown at a coarser resolution.
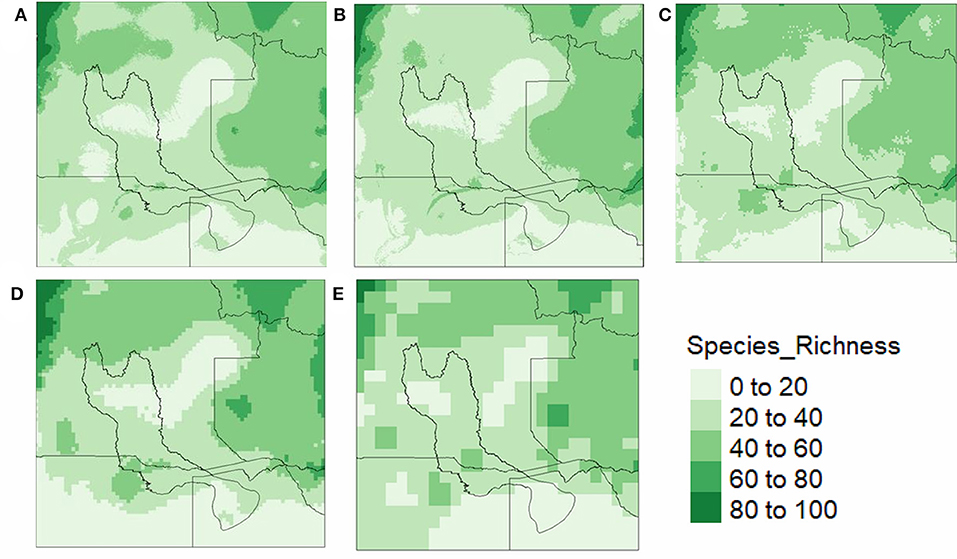
Figure 5. Estimate present day predictions of species richness for the study domain across predictor grain size derived from SSDM, (A) species richness at a 2 km2, (B) species richness at 5 km2, (C) richness at 10 km2, (D) richness at 20 km2, (E) richness at 50 km2.
Discussion
The understanding of how the spatial grain of environmental variables influences the species geographic occurrence is critical for studies inferring ecological niche relationships (Verbruggen et al., 2013; Radinger et al., 2015; Manzoor et al., 2018; Yates et al., 2018). This understanding is important for developing biodiversity monitoring tools for conservation decision making (Rodríguez et al., 2007) as well as developing management and conservation (adaptation) strategies. Moreover, accounting for any uncertainties in species distribution models is of pivotal importance, especially when building species distribution for biodiversity conservation (Vaughan and Ormerod, 2003; Rodríguez et al., 2007; McInerny and Purves, 2011). The results offer important insights on the relationships between changes in plant suitable climate/environmental space and environmental variables across spatial grains (2 to 50 Km2).
Identification of Main Climatic Determinants of Plant Species Distributions
Some climatic variables determining species distributions were relatively inconsistent across spatial grains. However, PET outperformed other variables as it was progressively selected as an important driver for the plant species and richness distributions at the fine spatial grains and the coarsest scale of 50 km2, which is in agreement with Thuiller et al. (2003) who reported consistency in some variables selected by SDMs across spatial grain sizes. It is not surprising that PET is a key driver of ecological patterns in the ORB given that an estimated 98% of total inflow to the basin is lost through evapotranspiration (Ramberg et al., 2006). Our results suggest that moisture too plays and important role in determining plant distributions, as the rainfall related climatic variable; moisture index of moist quarter, presents strong predictive power at 10 km2. This differs with findings of Revermann et al. (2016), who showed that moisture based climatic variables displayed less predictive strength over the domain of study whereas temperature related variables have strong predictive power. Plant species of the Okavango river basin are susceptible to shifts in temperature related conditions and this has implications in the vegetation patterns and diversity of the river basin (Tonkin et al., 2017). It is expected that as the climate of Southern Africa gets drier by the end of the twenty-first century (Niang et al., 2014), the basin will be dominated by drier vegetation types such as Baikiaea burkea and Colophospermum mopane woodlands.
Spatial Grain Effects on the Importance of Climatic Variables
Contrary to the findings of Wan et al. (2016) whose results of a global study showed a positive dependence of variable importance on spatial grain, our results suggest that the response of a species to climatic variables is relatively independent of the variable spatial grain in the ORB region. Spatial grain in a relatively flat homogenous landscape like the interior sand sheet of the south western region of Southern Africa (study area) may therefore be less important than in a more heterogeneous landscape (Raes and Aguirre-Gutiérrez, 2018). Thus, landscape level homogeneity in climatic and topographic conditions (Reason et al., 2006; Weber, 2013) may also contribute to the explanation of the lower dependence of variable importance to spatial grain in our study area. Our results suggest that climatic variables that determine species distribution patterns can still be appropriately detected and estimated at coarse predictor spatial grains. Studies with the aim of evaluating niche relations and identification of predictor variables driving species occurrence, such SDM models, can be operated at both the local (2 km2) and regional spatial grains of up to 50 km2 at least in the context of relatively flat climatically and topographically homogeneous landscapes. This is an encouraging finding for conservation practitioners, given the resource demanding processes of downscaling climate/environmental variables to fine (2 km2) spatial grain for ecological modeling.
Accuracy Assessment of Species Richness Prediction Across Spatial Scales
The expectation is that the levels of accuracy in species richness predictions would differ across predictor spatial grains, with accuracy declining with the decrease in spatial grain (Connor et al., 2018). For our studied species and area, there was a high level of agreement between prediction maps based on spatial grains from fine to coarse. Our results are inconsistent with Seo et al. (2009), who concluded that increases in spatial grain size (1–64 km2) causes AUC predictive model values to decline while the predicted geographic extent of species climatically determined distribution increased. Moreover, our results are also comparable to those of Guisan et al. (2007a), who found that variation in spatial grain size (between 100 and 10 km) had minimal impact on model performance. Therefore, our results suggest that the benefit of increasing predictor spatial grain does not necessarily result in an increase of model accuracy.
Effects of Predictor Spatial Grain on Species Richness
Measure of species richness are shaped by multiple biotic and abiotic factors, one of which may be spatial grain (Keil et al., 2012). In our study, irrespective of the stacked species distribution models being constructed on varying predictor spatial grains, similar distribution patterns and estimates of species richness were obtained (Figure 5). This implies that spatial grain has a small effect on the estimates, pattern and distribution of species richness in our study area. However, this does not imply that the spatial generalization in the predictions caused by a lower spatial grain does not also cause a possible overestimation of species richness, as also shown by other studies (Seo et al., 2009; Franklin et al., 2013). It is therefore imperative to note that modeling species distribution at coarse spatial grains is a trade-off between data availability and generalization of species richness distributions patterns. Some important details, such as information associated with uncertainty of model predictions, are lost when modeling species richness patterns at coarse spatial grains and such limitations should be accounted for when applying SDMs for species conservation decision making.
Conclusion
Our results contribute to the on-going debate on what the adequate resolution of climate data is for an accurate prediction and identification of determinants of species distribution and species richness patterns. For conservation purposes, species distributions models and species richness predictions for current and future climate scenarios may be undertaken at a coarse spatial grain in areas with relatively low climatic and topographic variation as the one shown in this study, with relatively high statistical accuracy and from fine to broad spatial grains. However, the use of SDMs across spatial grains will need to be tailored to the specific location, data available and questions being addressed for effective biodiversity management and conservation. In addition, coarse spatial grain modeling being acceptable in the case of low topographic variation needs further testing in a more heterogenous region.
Data Availability Statement
Species data used in this study are available at GIVD ID: AF-00-009, http://www.givd.info/ID/AF-00-009 (Revermann et al., 2016). Bioclimatic data are available online https://webfiles.york.ac.uk/KITE/AfriClim/ (Platts et al., 2015).
Author Contributions
BT-M and JA-G conceived the idea and designed the study. BT-M constructed all the modeling work, carried out the statistical analyses, and interpreted the results with important discussions and input from JA-G. BT-M led the writing and produced initial drafts of the manuscripts with contribution from JA-G on revision of the manuscripts.
Conflict of Interest
The authors declare that the research was conducted in the absence of any commercial or financial relationships that could be construed as a potential conflict of interest.
Acknowledgments
BT-M thanks the Botswana International University of Science and Technology, through the government of Botswana for generously funding the PhD of which this article is part, The Future Okavango (TFO) project for compiling the Vegetation Database of the Okavango Basin and the AFRICLIM project for high resolution climate projections for ecological application in Africa (Platts et al., 2015). JA-G thanks funding by the Netherlands Organisation for Scientific Research (NWO) under the Rubicon programme with project number 019.162LW.010. We thank P. Berry for the helpful, constructive feedback and comments on the earlier versions of this manuscript. Also, we thank H. Paltan Lopez for the design of the case study map.
Supplementary Material
The Supplementary Material for this article can be found online at: https://www.frontiersin.org/articles/10.3389/ffgc.2019.00069/full#supplementary-material
References
Aguirre-Gutiérrez, J., Serna-Chavez, H. M., Villalobos-Arambula, A. R., Pérez de la Rosa, J. A., and Raes, N. (2015). Similar but not equivalent: ecological niche comparison across closely-related Mexican white pines. Divers. Distrib. 21, 245–257. doi: 10.1111/ddi.12268
Aguirre-Gutiérrez, J., WallisDeVries, M. F., Marshall, L., van't Zelfde, M., Villalobos-Arámbula, A. R., Boekelo, B., et al. (2017). Butterflies show different functional and species diversity in relationship to vegetation structure and land use. Glob. Ecol. Biogeogr. 26, 1126–1137. doi: 10.1111/geb.12622
Allouche, O., Tsoar, A., and Kadmon, R. (2006). Assessing the accuracy of species distribution models: Prevalence, kappa and the true skill statistic (TSS). J. Appl. Ecol. 43, 1223–1232. doi: 10.1111/j.1365-2664.2006.01214.x
Araújo, M. B., and Peterson, A. T. (2012). Uses and misuses of bioclimatic envelope modeling. Ecology 93, 1527–1539. doi: 10.1890/11-1930.1
Becklin, K. M., Anderson, J. T., Gerhart, L. M., Wadgymar, S. M., Wessinger, C. A., and Ward, J. K. (2016). Examining plant physiological responses to climate change through an evolutionary lens. Plant Physiol. 172, 635–649. doi: 10.1104/pp.16.00793
Biggs, R., Simons, H., Bakkenes, M., Scholes, R. J., Eickhout, B., van Vuuren, D., et al. (2008). Scenarios of biodiversity loss in southern Africa in the 21st century. Glob. Environ. Change 18, 296–309. doi: 10.1016/j.gloenvcha.2008.02.001
Bradter, U., Kunin, W. E., Altringham, J. D., Thom, T. J., and Benton, T. G. (2013). Identifying appropriate spatial scales of predictors in species distribution models with the random forest algorithm. Methods Ecol. Evol. 4, 167–174. doi: 10.1111/j.2041-210x.2012.00253.x
Braunisch, V., Coppes, J., Arlettaz, R., Suchant, R., Schmid, H., and Bollmann, K. (2013). Selecting from correlated climate variables: a major source of uncertainty for predicting species distributions under climate change. Ecography 36, 971–983. doi: 10.1111/j.1600-0587.2013.00138.x
Breiman, L., Friedman, J. H., Olshen, R. A., and Stone, C. J. (1984). Classification and Regression Trees. New York, NY: Routledge.
Buisso, N. L., Thuiller, W., Casajus, N., Lek, S., and Grenouillet, G. (2010). Uncertainty in ensemble forecasting of species distribution. Glob. Chang. Biol. 16, 1145–1157. doi: 10.1111/j.1365-2486.2009.02000.x
Collier, P., Conway, G., and Venables, T. (2008). Climate change and Africa. Oxford Rev. Econ. Policy 24, 337–353. doi: 10.1093/oxrep/grn019
Connor, T., Hull, V., Viña, A., Shortridge, A., Tang, Y., Zhang, J., et al. (2018). Effects of grain size and niche breadth on species distribution modeling. Ecography. 41, 1270–1282. doi: 10.1111/ecog.03416
D'Amen, M., Dubuis, A., Fernandes, R. F., Pottier, J., Pellissier, L., and Guisan, A. (2015). Using species richness and functional traits predictions to constrain assemblage predictions from stacked species distribution models. J. Biogeogr. 42, 1255–1266. doi: 10.1111/jbi.12485
DEA (2009). Botswana Fourth National Report to the Convention of Biological Diversity. Available online at: https://www.cbd.int/doc/world/bw/bw-nr-04-en.pdf (accessed October 28, 2019).
Del Toro, I., Ribbons, R. R., Hayward, J., and Andersen, A. N. (2019). Are stacked species distribution models accurate at predicting multiple levels of diversity along a rainfall gradient? Austral Ecol. 44, 105–113. doi: 10.1111/aec.12658
DellaSala, D. A., Brandt, P., Koopman, M., Leonard, J., Meisch, C., Herzog, P., et al. (2018). Climate change may trigger broad shifts in North America's pacific coastal rainforests. Encycl. Anthr. 233–244. doi: 10.1016/B978-0-12-809665-9.09367-8
Diniz-Filho, J. A. F., Mauricio Bini, L., Fernando Rangel, T., Loyola, R. D., Hof, C., Nogués-Bravo, D., et al. (2009). Partitioning and mapping uncertainties in ensembles of forecasts of species turnover under climate change. Ecography. 32, 897–906. doi: 10.1111/j.1600-0587.2009.06196.x
Dubuis, A., Pottier, J., Rion, V., Pellissier, L., Theurillat, J.-P., and Guisan, A. (2011). Predicting spatial patterns of plant species richness: a comparison of direct macroecological and species stacking modelling approaches. Divers. Distrib. 17, 1122–1131. doi: 10.1111/j.1472-4642.2011.00792.x
Dunford, W., and Freemark, K. (2005). Matrix matters: effects of surrounding land uses on forest birds Near Ottawa, Canada. Landsc. Ecol. 20, 497–511. doi: 10.1007/s10980-004-5650-5
Elith, J., and Leathwick, J. R. (2009). Species distribution models: ecological explanation and prediction across space and time. Annu. Rev. Ecol. Evol. Syst. 40, 677–97. doi: 10.1146/annurev.ecolsys.110308.120159
Fordham, D. a., Akçakaya, H. R., Araújo, M. B., Keith, D. A., and Brook, B. W. (2013a). Tools for integrating range change, extinction risk and climate change information into conservation management. Ecography 36, 956–964. doi: 10.1111/j.1600-0587.2013.00147.x
Fordham, D. A., Mellin, C., Russell, B. D., Akçakaya, R. H., Bradshaw, C. J. A., Aiello-Lammens, M. E., et al. (2013b). Population dynamics can be more important than physiological limits for determining range shifts under climate change. Glob. Change Biol. 19, 3224–3237. doi: 10.1111/gcb.12289
Fournier, A., Barbet-Massin, M., Rome, Q., and Courchamp, F. (2017). Predicting species distribution combining multi-scale drivers. Glob. Ecol. Conserv. 12, 215–226. doi: 10.1016/j.gecco.2017.11.002
Franklin, J., Davis, F. W., Ikegami, M., Syphard, A. D., Flint, L. E., Flint, A. L., et al. (2013). Modeling plant species distributions under future climates: how fine scale do climate projections need to be? Glob. Change Biol. 19, 473–483. doi: 10.1111/gcb.12051
Gallardo, B., and Aldridge, D. C. (2013). The ‘dirty dozen': socio-economic factors amplify the invasion potential of 12 high-risk aquatic invasive species in Great Britain and Ireland. J. Appl. Ecol. 50, 757–766. doi: 10.1111/1365-2664.12079
Garcia, R. A., Burgess, N. D., Cabeza, M., Rahbek, C., and Araújo, M. B. (2012). Exploring consensus in 21st century projections of climatically suitable areas for African vertebrates. Glob. Change Biol. 18, 1253–1269. doi: 10.1111/j.1365-2486.2011.02605.x
Garcia, R. A., Cabeza, M., Rahbek, C., and Araújo, M. B. (2014). Multiple dimensions of climate change and their implications for biodiversity. Science 344:1247579. doi: 10.1126/science.1247579
Giorgi, F., Jones, C., and Asrar, G. R. (2009). Addressing climate information needs at the regional level: the CORDEX framework. Bulletin. 58, 175–183.
Guisan, A., Graham, C. H., Elith, J., and Huettmann, F. (2007a). Sensitivity of predictive species distribution models to change in grain size. Divers. Distrib. 13, 332–340. doi: 10.1111/j.1472-4642.2007.00342.x
Guisan, A., and Rahbek, C. (2011). SESAM-A New Framework Integrating Macroecological and Species Distribution Models for Predicting Spatio-Temporal Patterns of Species Assemblages. Available online at: https://core.ac.uk/download/pdf/18151336.pdf (accessed May 28, 2019). doi: 10.1111/j.1365-2699.2011.02550.x
Guisan, A., Zimmermann, N. E., Elith, J., Graham, C. H., Phillips, S., and Peterson, A. T. (2007b). What matters for predicting the occurrences of trees: techniques, data, or species' characteristicS? Ecol. Monogr. 77, 615–630. doi: 10.1890/06-1060.1
Hastie, T., and Tibshirani, R. (1986). Generalized additive models. Stat. Sci. 1, 297–310. doi: 10.1214/ss/1177013604
IPBES 2018### IPBES. (2018). Assessment Report on Biodiversity and Ecosystem Services for Africa. IPBES. Available at: https://www.ipbes.net/assessment-reports/africa (accessed July 1, 2019).
Keil, P., Schweiger, O., Kühn, I., Kunin, W. E., Kuussaari, M., Settele, J., et al. (2012). Patterns of beta diversity in Europe: the role of climate, land cover and distance across scales. J. Biogeogr. 39, 1473–1486. doi: 10.1111/j.1365-2699.2012.02701.x
Kosanic, A., Anderson, K., Harrison, S., Turkington, T., and Bennie, J. (2018). Changes in the geographical distribution of plant species and climatic variables on the West Cornwall peninsula (South West UK). PLoS ONE 13:e0191021. doi: 10.1371/journal.pone.0191021
Lenth, R. V. (2016). Least-squares means: the r package lsmeans. J. Stat. Softw. 69, 1–33. doi: 10.18637/jss.v069.i01
Manzoor, S. A., Griffiths, G., and Lukac, M. (2018). Species distribution model transferability and model grain size-finer may not always be better. Sci. Rep. 8:7168. doi: 10.1038/s41598-018-25437-1
McInerny, G. J., and Purves, D. W. (2011). Fine-scale environmental variation in species distribution modelling: regression dilution, latent variables and neighbourly advice. Methods Ecol. Evol. 2, 248–257. doi: 10.1111/j.2041-210X.2010.00077.x
Mertes, K., and Jetz, W. (2018). Disentangling scale dependencies in species environmental niches and distributions. Ecography 41, 1604–1615. doi: 10.1111/ecog.02871
Naimi, B., Hamm, N. A. S., Groen, T. A., Skidmore, A. K., and Toxopeus, A. G. (2014). Where is positional uncertainty a problem for species distribution modelling? Ecography 37, 191–203. doi: 10.1111/j.1600-0587.2013.00205.x
Niang, I., Ruppel, O. C., Abdrabo, M. A., Dube, P., Leary, N., Schulte-Uebbing, L., et al (2014). Katrien Descheemaeker (Netherlands), Houria Djoudi (Algeria), Kristie L. Ebi (USA), Papa Demba Fall (Senegal), Ricardo Fuentes (Mexico), Rebecca Garland (South Africa). Aissa Toure Sarr. Available online at: https://www.ipcc.ch/pdf/assessment-report/ar5/wg2/WGIIAR5-Chap22_FINAL.pdf (accessed July 13, 2018).
Phillips, S. J., Anderson, R. P., and Schapire, R. E. (2006). Maximum entropy modeling of species geographic distributions. Ecol. Modell. 190, 231–259. doi: 10.1016/j.ecolmodel.2005.03.026
Pinto, I., Jack, C., and Hewitson, B. (2018). Process-based model evaluation and projections over southern Africa from Coordinated Regional Climate Downscaling Experiment and Coupled Model Intercomparison Project Phase 5 models. Int. J. Climatol. 38, 4251–4261. doi: 10.1002/joc.5666
Platts, P., Omeny, P., and Marchant, R. (2015). AFRICLIM 3.0: High-Resolution Ensemble Climate Projections for Africa. doi: 10.6084/m9.figshare.1284624.v2
Porfirio, L. L., Harris, R. M. B., Lefroy, E. C., Hugh, S., Gould, S. F., Lee, G., et al. (2014). Improving the use of species distribution models in conservation planning and management under climate change. PLoS ONE 9:e113749. doi: 10.1371/journal.pone.0113749
Quillfeldt, P., Masello, J. F., Navarro, J., and Phillips, R. A. (2013). Year-round distribution suggests spatial segregation of two small petrel species in the South Atlantic. J. Biogeogr. 40, 430–441. doi: 10.1111/jbi.12008
Radinger, J., Wolter, C., and Kail, J. (2015). spatial scaling of environmental variables improves species-habitat models of fishes in a small, Sand-Bed Lowland River. PLoS ONE 10:e0142813. doi: 10.1371/journal.pone.0142813
Raes, N., and Aguirre-Gutiérrez, J. C. (2018). Modeling Framework to Estimate and Project Species Distributions Space and Time. Available online at: https://books.google.co.uk/books?hl=enandlr=andid=GWxODwAAQBAJandoi=fndandpg=PA309anddq=Raes,+Niels+%26+Aguirre-Gutiérrez,+Jesús.+(2018).+A+Modeling+Framework+to+Estimate+and+Project+Species+Distributions+in+Space+and+Time.+andots = tarGz-9-bHandsig=B8n3axC4uawm9Jf0OyzaB (accessed June 27, 2019).
Ramberg, L., Hancock, P., Lindholm, M., Meyer, T., Ringrose, S., Sliva, J., et al. (2006). Species diversity of the Okavango Delta, Botswana. Aquat. Sci. 68, 310–337. doi: 10.1007/s00027-006-0857-y
Raven, P. (2002). Predicting Species Occurrences: Issues of Accuracy and Scale. Available online at: https://books.google.co.uk/books?hl=enandlr=andid=P1gylbUGvOsCandoi=fndandpg=PA3anddq=Predicting+species+occurrences:+issues+of+accuracy+and+scaleandots=Qk8mnFujEcandsig=Zw5MUY0uSIjha-ZGAh8IkQrDs5Q (accessed May 1, 2019).
Reason, C. J., Landman, W., Tennant, W., Reason, C. J., Landman, W., and Tennant, W. (2006). Seasonal to Decadal Prediction of Southern African climate and its links with variability of the Atlantic Ocean. Bull. Am. Meteorol. Soc. 87, 941–956. doi: 10.1175/BAMS-87-7-941
Reason, C. J. C. (2017). Climate of Southern Africa Printed From the Oxford Research Encyclopedia Climate of Southern Africa Summary and Keywords. Oxford: Oxford Research Encyclopedia. doi: 10.1093/acrefore/9780190228620.013.513
Reichgelt, T., West, C. K., and Greenwood, D. R. (2018). The relation between global palm distribution and climate. Sci. Rep. 8:4721. doi: 10.1038/s41598-018-23147-2
Revermann, R., Finckh, M., Stellmes, M., Strohbach, B., Frantz, D., and Oldeland, J. (2016). Linking land surface phenology and vegetation-plot databases to model terrestrial plant α-diversity of the Okavango Basin. Remote Sens. 8:370. doi: 10.3390/rs8050370
Ripley, B. D., and Hjort, N. L. (1996). Pattern Recognition and Neural Networks. New York, NY: Cambridge University Press. Available online at: https://books.google.com/books?hl=en&lr=&id=2SzT2p8vP1oC&oi=fnd&pg=PR9&dq=Ripley,+B.+D.+(2007).+Pattern+recognition+and+neural+networks.+Cambridge,+UK:+Cambridge+University+Press&ots=JMWWf6gQ_R&sig=aji4B6rTE68CIxEsAJdDULHHK0Y (accessed September 24, 2019).
Rodríguez, J. P., Brotons, L., Bustamante, J., and Seoane, J. (2007). The application of predictive modelling of species distribution to biodiversity conservation. Divers. Distrib. 13, 243–251. doi: 10.1111/j.1472-4642.2007.00356.x
Schmitt, S., Pouteau, R., Justeau, D., de Boissieu, F., and Birnbaum, P. (2017). ssdm : an r package to predict distribution of species richness and composition based on stacked species distribution models. Methods Ecol. Evol. 8, 1795–1803. doi: 10.1111/2041-210X.12841
J. M.. Scott, J. H.. Heglund, M. L.. Morrison, J. B.. Haufler, M. G.. Raphael, W. A.. Wall. (eds.). (2002). Predicting Species Occurrences: Issues of Accuracy and Scale. Washington, DC: Island Press.
Seo, C., Thorne, J. H., Hannah, L., and Thuiller, W. (2009). Scale effects in species distribution models: implications for conservation planning under climate change. Biol. Lett. 5, 39–43. doi: 10.1098/rsbl.2008.0476
Singer, A., Johst, K., Banitz, T., Fowler, M. S., Groeneveld, J., Gutiérrez, A. G., et al. (2016). Community dynamics under environmental change: how can next generation mechanistic models improve projections of species distributions? Ecol. Modell. 326, 63–74. doi: 10.1016/j.ecolmodel.2015.11.007
Team, R. (2013). R: A Language and Environment for Statistical Computing. Available online at: ftp://ftp.uvigo.es/CRAN/web/packages/dplR/vignettes/intro-dplR.pdf (accessed October 28, 2019).
Thuiller, W., Araújo, M. B., and Lavorel, S. (2003). Generalized models vs. classification tree analysis: Predicting spatial distributions of plant species at different scales. J. Veg. Sci. 14, 669–680. doi: 10.1111/j.1654-1103.2003.tb02199.x
Thuiller, W., Lafourcade, B., Engler, R., and Araújo, M. B. (2009). BIOMOD - a platform for ensemble forecasting of species distributions. Ecography 32, 369–373. doi: 10.1111/j.1600-0587.2008.05742.x
Tonkin, J. D., Bogan, M. T., Bonada, N., Rios-Touma, B., and Lytle, D. A. (2017). Seasonality and predictability shape temporal species diversity. Ecology 98, 1201–1216. doi: 10.1002/ecy.1761
UNESCO WORLD HERITAGE SITE (2014). Okavango Delta Ramsar Site is Now 1000th World Heritage Site. Ramsar. Available at: https://www.ramsar.org/news/okavango-delta-ramsar-site-is-now-1000th-world-heritage-site (accessed July 8, 2019).
Van Echelpoel, W., Boets, P., Landuyt, D., Gobeyn, S., Everaert, G., Bennetsen, E., et al. (2015). Species distribution models for sustainable ecosystem management. Dev. Environ. Model. 27, 115–134. doi: 10.1016/B978-0-444-63536-5.00008-9
Vaughan, I. P., and Ormerod, S. J. (2003). Improving the quality of distribution models for conservation by addressing shortcomings in the field collection of training data. Conserv. Biol. 17, 1601–1611. doi: 10.1111/j.1523-1739.2003.00359.x
Venables, W. N., and Ripley, B. D. (2002). Modern Applied Statistics with S. Fourth edition. New York, NY: Springer.
Verbruggen, H., Tyberghein, L., Belton, G. S., Mineur, F., Jueterbock, A., Hoarau, G., et al. (2013). Improving transferability of introduced species' distribution models: new tools to forecast the spread of a highly invasive seaweed. PLoS ONE 8:e68337. doi: 10.1371/journal.pone.0068337
Wan, J.-Z., Wang, C.-J., and Yu, F.-H. (2016). Impacts of the spatial scale of climate data on the modeled distribution probabilities of invasive tree species throughout the world. Ecol. Inform. 36, 42–49. doi: 10.1016/j.ecoinf.2016.10.001
Wang, T., Hamann, A., Spittlehouse, D., and Carroll, C. (2016). Locally downscaled and spatially customizable climate data for historical and future periods for North America. PLoS ONE 11:e0156720. doi: 10.1371/journal.pone.0156720
Weibull, A.-C., Östman, Ö., and Granqvist, Å. (2003). Species richness in agroecosystems: the effect of landscape, habitat and farm management. Biodivers. Conserv. 12, 1335–1355. doi: 10.1023/A:1023617117780
Yandell, B. S. (2017). Practical Data Analysis for Designed Experiments. 1st Edition. New York, NY: Routledge. 440. doi: 10.1201/9780203742563
Yates, K. L., Bouchet, P. J., Caley, M. J., Mengersen, K., Randin, C. F., Parnell, S., et al. (2018). Outstanding Challenges in the transferability of ecological models. Trends Ecol. Evol. 33, 790–802. doi: 10.1016/j.tree.2018.08.001
Zurell, D., Thuiller, W., Pagel, J., Cabral, J. S., Münkemüller, T., Gravel, D., et al. (2016). Benchmarking novel approaches for modelling species range dynamics. Glob. Chang. Biol. 22, 2651–2664. doi: 10.1111/gcb.13251
Keywords: Okavango river basin, stacked species distribution models, macroecological models, predictor spatial grain, species richness, variable importance, ecological niche models
Citation: Tshwene-Mauchaza B and Aguirre-Gutiérrez J (2019) Climatic Drivers of Plant Species Distributions Across Spatial Grains in Southern Africa Tropical Forests. Front. For. Glob. Change 2:69. doi: 10.3389/ffgc.2019.00069
Received: 01 July 2019; Accepted: 18 October 2019;
Published: 08 November 2019.
Edited by:
Edward T. A. Mitchard, University of Edinburgh, United KingdomReviewed by:
Tammo Reichgelt, University of Connecticut, United StatesDylan Craven, Major University, Chile
Copyright © 2019 Tshwene-Mauchaza and Aguirre-Gutiérrez. This is an open-access article distributed under the terms of the Creative Commons Attribution License (CC BY). The use, distribution or reproduction in other forums is permitted, provided the original author(s) and the copyright owner(s) are credited and that the original publication in this journal is cited, in accordance with accepted academic practice. No use, distribution or reproduction is permitted which does not comply with these terms.
*Correspondence: Boipelo Tshwene-Mauchaza, Ym9pcGVsby50c2h3ZW5lLW1hdWNoYXphQG91Y2Uub3guYWMudWs=