 Tobias Jackson1*
 Alexander Shenkin1
 Bavisha Kalyan2Jessica Zionts1
 Kim Calders3Niall Origo4,5
 Mathias Disney5,6Andrew Burt5
 Pasi Raumonen7
 Yadvinder Malhi1
- 1School of Geography and the Environment, Environmental Change Institute, University of Oxford, Oxford, United Kingdom
- 2Civil and Environmental Engineering, University of California, Berkeley, Berkeley, CA, United States
- 3CAVElab - Computational and Applied Vegetation Ecology, Ghent University, Ghent, Belgium
- 4Earth Observation, Climate and Optical Group, National Physical Laboratory, Teddington, United Kingdom
- 5Department of Geography, University College London, London, United Kingdom
- 6NERC National Centre for Earth Observation (NCEO), Leicester, United Kingdom
- 7Department of Electrical Engineering, Tampere University of Technology, Tampere, Finland
Wind damage is a significant driver of forest structure, ecology and carbon cycling in both temperate and tropical regions, but most of the literature on wind damage focusses on conifer plantations. Previous studies in broadleaf forests have been limited by a lack of data on tree architecture, a problem that is potentially overcome by terrestrial laser scanning (TLS). Here we apply novel approaches to estimate the critical wind speeds at which trees will break in a temperate, deciduous forest plot in Wytham Woods, UK, using a combination of field data and finite element analysis. Ash trees (Fraxinus excelsior) tend to have lower critical wind speeds than sycamores (Acer pseudoplatanus), while English oak (Quercus robur) are the most mechanically robust. This difference in critical wind speed (CWS) is driven by tree size and architecture, rather than material properties. We observe a trade-off between CWS and growth rate, both within and across species. Our estimates of critical wind speeds from field data are lower in summer than in winter, emphasizing the importance of the spring and autumn transition periods. Of the three species we studied, those with lower critical wind speeds drop their leaves earlier in autumn, suggesting that the timing of leaf shedding may be under selection pressure to minimize risk of tree damage from winter storms. These results are tentative, but also intriguing and intuitive.
Highlights
- We employ a novel laser scanning and finite element analysis approach to estimate critical wind speed for 397 trees, and to explore the influence of tree architecture.
- We find that critical wind speed is related to a number of key ecological variables such as tree species, size and growth rates.
- Tree architecture is described in detail and shown to be an important driver of wind damage risk.
- We find a tentative relationship between variation in the timing of leaf drop and critical wind speed. This suggests that a potential factor in timing of autumn leaf shedding is the reduction of damage risk from winter storms.
Introduction
Wind damage causes billions of euros of loss to the forestry sector (Schütz et al., 2006) and is a major focus of scientific attention. Previous work on forest wind damage risk has focused on relatively simple single-species, evenly-spaced plantation forests (Gardiner, 1995; Hale et al., 2015). However, wind damage is a major driver of the terrestrial carbon cycle in natural forests through its influence on the rates and patterns of tree mortality and branch loss. In the Amazon, wind damage rates have been estimated as 1.3 Pg carbon per year, compared to the 0.2 Pg carbon per year lost through logging in the 1990's (Espírito-Santo et al., 2014). Risk of wind damage is also a potentially limiting factor for maximum tree height and forest carbon storage, since trees sense their wind environment and respond with increased diameter growth (Niklas, 2007; King et al., 2009; Bonnesoeur et al., 2016; Coomes et al., 2018).
The critical wind speed (CWS) is a common measure of a tree's susceptibility to wind damage (Gardiner et al., 2000; Moore et al., 2018). CWS is defined here as the wind speed that would cause the tree to snap at 1.3m on the trunk. More generally, CWS estimates should take into account the risk of overturning (failure at the root soil boundary), but this requires extensive destructive tests, which have been carried out on some species of conifer but rarely broadleaf trees (Nicoll et al., 2006). However, mode of death surveys show that snapping and overturning occur at comparable rates across many forest types (Everham and Brokaw, 1996; Gale and Hall, 2001; Chao et al., 2009; de Toledo et al., 2012), suggesting that CWS estimates will be broadly unaffected by this simplification, except on sites with restricted rooting. In order to fully understand wind damage risk we would also need information on wind exposure, which is affected by tree-level effects such as sheltering, which are beyond the scope of this study.
When modeling critical wind speeds, natural broadleaf forests present a challenge because of their more variable and complex tree architecture and forest structure, compared to plantation forests. The links between a trees architecture and its response to wind forcing are poorly understood. There has been some important work on urban trees in the wind, which describes the effect of tree architecture, but usually only in a qualitative manner (Roodbaraky et al., 1994; Baker, 1997; Kane et al., 2014). Finite element modeling can overcome this difficulty by explicitly modeling the effect of the branches on tree sway. However, finite element analyses have mostly been limited to single tree studies due to the difficulty of accurately mapping the 3D architecture of trees (Moore and Maguire, 2008; Sellier and Fourcaud, 2009; Ciftci et al., 2013). This limitation is being overcome by recent advances in terrestrial laser scanning (TLS) and associated data processing techniques, which have the potential to give us access to large-numbers of accurately mapped 3D tree models (Calders et al., 2015; Raumonen et al., 2015; Åkerblom et al., 2017; Burt, 2017; Malhi et al., 2018). These 3D model trees can be used as the basis of a finite element analysis (Jackson et al., 2019).
In this paper, we present a novel exploration of CWS in the context of a natural mixed-species and mixed-age woodland. We first estimate CWSs from field measurements of tree strain in summer and winter for 13 trees, in order to explore the effect of leaves. Next, we conduct a finite element analysis for each tree in the 1ha plot, a total of 397 trees (Graphical abstract) for which TLS data are publicly available (Calders et al., 2018). We then use our model predictions of CWS to explore three questions about the ecological relevance of wind damage risk:
(1) What controls critical wind speed? We use generalized linear models to test the relative importance of tree size, shape and material properties as drivers of CWS.
(2) Is there a trade-off between growth rate and critical wind speed? Trees which grow tall quickly, driven by competition for light, necessarily invest less in diameter growth. As a result, are these slender trees most at risk from wind damage?
(3) Is there a relationship between critical wind speed and the timing of autumn leaf drop? It has been often observed in urban settings that more trees snap or uproot during early winter storms than in mid-winter (Wessolly and Erb, 2016). There are a number of mechanisms that drive leaf bud in spring, including the trade-off between maximizing growth while avoiding damage risk from late spring frosts (Vitasse et al., 2009a,b), but the factors driving the exact timing of leaf drop in autumn is less well understood and may be partly driven by a need to reduce risk of damage from early winter storms.
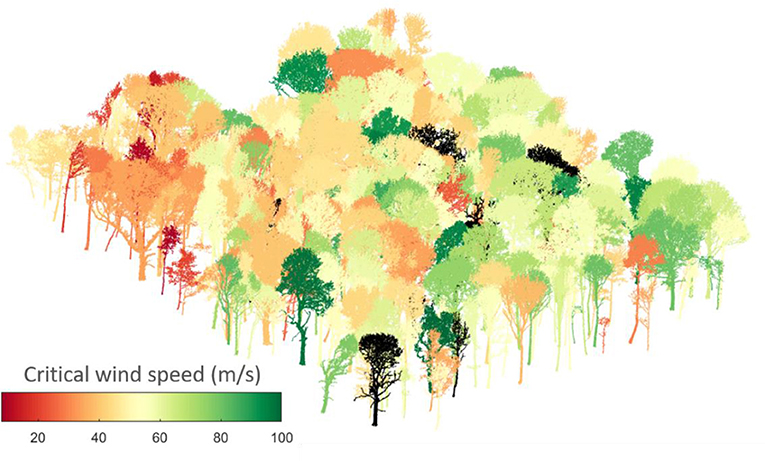
Graphical Abstract. Estimated critical wind speeds for 397 broadleaf trees.
Materials and Methods
Field Data and Critical Wind Speed Estimates
The field study was conducted in Wytham Woods, Oxford, a mature temperate woodland in southern England (51°46′27.2″N 1°20′20.1″W). The woodland contains ~950 trees per hectare and the dominant species are sycamore (Acer pseudoplatanus), ash (Fraxinus excelsior), birch (Betula spp.) and English oak (Quercus robur). Wytham Woods has long been a testbed for ecological experiments and numerous complementary data sets are available. Most important for this study are the 10 years of census data from the 18 ha plot (Butt, 2009) and a co-located TLS scan conducted in 2015–2016 (Calders et al., 2018). This TLS data set is of very high quality, since it was conducted in the absence of leaves and at high scanning resolution, using a Riegl VZ-400 and based on a 10 m grid with 0.04 degrees angular resolution (Wilkes et al., 2017).
We collected long-term field data on the wind speeds and strains (extensions/original length) produced in the trunks of 17 trees Wytham Woods, Oxford. We measured the bending strains in these trees at 4 Hz for a period of 8 months from October 2015 to June 2016. Strain was measured using the sensors and method developed by Blackburn (1997) and Moore et al. (2005); details are given in Jackson et al. (2019) and the data are available online. Local climate data are available from a meteorological station ~1 km away, just outside the forest, operated by the Center for Ecology and Hydrology (Figure SI-1). This station records mean hourly wind speed as well as the maximum 5 s mean within that hour (5 s maximum gust speed).
We used these data to estimate CWS for 17 trees. It is important to note that none of the monitored trees snapped during the experiment and, as in previous studies (Hale et al., 2012; Peltola et al., 2013), we rely on extrapolation from field data to estimate the critical wind speed. Our estimates should, therefore, be looked upon as a means to compare the vulnerability of different trees to wind damage, rather than a rigorous determination of CWS.
The wind-strain relationship follows a power law ε = av2, where ε is strain and v is wind speed (Hale et al., 2012). We separated the data into summer and winter sections, avoiding the transition period, and fitted a linear model to the strain against squared wind speed relationship. We used the fits to extrapolate up to the breaking strain, which was calculated from literature values on the strength of green wood (Figure SI-2) (Niklas and Spatz, 2010). This approach assumes that the wind-strain relation follows a similar relation for low wind speeds and high wind speeds. There are likely to be non-linear effects at high wind speeds associated with change in the aerodynamic drag factor and crown streamlining, but these are beyond the scope of the current study.
We investigated the relationship between growth rates and CWS using the repeat dbh measurements available at Wytham Woods. In order to test whether leaf phenology was related to critical wind speed, we estimated the leaf-on and leaf-off timings of the three main tree species in this study: ash, English oak and sycamore using data collected by the Woodland Trust's citizen science project “Nature's Calendar” over the last 10 years (Woodland Trust, 2014).
Model-Based Critical Wind Speed Predictions
Individual trees in the 1 ha plot were automatically extracted from the plot level point cloud and 3D cylinder models fitted to each of these (Åkerblom, 2017; Calders et al., 2018). The 3D model trees were then simplified by removing cylinders under 2 cm in diameter and combining neighboring cylinders to reduce the number of cylinders and increase their length to radius ratio. We then used the finite element method to estimate the CWS of 3D model trees from TLS data (Jackson et al., 2019). We exposed the model trees to an artificial wind forcing, consisting of a stepwise increasing wind speed (Figure 1), and extracted the strain at each wind speed. We then interpolated between these points to find the wind speed at which the strain on the basal cylinder (corresponding to the position of our strain gauges in the field) equaled the literature-reported breaking strain, this was designated as the CWS. If the breaking strain was not reached by the maximum wind speed of 100 ms−1 the CWS was not determined, we did not attempt to estimate CWS higher than 100 ms−1.
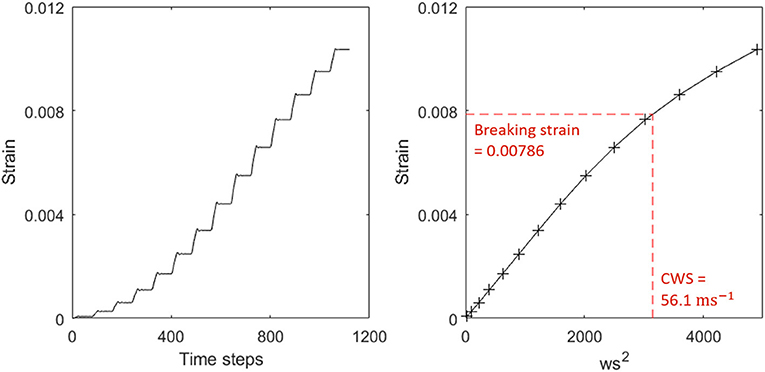
Figure 1. (Left) Raw strain output from simulation showing steps of increasing strain, corresponding to the stepwise wind ramp used to force each tree. (Right) Strain against squared wind speed. The red line indicates the breaking strain and the point at which it intersects the interpolation is the critical wind speed. No breakage condition was included in the finite element analysis, but values beyond the critical wind speed are unreliable and non-linear effects, presumably due to large deformation in the tree, are apparent.
Recent work has shown that such simplified treatment of wind forcing, considering only time periods longer than the tree sway, dominated the motion of four Pinus sylvestris trees in Germany (Schindler and Mohr, 2018). The 1 ha area we studied had a ground surface height range of 20 m and was surrounded by forest for at least 20 tree heights in all directions. The vertical wind profile applied in the model was fitted to wind speeds measured at 5, 10, and 15 m within the forest and the wind amplitude was defined at a resolution of 10 Hz. The TLS scan mapped 557 trees in this 1 ha area (Calders et al., 2018). We filtered out trees under 5 m tall, species with under five individuals, those whose CWS was not reached by 100 ms−1, and those for which the simulations did not converge, giving 397 trees in total (330 sycamore, 44 ash and 23 oak trees).
Importantly, each tree was simulated individually so stand level effects such as sheltering were not included. However, trees are likely to respond to their local wind environment through changes in growth patterns (Bonnesoeur et al., 2016). These will be captured by the TLS data and so included in the finite element analysis. To test the significance of this neighborhood effect, we calculated a competition index for each tree by finding all trees within a 10 m radius and taking the sum of their diameters divided by their distance from the focal tree (Hale et al., 2012). We used this competition index as a crude test of whether residual variation is explained by the trees immediate surroundings. In order to test the influence of material properties on CWS, we first applied identical material properties, those of a sycamore tree, to all our model trees. Secondly, we applied the species-specific material properties to the oak and ash trees (Niklas and Spatz, 2010). We assumed isotropic material properties throughout the tree due to a lack of data on wood material properties, although wood is in fact a highly complex material (Mackerle, 2005).
Tree Architecture
Previous studies have found that the dynamics of trees in the wind are determined mostly by tree architecture, rather than material properties (Sellier and Fourcaud, 2009; James et al., 2014). In order to test whether architecture drives CWS we extracted architectural measures from the cylinder models. The architectural measures we used were:
• Sail area—The total area of the cylinders (branches) projected into the x-y plane, i.e., the 2D area upon which wind drag is incident.
• Crown volume ratio (CVR)—the ratio of whole tree volume to crown volume.
• Crown asymmetry—the ratio of mean to maximum woody volume contained in each segment of crown. These segments are defined by splitting the crown into eight “pizza-like” slices, centered on the stem.
Generalized Linear Model Selection
In order to test what drives CWS, we used the fitglm function in matlab (Mathworks, 2017) to fit generalized linear models of the form CWS~Height*dbh+Species+Architecture. Prior to model fitting, all variables were centered and scaled to a standard deviation of 1. Sail Area and CVR were log transformed. We selected models with highest coefficient of determination (R2) and lowest Akaike's information criterion (AIC). The results of these model fits are summarized in Table 1 and further information is given in Figure SI-4.
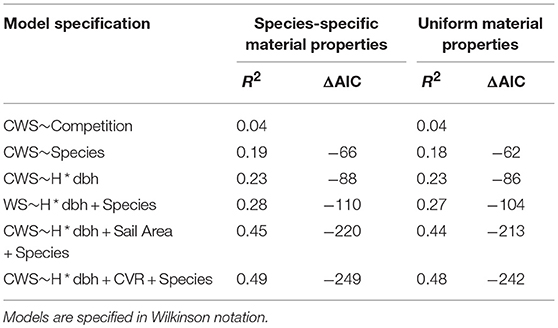
Table 1. Generalized linear model results showing the key drivers of simulated critical wind speeds.
Results
The Effect of Leaves on Critical Wind Speed
We first review the CWS estimates from our field data in summer and winter. Our hourly CWS estimates from field data range from 28 to 56 ms−1 in winter and 23–53 ms−1 in summer (Figure 2). On average, each tree's CWS decreased by 9% in summer. The fact that CWS estimates were generally lower in summer means that trees are at a higher risk of breaking for a given wind speed when in full leaf. This is presumably due to the additional drag from the leaves transmitting a higher force to the trunk. However, the role of leaves in wind damage is complex, since they also lower the tree's fundamental frequency and alter the wind regime. The likelihood of strong winds is much higher in winter than in summer, demonstrating CWS is not an absolute measure of damage risk. However, this difference between summer and winter suggests that the transition periods are likely to be significant, we discuss this further in section Is There a Relationship Between Critical Wind Speed and the Timing of Autumn Leafdrop?
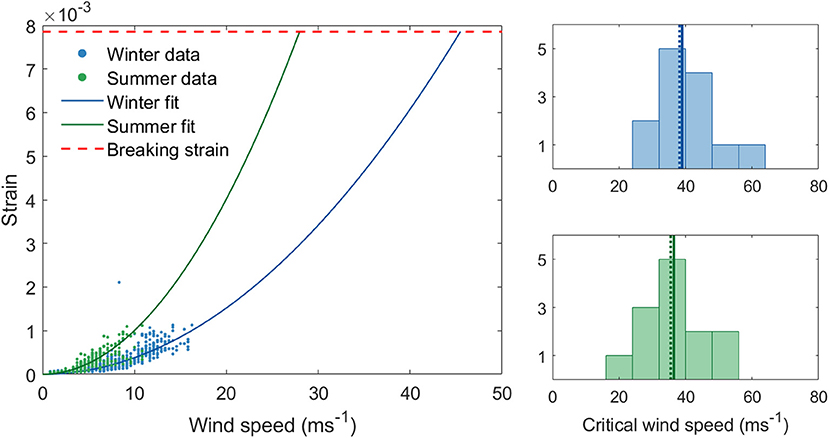
Figure 2. (Left) Critical wind speed estimates for a single tree from field data in summer and winter using maximum hourly wind speeds. (Right) Histograms of CWS estimates from field data in winter (above) and in summer (below). The solid line through the histograms represent the mean and the dotted line the median.
Jackson et al. (2019) showed that finite element analysis predicts the field estimated CWS with R2 = 0.40 and concordance correlation coefficient (CCC) of 0.66, for 17 trees in Wytham Woods. At lower wind speeds the model predicts the strains produced in the tree more accurately (R2 = 0.81, CCC = 0.91 at 5 ms−1, and R2 = 0.79, CCC = 0.89 at 15 ms−1 wind speed). It is in the high wind speed regime (i.e., the part where we do not have field data and are extrapolating) that the model and field predictions diverge. The model tends to estimate a higher CWS than the extrapolations from field data. Importantly, the modeled wind speed is a steadily increasing wind ramp applied at the position of the tree, whereas the field data wind speeds were measured ~1 km away and the extrapolation relates hourly wind speeds to hourly strain values. Also, the geographical separation of the two groups of trees used for validation is much larger (~350 m) than the total size of the 1 ha plot. The fact that, despite these significant differences, a similar pattern of CWSs was estimated from both field data and finite element analysis shows that the two methods are comparable.
What Drives Critical Wind Speed?
The three species in our plot had significantly different CWSs (Student's t-test, p < 0.001), with oak having the lowest risk of wind damage and ash the highest risk, for a given wind regime (Figure 3). This difference was evident in both the constant material properties simulations (oak CWS = 72 ± 20 ms−1, sycamore CWS = 50 ± 15 ms−1, ash CWS = 35 ± 19 ms−1, where the values given are mean ± standard deviation) and in the species-specific material properties simulations (oak CWS = 72 ± 20 ms−1, sycamore CWS = 50 ± 15 ms−1, ash CWS = 37 ± 19 ms−1). This suggests that it is the size and shape of the different species that drive differences in critical wind speed, rather than their wood properties.
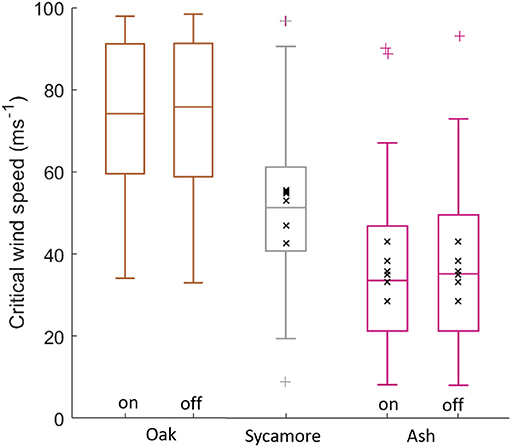
Figure 3. Simulated critical wind speeds for the three species in our 1 ha plot, “on” signifies species-specific material properties, “off” signifies uniform material properties across all species. The coloured '+' symbols represent outliers. The black “x” markers are field data overlaid for sycamore and ash trees. CWS estimates above 100 ms−1 were excluded.
Figure 4 clearly shows that the different species in our plot occupy different height ranges for a given dbh: oak trees tended to have a large dbh for their height, whereas ash trees tend to be tall and slender. This range reflects both the growth form of that species and the age of the trees in this plot. There is also a range of heights for a given dbh within each species, most clearly in the sycamores that dominate this plot. More slender trees tend to have a higher risk of wind damage and are concentrated on the upper edge of this height to dbh relationship.
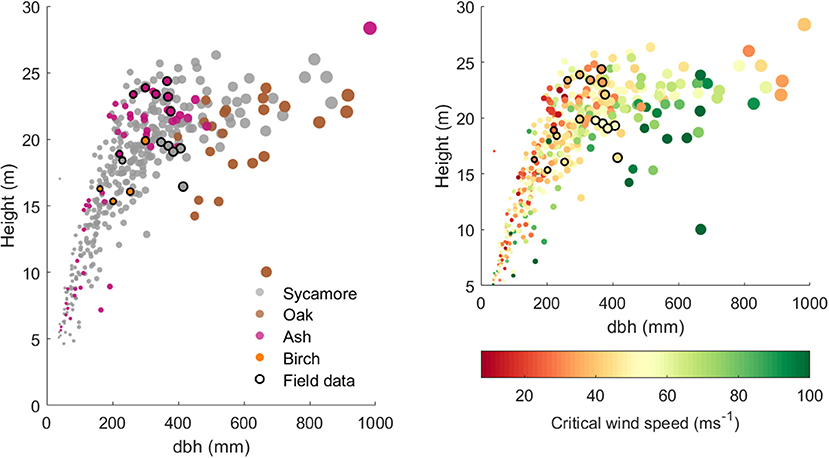
Figure 4. (Left) Tree height against dbh for 397 model trees from the 1 ha plot and the 17 trees for which we have field data. The points are scaled by dbh and colored by species. (Right) Tree height against dbh for the same trees, but colored by simulated CWS (with species-specific material properties).
The results for species-specific material properties and uniform material properties simulations were similar (Table 1), we discuss the former. We found that the competition index accounted for only 4% of the variation in CWS. Tree size, modeled as the interaction of height and dbh, and species accounted for 23 and 19% of the variation in CWS, respectively. However, when combined the prediction accuracy increased only slightly, showing that tree size and species explain much of the same variation, as expected from Figure 4. The addition of architectural measures significantly increased the model accuracy. The most significant architectural measure was the CVR, which describes the size of the crown relative to the stem, but sail area also increased the prediction accuracy significantly. Crown asymmetry was not strongly correlated with CWS. As in the case of species and tree size, the architectural measures tended to covary (Figure SI-5). See Figure SI-4 for estimates of effect size for each continuous variable. Overall, this shows that measures of tree architecture, in addition to the commonly measured tree height and dbh, are needed to accurately predict CWS in natural forests.
Is There a Trade-Off Between Growth Rate and Critical Wind Speed?
Figure 5 shows that faster growing trees tended to have a higher risk of wind damage, for a given wind regime. Ash trees are the fastest growing in our sample and had the lowest CWSs, whereas the slow growing oaks had a larger mechanical safety margin. The sycamore trees occupied the middle ground, and are the most abundant species in this plot. Interestingly, plotting only the larger trees (dbh>40 cm, Figure 5B) shows a clearer relationship between growth rate and CWS. This suggests that it is not tree size which is driving this relationship. However, the growth rate data relies on repeat dbh measurements and so only reflects radial growth. We therefore cannot determine whether a high growth rate is the cause or the effect of low critical wind speed.
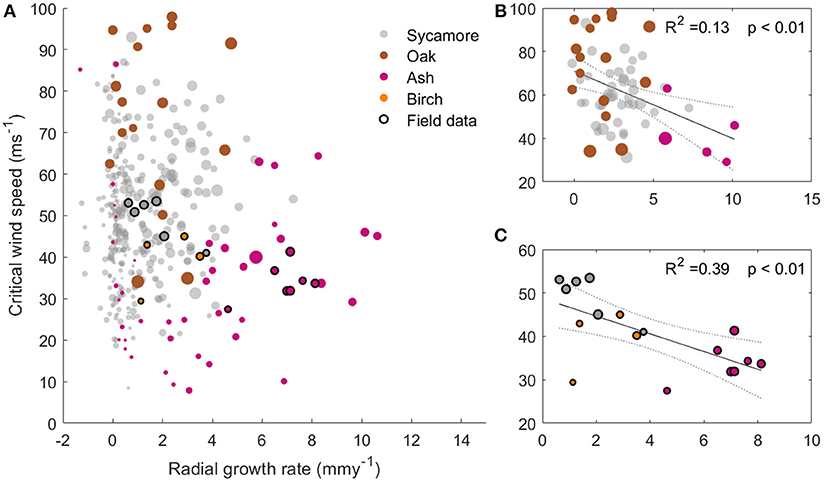
Figure 5. (A) Critical wind speed against radial growth rate for the 397 trees modeled in the 1 ha plot with the trees measured in the field overlaid. The marker size represents the tree dbh. (B) subset of (A), with modeled trees over 40 cm dbh only and a best fit line overlaid. (C) Subset of (A), with field data trees only and a best fit line overlaid. All plots have the same axes.
Is There a Relationship Between Critical Wind Speed and the Timing of Autumn Leaf Drop?
We found that the leaf-on and leaf-off timings of our three species differ consistently (Woodland Trust, 2014). Figure 6 overlays these timings onto a graph of the wind regime in Wytham Woods (defined as the maximum wind speeds for the last 10 years). In autumn, the order of leaf senescence between the three species reflected that of decreasing wind damage risk—as calculated both from both field and modeling work. Ash trees, the most at risk of wind damage for a given wind regime, drop their leaves first and so expose themselves to lower risk from early winter storms. Of the three species we measured, oak trees, the least at risk of wind damage, consistently drop their leaves last. The same ordering does not occur in spring, when other factors are known to drive the timing of bud burst (Vitasse et al., 2009a,b).
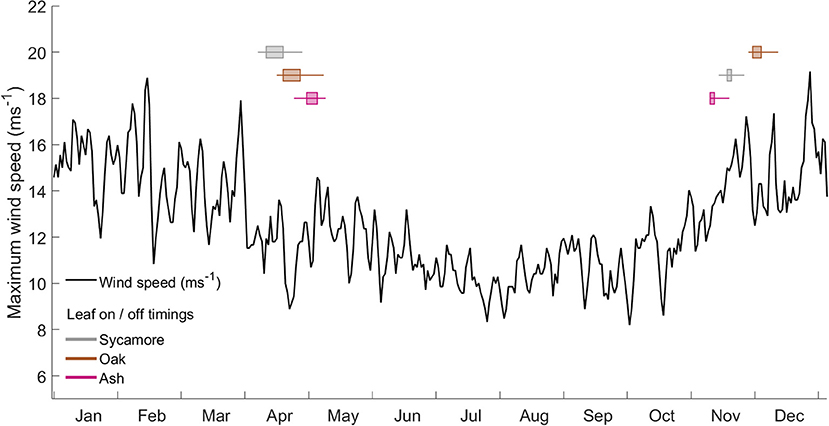
Figure 6. Wind regime, calculated as the maximum occurring wind speed in each hour from 2008 to 2017 at the ECN weather station at Wytham Woods. Overlaid box and whisker plots represent leaf-in/leaf-out timings for the same period.
Discussion
We present a plot-scale estimate of CWS in a natural forest. This study demonstrates the potential of TLS data to bring new insights into forest ecology by accurately mapping tree architecture and allowing us to question how tree form affects function. Understanding the relationship between CWS and other ecological processes is essential in predicting how forest ecosystems will respond to climate change.
Limitations
Since no field study has measured a tree breaking in the wind, estimating CWS necessarily involves extrapolation beyond the range of field data (Hale et al., 2012; Moore et al., 2018). In the 8 months of data collection the maximum recorded wind speed was 15 ms−1. Within this range of wind speeds, we found that the wind-strain relationship follows the square law predicted by theory, but were unable to test if non-linear effects are significant beyond this range. Finite element predictions of CWS are also uncertain, but follow a similar trend to those from field data. We therefore use finite element analysis to scale-up to the plot level. We do not intend our CWS estimates as predictions for management purposes, but rather as a useful measure with which to compare relative wind risk between trees and to gain ecological insight into the role of wind damage risk as a driver of ecosystem structure.
One source of uncertainty in the finite element prediction of CWS is the treatment of material properties. We use uniform material properties throughout each tree and across all trees of the same species (Table SI-2). In reality, material properties vary within individual trees, within species and also between species (Lavers, 1983; Niklas and Spatz, 2010). A sensitivity analysis showed that the most important material property driving the variation in response to wind forcing is green wood elasticity (Table SI-2). The inter-specific variation in elasticity is 25% for the four species in this study, and the intra-specific variation in elasticity is lower than 20%. Changing the model elasticity by this amount caused a 12% change in CWS (Table SI-2), compared to the two-fold variation in CWS for trees of similar sizes evident in Figure 4. In line with previous studies, our sensitivity analysis shows that architecture is a stronger driver of tree response to wind than material properties (Sellier and Fourcaud, 2009; Kane et al., 2014).
Another important limitation of this study is that local wind sheltering effects are not accounted for. The effect of sheltering between trees cannot be explored without intensive wind speed measurements at multiple locations within a forest plot. In this study all trees were forced with an identical wind forcing (Table SI-3). In reality trees growing close to large neighboring trees may be sheltered from the full force of the wind (Hale et al., 2012; MacFarlane and Kane, 2017). Finally, we assume that cylinder reconstructions from TLS data accurately represents tree architecture, but we do not validate this. A number of studies have used these 3D cylinder model trees under the same assumption and found that they can predict tree biomass, and even differentiate between different species (Calders et al., 2015; Åkerblom et al., 2017; Disney et al., 2018). A direct validation of TLS derived tree architecture using field data would be very useful, but highly time-consuming.
Seasonality
The interaction between wind damage risk and the presence or absence of leaves is complex, since leaves alter the wind regime as well as the trees response to wind forcing (Roodbaraky et al., 1994; Finnigan, 2000). Our field data predicted lower CWS in summer than in winter, meaning that trees were at a higher risk from the same wind speed in summer. This is not a measure of absolute risk, and Figure 6 clearly shows that wind speeds are generally much lower in summer, but it does emphasize the importance of transition periods when trees are either growing or losing their leaves. In these transition periods, early or late winter storms can bring strong winds and, if a tree still has increased sail area due to leaves, it may be at a higher risk of damage. To add to this effect, if the surrounding trees have lost their leaves, wind will more easily penetrate into the canopy and the total drag force will be higher (Dolman, 1986).
The three species in our plot display distinct leaf phenology, particularly in autumn (Woodland Trust, 2014). The timing with which they drop their leaves reflects their predicted critical wind speeds, with the ash trees being the most at risk and dropping their leaves first, while the oaks keep their leaves the longest. As would be expected, this order does not hold in spring when other factors (e.g., avoidance of frost risk) determine leaf out timing (Vitasse et al., 2009a,b). As we have only studied three species our conclusion is highly tentative, but our findings provide a novel strand of evidence that the timing of leaf drop in autumn may be a trade-off between decreasing marginal returns on photosynthesis and increasing risk of wind damage from winter storms. These findings need to be further explored with other tree species and in other forests. This hypothesis could be tested at scale by analyzing remotely sensed leaf phenology in combination with wind field data.
Drivers of CWS
Tree size and architecture were the main drivers of CWS in this study. Specifically, CVR was positively correlated with CWS while total sail area was negatively correlated with CWS (Figure SI-4). We saw clear differences in CWS between species, but also a wide range within each species (Figure 3). This was partly driven by tree slenderness, the thinner ash trees having a lower critical wind speeds than the wide oaks (Figure 4). Trees with a higher radial growth rates tended to have lower critical wind speeds. However, repeat dbh measurements alone cannot disentangle the cause from the effect in this process, since height growth and dbh growth are confounded. A high radial growth rate may indicate fast height growth, leading to low critical wind speed. On the other hand, trees with a high risk of damage will tend to increase their radial growth rate (Bonnesoeur et al., 2016), giving the same pattern. This interplay demonstrates the balance between competition for light and risk of damage from wind storms that trees must maintain to endure wind storms and survive within a forest ecosystem.
Data Availability
The field data are available online (https://doi.org/10.5285/533d87d3-48c1-4c6e-9f2f-fda273ab45bc) along with the software developed to convert 3D tree models to Abaqus input files (https://github.com/TobyDJackson/WindAndTrees_FEM). The TLS data are available online (Calders et al., 2018), as is the software used to create cylinder models from raw TLS data (Åkerblom, 2017). Summary data used for statistical analysis are available on request to the corresponding author.
Author Contributions
TJ, AS, and YM conceived the idea. TJ and JZ conducted the field work. TJ, JZ, and BK carried out the data analysis. KC, NO, MD, AB, and PR provided the terrestrial laser scanning data and accompanying software. All authors contributed to the manuscript and gave their final permission for publication.
Funding
This research was supported by a NERC studentship to TJ (NE/L0021612/1). AS and YM are supported by NERC grant NE/P012337/1 (to YM) and YM is also supported by the Frank Jackson Foundation. The TLS data collection was funded through the Metrology for Earth Observation and Climate project (MetEOC-2), grant number ENV55 within the European Metrology Research Program (EMRP). The EMRP is jointly funded by the EMRP participating countries within EURAMET and the European Union.
Conflict of Interest Statement
The authors declare that the research was conducted in the absence of any commercial or financial relationships that could be construed as a potential conflict of interest.
Acknowledgments
We'd like to thank Axel Wellpott for his expert help in setting up the strain gauge experiment. We also thank the two reviewers for their helpful comments.
Supplementary Material
The Supplementary Material for this article can be found online at: https://www.frontiersin.org/articles/10.3389/ffgc.2018.00013/full#supplementary-material
References
Åkerblom, M., Raumonen, P., Mäkipää, R., and Kaasalainen, M. (2017). Automatic tree species recognition with quantitative structure models. Remote Sens. Environ. 191, 1–12. doi: 10.1016/j.rse.2016.12.002
Baker, C. J. (1997). Measurements of the natural frequencies of trees. J. Exp. Bot. 48, 1125–1132. doi: 10.1093/jxb/48.5.1125
Blackburn, G. (1997). The Growth and Mechanical Response of Trees to Wind Loading. Available online at: http://ethos.bl.uk/OrderDetails.do?uin=uk.bl.ethos.506075 (Accessed October 1, 2018).
Bonnesoeur, V., Constant, T., Moulia, B., and Fournier, M. (2016). Forest trees filter chronic wind-signals to acclimate to high winds. New Phytol. 210, 850–860. doi: 10.1111/nph.13836
Burt, A. P. (2017). New 3D Measurements of Forest Structure. Available online at: http://discovery.ucl.ac.uk/1575534/
Butt, N. (2009). Initial Results from Establishment of a Long-term Broadleaf Monitoring Plot. Oxford: Wytham Woods, 1–86. Available online at:https://www.researchgate.net/profile/Yadvinder_Malhi/publication/228502778_Initial_Results_from_Establishment_of_a_Long-term_Broadleaf_Monitoring_Plot_at_Wytham_Woods_Oxford_UK/links/0fcfd5091b41e90925000000.pdf
Calders, K., Newnham, G., Burt, A., Murphy, S., Raumonen, P., Herold, M., et al. (2015). Nondestructive estimates of above-ground biomass using terrestrial laser scanning. Methods Ecol. Evol. 6, 198–208. doi: 10.1111/2041-210X.12301
Calders, K., Origo, N., Burt, A., Disney, M., Nightingale, J., Raumonen, P., et al. (2018). Realistic forest stand reconstruction from terrestrial LiDAR for radiative transfer modelling. Remote Sens. 10,933. doi: 10.3390/rs10060933
Chao, K. J., Phillips, O. L., Monteagudo, A., Torres-Lezama, A., and Vásquez Martínez, R. (2009). How do trees die? Mode of death in northern Amazonia. J. Veg. Sci. 20, 260–268. doi: 10.1111/j.1654-1103.2009.05755.x
Ciftci, C., Brena, S. F., Kane, B., and Arwade, S. R. (2013). The effect of crown architecture on dynamic amplification factor of an open-grown sugar maple (Acer saccharum L.). Trees Struct. Funct. 27, 1175–1189. doi: 10.1007/s00468-013-0867-z
Coomes, D. A., Šafka, D., Shepherd, J., Dalponte, M., and Holdaway, R. (2018). Airborne laser scanning of natural forests in New Zealand reveals the influences of wind on forest carbon. For. Ecosyst. 5,10. doi: 10.1186/s40663-017-0119-6
de Toledo, J. J., Magnusson, W. E., Castilho, C. V., and Nascimento, H. E. M. (2012). Tree mode of death in central Amazonia: effects of soil and topography on tree mortality associated with storm disturbances. For. Ecol. Manage. 263, 253–261. doi: 10.1016/j.foreco.2011.09.017
Disney, M. I., Boni Vicari, M., Burt, A., Calders, K., Lewis, S. L., Raumonen, P., et al. (2018). Weighing trees with lasers: advances, challenges and opportunities. Interface Focus 8,20170048. doi: 10.1098/rsfs.2017.0048
Dolman, A. J. (1986). Estimates of roughness length and zero plane displacement for a foliated and non-foliated oak canopy. Agric. For. Meteorol. 36, 241–248. doi: 10.1016/0168-1923(86)90038-9
Espírito-Santo, F. D. B., Gloor, M., Keller, M., Malhi, Y., Saatchi, S., Nelson, B., et al. (2014). Size and frequency of natural forest disturbances and the Amazon forest carbon balance. Nat. Commun. 5:3434. doi: 10.1038/ncomms4434
Everham, E. M., and Brokaw, N. V. L. (1996). Forest damage and recovery from catastrophic wind. Bot. Rev. 62, 113–185. doi: 10.1007/BF02857920
Finnigan, J. (2000). Turbulence in plant canopies. Annu. Rev. Fluid Mech. 32, 519–571. doi: 10.1146/annurev.fluid.32.1.519
Gale, N., and Hall, P. (2001). Factors determining the modes of tree death in three Bornean rain forests. J. Veg. Sci. 12, 337–346. doi: 10.2307/3236847
Gardiner, B., Peltola, H., and Kellomäki, S. (2000). Comparison of two models for predicting the critical wind speeds required to damage coniferous trees. Ecol. Modell. 129, 1–23. doi: 10.1016/S0304-3800(00)00220-9
Gardiner, B. A. (1995). “The interactions of wind and tree movement in forest canopies,” in Wind and Trees, eds P. M. Coutts and J. Grace (Cambridge and Berlin: Cambridge University Press), 41–59.
Hale, S. A., Gardiner, B., Peace, A., Nicoll, B., Taylor, P., and Pizzirani, S. (2015). Comparison and validation of three versions of a forest wind risk model. Environ. Model. Softw. 68, 27–41. doi: 10.1016/j.envsoft.2015.01.016
Hale, S. E., Gardiner, B. A., Wellpott, A., Nicoll, B. C., and Achim, A. (2012). Wind loading of trees: influence of tree size and competition. Eur. J. For. Res. 131, 203–217. doi: 10.1007/s10342-010-0448-2
Jackson, T., Shenkin, A., Wellpott, A., Calders, K., Origo, N., Disney, M., et al. (2019). Finite element models of trees in the wind based on terrestrial laser scanning data. Agric. For. Meteorol. doi: 10.1016/j.agrformet.2018.11.014
James, K. R., Dahle, G. A., Grabosky, J., Kane, B., and Detter, A. (2014). Tree biomechanics literature review: dynamics. Arboric. Urban For. 40, 1–15. doi: 10.13140/RG.2.1.1089.1765
Kane, B., Modarres-Sadeghi, Y., James, K. R., and Reiland, M. (2014). Effects of crown structure on the sway characteristics of large decurrent trees. Trees Struct. Funct. 28, 151–159. doi: 10.1007/s00468-013-0938-1
King, D. A., Davies, S. J., Tan, S., and Nur Supardi, M. N. (2009). Trees approach gravitational limits to height in tall lowland forests of Malaysia. Funct. Ecol. 23, 284–291. doi: 10.1111/j.1365-2435.2008.01514.x
MacFarlane, D. W., and Kane, B. (2017). Neighbour effects on tree architecture: functional trade-offs balancing crown competitiveness with wind resistance. Funct. Ecol. 31, 1624–1636. doi: 10.1111/1365-2435.12865
Mackerle, J. (2005). Finite element analyses in wood research: a bibliography. Wood Sci. Technol. 39, 579–600. doi: 10.1007/s00226-005-0026-9
Malhi, Y., Jackson, T., Patrick Bentley, L., Lau, A., Shenkin, A., Herold, M., et al. (2018). New perspectives on the ecology of tree structure and tree communities through terrestrial laser scanning. Interface Focus 8,20170052. doi: 10.1098/rsfs.2017.0052
Moore, J., Gardiner, B., and Sellier, D. (2018). “Tree mechanics and wind loading,” in Plant Biomechanics, eds Geitmann A. and Gril J. (Cham: Springer International Publishing), 79–106.
Moore, J. R., Gardiner, B. A., Blackburn, G. R. A., Brickman, A., and Maguire, D. A. (2005). An inexpensive instrument to measure the dynamic response of standing trees to wind loading. Agric. For. Meteorol. 132, 78–83. doi: 10.1016/j.agrformet.2005.07.007
Moore, J. R., and Maguire, D. A. (2008). Simulating the dynamic behavior of Douglas-fir trees under applied loads by the finite element method. Tree Physiol. 28, 75–83. doi: 10.1093/treephys/28.1.75
Nicoll, B. C., Gardiner, B. A., Rayner, B., and Peace, A. J. (2006). Anchorage of coniferous trees in relation to species, soil type, and rooting depth. Can. J. For. Res. 36, 1871–1883. doi: 10.1139/x06-072
Niklas, K. J. (2007). Maximum plant height and the biophysical factors that limit it. Tree Physiol. 27, 433–440. doi: 10.1093/treephys/27.3.433
Niklas, K. J., and Spatz, H. C. (2010). Worldwide correlations of mechanical properties and green wood density. Am. J. Bot. 97, 1587–1594. doi: 10.3732/ajb.1000150
Peltola, H., Gardiner, B. A., and Nicoll, C. B. (2013). “Mechanics of wind damage,” in Living with Storm Damage to Forests, eds B. Gardiner, A. Schuck, M-J Schelhaas, C. Orazio, K. Blennow and B. Nicoll (Joensuu: European Forest Institute), 31–38.
Raumonen, P., Casella, E., Calders, K., Murphy, S., Åkerbloma, M., and Kaasalainen, M. (2015). Massive-scale tree modelling from TLS data. ISPRS Ann. Photogramm. Remote Sens. Spat. Inf. Sci. II-3/W4, 189–196. doi: 10.5194/isprsannals-II-3-W4-189-2015
Roodbaraky, H. J., Baker, C. J., Dawson, A. R., and Wright, C. J. (1994). Experimental observations of the aerodynamic characteristics of urban trees. J. Wind Eng. Ind. Aerodyn. 52, 171–184. doi: 10.1016/0167-6105(94)90046-9
Schindler, D., and Mohr, M. (2018). Non-oscillatory response to wind loading dominates movement of Scots pine trees. Agric. For. Meteorol. 250–251, 209–216. doi: 10.1016/j.agrformet.2017.12.258
Schütz, J. P., Götz, M., Schmid, W., and Mandallaz, D. (2006). Vulnerability of spruce (Picea abies) and beech (Fagus sylvatica) forest stands to storms and consequences for silviculture. Eur. J. For. Res. 125, 291–302. doi: 10.1007/s10342-006-0111-0
Sellier, D., and Fourcaud, T. (2009). Crown structure and wood properties:Influence on tree sway and response to high winds. Am. J. Bot. 96, 885–896. doi: 10.3732/ajb.0800226
Vitasse, Y., Delzon, S., Dufrêne, E., Pontailler, J.-Y., Louvet, J.-M., Kremer, A., et al. (2009a). Leaf phenology sensitivity to temperature in European trees: do within-species populations exhibit similar responses? Agric. For. Meteorol. 149, 735–744. doi: 10.1016/j.agrformet.2008.10.019
Vitasse, Y., Porté, A. J., Kremer, A., Michalet, R., and Delzon, S. (2009b). Responses of canopy duration to temperature changes in four temperate tree species: relative contributions of spring and autumn leaf phenology. Oecologia 161, 187–198. doi: 10.1007/s00442-009-1363-4
Wilkes, P., Lau, A., Disney, M., Calders, K., Burt, A., Gonzalez de Tanago, J., et al. (2017). Data acquisition considerations for terrestrial laser scanning of forest plots. Remote Sens. Environ. 196, 140–153. doi: 10.1016/j.rse.2017.04.030
Woodland Trust (2014). Nature's Calendar. Available online at: https://naturescalendar.woodlandtrust.org.uk/
Keywords: biomechanics, critical wind speed, wind damage, terrestrial laser scanning, TLS, phenology, deciduous forest
Citation: Jackson T, Shenkin A, Kalyan B, Zionts J, Calders K, Origo N, Disney M, Burt A, Raumonen P and Malhi Y (2019) A New Architectural Perspective on Wind Damage in a Natural Forest. Front. For. Glob. Change 1:13. doi: 10.3389/ffgc.2018.00013
Received: 03 August 2018; Accepted: 11 December 2018;
Published: 07 January 2019.
Edited by:
Barry Alan Gardiner, European Forest Institute, FinlandCopyright © 2019 Jackson, Shenkin, Kalyan, Zionts, Calders, Origo, Disney, Burt, Raumonen and Malhi. This is an open-access article distributed under the terms of the Creative Commons Attribution License (CC BY). The use, distribution or reproduction in other forums is permitted, provided the original author(s) and the copyright owner(s) are credited and that the original publication in this journal is cited, in accordance with accepted academic practice. No use, distribution or reproduction is permitted which does not comply with these terms.
*Correspondence: Tobias Jackson, dG9ieWRqYWNrc29uQGdtYWlsLmNvbQ==