
95% of researchers rate our articles as excellent or good
Learn more about the work of our research integrity team to safeguard the quality of each article we publish.
Find out more
BRIEF RESEARCH REPORT article
Front. Fish Sci. , 19 March 2025
Sec. Fish Biodiversity and Conservation
Volume 3 - 2025 | https://doi.org/10.3389/frish.2025.1547935
 Meaghan L. Rourke1,2*
 Matt K. Broadhurst3,4
 Ashley M. Fowler5
 Julian M. Hughes5
 Joseph D. DiBattista6,7
 Stefan Sawynok8
 Elise M. Furlan9
Monitoring long-term spatiotemporal changes in populations of vulnerable species requires non-lethal methods. Here we investigate the utility of environmental DNA (eDNA) for estimating the relative biomass and abundance of the globally Endangered mulloway (Argyrosomus japonicus) in a southeastern Australian estuary. During minimal tidal movement, 10 parallel transects at each of 12 sites were surveyed, involving water samples being collected for determining eDNA concentrations of mulloway DNA prior to hydroacoustics being used to estimate their abundance and then biomass. There was no significant linear relationship between eDNA and abundance but there was for biomass, although the direction of differences varied seasonally, with positive and negative regressions observed during autumn and spring, respectively. As non-invasive survey methods, both eDNA and hydroacoustics require further validation, and such efforts should assess the influence of key environmental factors.
Mulloway (Argyrosomus japonicus) occur throughout the Indo-West Pacific and have historically formed the basis of several artisanal, commercial and recreational fisheries off South Africa, India, Pakistan, China, Korea, Japan, and Australia (1–5). In Australia, the species is regionally distributed across estuaries and nearshore areas south from North West Cape in Western Australia to southern Queensland, with the greatest concentration in the southeast, off the state of New South Wales [NSW; (2, 3); Figure 1].
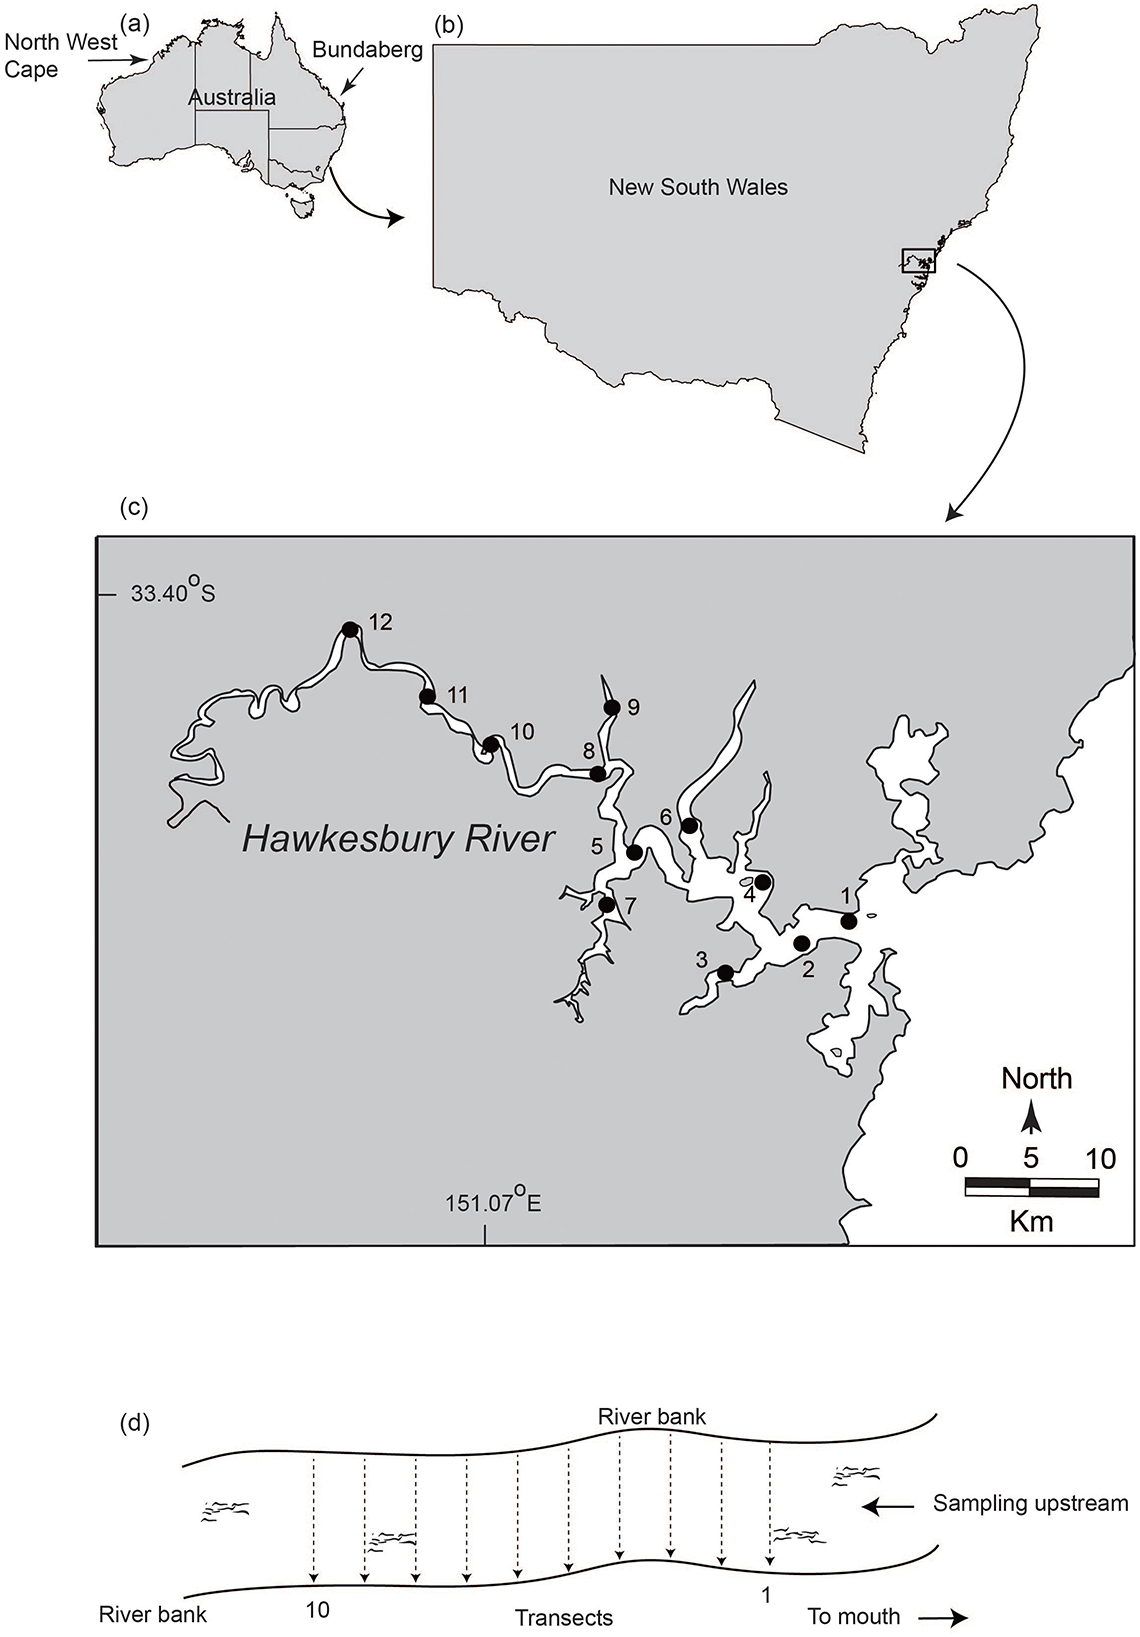
Figure 1. Maps of (A) Australia and (B) New South Wales showing the hydroacoustic and eDNA sampling sites for mulloway (Argyrosomus japonicus) in the (C) Hawkesbury River, and (D) diagrammatic representation of hydroacoustic and eDNA transects at one of the sites with the direction of sampling indicated by arrows. Hydroacoustic scans and eDNA sampling were conducted simultaneously along 10 transects beginning at the downstream end of a site and moving upstream. All sites were sampled twice: once in autumn 2022 and once in spring 2022.
Mulloway spawn across nearshore areas during late summer, after which larvae move into estuaries, grow to ~50 cm total length (TL) within two years (maximum of ~200 cm TL over 42 years), and attain mean sizes at maturity of 51 and 68 cm TL for males and females, respectively (2, 3). Mulloway are very vulnerable to most inshore fishing methods, including trawls, baited hooks, gillnets, seines, and even traps. Off NSW, their population is considered depleted to ~13% of the unfished biomass, which is reflected in commercial catches (mostly from gillnets and ~50 t p.a.) being ~85% lower than historical highs (6). Recreational harvests remain considerably greater (~90 t), but have also historically declined (6). Similarly, off South Africa and Vietnam, spawning biomasses have declined to ~1 and 30% of unfished levels, respectively, while in other jurisdictions such as China, once-abundant mulloway are now rarely caught (7). Based on the available evidence in 2018, mulloway were globally listed as Endangered on the IUCN Red list (7).
Mulloway populations have been prioritized for recovery plans in Australia and South Africa involving legislated size and catch limits (7) and, for NSW, restocking (8), along with modifications to problematic gears (mostly penaeid trawlers) to limit unaccounted fishing mortalities (9, 10). Measuring the success of any management strategy to reduce fishing mortality ultimately requires robust spatio-temporal population monitoring (11). However, for mulloway, traditional fishery-dependent monitoring is not ideal considering reductions in fishing effort are required to reduce impacts on the spawning stock. Non-invasive censusing methods are required. One possibility is to utilize visual surveys [either surface or underwater; (12)], although these require clear water and are not suitable for many inshore or estuarine environments. Two other options are to monitor environmental DNA [eDNA; (13)] and/or use hydroacoustics [either emitted; (14), or received sound; (15)] to infer relative abundances and/or biomasses over appropriate spatio-temporal scales.
Of these two approaches, eDNA methods are gaining the most recent attention because for many species, concentrations can be positively related to biomass and/or abundance (13). More specifically, for mulloway we recently identified positive relationships between eDNA concentrations and their absolute biomass under controlled conditions in aquaria, and recommended subsequent field trials to explore the practicality of relationships (16). While there are few comparative data supporting hydroacoustic surveys of mulloway (17), the technique has been validated for other species as part of fishery-independent/dependent surveys in other jurisdictions and could be validated for mulloway in the absence of lethal sampling; albeit with some limitations for detecting small sizes of fish (18, 19). As part of any validations, there is utility in comparing eDNA and hydroacoustic approaches, considering that among the very few studies done for other species most have shown positive correlations for fish biomass or abundance (20–23).
Given the above, the aim of this study was to investigate any correlation between eDNA and hydroacoustics for estimating the relative biomass and abundance of mulloway and potential key affecting factors (including season) in one estuary (the Hawkesbury River) known to have mulloway present throughout the year (9, 24). In doing so, we sought to provide information on the possible utility of each method over the longer term.
The work was done in the lower Hawkesbury River (encompassing the known range of mulloway) within a single year during autumn (16–20 May, 2022) and spring (17–20 October and 1–2 December, 2022; Figures 1A–C). The spring sampling was temporally separated because high rainfall produced a freshwater wedge at four upstream sites (sites 9–12) and precluded mulloway being present. Nevertheless, the sampling periods remained either side of the peak spawning season (from December to March) for mulloway. Given that mulloway typically spawn at sea or possibly in lower estuaries (2), it is unlikely reproductive DNA propagules confounded relationships with biomass or abundance. The specific sampling dates within seasons coincided with optimal salinity profiles in the lower reaches of the river (to avoid hydroacoustic biases).
Twelve sites were selected, and each divided into 10 transects (perpendicular to the riverbank and 100 m apart; Figures 1C, D). Prior to starting the biomass/abundance surveys, all sites were bathymetrically modeled (during November 2021). The model created a detailed map of the underwater terrain, which enabled tracks to be determined for the subsequent biomass survey. Bathymetric data for each site were collected using the Humminbird Helix Mega SI GPS fish finder (Helix) with the boat moving along the transects at each site (Figure 1D, Supplementary material). The data were reviewed using ReefMaster software V2.0 (ReefMaster) and the physical characteristics of each site were generated, including bottom-line (riverbed), zero line (where the water meets the land), area (m2), depth (m), and volume (m3). Bathymetric data were also used to determine the optimal angle of the transducer (−3 to −4.5 degrees below horizontal) for the biomass/abundance surveys (Supplementary material).
To minimize any effects of water flow on eDNA concentrations and maximize the probability of hydroacoustic detections at each site, the surveys were timed to occur as close to high tide as possible (prioritized from downstream to upstream sites). Before starting sampling, an equipment control (EC−1 l of sterile water) was filtered at each site to enable potential DNA contamination in the field to be detected. Then, at the start of each transect within each site, the boat was stopped, and a 2-l sample of surface water was collected from the river and filtered using a Smith Root eDNA sampler (Smith-Root) and 5 μm polyethersulfone self-preserving filters [Smith-Root; (25)]. Filters were refrigerated at 4°C at the conclusion of each day of sampling.
The vessel then proceeded along the transect for hydroacoustic surveying (and with concurrent bathymetry surveying to check for any changes in site characteristics). Data detections of individual mulloway were collected using the BioSonics DTX Extreme split beam echo sounder (Biosonics Inc.) and managed with the Visual Acquisition software package (BioSonics Inc.) which also concurrently collected bathymetry data (Supplementary material). Mulloway were identified based on reference data from a similar species, barramundi (Lates calcarifer; Supplementary material). The limits of detection for mulloway were ≥30 cm TL (to the nearest 10 cm) due to the high likelihood of species misidentification given that acoustic signals are less easily differentiated for smaller fish (Supplementary material). Total lengths were then converted to weights using the relationship provided by Silberschneider et al. (3). The mulloway count (no. m−3) and biomass (kg m−3) were estimated for each transect and then pooled to provide abundance and biomass estimates site−1. Two replicate water quality parameter measurements (temperature, salinity, and dissolved oxygen) were collected at the first transect prior to commencing sampling.
At the end of each survey period (spring or autumn), all filters were transported to a purpose-built eDNA laboratory at the Narrandera Fisheries Centre. The DNA was extracted from each filter within six months of collection and following established protocols (Supplementary material). We used a Zymo OneStep PCR Inhibitor Removal Kit (Integrated Sciences) to reduce the amount of PCR inhibitors in the samples. We then tested each sample for remaining inhibition following the procedures in Rourke et al. (26). Specifically, neat (1:1) and diluted (1:10) eDNA for each sample were evaluated for inhibition using an assay that targeted endogenous ‘teleost' DNA in the sample (27). Inhibited samples were those where amplification of teleost DNA in the 1:10 dilution occurred earlier than expected with a shift of < 3.3 cycle threshold (Ct) values compared to neat eDNA. If samples were inhibited, the 1:10 eDNA was used to evaluate eDNA concentrations. Six qPCR replicates sample−1 were used to calculate the mean eDNA concentration for each filter in ng l−1 as well as the copies reaction−1. The qPCR replicates were only included in the calculations if there was successful amplification of the mulloway or endogenous control assay to ensure that samples that were strongly inhibited or had an error in the laboratory process were excluded (Supplementary material).
The raw data comprised the concentrations of DNA for each of the filters (ng l−1) at each transect within sites and the hydroacoustically estimated total abundance and biomass for each site standardized to m−3 (by volume surveyed). Hydroacoustic data were aggregated to the site level due to the relatively low abundance of mulloway within individual transects, which provided little contrast with which to test a potential relationship with eDNA. The eDNA data were explored using boxplots, Cleveland plots, and scatterplots following the protocol of Zuur et al. (28) before being log-transformed (with epsilon of the lowest eDNA value for zeros). Linear mixed models (LMMs) were used to test for a potential relationship between eDNA concentration and either biomass or abundance (analyzed separately), while accounting for the potential effect of season (fixed effect, two levels), the interaction between season and biomass/abundance, and site (random effect, 12 levels). Season was included in the analysis because mulloway numbers, size, and spatial distribution may vary between seasons, potentially affecting the relationship between eDNA concentration and biomass/abundance. Replication at the site level may have introduced unintended variance at this spatial scale, which needed to be accounted for using a random effect. The significance of fixed effects was evaluated at the 5% level using Wald tests. All modeling was done in R (ver. 4.3.1, RCore Team 2024) using ASReml (29).
Ten transects were hydroacoustially surveyed at all sites. Mulloway biomasses and abundances were generally higher in autumn than spring, except at the most upstream sites where the trend reversed (Table 1). Mean depths, survey areas (m3) and water quality were variable among sites (Table 1, Supplementary material). During autumn, water temperatures at downstream sites were usually warmer than upstream sites, but in spring, the opposite occurred. During both seasons, owing to freshwater inflows, salinity steadily declined upstream and sites 8–12 were all below five practical salinity units (Table 1). Dissolved oxygen was consistent throughout the study reach.
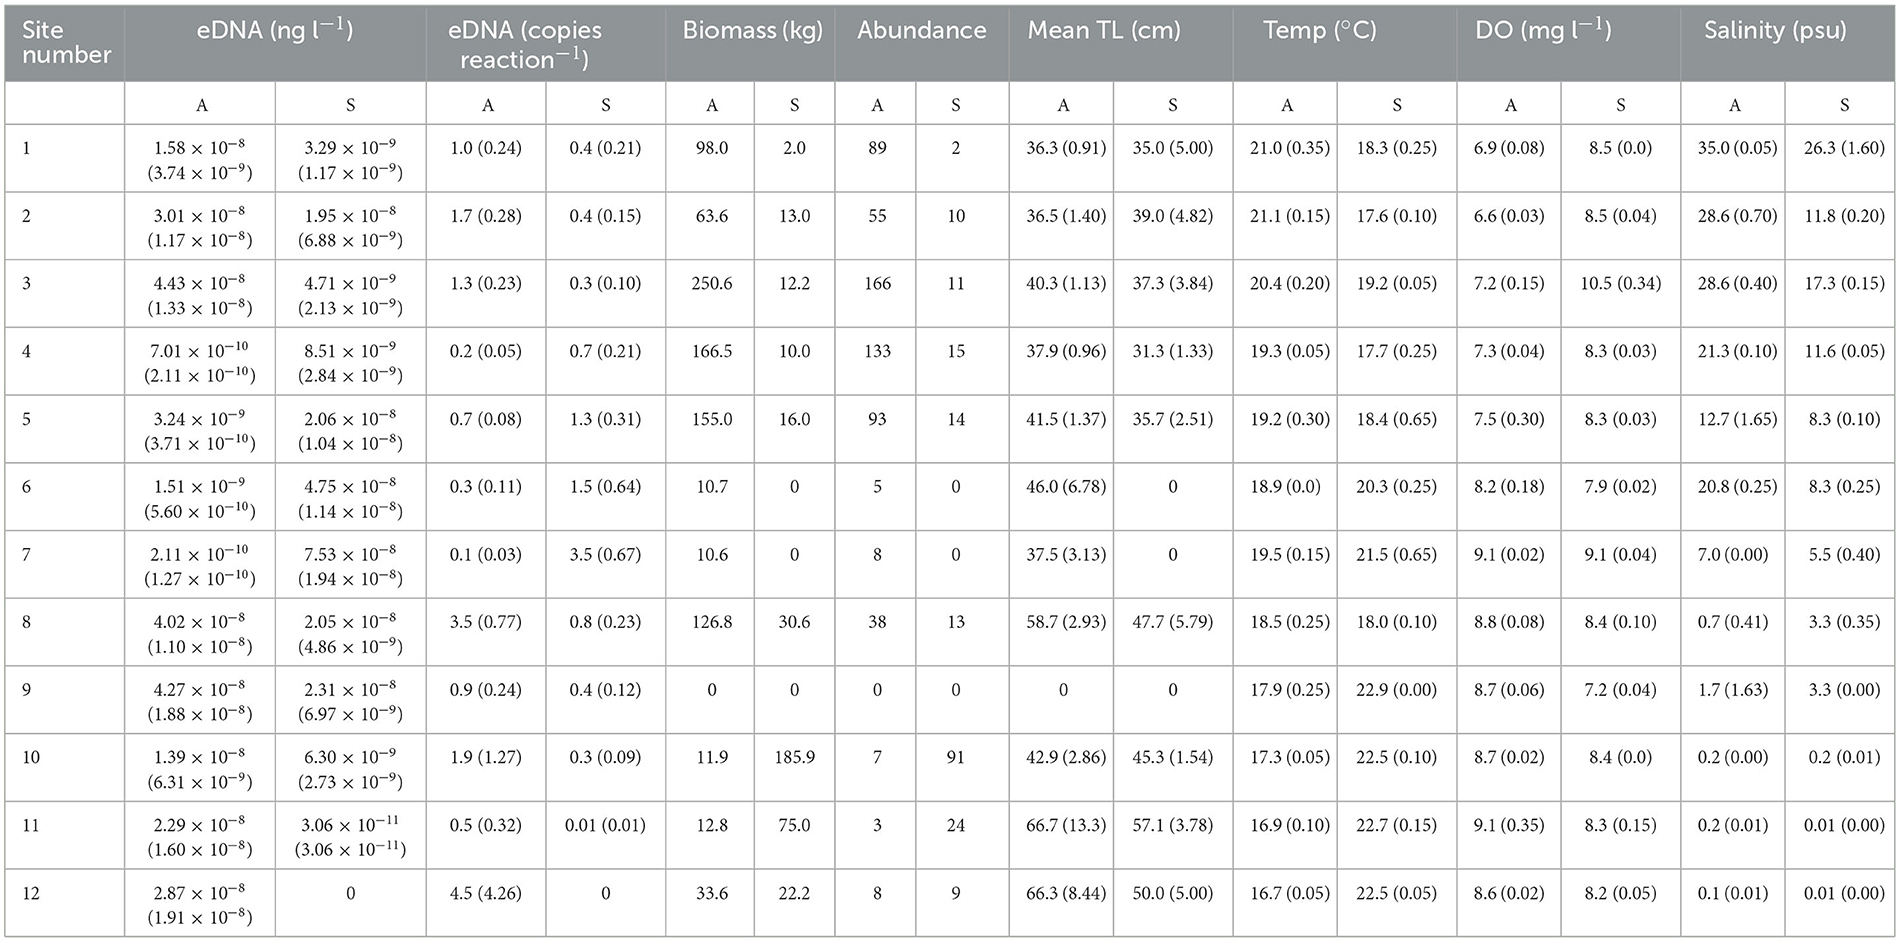
Table 1. The sites (see Figure 1) and numbers of transects assessed during two seasons (A, autumn and S, spring) in the Hawkesbury River, and the mean (±SE) mulloway (Argyrosomus japonicus) eDNA concentrations and copies reaction−1 and hydroacoustically assessed biomasses, abundances and total lengths (TL) transect−1, and water-quality metrics site−1.
Ten eDNA samples were collected for mulloway at all sites except for two where nine eDNA samples were collected (with the missing replicate due to filter failure). Thirty-eight percent of the samples collected in autumn and 64% of samples collected in spring were diluted to 1:10 prior to qPCR for mulloway DNA concentration estimates due to persistent inhibition. The quantity of DNA reaction−1 fell just below the limit of quantification (two copies reaction−1) in 21 out of 24 replicate sites (range 0.01–4.5 copies reaction−1), most likely because most samples were diluted to 1:10 to overcome persistent inhibition. Nevertheless, the number of technical replicates was high, which increased the accuracy of DNA concentration estimates.
Mulloway DNA was detected at 173 out of 238 transects and at all 24 sites except for the most upstream (site 12) during spring, while hydroacoustic detections occurred at 16 out of 24 sites; eight during each season (Table 1). Only one site had hydroacoustic detections of mulloway and no eDNA detections (site 12 during spring; Table 1). Conversely there were eight sites where eDNA was detected but there were no hydroacoustic detections (Table 1). Some of the greatest eDNA concentrations were observed at sites where no mulloway were hydroacoustically detected, including at sites 8 and 9 during spring (Table 1). The mean TLs of mulloway detected at each site varied, but with smaller fish generally downstream (Table 1).
Significance in the LMMs investigating variability among the eDNA concentrations of mulloway was restricted to the interaction between season and biomass, with positive and negative regressions during autumn and spring; both of which were significantly different from zero (p < 0.001; Table 2, Figure 2A). Although not significant, the same trend of coefficients was detected for the relationship between eDNA and abundance (p = 0.09; Table 2, Figure 2B).
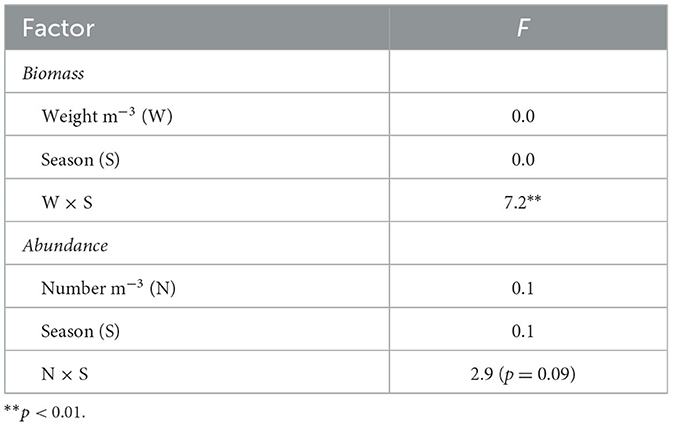
Table 2. Summaries of Wald F-values from linear mixed models assessing the effects of seasons (spring and autumn) and the hydroacoustically estimated biomass or abundance (and the interaction) of mulloway (Argyrosomus japonicus) on variability among their concentrations of eDNA at 12 sites (random factor) in the Hawkesbury River, New South Wales.
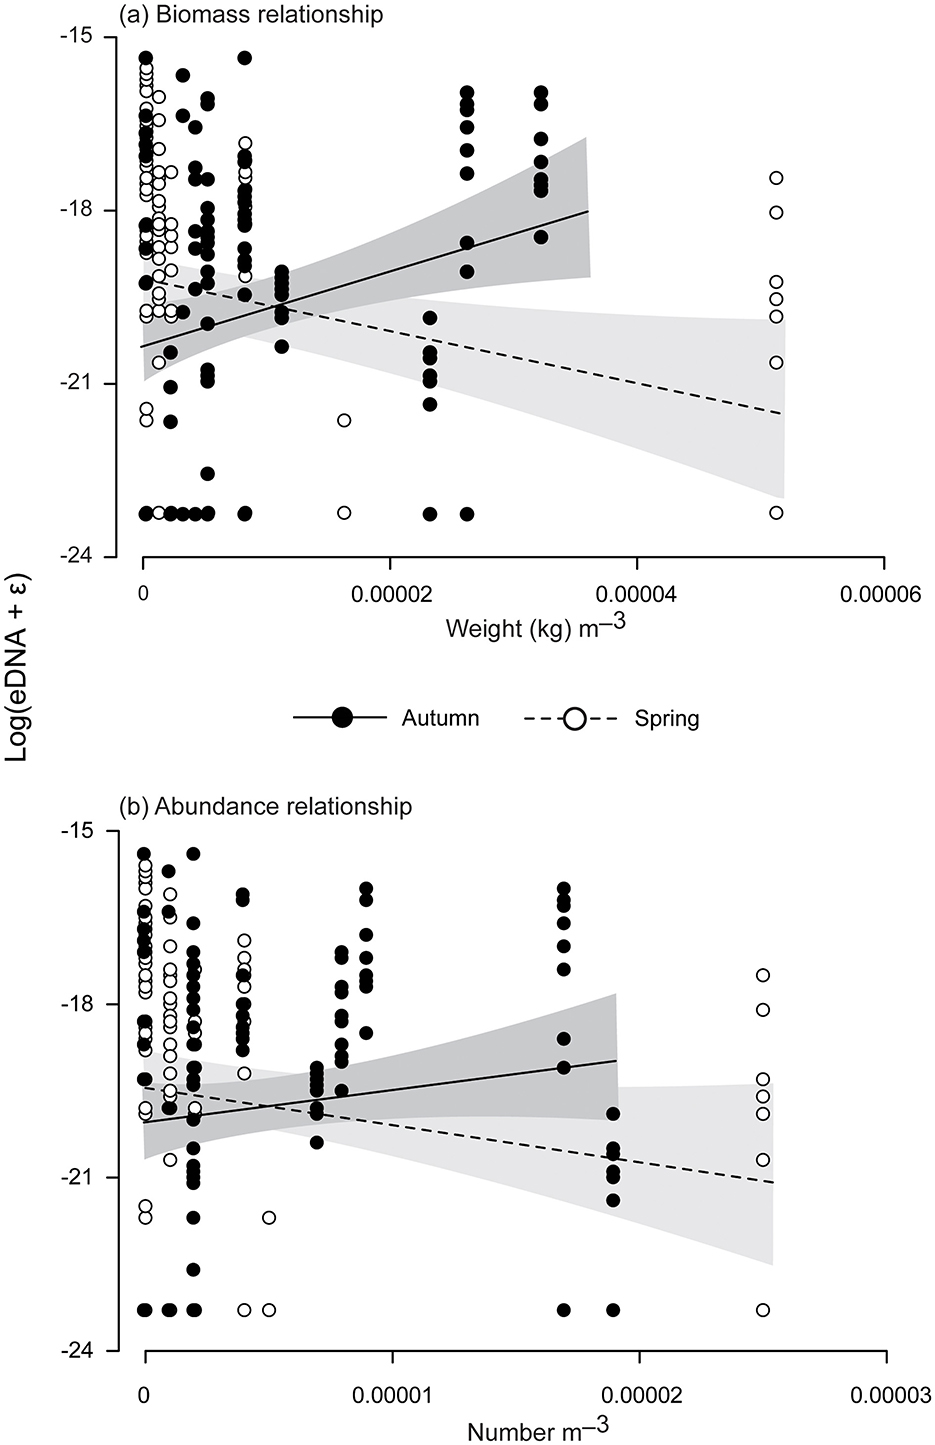
Figure 2. Linear regressions between log eDNA concentrations (ng l−1) of mulloway (Argyrosomus japonicus) and their hydroacoustically estimated (A) biomass and (B) abundance (m−3) during autumn (May) and spring (October and December). Points indicate raw data, while the lines are the regressions with and 95% confidence intervals either side.
This study contributes toward the limited regional data determining the viability of eDNA for monitoring the relative biomass and/or abundance of mulloway (16, 30), the broader literature for sciaenids [e.g., (31)] and teleosts in general (13), and the few studies correlating eDNA and hydroacoustic estimates (20–23). The results from the autumn sampling support the positive correlations between biomass and eDNA previously detected for mulloway under controlled aquaria conditions, and for most assessed species across various scenarios (13, 16). Nevertheless, we observed the correlations reversed in spring. Such divergent seasonal effects can be contextualized within the study limitations and possible influencing environmental factors.
It is important to reiterate that calculating the absolute biomass or abundance of mulloway in the Hawkesbury River (to reference against eDNA concentrations) is not possible. All traditional methods, including penaeid trawling, electrofishing, gillnetting or trapping either have lethal outcomes or were considered impractical. Hydroacoustic sampling was the only feasible option here. This method has been successfully validated and applied to assess fish populations around the world (18, 19), but like all methods, it has inherent limitations—notably the inability here to identify mulloway < 30 cm TL. We were aware that juvenile mulloway as small as 5 cm TL inhabit the Hawkesbury River year-round (9), but we assumed that hydroacoustic detections of larger fish would present as relatively greater deviations in eDNA from baseline amounts (i.e., due to smaller fish) because our aquaria trials (using fish < 30 cm TL) showed a strong correlation between eDNA concentration and biomass (16). Nevertheless, the absence of data on the absolute quantities of mulloway < 30 cm TL means the hydroacoustic estimates are incomplete, potentially skewing the observed relationships with eDNA concentrations. Future work should focus on further validating the hydroacoustic methods to maximize the accuracy of mulloway detections.
Beyond potential size-specific biases of hydroacoustics there are important considerations concerning eDNA assessments. We collected surface water samples at the start of each transect and assumed the extracted DNA represented mulloway within the entire volume of the site. However, the number of water samples and their appropriate depth required to accurately estimate eDNA concentrations remain unknown, but probably varies according to system hydrology (13, 23). While surface sampling may seem counterintuitive for mulloway, which typically orientate lower in the water column, previous studies have shown surface samples to be suitable for both lentic and lotic water bodies which may reflect mostly shallow depths (23, 32–34). Nevertheless, it is possible the mulloway eDNA concentrations detected here were not an accurate representation at deeper sites [i.e., which ranged from ~6 to 34 m; (35)]. Further, the surface salinity at the five most upstream sites was quite low across both seasons, indicating potential haloclines. Mulloway prefer at least some salinity, and any reduction in mixing may have resulted in less DNA at the surface.
The importance of environmental influences affecting the distribution of mulloway and their DNA was reiterated by the significant interaction detected between season and biomass estimates (and the similar non-significant trend for abundance). Specifically, while a significant positive relationship between eDNA concentration and biomass was noted in autumn, the opposite occurred in spring. This anomaly was primarily driven by two extremes during spring: high eDNA concentrations when there were very few (or no) hydroacoustic detections of mulloway, and high hydroacoustic detections of mulloway where there were no or very low concentrations of eDNA detected. There are at least two possible explanations for these observations. First there may have been relatively larger abundances of undetected mulloway approaching 30 cm TL during spring. specifically, following spawning throughout summer the greatest abundances of the smallest mulloway (~5–15 cm TL) in the Hawkesbury River typically occur during autumn [when fish are up to ~6 months old; (24)]. Then, notwithstanding high natural mortality, many of these 0+ fish would grow to >20 cm TL by the subsequent spring [and still remain undetectable by hydroacoustic scans; (9)]. These larger fish would be shedding DNA, and so confound any hydroacoustic biomass estimates of the relatively fewer adults and sub-adults (13).
The second possible explanation relates to the impact of environmental parameters on DNA persistence at a site. Assuming the hydroacoustic scans remained similarly efficient between seasons, the mismatch between eDNA concentrations and hydroacoustic detections of mulloway at a site in spring could simply reflect greater rainfall. Lower salinity across most sites reflected greater freshwater flows during spring. High inflows can dilute eDNA as well as transport eDNA from further upstream, which may explain the low concentrations detected at a site despite the presence of high mulloway biomass/abundance. Additionally, biotic and abiotic factors can influence eDNA production and persistence and are known to fluctuate between seasons (36, 37). Various unmeasured variables (including UV light, chemicals, microorganisms and biofilms) may have also affected eDNA persistence differently between seasons, leading to variation in detected concentrations.
Speculation over the causal factors supporting the interaction between season and biomass detection clearly reiterates the need to progress more research with eDNA for use as a relative index of mulloway populations. Such work should include comparing eDNA concentrations between the upper and lower reaches of the Hawkesbury River, and possibly restrict sampling to low-flow conditions or less dynamic estuaries. Nevertheless, research will remain difficult in estuaries because these present dynamic environments with numerous abiotic factors that can strongly affect relationships (13).
Regardless of efforts at deciphering extrinsic factors affecting eDNA, because mulloway are still targeted and landed by commercial fisheries in various NSW estuaries and inshore, future surveys also warrant comparing these catches against eDNA data across the same space and time. However, current eDNA methods are constrained by limited size differentiation (subject to abiotic and biotic influences), and so the challenge remains to interpret such data alongside fishery-dependent catches and known sizes (38).
The raw data supporting the conclusions of this article will be made available by the authors, without undue reservation.
The animal study was approved by Fisheries Animal Care and Ethics Committee. The study was conducted in accordance with the local legislation and institutional requirements.
MR: Conceptualization, Data curation, Funding acquisition, Methodology, Project administration, Resources, Supervision, Writing – original draft, Writing – review & editing. MB: Conceptualization, Data curation, Formal analysis, Funding acquisition, Methodology, Visualization, Writing – original draft, Writing – review & editing. AF: Conceptualization, Data curation, Formal analysis, Funding acquisition, Methodology, Validation, Writing – original draft, Writing – review & editing. JH: Conceptualization, Funding acquisition, Methodology, Writing – original draft, Writing – review & editing. JD: Conceptualization, Funding acquisition, Methodology, Writing – review & editing. SS: Formal analysis, Investigation, Validation, Writing – original draft, Writing – review & editing. EF: Conceptualization, Funding acquisition, Methodology, Writing – review & editing.
The author(s) declare that financial support was received for the research and/or publication of this article. This research was funded by the New South Department of Primary Industries and Regional Development (DPIRD) and the Fisheries Research and Development Corporation (project no. 2019–016) on behalf of the Australian Government.
We thank Aaron Dunlop, Greg Miller, Nick Meadows, Golam Sarwer, Bec Dennis, and Jackson Wilkes Walburn for field and laboratory work. We are grateful for the input of two reviewers for their insightful comments, which substantially improved the quality of the manuscript.
The authors declare that the research was conducted in the absence of any commercial or financial relationships that could be construed as a potential conflict of interest.
The author(s) declared that they were an editorial board member of Frontiers, at the time of submission. This had no impact on the peer review process and the final decision.
The author(s) declare that no Gen AI was used in the creation of this manuscript.
All claims expressed in this article are solely those of the authors and do not necessarily represent those of their affiliated organizations, or those of the publisher, the editors and the reviewers. Any product that may be evaluated in this article, or claim that may be made by its manufacturer, is not guaranteed or endorsed by the publisher.
The Supplementary Material for this article can be found online at: https://www.frontiersin.org/articles/10.3389/frish.2025.1547935/full#supplementary-material
1. Sasaki K. (2001). “Sciaenidae. Croakers (drums).” In: Carpenter KE, and N. V.H, , editor. The Living Marine Resources of the Western Central Pacific. Rome: FAO. p. 3117–74.
2. Silberschneider V, Gray CA. Synopsis of biological, fisheries and aquaculture-related information on mulloway Argyrosomus japonicus (Pisces: Sciaenidae), with particular reference to Australia. J Appl Ichthyol. (2008) 24:7–17. doi: 10.1111/j.1439-0426.2007.00913.x
3. Silberschneider V, Gray CA, Stewart J. Age, growth, maturity and the overfishing of the iconic sciaenid, Argyrosomus japonicus, in south-eastern, Australia. Fish Res. (2009) 95:220–9. doi: 10.1016/j.fishres.2008.09.002
4. Trewavas E. The sciaenid fishes (croakers or drums) of the Indo-west Pacific. Trans Zool Soc Lond. (1977) 33:253–541.
5. Whitfield AK, Mann BQ. The changing status of important marine fishery species in selected South African estuaries. Afr J Mar Sci. (2023) 45:235–48. doi: 10.2989/1814232X.2023.2274899
6. Earl J, Fairclough D, Fisher E, Hughes J, Roelofs A. Mulloway Argyrosomus japonicus (Status of Australian fish stocks reports 2020 (2020). Available online at: https://www.fish.gov.au/report/368-Mulloway-2020
7. Fennessy S. Argyrosomus japonicus. The IUCN Red List of Threatened Species 2020:e.T49145403A49234015 (2020). Available online at: https://www.iucnredlist.org/species/49145403/49234015 (accessed February 22, 2024).
8. Taylor MD, Laffan SW, Fairfax AV, Payne NL. Finding their way in the world: Using acoustic telemetry to evaluate relative movement patterns of hatchery-reared fish in the period following release. Fish Res. (2017) 186:538–43. doi: 10.1016/j.fishres.2016.07.003
9. Broadhurst MK, Kennelly SJ. Reducing the by-catch of juvenile fish (mulloway Argyrosomus hololepidotus) using square-mesh panels in codends in the Hawkesbury River prawn-trawl fishery, Australia. Fish Res. (1994) 19:321–31. doi: 10.1016/0165-7836(94)90047-7
10. Broadhurst MK, Millar RB. Relative performance of two bycatch reduction devices for excluding juvenile mulloway, Argyrosomus japonicus and other fish from south-eastern Australian penaeid trawls. Fish Res. (2024) 271:106905. doi: 10.1016/j.fishres.2023.106905
11. Hill NJ, Haddon M, Hartmann K, Little LR, Lyle JM, Moore BR, et al. Prevalence of effective fisheries management in a developed nation and its link to stock sustainability. Marine Policy. (2023) 151:105596. doi: 10.1016/j.marpol.2023.105596
12. Palmas F, Casula P, Curreli F, Podda C, Cabiddu S, Sabatini A. Exploring less invasive visual surveys to assess the spatial distribution of endangered mediterranean trout population in a small intermittent stream. Biology. (2023) 12:1000. doi: 10.3390/biology12071000
13. Rourke ML, Fowler AM, Hughes JM, Broadhurst MK, DiBattista JD, Fielder S, et al. Environmental DNA (eDNA) as a tool for assessing fish biomass: a review of approaches and future considerations for resource surveys. Environmental DNA. (2022) 4:9–33. doi: 10.1002/edn3.185
14. Lyons J, Hateley J, Peirson G, Eley F, Manwaring S, Twine K. An assessment of hydroacoustic and electric fishing data to evaluate long term spatial and temporal fish population change in the river thames, UK. Water. (2021) 13:2932. doi: 10.3390/w13202932
15. Mouy X, Black M, Cox K, Qualley J, Dosso S, Juanes F. Identification of fish sounds in the wild using a set of portable audio-video arrays. Methods Ecol Evol. (2023) 14:2165–86. doi: 10.1111/2041-210X.14095
16. Rourke ML, Broadhurst MK, Fowler AM, Wilkes Walburn J, Hughes JM, Fielder DS. Investigating the potential utility of environmental dna to provide a relative abundance index for the depleted teleost, mulloway, Argyrosomus japonicus. Diversity. (2023) 15:322. doi: 10.3390/d15030322
17. Parsons JG J Anning and IM Parnum. Passive and Active Acoustic Monitoring of Mulloway in the Swan River. Acoustics 2017, 19–22 November 2017, Perth, Australia (2017).
18. Draštík V, Godlewska M, Balk H, Clabburn P, Kubečka J, Morrissey E, et al. Fish hydroacoustic survey standardization: a step forward based on comparisons of methods and systems from vertical surveys of a large deep lake. Limnol Oceanogr Methods. (2017) 15:836–46. doi: 10.1002/lom3.10202
19. Mackinson S, Freeman S, Flatt R, Meadows B. Improved acoustic surveys that save time and money: integrating fisheries and ground-discrimination acoustic technologies. J Exp Mar Bio Ecol. (2004) 305:129–40. doi: 10.1016/j.jembe.2003.10.020
20. Coulter DP, Wang P, Coulter AA, Van Susteren GE, Eichmiller JJ, Garvey JE, et al. Nonlinear relationship between Silver Carp density and their eDNA concentration in a large river. PLoS ONE. (2019) 14:e0218823. doi: 10.1371/journal.pone.0218823
21. Fowler CM, Ogburn MB, Aguilar R, Heggie K, Legett HD, Richie KD, et al. Viability of high-frequency environmental DNA (eDNA) sampling as a fish enumeration tool. Ecol Indic. (2024) 166:112384. doi: 10.1016/j.ecolind.2024.112384
22. Fukaya K, Murakami H, Yoon S, Minami K, Osada Y, Yamamoto S, et al. Estimating fish population abundance by integrating quantitative data on environmental DNA and hydrodynamic modelling. Mol Ecol. (2021) 30:3057–67. doi: 10.1111/mec.15530
23. Yamamoto S, Minami K, Fukaya K, Takahashi K, Sawada H, Murakami H, et al. Environmental DNA as a ‘snapshot' of fish distribution: a case study of Japanese Jack Mackerel in Maizuru Bay, Sea of Japan. PLoS ONE. (2016) 11:e0149786. doi: 10.1371/journal.pone.0149786
24. Kennelly SJ. Study of the By-Catch of the NSW East Coast Trawl Fishery. Final Report to the Fisheries Research and Development Corporation. Project No.: 88/108. ISBN 0731020960 (1993).
25. Thomas AC, Nguyen PL, Howard J, Goldberg CS. A self-preserving, partially biodegradable eDNA filter. Methods Ecol Evol. (2019) 10:1136–41. doi: 10.1111/2041-210X.13212
26. Rourke ML, Broadhurst MK, Fowler AM, Hughes JM, DiBattista JD, Furlan EM. Correlated environmental DNA and electrofished estimates of relative biomass for golden perch, Macquaria ambigua. Front Fish Sci. (2024) 2:1358572. doi: 10.3389/frish.2024.1358572
27. Furlan EM, Gleeson D. Improving reliability in environmental DNA detection surveys through enhanced quality control. Mar Freshw Res. (2016) 68:388–95. doi: 10.1071/MF15349
28. Zuur AF, Ieno EN, Elphick CS. A protocol for data exploration to avoid common statistical problems. Methods Ecol Evol. (2010) 1:3–14. doi: 10.1111/j.2041-210X.2009.00001.x
29. Butler DG, Cullis BR, Gilmour AR, Gogel BJ, Thompson R. ASReml-R Reference Manual Version 4.1.0.130. VSN International Ltd (2020). Available online at: https://asreml.kb.vsni.co.uk/
30. Wilkes Walburn J, Rourke ML, Furlan E, DiBattista JD, Broadhurst MK, Fowler AM, et al. Robust environmental DNA assay development and validation: a case study with two vulnerable Australian fish. Aquat Conserv Mar Freshw Ecosyst. (2022) 32:1225–31. doi: 10.1002/aqc.3809
31. Wu L, Li J, Tong F, Zhang J, Li M, Ding S. Resource assessment of larimichthys crocea in the east china sea based on eDNA analysis. Front Mar Sci. (2022) 9:890756. doi: 10.3389/fmars.2022.890756
32. Hinlo R, Furlan E, Suitor L, Gleeson D. Environmental DNA monitoring and management of invasive fish: comparison of eDNA and fyke netting. Manag Biol Invasions. (2017) 8:89–100. doi: 10.3391/mbi.2017.8.1.09
33. Moyer GR, Díaz-Ferguson E, Hill JE, Shea C. Assessing environmental DNA detection in controlled lentic systems. PLoS ONE. (2014) 9:e103767. doi: 10.1371/journal.pone.0103767
34. Thomsen PF, Møller PR, Sigsgaard EE, Knudsen SW, Jørgensen OA, Willerslev E. Environmental DNA from seawater samples correlate with trawl catches of subarctic, deepwater fishes. PLoS ONE. (2016) 11:e0165252. doi: 10.1371/journal.pone.0165252
35. Zhang Y, Zhang X, Li F, Altermatt F. Fishing eDNA in one of the world's largest rivers: a case study of cross-sectional and depth profile sampling in the Yangtze. Environ Sci Technol. (2023) 57:21691–703. doi: 10.1021/acs.est.3c03890
36. Barnes MA, Turner CR, Jerde CL, Renshaw MA, Chadderton WL, Lodge DM. Environmental Conditions Influence eDNA Persistence in Aquatic Systems. Environ Sci Technol. (2014) 48:1819–27. doi: 10.1021/es404734p
37. Joseph C, Faiq ME Li Z, Chen G. Persistence and degradation dynamics of eDNA affected by environmental factors in aquatic ecosystems. Hydrobiologia. (2022) 849:4119–33. doi: 10.1007/s10750-022-04959-w
Keywords: eDNA, hydroacoustics, mulloway, fisheries, estuary, qPCR, Australia
Citation: Rourke ML, Broadhurst MK, Fowler AM, Hughes JM, DiBattista JD, Sawynok S and Furlan EM (2025) Correlating environmental DNA and hydroacoustic estimates of biomass and abundance to monitor the globally Endangered mulloway (Argyrosomus japonicus). Front. Fish Sci. 3:1547935. doi: 10.3389/frish.2025.1547935
Received: 18 December 2024; Accepted: 21 February 2025;
Published: 19 March 2025.
Edited by:
Rafael Miranda, University of Navarra, SpainReviewed by:
Simon Dedman, Florida International University, United StatesCopyright © 2025 Rourke, Broadhurst, Fowler, Hughes, DiBattista, Sawynok and Furlan. This is an open-access article distributed under the terms of the Creative Commons Attribution License (CC BY). The use, distribution or reproduction in other forums is permitted, provided the original author(s) and the copyright owner(s) are credited and that the original publication in this journal is cited, in accordance with accepted academic practice. No use, distribution or reproduction is permitted which does not comply with these terms.
*Correspondence: Meaghan L. Rourke, bWVhZ2hhbi5kdW5jYW5AZHBpLm5zdy5nb3YuYXU=
Disclaimer: All claims expressed in this article are solely those of the authors and do not necessarily represent those of their affiliated organizations, or those of the publisher, the editors and the reviewers. Any product that may be evaluated in this article or claim that may be made by its manufacturer is not guaranteed or endorsed by the publisher.
Research integrity at Frontiers
Learn more about the work of our research integrity team to safeguard the quality of each article we publish.