
94% of researchers rate our articles as excellent or good
Learn more about the work of our research integrity team to safeguard the quality of each article we publish.
Find out more
ORIGINAL RESEARCH article
Front. Fish Sci., 09 February 2024
Sec. Fish Genetics and Evolutionary Biology
Volume 2 - 2024 | https://doi.org/10.3389/frish.2024.1354791
 Laura Carugati1*
 Alice Cappelletti1†
 Riccardo Melis1
 Simone Di Crescenzo1
 Andrea Bellodi2
 Anna Soler-Membrives3
 Maria Cristina Follesa1
 Rita Cannas1*
The sustainable management and conservation of deep-sea species may be hampered by the paucity of data on their population structure and connectivity, in the face of ever-increasing fisheries pressure and other forms of impacts on deep-sea ecosystems. The rabbit fish, Chimaera monstrosa, is a deep-sea cartilaginous fish, reported worldwide in the past, but currently distributed only in the North-Eastern Atlantic Ocean and Mediterranean Sea. It is currently experiencing high levels of mortality associated with by-catch. Its slow growth, low fecundity and late maturity make this species particularly vulnerable to anthropogenic impact, although little is known about processes of connectivity between ecoregions. This study utilized DNA sequencing of the mitochondrial cytochrome c oxidase subunit I (COI) gene to investigate the population structure and demography of C. monstrosa both at the small (around the coasts of Sardinia, western Mediterranean Sea) and at larger spatial scales (at the pan-Mediterranean level, and between the Atlantic Ocean and the Mediterranean Sea). A total of 100 new sequences were obtained from specimens of Mediterranean origin, identifying 15 new haplotypes out of the 30 known so far for the species. Evidence of feeble but significant differentiation was detected among locations within the Tyrrhenian basin. Bayesian clustering analyses indicated the occurrence of three distinct haplogroups: the most common spread all over the Mediterranean, and the other two limited to the Western basin. Greater levels of genetic differentiation were found between the Atlantic and Mediterranean populations which constituted two main genetic clusters, with no shared haplotypes. The two populations became separated at the end of the Middle Pleistocene, with a clear sign of demographic expansion during the same period. The rabbit fish constitutes an important exception to a general paradigm of deep-sea species being connected by high levels of gene flow and such results could be useful to implement current management strategies to conserve this vulnerable by-caught species.
In fishery management, sustainable exploitation and conservation rely on a solid understanding of connectivity and population structure, thus allowing the proper identification of genetically isolated populations and stocks (1). Over the last decades, genetic techniques have been widely used to study population differentiation in marine fishes and thus improving our knowledge of many ecological processes driving population dynamics. So far, most of these studies have focused on coastal pelagic species, given their commercial value and the easiness of sampling, leaving the deeper ones less studied. However, since 1970′s, the fishing pressure on deep-sea stocks has been increasing, with the depth at which fisheries operate increasing by 65 m per decade (2, 3). Despite the increasing anthropogenic stressors on the deep ocean, including climate change, ocean acidification, noise, pollution and chemical spills (4), there is still a paucity of data for deep-sea species. Thus, it becomes crucial to better understand biology, ecology, population structure and dynamics of these fish stocks, and whether they are directly exploited or caught as bycatch. A glaring example are elasmobranchs (Class Chondrichthyes, subclass Elasmobranchii) which play an important role in the deep sea as top predators and are particularly vulnerable to impacts due to their life-history strategies such as low lifetime fecundities, slow growth rates, late age at maturity and high longevities (5). Even worse is the lack of information for the second class of cartilaginous fishes, the chimaeras (Class Chondrichthyes, subclass Holocephali) that are still regarded as one of the most mysterious groups in the deep sea for which very few data are available. In particular, Chimaera monstrosa Linnaeus 1758, known as rabbit fish, has been a recognized species for a long time, but our knowledge regarding its ecology, behavior and population structure is still scant (6). The species has been reported worldwide in the past but nowadays its distribution is restricted to the north-eastern Atlantic Ocean (from northern Norway to Morocco) and Mediterranean Sea. The rabbit fish is a deep-sea species that occurs mainly in sandy bottoms from 300 to 800 m depth, but it may be found deeper than 1,500 m especially in the Mediterranean Sea (7). Like other holocephalans, the rabbit fish is a long-lived species with slow growth and delayed reproduction (8, 9). Its distribution overlaps with areas of intense fishing activity, and thus it is frequently captured as bycatch but generally discarded because it has no commercial value (10, 11).
The IUCN Red List of Threatened Species has classified the rabbit fish as a “near threatened” species in the Mediterranean Sea (12) and as “vulnerable” in the Atlantic Ocean (13). However, despite the decreasing population trend, only few conservation actions are currently being implemented (13). For instance, the Northeast Atlantic Fisheries Commission included this species in the list of the deep-sea chondrichthyans whose fishing is prohibited. Whereas, in the Mediterranean Sea there are no specific regulations for the species, but it is somehow protected in part of its bathymetric range, given that since 2005 the General Fisheries Commission for the Mediterranean has been enforcing the prohibition of bottom trawling at depths >1,000 m.
To ensure the sustainable management and conservation of chimaeras into the future, there is an urgent need to understand more about their genetic diversity. Previous analyses on deep-sea fishes reported little evidence of population structure, with gene flow occurring at the largest oceanic distances evaluated, thus supporting the paradigm of high connectivity in the deep ocean (14–18). Conversely, a few recent studies on other deep-sea species found differences between the Atlantic Ocean and Mediterranean Sea (19, 20), including for C. monstrosa (6).
This study aims to complement and compare the genetic data obtained in a previous paper (6) on the rabbit fish using the same mitochondrial gene, cytochrome c oxidase subunit I (COI), but implementing a denser sampling in the Mediterranean Sea. With respect to the previous study, new individuals from Tyrrhenian Sea, Ionian Sea and also the Atlantic Ocean were included in the analyses, allowing for a relatively extensive investigation of genetic structure both at a smaller (i.e., around the coast of Sardinia, western Mediterranean Sea) and at a larger spatial scale (i.e., at the pan-Mediterranean level, and between the Atlantic and the Mediterranean Sea). We tested whether the two stocks suggested by Catarino et al. (6), namely Mediterranean and Atlantic populations, are supported by our results, which are based on the analyses of a number of sequences more than three times higher than those previously available. We evaluated the spatial genetic structure and the demographic history of populations, thus improving the knowledge of C. monstrosa for its appropriate management and conservation. The new genetic data represent the main strength of the study, as they guarantee a reference point for future monitoring.
A total of 139 samples of Chimaera monstrosa were included in the present study: 121 from the Mediterranean Sea and 18 from the Atlantic Ocean. Specimens came from a total of 18 localities in the Mediterranean Sea and Atlantic Ocean covering most of the distribution range of the species (Table 1, Supplementary Figure S1). More in detail, 100 sequences were produced de novo in this study from individuals collected in the Western Mediterranean Sea (Sardinia) from 2009 to 2022, during commercial or scientific trawl surveys that aimed at monitoring the state of the halieutic resources for management purposes (Supplementary Table S1). Whereas 39 sequences had been downloaded from public databases (Supplementary Table S2): 21 sequences from the Mediterranean Sea, 12 sequences from North Atlantic Ocean, and 6 sequences from the North Sea.
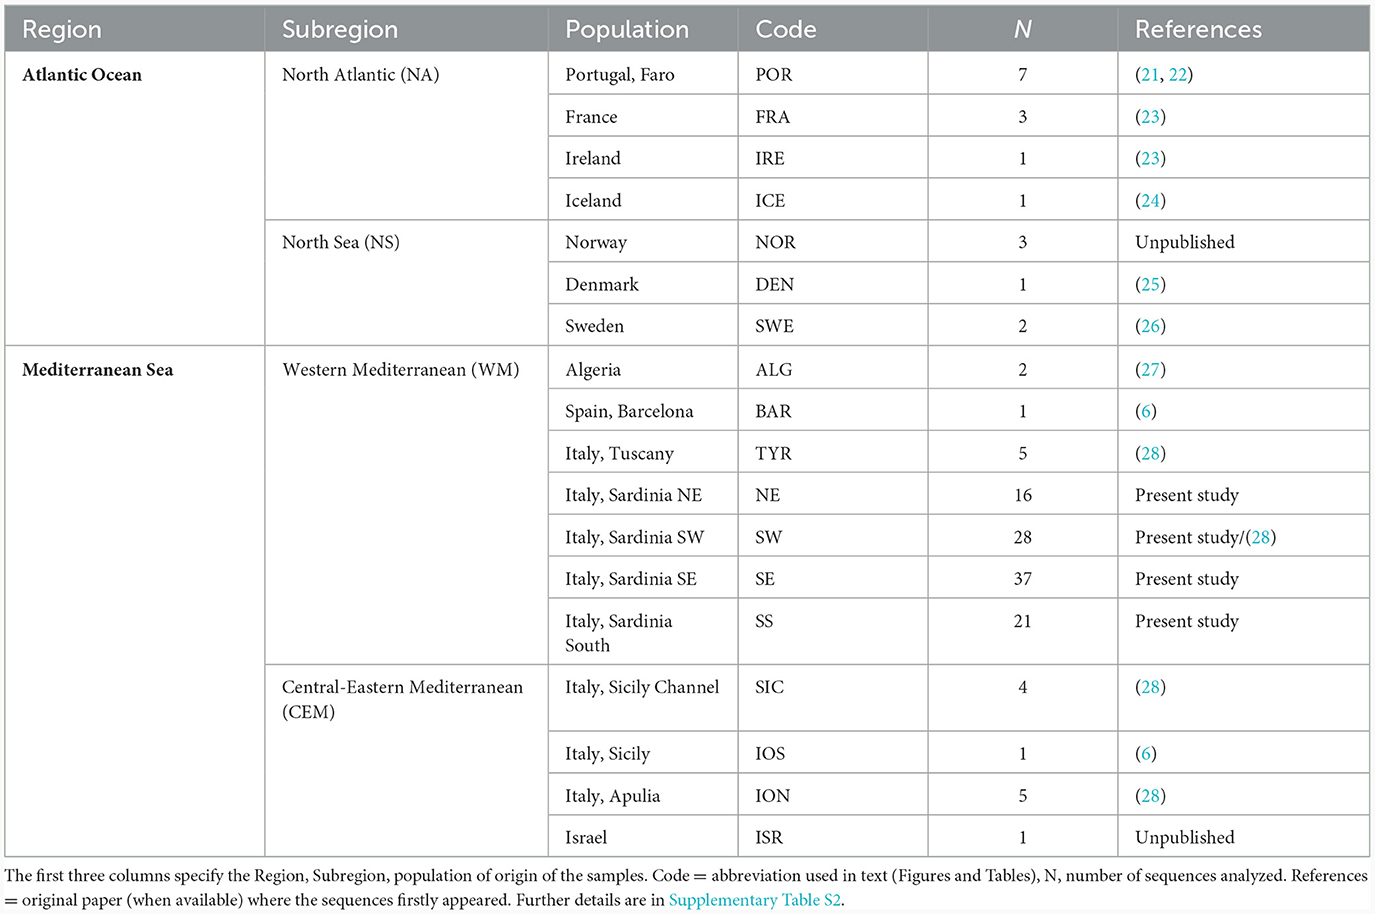
Table 1. C. monstrosa populations sampled from the Atlantic Ocean and Mediterranean Sea.
A small piece of tissue from each of the 100 sampled individuals was removed and preserved in 95% ethanol for further genetic analyses. Total genomic DNA was extracted using a commercial kit (Invitrogen PureLink® kit), according to the manufacturer's instructions. The extracted genomic DNA was checked for quality/quantity by running 5 μl of the solution with 1 μl loading dye on 1% agarose/1 × TBE gel stained with Syber Safe (0.5 μg ml−1). The cytochrome c oxidase subunit I (COI) region from the mitochondrial DNA was amplified by PCR using the Fish-F2 and Fish-R2 primers (29). The thermal cycle profile started with an initial denaturation of 2 min at 94°C, followed by 35 cycles: denaturation for 30 s at 94°C, annealing for 1 min at 50°C, extension for 1 min 35 s at 72°C and a final extension of 7 min at 72°C. Negative controls consisting of a template-free mix were run to detect any DNA contamination. Amplicons were visualized using electrophoresis on a 1% agarose gel to evaluate the integrity of the products and were then sequenced by Macrogen Inc., The Netherlands.
The Clustal W algorithm (30) implemented in MEGA v10 (31) was used to align the 100 newly obtained sequences. Additionally, 39 sequences of C. monstrosa available at the Barcoding of Life [BOLD; (32)] and at National Centre for Biotechnology Information (NCBI) databases were downloaded and added to the alignment. This extended the dataset to a total of 139 sequences.
Based on the sampling localities, COI sequences were grouped in two geographical regions: Atlantic (AT) and Mediterranean (MED). Furthermore, the AT included two subregions: North Sea (NS) and North Atlantic (NA), while MED included Western Mediterranean (WM) and Central-Eastern Mediterranean (CEM).
Default parameters were utilized for all software unless explicitly specified otherwise. Number of polymorphic sites (S), number of haplotypes (Ha), haplotype diversity (Hd), nucleotide diversity (π) and relative standard deviations (SD) were obtained using DNAsp v. 6.1 software (33), and calculated for each population with at least more than five individuals, each subregion and the two main geographic regions. The relationships among haplotypes were investigated by the TCS method [named after Templeton et al. (34) and fully described in Clement et al. (35)], using the PopART v 1.7 software for building the network of haplotypes (36).
The software Bayesian Analysis of Population Structure (BAPS) v.6.0 (37) was employed to identify existing differentiated genetic groups (haplogroups or “clusters”). BAPS was run using the method of “clustering for linked loci”, a codon model with five independent runs, and setting the maximum number of clusters (K) to 12. The BAPS haplogroups were visualized as pie charts on a map using GENGIS 2.5.3 (38). The European coastline shapefile used to produce the maps was downloaded from the EEA website (http://www.eea.europa.eu/data-and-maps/data/eea-coastline-for-analysis-1/gis-data/europe-coastline-shapefile).
The occurrence of population structuring was investigated with the Analysis of Molecular Variance (AMOVA) in Arlequin v3.5 (39) using the Tamura and Nei distances [TN93, (40)]. In particular, TN93 is the closest model implemented in Arlequin to the optimal evolutionary model for the whole dataset (TN93+I; Tamura and Nei distances+ Invariant Sites), and for the Mediterranean and the Sardinian dataset (HKY, Hasegawa-Kishino-Yano), as selected by the software jMODELTEST version 2.1.10 (41, 42). The significance of fixation indices values was computed by a non-parametric permutation procedure with 10,000 generations. The software Arlequin was also used to estimate pairwise Fixation Indices (Φst) based on nucleotide differences between all the populations. The values were calculated from sequence divergences using the model outlined above. Pairwise genetic differentiation was estimated through Φst values after 10,000 permutations. In pairwise comparisons, the probability values were adjusted for multiple tests using the Bon-EV method (43) as included in the software Myriads v1.1 (44). The obtained Φst matrix will be also graphically represented using R packages: “XML” v3.99-0.1 (45), “ v0.92 (46), “magrittr” v2.0.3 (47), and “dplyr” v1.1.2 (48).
To infer the spatial genetic structure of C. monstrosa, the number and the composition of panmictic groups, as well as the spatial boundaries among them were estimated using a Bayesian model computed with GENELAND v. 2.0.0 (49) in the R environment [v. 4.2.3; (50)], for both the whole dataset and only for the Mediterranean Sea. The best association of localities was estimated using a Markov Chain Monte Carlo (MCMC) procedure including genetic and geographic information following (48). Analyses were run using 5 × 10⁶ MCMC generations, sampled each 1,000 steps, with K varying from 1 to 18. The posterior probability of population membership was computed for each pixel of the spatial domain (300 × 300 pixels), using a burn-in of 200 generations.
To infer the demographic history of populations, we applied different approaches. Firstly, we used neutrality tests to detect departures from the null hypothesis of neutrality. Actually, very different kinds of evolutionary processes, such as selective events or demographic changes, can produce similar deviations. However, in biogeographic studies these departures are often interpreted in terms of historical shifts in effective population sizes (51). In particular, we used two distinct tests (52): the Class I Tajima's D (53), that uses information on the mutation frequency and the Class II Fu's Fs test (54) which is based on information from the haplotype distribution. Class I statistics could be appropriate to distinguish population growth from constant size populations because the former generates an excess of mutations in external branches of the genealogy and therefore an excess of singletons. Among Class II statistics, Fu's Fs has been proved to be powerful for detecting expansions (55). Tajima's D and Fu's Fs parameters (both expected to be equal to zero under the hypothesis of selective neutrality and population equilibrium) were assessed as implemented in Arlequin, and their significance levels were calculated by generating 1,000 random samples. Significant negative D and Fs values can be interpreted as signatures of population expansion. In Arlequin, population expansion was further tested by examining the agreement between the observed and the expected frequency distribution with Harpending's raggedness index [Hri; (56)] and sum of squared deviations [SSD; (56)] for the sudden demographic and spatial expansion models. All the analyses have been performed for each region, subregion, and population with >5 individuals.
Secondly, since neutrality tests can fail to make full use of historical demographic signals imprinted in the DNA (51), we also applied Bayesian Skyline plots (BSP) (57) to reconstruct historical population sizes with information contained in haplotype genealogies, as implemented in BEAST ver. 1.10.4 (58). BSP plots were generated for Mediterranean and Atlantic populations. For the analysis we used the best-fit nucleotide substitution models selected based on decision theory and Bayesian information criterion analyzed by jMODELTEST version 2.1.10: the models were TN93 for the Mediterranean Sea and HKY for the Atlantic Ocean. A strict molecular clock and a coalescent Bayesian skyline tree process were chosen as priors. In the case of the Mediterranean Sea, two MCMC were run for 1 × 10⁹ generations, sampling every 500,000 steps, whereas for the Atlantic Ocean the two MCMC were run for 360 × 106 generations, sampling every 500,000 steps. For each run, the first 10% generations were discarded as burn-in, and LogCombiner v. 1.10.4 (58) was used to combine the replicates. TRACER v 1.7.2 (59) was used to check convergence by measuring Effective Sample Sizes (ESS) of all parameters (ESS > 200 for each group) and to calculate the mean value, the upper and lower bounds of the 95% highest posterior density interval of effective population sizes, and to draw skyline plots.
The time since expansion event was calculated based on the expansion parameter tau (τ), estimated with Arlequin 3.5, using the formula t = τ/2u, where t is the time since expansion (in generations) and u is the cumulative evolutionary rate per generation for all the sequences analyzed (60). The value of the evolutionary rate u is derived from the formula u = μkg, where μ is the evolutionary rate (substitutions per site per year), k is the sequence length and g is the generation time in years (61). To calculate the expansion time in years, t is multiplied by the generation time of the species studied (62). Since no estimations of molecular clock are available so far for Holocephali, the time of the most recent expansion was investigated by using both a specific clock for elasmobranchs (7.8 × 10⁻⁹) and a general molecular clock for control region of fish (1.8 × 10⁻⁸) (6, 63). We used a generation time of 11 years for our species (64).
In addition, as in Catarino et al. (6), we used BEAST ver 1.10.4 to estimate the divergence time between Mediterranean and Atlantic populations with a time calibrated phylogeny reconstruction, by applying the same mutation rates, the TN93+I substitution model, the strict molecular clock, and the Yule process of speciation (65). The phylogeny was estimated running three independent chains of 50 × 106 generations sampled every 5,000 steps. The adequacy of sampling (ESS > 200) and the convergence of the model were verified with TRACER v 1.7.2, then the replications were combined with LogCombiner 1.10.4 discarding the first 10% generations of each run as burn-in. TreeAnnotator v1.10.4 (58) was used to calculate a maximum clade credibility tree, median values of divergence times, posterior probabilities and bounds for the 95% highest posterior density (HPD) interval. Finally, FigTree v1.4.4 (66) was used to visualize the resulting tree, the means and 95% HPD interval (trees not shown).
The analysis of the new 100 mt-DNA COI sequences, 643 base pairs (bp) long, revealed 21 polymorphic sites, 12 of which parsimony informative. The 20 haplotypes were deposited in GenBank under the following accession number: OR751940–OR751959. On average, medium/high values were measured for the haplotype diversity (Hd=0.666±0.0530) and low values for the nucleotide diversity (π = 0.00181 ± 0.00026). The highest haplotype and nucleotide diversities were found in SE followed by NE, while the lowest in SW (Supplementary Table S3). The AMOVA analysis indicates the existence of an overall significant genetic differentiation among the Sardinian populations (Φst = 0.04358, p < 0.01).
The combination of the new and public sequences resulted in a final alignment with a length of 596 bp, made of 139 sequences, 121 of which from the Mediterranean Sea. A total of 30 haplotypes were found, with an average haplotype and nucleotide diversities of 0.723 ± 0.042 and 0.00341 ± 0.00038, respectively (Table 2). After calculating genetic diversity indices for the two main geographic areas (i.e., Atlantic Ocean and Mediterranean Sea), it becomes evident that the Mediterranean Sea had on average a higher number of haplotypes (30) but lower haplotype and nucleotide diversities (Hd = 0.638 ± 0.05 and π = 0.00187 ± 0.00026) in comparison to the Atlantic Ocean (8 haplotypes, Hd = 0.817 ± 0.073 and π = 0.00293 ± 0.00068; Table 2).
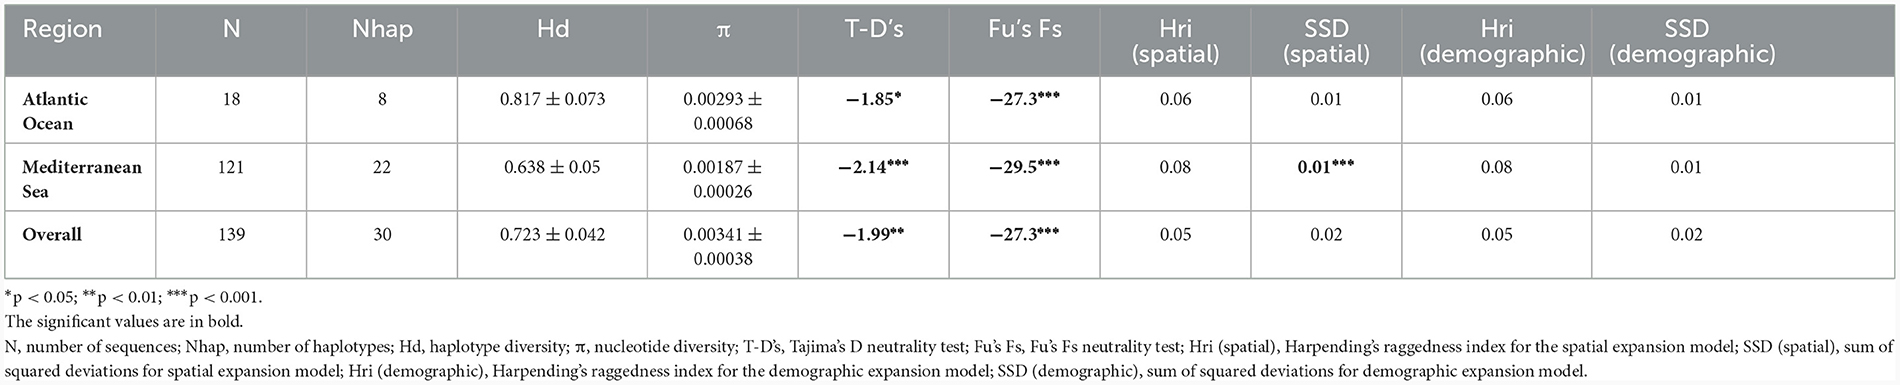
Table 2. Genetic diversity and historical demographic results for populations of C. monstrosa from the Atlantic Ocean and Mediterranean Sea.
The TCS haplotype network (Figure 1) revealed that specimens coming from the Mediterranean Sea and the Atlantic Ocean did not share any haplotype. It is a sort of “Complex Star” network (sensu 58) in which there are a few high-frequency haplotypes and connections: among the 30 haplotypes, the majority were singletons, i.e., present only in one individual, but 11 haplotypes were shared by >2 individuals. The most frequent haplotype in the Atlantic was Hap_21, shared by 7 individuals (5 %) collected in France, Portugal, and Sweden (Supplementary Figure S1). On the other hand, a high frequency haplotype (Hap_1) was shared by 72 CW Mediterranean individuals (corresponding to the 52%), coming from the Ionian Sea, Sicily Channel, Tyrrhenian Sea, Sardinia, Algeria, and Barcelona (Figure 2A). This dominant high frequency haplotype, positioned at the center of the network, is thought to be the ancestral haplotype. Similarly, it is worthy to highlight the occurrence of a haplotype (Hap_20) shared among individuals coming from very distant locations, such as Israel (E Mediterranean), Sicily Channel (Central Mediterranean) and Sardinia (W Mediterranean). On the contrary, a few haplotypes seem to be more localized; for instance, Hap_10 was present only in the Western Mediterranean, particularly abundant in the north Tyrrhenian locations (i.e., TYR, NE). These additional haplotypes are linked to the dominant haplotype by a single (or a few) mutational step(s), suggesting they are the product of recent mutation events (67).
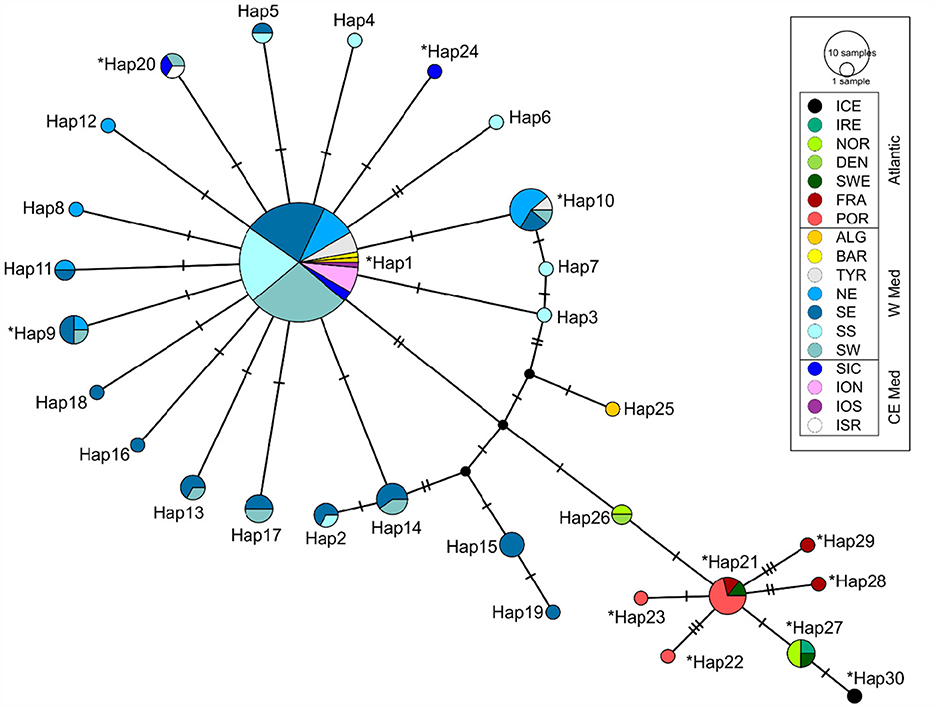
Figure 1. TSC network showing the relationships among the recorded haplotypes of C. monstrosa. Circles representing haplotypes are scaled to their frequencies. Each line represents one mutational step. The asterisk indicates haplotypes described in Catarino et al. (6).
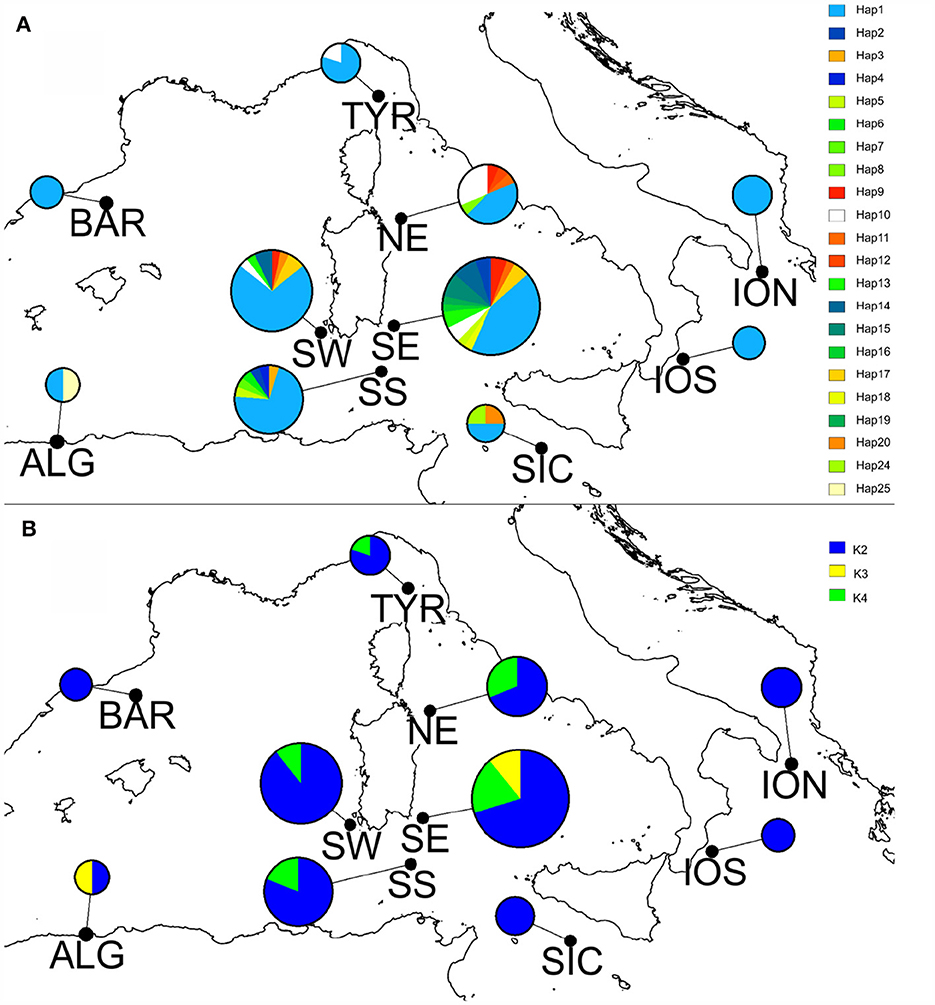
Figure 2. Geographical distribution of haplotypes (A) and of BAPS haplogroups (B) in the CW Mediterranean Sea. Pies represent with different colors haplotypes frequencies (A) and haplogroup frequencies (B). Chart size is drawn proportionally to the number of sequences in each location. On the right of each map are the legends for the haplotype codes (A) and haplogroup (B).
The one-way AMOVA tests indicated the existence of significant genetic differentiation among all populations and between the Atlantic and the Mediterranean (Table 3). The pairwise fixation indices showed that the Atlantic specimens were genetically separated from all the Mediterranean ones with high, significant, Φst values (Figure 3). Within the Mediterranean, only NE was feebly but significantly differentiated from other locations (Figure 3, Supplementary Figure S3).
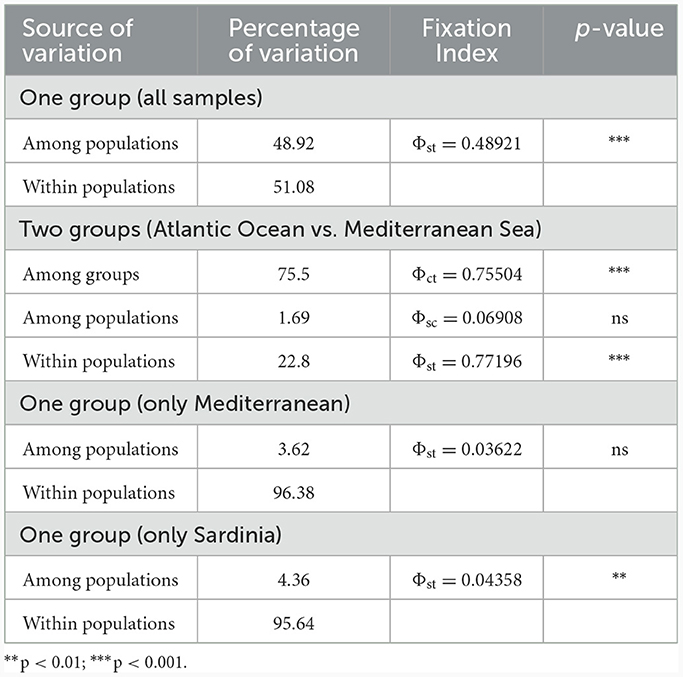
Table 3. Analysis of molecular variance (AMOVA).
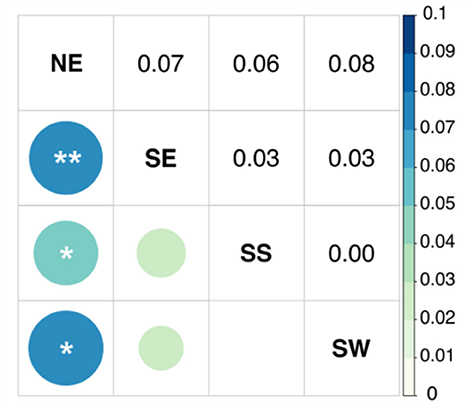
Figure 3. Graphic representation of the matrix depicting pairwise Φst distances between Sardinian locations. Colors representing genetic distances are defined on the scale at the right of the figure. Abbreviations are as defined in the text and in Table 1. Below the diagonal, the areas of squares show the absolute value of the corresponding Φst value. Above the diagonal, the Φst values are shown. **P < 0.01; *P < 0.05.
Bayesian models computed with GENELAND on the whole dataset detected two main clusters (K = 2, Figures 4A, B): cluster A included individuals from the Atlantic Ocean (Figure 4C), while cluster B grouped all the Mediterranean individuals (Figure 4D). The same analysis performed separately for the Mediterranean Sea populations highlighted the existence of only one main cluster in the basin.
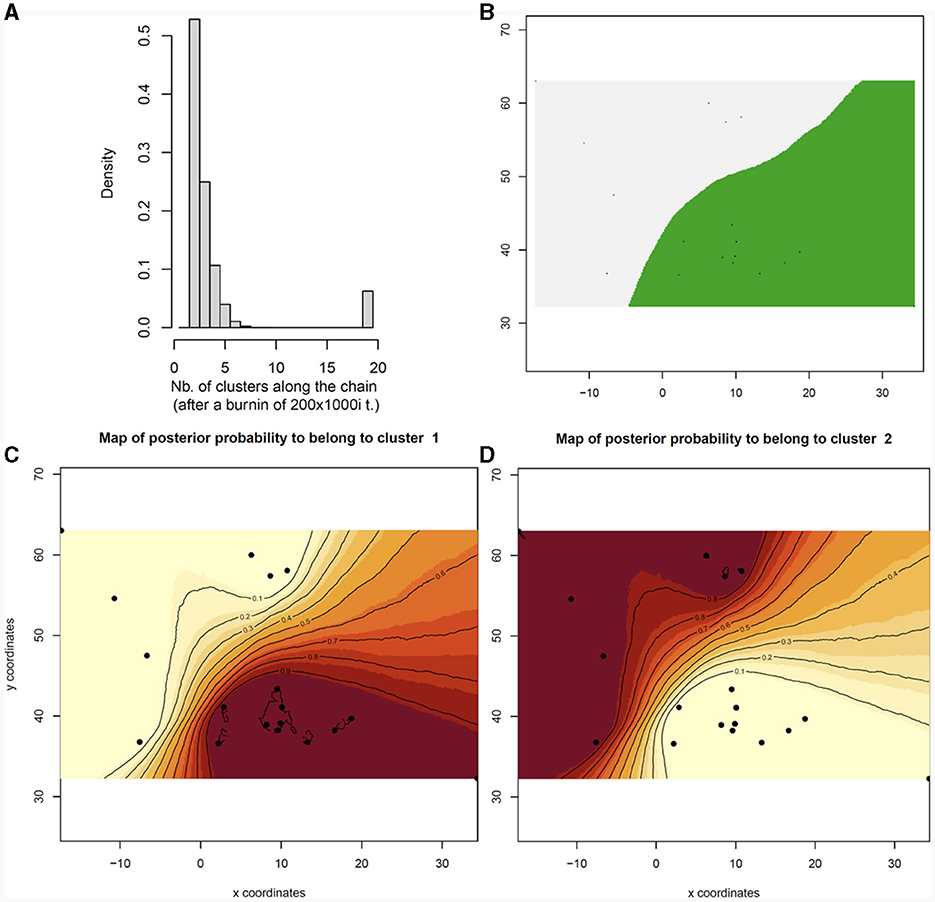
Figure 4. Spatial Bayesian genetic clustering analyses conducted in GENELAND for the rabbit fish (C. monstrosa) in the Mediterranean and Atlantic Ocean. (A) Number of clusters estimated in GENELAND, K = 2 presents the highest density. (B) Map of estimated posterior probability of population membership (by posterior mode) showing K = 2 clusters for the grey area (Atlantic Ocean) and for the green area (Mediterranean Sea). (C, D) Maps of the membership posterior probability to the two genetic clusters based on the Geneland analyses. Black dots indicate the relative positions of the sampled populations. The posterior probability isoclines denote the extent of genetic landscapes. Darker and lighter shading are proportional to posterior probabilities of membership in clusters, with lighter (yellow) areas showing the highest probabilities of clusters. Numbers on x and y-axes are longitude and latitude coordinates, respectively.
On the contrary, the BAPS analysis indicated three as the most probable number of distinct haplogroups (groups of haplotypes). All the Atlantic specimens were assigned together in the first cluster (K1, in red in Supplementary Figure S2). The second cluster (K2, in blue in Supplementary Figure S2, Figure 2B) grouped most of the Mediterranean specimens apart from a few, from Algeria and SE, that were assigned to a distinct third cluster (K3, in yellow in Supplementary Figure S2, Figure 2B). K3 individuals possessed haplotypes (Hap15+Hap19+Hap25) that in the network were the closest to the Atlantic ones (Figure 1).
After removing the divergent Atlantic specimens, the BAPS analysis allowed retrieving a further subdivision within the Mediterranean Sea with a fourth cluster (K4, in green in Figure 2B), corresponding to an additional cluster of W Mediterranean individuals with haplotypes (Hap2+Hpa3+Hap7+Hap10+Hap14) strictly connected in the TCS network to K3 haplotypes.
The neutrality tests provided evidence of departure from mutation-drift equilibrium, since all the tests (Tajima's D and Fu's Fs tests) recorded significant negative values for the overall population and the two geographic groups (i.e., Atlantic Ocean, Mediterranean Sea; Table 2). Considering each Sardinian population, all of them seemed to have experienced a recent population expansion (Supplementary Table S3).
The population demographic history of the Mediterranean Sea and Atlantic Ocean was reconstructed also applying the BSP analysis (Figure 5), which confirmed the population expansion events detected by the neutrality tests, the sum of squared deviations (SSD) and the Harpending's Raggedness Index (Table 2). In particular, the Mediterranean population showed an increase in population size over time, with a clear sign of demographic expansion at a certain time in the past.
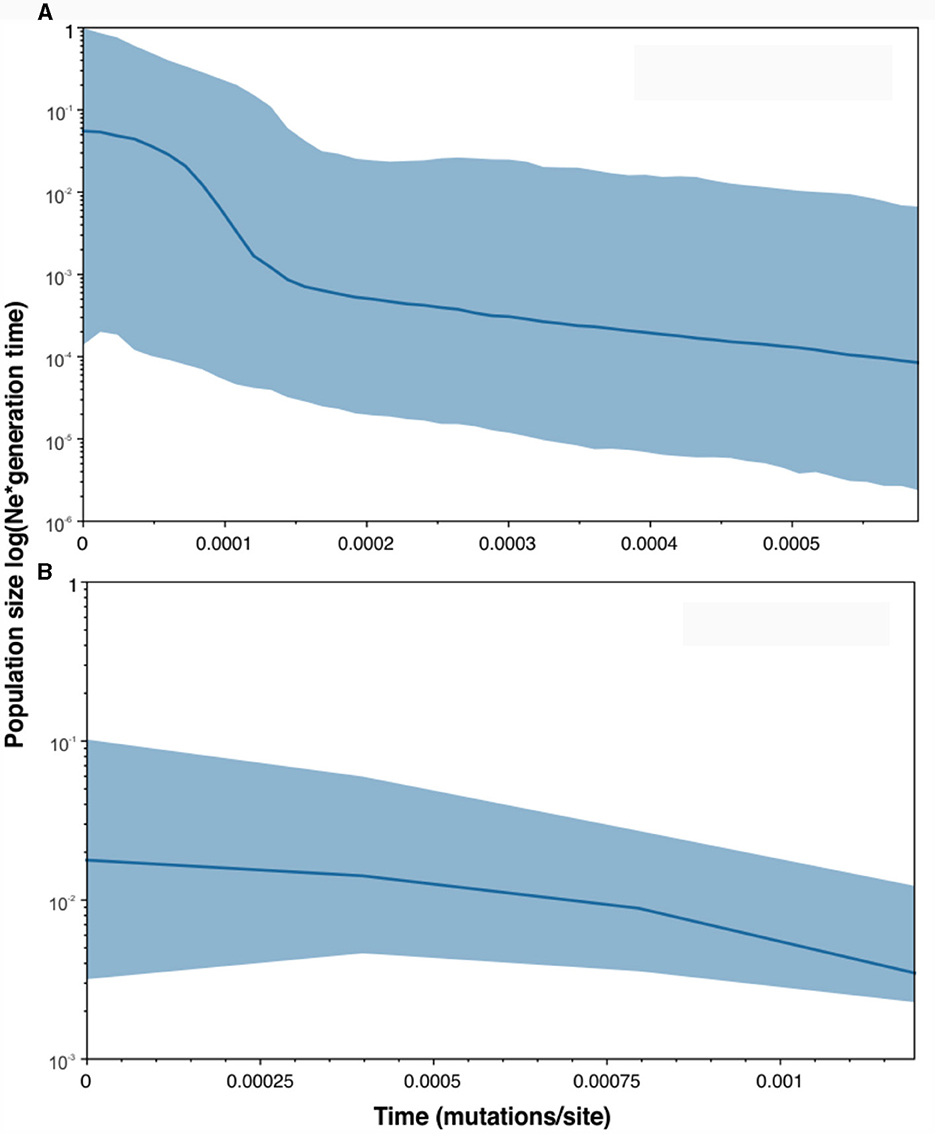
Figure 5. Bayesian Skyline Plots showing changes in effective population size (expressed as effective population size multiplied per generation time) over time (measured in mutations per site) for the Mediterranean Sea (A) and Atlantic Ocean (B) populations. The thick solid line depicts the median estimate, and the shaded area represents the highest 95 % posterior density intervals.
Time since expansion event (in years) was calculated using the formula t = τ/2 μkg (Table 4). Based on the faster fish control region mutation rate (1.8 × 10⁻⁸), the timing of expansion of Mediterranean populations was dated to approximately 17.000 – 72.000 B.P., whereas it was dated to around 39.000–167.000 B.P. when using the slower mean mutation rate for elasmobranchs (7.8 × 10⁻⁹). For Atlantic populations, when applying the faster molecular clock, the expansion was estimated to have occurred at about 27.000–182.000 B.P., while it was estimated at approximately 62.000–420.000 B.P. when using the slower molecular clock.
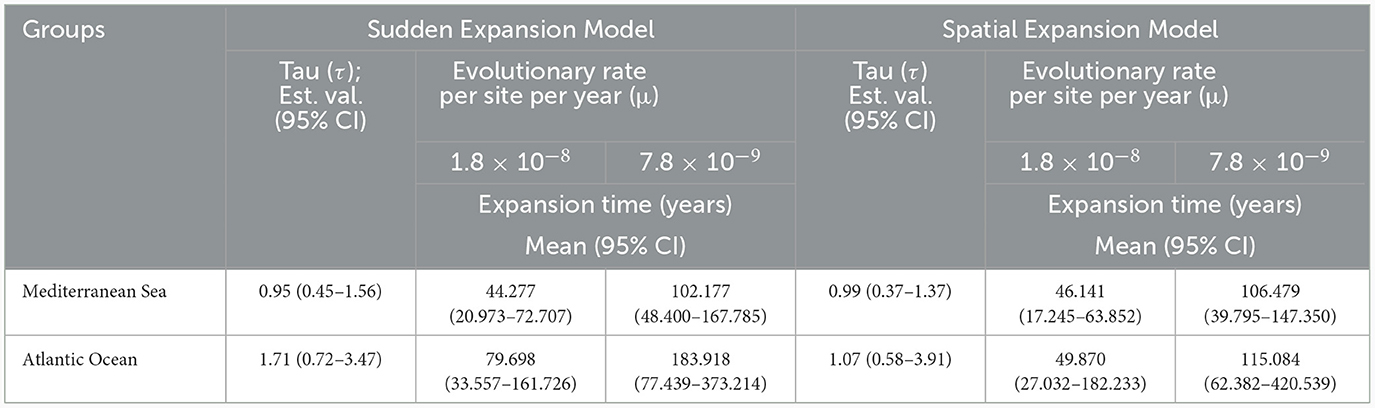
Table 4. The time of the most recent expansion, estimated separately for Mediterranean and Atlantic populations of C. monstrosa, based on the sudden demographic and spatial expansion models for two different mutation rates with 95% CI values.
The phylogenetic reconstruction with BEAST allowed estimating the time of divergence between Mediterranean and Atlantic populations. When applying the faster fish control region mutation rate, the estimated separation between the two populations occurred at about 147.370 B.P. (HPD = 80.480–206.743 B.P.), whereas using elasmobranch mutation rates the split was estimated at 336.837 B.P. (HPD = 188.077–473.796 B.P.).
The deep-sea rabbit fish Chimaera monstrosa is an important part of the bycatch in both the Atlantic Ocean and the Mediterranean Sea, but its populations are currently decreasing. An effective management strategy requires a detailed management plan which in turn is based on updated information about population biology, ecology, and genetics. In this study, the population genetic structure of the rabbit fish was assessed at different spatial scales using mitochondrial DNA. The new data acquired here complement the information obtained in a previous study on the population structure of C. monstrosa (6), performed with the same genetic marker, but on a lower number of individuals sampled in a stricter geographical coverage. Catarino et al. (6), found a marked genetic heterogeneity between Atlantic Ocean and Mediterranean Sea rabbit fish populations which should be considered as two independent evolutionary units and managed accordingly. However, the authors called for further investigations using a more intensive sampling design in a broader geographical context. This has been implemented in the current study, where we analyzed more than >100 new COI sequences, newly obtained in this study or retrieved from public repositories.
Overall, we found a total of 30 haplotypes, of which half (15) were new to science. None of these was shared between the Mediterranean Sea and Atlantic Ocean. Compared to the previous study on C. monstrosa (6), we report a higher number of haplotypes, nucleotide and haplotype diversity for the Mediterranean Sea, although this could be probably related to the higher sampling effort for this basin. Despite the larger sapling effort, Mediterranean populations, taken as a whole, presented a lower intraspecific genetic variation in comparison to the Atlantic ones, as measured by two main genetic diversity indices: haplotype and nucleotide diversities (Table 2). The lower values observed in the Mediterranean could be explained both by biological factors as well as methodological issues. In particular, when the sampling is not optimal, this is a well-known factor that can bias the estimates (68). The disparities between the two areas can be due to differences in the evolutionary history of the two basins, such as the result of a genetic drift in some Atlantic areas due to the past and current isolation, but it could also support the hypothesis of a Mediterranean colonization from an ancestral Atlantic one (69). However, the best explanation is probably the very low number of sampled Atlantic individuals that could have artificially inflated Hd and π estimates as described by Goodall-Copestake et al. (68). Due to the limited sampling effort in the Atlantic Ocean and the uneven distribution of samples in the Mediterranean, further studies are needed to confirm and clarify this outcome.
Even if caution is needed in interpreting the data from the Mediterranean Sea for the over mentioned reasons, our results seem indicate the lack of strong spatial genetic structuring in C. monstrosa within the region. It might be worth to underline the presence of shared haplotypes between Algeria and Sardinia SE as well as between Israel, Sicily Channel and Sardinia SW, which could suggest a high connectivity in the deep. In the Mediterranean Sea, indications of population connectivity were also supported by the non-significant Φst pairwise values between different samples, with very few exceptions involving the north Tyrrhenian area. Similarly, previous investigations of population structure in other deep-sea species, such as the gulper shark [Centrophorus squamosus (16)], the Portuguese dogfish [Centroscymnus coelolepis (19, 70)], the long-nosed velvet dogfish [Centroscymnus crepidater; (14)], the velvet belly lanternshark [Etmopterus spinax; (20)] have not identified any evidence of strong significant differentiation at the intra-oceanic scale.
Nevertheless, BAPS analyses pointed out the occurrence of heterogeneity within the Western Mediterranean basin. Two different genetic haplogroups were identified, restricted to the Algerian and the Tyrrhenian basins. Unfortunately, the available sequences from these areas are currently very few, and it would be useful to collect more individuals from these under-sampled areas. In particular, the Algerian area is worthy of additional investigation to evaluate if it could represent a transitional area between the Atlantic and the rest of the Mediterranean Sea, and in general to describe in detail the direction of migrants and gene flow within the Mediterranean basin.
Significant genetic divergences were measured between the Atlantic and the Mediterranean seas. This has been clearly shown by GENELAND outputs, the pairwise Φst comparisons, and by the AMOVA analyses which revealed a significant high (76%) amount of the total variation partitioned between ocean basins. Similarly, significant population differentiation between the Mediterranean Sea and the adjacent north-eastern Atlantic has been described in previous studies, using both nuclear and mitochondrial markers, for the thornback ray R. clavata (71–74), the longnose skate D. oxyrinchus (75), the small-spotted catshark S. canicula (76–79), the Portuguese dogfish Centroscymnus coelolepis Barbosa du Bocage and Brito Capello, 1864 (19), the velvet belly lanternshark Etmopterus spinax Linnaeus, 1758 (20) and the Blackmouth catshark G. melastomus (80). Of course, this result should be taken with caution since the low number of available sequences for Atlantic areas. Further analyses are indeed needed in order to clarify if there would be a genetic differentiation within the Atlantic populations and, eventually, to set the potential boundaries position between them.
Our analyses also highlighted that the divergence between the Atlantic/Mediterranean stocks occurred during the Sicilian faunal age when shifts in sea level may have hampered the migration of C. monstrosa across the strait of Gibraltar. Since a specific molecular clock is not currently available for Holocephali, the divergence time between Mediterranean and Atlantic populations of C. monstrosa was estimated by applying both the faster fish control region mutation rate and the slower mutation rate for elasmobranchs. The faster molecular clock indicated that the separation between the two populations happened shortly before the end of the Riss glacial period (130.000–250.000 B.P.), whereas the slower clock dated the divergence at the end of the Mindel glacial period (300.000–455.000 B.P.). Hence, the time-calibrated phylogeny suggested that the split occurred toward the end of the Middle Pleistocene. Of course, our dating is only indicative; in fact, to obtain a dating as accurate as possible, it is necessary to be able to specifically calculate the mutation rate of the analyzed molecular marker for the studied species.
The Pleistocene was characterized by cycles of glacial and interglacial periods, with remarkable climatic fluctuations and severe sea-level changes (81). In the Mediterranean Sea, the oscillation of the sea level during the Pleistocene affected its hydraulic connectivity with the Northeast Atlantic, by reducing water flow regimes between the two basins during glacial periods (78). This phenomenon may have limited the migration of rabbit fish across the Strait of Gibraltar, thus favoring genetic differentiation (82, 83). The Pleistocene was indeed a period of intense and periodic ice ages followed by warm interglacial periods which could have favored vicariance and population structure (19, 20, 77, 83). This populations structuring may have been maintained because of the presence of hydrographic fronts that restrict gene flow (84, 85) and/or also because the Strait of Gibraltar may act as a physical barrier to the movement of deep-water species due to its shallow bathymetry (6, 19, 20, 86). Besides the Strait of Gibraltar, Almeria-Oran-Front (AOF) could play a role in limiting gene flow between Mediterranean and Atlantic populations of marine organisms (6, 84), especially those with a pelagic early life stage, due to reductions in the passive movement of pelagic eggs or larvae (84). However, C. monstrosa is a viviparous organism and thus it is less likely that the AOF could have affected the active dispersal of its deep dwelling juveniles. The Strait of Gibraltar is more likely to be involved in restricting the adult migration of deep-sea species without a pelagic early life stage, like the rabbit fish (6, 87). Differences on both sides of the Gibraltar Strait have been detected in populations of deep-sea elasmobranchs such as C. coelolepis (19), C. mediterraneus (6), E. spinax (20), but also in deep-sea bony fishes such as Brosme brosme (88), Coryphaenoides rupestris (89).
All the populations were characterized by low nucleotide diversity values (0.00094–0.00670), in addition to high values of haplotype diversity (0.400–0.803), suggesting an expansion in the past after a period of low effective population size caused by genetic drift (90). Further evidence for population growth have been suggested by the significant negative Tajima's D and Fu's Fs values and non-significant positive Hri and SSD values for most of the populations, which indicate an excess of new mutations concomitant with population growth. The TCS network also supported the presence of many closely related haplotypes, with few of them presenting a widespread distribution, whereas most appeared to be restricted to some areas. The star-shape of the two main haplogroups further suggested population expansion in the two basins, in agreement with the demographic analyses. Furthermore, both molecular clocks used in this study, dated the demographic expansion of the Mediterranean and Atlantic populations of C. monstrosa long before the Last Glacial Maximum (20.000–26.500 B.P.). This seemed to be consistent with other chondrichthyan species that showed signs of population expansion during the Middle and Late Pleistocene (from 35.000 to 580.000 B.P.): the Bluntnose sixgill shark, Hexanchus griseus (91), the thornback ray, Raja clavata (71, 73), the brown ray, Raja miraletus (73), the Blackmouth catshark, Galeus melastomus (73), the small-spotted catshark, Scyliorhinus canicula (73), the longnose skate, Dipturus oxyrinchus (92), and the Mediterranean starry ray Raja asterias (93). This suggested that the Last Glacial Maximum did not strongly affect the demographic history of north-eastern Atlantic and Mediterranean species, but mostly their distribution (71, 73, 83, 94). Both Mediterranean and Atlantic populations of C. monstrosa may have undergone expansion thanks to the presence of potential refugial areas, where they retreated during the decrease in sea level which in turn has caused the reduction of the habitat area of several marine species during glacial phases (95). Such refugia might have allowed the survival of a few local refugial populations, which were later able to recolonize previously glaciated areas. However, the very few sequences available for some areas, especially in the Atlantic Ocean, and the large credible intervals (95% CI) around mean estimates of the expansion event suggested that the timing should be interpreted very carefully. This aspect need to be further investigated by studying regional population genetics, allelic diversity and distribution of mtDNA haplotypes in a larger number of sampling locations, covering a broader geographical area, by using additional nuclear markers and larger sampling sizes.
This study contributed with new data to a relatively limited literature on the population genetics of this vulnerable deep-sea species. The differentiation observed between the Atlantic and Mediterranean rabbit fish populations, as well as the feeble but significant differentiation within the Western Mediterranean Sea deserves additional studies, since it could have important implications for fisheries management. The results, if confirmed by a larger sampling and new analyses with more molecular markers, can contribute to the growing recognition that there are important exceptions to a general paradigm of deep-sea marine species being connected by high levels of gene-flow and representing single stocks over very large geographical scales.
It is known that mtDNA markers do not produce a priori high estimate of gene flow compared to that showed by hypervariable nuclear markers; thus, further genetic studies based on microsatellites or single nucleotide polymorphisms (SNP) could be useful to clarify the level of gene flow within the two geographic areas and to set the exact position of genetic discontinuity between the Mediterranean and Atlantic Ocean.
The original contributions presented in the study are included in the article/Supplementary material, further inquiries can be directed to the corresponding authors.
Ethical review and approval was not required for the animal study because the following information was supplied relating to ethical approvals (i.e., approving body and any reference numbers): samples of rabbitfish individuals analysed in the present work were obtained from commercial and scientific fisheries. The activity was conducted with the observation of the Regulation of the European Parliament and the Council for Fishing in the General Fisheries Commission for the Mediterranean (GFCM) Agreement Area and Amending Council Regulation (EC) No. 1967/2006. This Regulation is de facto the unique authorization needed to conduct this type of activity.
LC: Conceptualization, Data curation, Formal analysis, Investigation, Methodology, Supervision, Visualization, Writing – original draft, Writing – review & editing. AC: Data curation, Formal analysis, Investigation, Writing – original draft, Writing – review & editing. RM: Data curation, Investigation, Resources, Writing – review & editing. SD: Data curation, Methodology, Writing – review & editing. AB: Resources, Writing – review & editing. AS-M: Formal analysis, Methodology, Writing – review & editing. MF: Funding acquisition, Resources, Writing – review & editing. RC: Conceptualization, Data curation, Formal analysis, Funding acquisition, Investigation, Methodology, Project administration, Resources, Supervision, Visualization, Writing – original draft, Writing – review & editing.
The author(s) declare that no financial support was received for the research, authorship, and/or publication of this article.
We thank all contributors to this research. In particular, we are grateful to all the participants in the scientific surveys, as well as the crew of each research vessel for their sampling effort.
The authors declare that the research was conducted in the absence of any commercial or financial relationships that could be construed as a potential conflict of interest.
The author(s) declared that they were an editorial board member of Frontiers, at the time of submission. This had no impact on the peer review process and the final decision.
All claims expressed in this article are solely those of the authors and do not necessarily represent those of their affiliated organizations, or those of the publisher, the editors and the reviewers. Any product that may be evaluated in this article, or claim that may be made by its manufacturer, is not guaranteed or endorsed by the publisher.
The Supplementary Material for this article can be found online at: https://www.frontiersin.org/articles/10.3389/frish.2024.1354791/full#supplementary-material
1. Booke HE. The stock concept revisited: perspectives on its history in fisheries. FishRes. (1999) 43:9–11. doi: 10.1016/S0165-7836(99)00063-6
2. Morato T, Watson R, Pitcher TJ, Pauly D. Fishing down the deep. Fish Fisher. (2006) 7:24–34. doi: 10.1111/j.1467-2979.2006.00205.x
3. Watson RA, Morato T. Fishing down the deep: accounting for within-species changes in depth of fishing. Fisher Res. (2013) 140:63–5. doi: 10.1016/j.fishres.2012.12.004
4. Bernard AM, Finnegan KA, Sutton TT, Eytan RI, Weber MD, Shivji MS. Population genomic dynamics of mesopelagic lanternfishes Diaphus dumerilii, Lepidophanes guentheri, and Ceratoscopelus warmingii (Family: Myctophidae) in the Gulf of Mexico. Deep Sea Res. (2022) 185:103786. doi: 10.1016/j.dsr.2022.103786
5. da Silva Rodrigues Filho LF, de Luna Sales JB. Chondrichthyes-Multidisciplinary Approach. InTech (2017). doi: 10.5772/65879
6. Catarino D, Stankovi, ć D, Menezes G, Stefanni S. Insights into the genetic structure of the rabbit fish Chimaera monstrosa (Holocephali) across the Atlantic-Mediterranean transition zone. J Fish Biol. (2017) 91:1109–1122. doi: 10.1111/jfb.13404
7. Dagit DD, Hareide N, Clò S. Chimaera monstrosa. The IUCN Red List of Threatened Species 2007: e.T63114A12610445 (2007). doi: 10.2305/IUCN.UK.2007.RLTS.T63114A12610445.en
8. García VB, Lucifora LO, Myers RA. The importance of habitat and life history to extinction risk in sharks, skates, rays and chimaeras. Proc R Soc B Biol Sci. (2008) 275:83–9. doi: 10.1098/rspb.2007.1295
9. Simpfendorfer CA, Kyne M. Limited potential to recover from overfishing raises concerns for deep-sea sharks, rays and chimaeras. Environ Conserv. (2009) 36:97–103. doi: 10.1017/S0376892909990191
10. Ragonese S, Vitale S, Dimech M, Mazzola S. Abundances of demersal sharks and chimaera from 1994-2009 scientific surveys in the central Mediterranean Sea. PLoS ONE. (2013) 8:e74865. doi: 10.1371/journal.pone.0074865
11. Sacchi J. Impact of fishing techniques on the continental slope and mitigation measures, primarily focusing on trawling for deep-sea crustaceans and ghost net fishing. In:Würtz M, , editors, Mediterranean Submarine Canyons: Ecology and Governance. Gland; Málaga: IUCN (2012).
12. Dagit DD, Hareide NR. Chimaera monstrosa (Mediterranean assessment). The IUCN Red List of Threatened Species 2016: e.T63114A16563229 (2016). Available online at: https://www.iucnredlist.org/species/63114/16563229 (accessed December 1, 2023).
13. Finucci B. Chimaera monstrosa. The IUCN Red List of Threatened Species 2020: e.T63114A124459382 (2020).
14. Cunha RL, Coscia I, Madeira C, Mariani S, Stefanni S, Castilho R. Ancient divergence in the trans-oceanic deep-sea shark Centroscymnus crepidater. PLoS ONE. (2011) 7:e49196. doi: 10.1371/journal.pone.0049196
15. Catarino D, Stefanni S, Menezes GM. Size distribution and genetic diversity of the offshore rockfish (Pontinus kuhlii) from three Atlantic archipelagos and seamounts. Deep Sea Res. (2013) 98:160–9. doi: 10.1016/j.dsr2.2013.02.010
16. Veríssimo A, McDowell JR, Graves JE. Population structure of a deep-water squaloid shark, the Portuguese dogfish (Centroscymnus coelolepis). ICES J Marine Sci. (2011) 68:555–63. doi: 10.1093/icesjms/fsr003
17. White TA, Stefanni S, Stamford J, Hoelzel AR. Unexpected panmixia in a long-lived, deep-sea fish with well-defined spawning habitat and relatively low fecundity. Mol Ecol. (2009) 18:2563–73. doi: 10.1111/j.1365-294X.2009.04218.x
18. Longmore C, Trueman CN, Neat F, Jorde E, Knutsen H, Stefanni S, et al. Ocean-scale connectivity and life cycle reconstruction in a deep-sea fish. Can J Fisher Aquatic Sci. (2014) 71:1312–23. doi: 10.1139/cjfas-2013-0343
19. Catarino D, Knutsen H, Veríssimo A, Olsen EM, Jorde E, Menezes G, et al. The Pillars of Hercules as a bathymetric barrier to gene flow promoting isolation in a global deep-sea shark (Centroscymnus coelolepis). Mol Ecol. (2015) 24:6061–79. doi: 10.1111/mec.13453
20. Gubili C, Macleod K, Perry W, Hanel, Batzakas I, Farrell ED, et al. Connectivity in the deep: phylogeography of the velvet belly lanternshark. Deep Sea Res. (2016) 115:233–9. doi: 10.1016/j.dsr.2016.07.002
21. Moura T, Silva MC, Figueiredo I. Barcoding deep-water chondrichthyans from mainland Portugal. Marine Freshw Res. (2015) 66:508–17. doi: 10.1071/MF14095
22. Costa FO, Landi M, Martins R, Costa MH, Costa ME, Carneiro M, et al. A ranking system for reference libraries of DNA barcodes: application to marine fish species from Portugal. PLoS ONE. (2012) 7:e35858. doi: 10.1371/journal.pone.0035858
23. Luchetti EA, Iglésias SP, Sellos DY. Chimaera opalescens n. sp., a new chimaeroid (Chondrichthyes: Holocephali) from the north-eastern Atlantic Ocean. J Fish Biol. (2011) 79:399–417. doi: 10.1111/j.1095-8649.2011.03027.x
24. Arnason U, Gullberg A, Janke A. Molecular phylogenetics of gnathostomous (jawed) fishes: old bones, new cartilage. Zool Script. (2001) 30:249–55. doi: 10.1046/j.1463-6409.2001.00067.x
25. Margaryan A, Noer CL, Richter SR, Marlene Elise R, Julie Lee BH, Frederik L, et al. Mitochondrial genomes of Danish vertebrate species generated for the national DNA reference database, DNA mark. Environ DNA. (2021) 3:472–80. doi: 10.1002/edn3.138
26. Ericson PGP, Zuccon D, Nyström Edmark V. A DNA key to Swedish vertebrates -final report. Reports from the Swedish Museum of Natural History. Naturhistoriskariksmuseets småskriftserie (2020).
27. Derouiche I, Neifar L, Gey D, Justine JL, Tazerouti F. Monocotylidae from the olfactory rosette of the rabbit fish, Chimaera monstrosa (Holocephali, Chimaeridae) in deep waters off Algeria. Parasite. (2019) 26:59. doi: 10.1051/parasite/2019060
28. Cariani A, Messinetti S, Ferrari A, Arculeo M, Bonello JJ, Bonnici L, et al. Improving the conservation of Mediterranean chondrichthyans: the ELASMOMED DNA barcode reference library. PLoS ONE. (2017) 12:e0170244. doi: 10.1371/journal.pone.0170244
29. Ward RD, Zemlak TS, Innes BH, Last R, Hebert D. DNA barcoding Australia's fish species. Philos Trans R Soc Lond B Biol Sci. (2005) 360:1847–57. doi: 10.1098/rstb.2005.1716
30. Thompson JD, Higgins DG, Gibson TJ. CLUSTAL W: improving the sensitivity of progressive multiple sequence alignment through sequence weighting, position-specific gap penalties and weight matrix choice. Nucleic Acids Res. (1994) 22:4673–80. doi: 10.1093/nar/22.22.4673
31. Kumar S, Stecher G, Li M, Knyaz C, Tamura K. MEGA X: molecular evolutionary genetics analysis across computing platforms. Mol Biol Evol. (2018) 35:1547. doi: 10.1093/molbev/msy096
32. Ratnasingham S, Hebert D. BOLD: the barcode of life data system. Mol Ecol Notes. (2007) 7:355–64. doi: 10.1111/j.1471-8286.2007.01678.x
33. Rozas J, Ferrer-Mata A, Sánchez-DelBarrio JC, Guirao-Rico S, Librado, Ramos-Onsins SE, et al. DnaSP 6: DNA sequence polymorphism analysis of large data sets. Mol Biol Evol. (2017) 34:3299–302. doi: 10.1093/molbev/msx248
34. Templeton AR, Crandall KA, Sing CF. A cladistic analysis of phenotypic associations with haplotypes inferred from restriction endonuclease mapping and DNA sequence data. III Cladogram estimation. Genetics. (1992) 132:619–33. doi: 10.1093/genetics/132.2.619
35. Clement M, Snell Q, Walke„ Posada D, Crandall K. TCS: estimating gene genealogies. In: Proceeding 16th International Parallel Distributed Processing Symposium. (2002) p. 184.
36. Leigh JW, Bryant D. POPART: full-feature software for haplotype network construction. Meth Ecol Evol. (2015) 6:1110–6. doi: 10.1111/2041-210X.12410
37. Cheng L, Connor TR, Sirén J, Aanensen DM, Corander J. Hierarchical spatially explicit clustering of DNA sequences with BAPS software. Mol Biol Evol. (2013) 30:1224–8. doi: 10.1093/molbev/mst028
38. Parks DH, Mankowski T, Zangooei S, Porter MS, Armanini DG, Baird DJ, et al. GenGIS 2: Geospatial analysis of traditional and genetic biodiversity, with new gradient algorithms and an extensible plugin framework. PLoS ONE. (2013) 8:e69885. doi: 10.1371/journal.pone.0069885
39. Excoffier L, Lischer HE. Arlequin suite ver 3.5: a new series of programs to perform population genetics analyses under Linux and Windows. Mol Ecol Resour. (2010) 10:564–7. doi: 10.1111/j.1755-0998.2010.02847.x
40. Tamura K, Nei M. Estimation of the number of nucleotide substitutions in the control region of mitochondrial DNA in humans and chimpanzees. Mol Biol Evol. (1993) 10:512–26.
41. Darriba D, Taboada GL, Doallo R, Posada D. jModelTest 2: more models, new heuristics and parallel computing. Nat Methods. (2012) 9:772. doi: 10.1038/nmeth.2109
42. Guindon S, Gascuel O. A simple, fast, and accurate algorithm to estimate large phylogenies by maximum likelihood. Syst Biol. (2003) 52:696–704. doi: 10.1080/10635150390235520
43. Li D, Xie Z, Zand M, Fogg T, Dye T. Bon-EV: an improved multiple testing procedure for controlling false discovery rates. BMC Bioinform. (2017) 18:1. doi: 10.1186/s12859-016-1414-x
44. Carvajal-Rodríguez A. Myriads: p-value-based multiple testing correction. Bioinformatics. (2018) 34.6:1043–5. doi: 10.1093/bioinformatics/btx746
45. Lang DT. XML: Tools for Parsing and Generating XML Within R and S-Plus. R package version 3.99-0.14. (2023). Available online at: https://CRAN.R-project.org/package=XML (accessed December 1, 2023).
46. Wei T, Simko V. R Package 'Corrplot': Visualization of a Correlation Matrix (Version 0.92). (2021). Available online at: https://github.com/taiyun/corrplot (accessed December 1, 2023).
47. Bache SM, Wickham H. magrittr: A Forward-Pipe Operator for R. R package version 2.0.3. (2022). Available online at: https://CRAN.R-project.org/package=magrittr (accessed December 1, 2023).
48. Wickham H, François R, Henry L, Müller K, Vaughan D. dplyr: A Grammar of Data Manipulation. R package version 1.1.2. (2023). Available online at: https://CRAN.R-project.org/package=dplyr (accessed December 1, 2023).
49. Guillot G, Mortier F, Estoup A. GENELAND: a computer package for landscape genetics. Mol Ecol Notes. (2005) 5:712–5. doi: 10.1111/j.1471-8286.2005.01031.x
50. R Core Team. R: A Language and Environment for Statistical Computing. Vienna, Austria: R Foundation for Statistical Computing. (2021). Available online at: https://www.R-project.org/ (accessed December 1, 2023).
51. Grant WS. Problems and cautions with sequence mismatch analysis and Bayesian skyline plots to infer historical demography. J Hered. (2015) 106:333–46 doi: 10.1093/jhered/esv020
52. Ramos-Onsins SE, Rozas J. Statistical properties of new neutrality tests against population growth. Mol Biol Evol. (2002) 19:2092–100. doi: 10.1093/oxfordjournals.molbev.a004034
53. Tajima F. Statistical method for testing the neutral mutation hypothesis by DNA polymorphism. Genetics. (1989) 123:585–95. doi: 10.1093/genetics/123.3.585
54. Fu YX. Statistical tests of neutrality of mutations against population growth, hitchhiking and background selection. Genetics. (1997) 147:915–25. doi: 10.1093/genetics/147.2.915
55. Ramirez-Soriano A, Ramos-Onsins SE, Rozas J, Calafell F, Navarro A. Statistical power analysis of neutrality tests under demographic expansions, contractions and bottlenecks with recombination. Genetics. (2008) 179:555–67. doi: 10.1534/genetics.107.083006
56. Harpending HC. Signature of ancient population growth in a low-resolution mitochondrial DNA mismatch distribution. Hum Biol. (1994) 591–600.
57. Drummond AJ, Rambaut A, Shapiro BETH, Pybus OG. Bayesian coalescent inference of past population dynamics from molecular sequences. Mol Biol Evol. (2005) 22:1185–92. doi: 10.1093/molbev/msi103
58. Suchard MA, Lemey P, Baele G, Ayres DL, Drummond AJ, Rambaut A. Bayesian phylogenetic and phylodynamic data integration using BEAST 1.10. Virus Evol. (2018) 4:vey016. doi: 10.1093/ve/vey016
59. Rambaut A, Drummond AJ, Xie D, Baele G, Suchard MA. Posterior summarization in Bayesian phylogenetics using Tracer 1.7. Syst. Biol. (2018) 67:901–4. doi: 10.1093/sysbio/syy032
60. Rogers AR, Harpending H. Population growth makes waves in the distribution of pairwise genetic differences. Mol Biol Evol. (1992) 9:552–69.
61. Suzuki Y, Tomozawa M, Koizumi Y, Tsuchiya K, Suzuki H. Estimating the molecular evolutionary rates of mitochondrial genes referring to Quaternary ice age events with inferred population expansions and dispersals in Japanese Apodemus. BMC Evol Biol. (2015) 15:1–17. doi: 10.1186/s12862-015-0463-5
62. Kozyra K, Zajac TM, Ansorge H, Wierzbicki H, Moska M, Stanko M, et al. Late Pleistocene expansion of small murid rodents across the Palearctic in relation to the past environmental changes. Genes. (2021) 12:642. doi: 10.3390/genes12050642
63. Donaldson KA, Wilson RR Jr. Amphi-panamic geminates of snook (Percoidei: Centropomidae) provide a calibration of the divergence rate in the mitochondrial DNA control region of fishes. Mol Phylogenet Evol. (1999) 13:208–13. doi: 10.1006/mpev.1999.0625
64. Calis E, Jackson EH, Nolan CP, Jeal F. Preliminary age and growth estimates of the rabbit fish, Chimaera monstrosa, with implications for future resource management. J Northwest Atlantic Fish Sci. (2005) 35:15–26. doi: 10.2960/J.v35.m501
65. Gernhard T. The conditioned reconstructed process. J Theor Biol. (2008) 253:769–78. doi: 10.1016/j.jtbi.2008.04.005
66. Rambaut A. FigTree v.1.4.4. (2018). Available online at: http://tree.bio.ed.ac.uk/software/figtree/ (accessed December 1, 2023).
67. Jenkins TL, Castilho R, Stevens JR. Meta-analysis of northeast Atlantic marine taxa shows contrasting phylogeographic patterns following post-LGM expansions. PeerJ. (2018) 6:e5684. doi: 10.7717/peerj.5684
68. Goodall-Copestake WP, Tarling GA, Murphy EJ. On the comparison of population-level estimates of haplotype and nucleotide diversity: a case study using the gene cox1 in animals. Heredity. (2012) 109:50–6. doi: 10.1038/hdy.2012.12
69. Fratini S, Ragionieri L, Deli T, Harrer A, Marino IA, Cannicci S, et al. Unravelling population genetic structure with mitochondrial DNA in a notional panmictic coastal crab species: sample size makes the difference. BMC Evol Biol. (2016) 16:1–15. doi: 10.1186/s12862-016-0720-2
70. Veríssimo A, McDowell JR, Graves JE. Genetic population structure and connectivity in a commercially exploited and wide-ranging deepwater shark, the leafscale gulper (Centrophorus squamosus). Marine Freshw Res. (2012) 63:505–12. doi: 10.1071/MF11237
71. Chevolot M, Hoarau G, Rijnsdorp AD, Stam WT, Olsen JL. Phylogeography population structure of thornback rays (Raja clavata L. Rajidae). Mol Ecol. (2006) 15:3693–705. doi: 10.1111/j.1365-294X.2006.03043.x
72. Pasolini, Ragazzini C, Zaccaro Z, Cariani A, Ferrara G, Gonzalez EG, et al. Quaternary geographical sibling speciation and population structuring in the Eastern Atlantic skates (suborder Rajoidea) Raja clavata and R. Straeleni. Mar Biol. (2011) 158:2173–86. doi: 10.1007/s00227-011-1722-7
73. Ferrari A, Tinti F, Maresca VB, Velonà A, Cannas R, Thasitis I, et al. Natural history and molecular evolution of demersal Mediterranean sharks and skates inferred by comparative phylogeographic and demographic analyses. PeerJ. (2018) 6:e5560. doi: 10.7717/peerj.5560
74. Melis R, Vacca L, Cariani A, Carugati L, Charilaou C, Di Crescenzo S, et al. Baseline genetic distinctiveness supports structured populations of thornback ray in the Mediterranean Sea. Aqu Conserv. (2023) 33:458–71. doi: 10.1002/aqc.3939
75. Griffiths AM, Sims DW, Johnson A, Lynghammar A, McHugh M, Bakken T, et al. Levels of connectivity between longnose skate (Dipturus oxyrinchus) in the Mediterranean Sea and the north-eastern Atlantic Ocean. Conserv Genet. (2011) 12:577–82. doi: 10.1007/s10592-010-0127-3
76. Barbieri M, Maltagliati F, Roldan MI, Castelli A. Molecular contribution to stock identification in the small-spotted catshark, Scyliorhinus canicula (Chondrichthyes, scyliorhinidae). Fish Res. (2014) 154:11–6. doi: 10.1016/j.fishres.2014.01.021
77. Gubili C. A tale of two seas: contrasting patterns of population structure in the small-spotted catshark across Europe. R Soc Open Sci. (2014) 1:140–75. doi: 10.1098/rsos.140175
78. Kousteni V, Kasapidis P, Kotoulas G, Megalofonou P. Strong population genetic structure and contrasting demographic histories for the small-spotted catshark (Scyliorhinus canicula) in the Mediterranean Sea. Heredity. (2015) 114:333–43. doi: 10.1038/hdy.2014.107
79. Melis R, Vacca L, Cariani A, Carugati L, Cau A, Charilaou C, et al. Commercial sharks under scrutiny: baseline genetic distinctiveness supports structured populations of small-spotted catsharks in the Mediterranean Sea. Front Mar Sci. (2023) 10:1050055. doi: 10.3389/fmars.2023.1050055
80. Di Crescenzo S, Ferrari A, Barría C, Cannas R, Cariani A, Drewery J, et al. First evidence of population genetic structure of the deep-water blackmouth catshark Galeus melastomus Rafinesque. Front Mar Sci. (2022) 9:953895. doi: 10.3389/fmars.2022.953895
81. Emig C, Geistdoerfer P. The Mediterranean deep-sea fauna: historical evolution, bathymetric variations and geographical changes. arXiv. (preprint) arXiv: q-bio/0507003. (2004). doi: 10.4267/2042/3230
82. Hewitt GM. Some genetic consequences of ice ages and their role in divergence and speciation. Biol J Linn Soc. (1996) 58:247–76. doi: 10.1006/bijl.1996.0035
83. Larmuseau MH, Van Houdt JK, Guelinckx J, Hellemans B, Volckaert FA. Distributional demographic consequences of Pleistocene climate fluctuations for a marine demersal fish in the north-eastern Atlantic. J Biogeogr. (2009) 36:1138–51. doi: 10.1111/j.1365-2699.2008.02072.x
84. Patarnello T, Volckaert FA, Castilho R. Pillars of Hercules: is the Atlantic–Mediterranean transition a phylogeographical break? Mol Ecol. (2007) 16:4426–44. doi: 10.1111/j.1365-294X.2007.03477.x
85. Pérez-Losada M, Nolte MJ, Crandall KA, Shaw W. Testing hypotheses of population structuring in the Northeast Atlantic Ocean and Mediterranean Sea using the common cuttlefish Sepia officinalis. Mol Ecol. (2007) 16:2667–79. doi: 10.1111/j.1365-294X.2007.03333.x
86. Fernández MV, Heras S, Maltagliati F, Turco A, Roldán MI. Genetic structure in the blue and red shrimp Aristeus antennatus and the role played by hydrographical and oceanographical barriers. Mar Ecol Prog Ser. (2011) 421:163–71. doi: 10.3354/meps08881
87. Tintore J, La Violette E, Blade I, Cruzado A. A study of an intense density front in the eastern Alboran Sea: the Almeria–Oran front. J Phys Oceanogr. (1988) 18:1384–97.
88. Knutsen H, Jorde E, Sannaes H, Rus Hoelzel A, Bergstad OA, Stefanni S, et al. Bathymetric barriers promoting genetic structure in the deepwater demersal fish tusk (Brosme brosme). Mol Ecol. (2009) 18:3151–62. doi: 10.1111/j.1365-294X.2009.04253.x
89. Knutsen H, Jorde E, Bergstad OA, Skogen M. Population genetic structure in a deepwater fish Coryphaenoides rupestris: patterns and processes. Mar Ecol Prog Ser. (2012) 460:233–46. doi: 10.3354/meps09728
90. Aboim MA, Menezes GM, Schlitt T, Rogers AD. Genetic structure and history of populations of the deep-sea fish Helicolenus dactylopterus (Delaroche, 1809) inferred from mtDNA sequence analysis. Mol Ecol. (2005) 14:1343–54. doi: 10.1111/j.1365-294X.2005.02518.x
91. Vella N, Vella A. Population genetics of the deep-sea bluntnose sixgill shark, Hexanchus griseus, revealing spatial genetic heterogeneity. Mar Genomics. (2017) 36:25–32. doi: 10.1016/j.margen.2017.05.012
92. Melis R, Vacca L, Bellodi A, Cau A, Porcu C, Follesa MC, et al. Insights into population genetics, connectivity and demographic history of the longnosed skate Dipturus oxyrinchus (Linnaeus, 1758) in the western Mediterranean Sea. Aquat Conserv. (2020) 30:86–103. doi: 10.1002/aqc.3241
93. Catalano G, Crobe V, Ferrari A, Baino R, Massi D, Titone A, et al. Strongly structured populations and reproductive habitat fragmentation increase the vulnerability of the Mediterranean starry ray Raja asterias (Elasmobranchii, Rajidae). Aquat Conserv. (2022) 32:66–84. doi: 10.1002/aqc.3739
94. Hoarau G, Coyer JA, Veldsink JH, Stam WT, Olsen JL. Glacial refugia and recolonization pathways in the brown seaweed Fucus serratus. Mol Ecol. (2007) 16:3606–16. doi: 10.1111/j.1365-294X.2007.03408.x
Keywords: Chimaera monstrosa, COI, population structure, demography, deep sea, Mediterranean Sea
Citation: Carugati L, Cappelletti A, Melis R, Di Crescenzo S, Bellodi A, Soler-Membrives A, Follesa MC and Cannas R (2024) On the genetic diversity of Chimaera monstrosa Linnaeus, 1758 (Chordata, Chondrichthyes, Holocephali) in the Mediterranean Sea. Front. Fish Sci. 2:1354791. doi: 10.3389/frish.2024.1354791
Received: 13 December 2023; Accepted: 26 January 2024;
Published: 09 February 2024.
Edited by:
Tanja Segvic-Bubic, Institute of Oceanography and Fisheries (IZOR), CroatiaReviewed by:
Marco Casu, University of Sassari, ItalyCopyright © 2024 Carugati, Cappelletti, Melis, Di Crescenzo, Bellodi, Soler-Membrives, Follesa and Cannas. This is an open-access article distributed under the terms of the Creative Commons Attribution License (CC BY). The use, distribution or reproduction in other forums is permitted, provided the original author(s) and the copyright owner(s) are credited and that the original publication in this journal is cited, in accordance with accepted academic practice. No use, distribution or reproduction is permitted which does not comply with these terms.
*Correspondence: Rita Cannas, cmNhbm5hc0B1bmljYS5pdA==; Laura Carugati, bGF1cmEuY2FydWdhdGlAdW5pY2EuaXQ=
†Present address: Alice Cappelletti, IFREMER, Channel and North Sea Fisheries Research Unit, Boulogne-sur-Mer, France; ANSES, Laboratory for Food Safety, Boulogne-sur-Mer, France
Disclaimer: All claims expressed in this article are solely those of the authors and do not necessarily represent those of their affiliated organizations, or those of the publisher, the editors and the reviewers. Any product that may be evaluated in this article or claim that may be made by its manufacturer is not guaranteed or endorsed by the publisher.
Research integrity at Frontiers
Learn more about the work of our research integrity team to safeguard the quality of each article we publish.