
94% of researchers rate our articles as excellent or good
Learn more about the work of our research integrity team to safeguard the quality of each article we publish.
Find out more
ORIGINAL RESEARCH article
Front. Fish Sci., 04 March 2024
Sec. Fish Experimental Biology
Volume 2 - 2024 | https://doi.org/10.3389/frish.2024.1289848
 LeeAnn C. Frank1
 Leteisha A. Prescott2†
 Molly E. Scott3†
 Paolo Domenici4,5*
 Jacob L. Johansen6
 John Fleng Steffensen7
Introduction: Hypoxia, an increasingly common stressor in coastal environments, lowers the scope for aerobic activity such as sustained swimming. This study examines the effect of self-depleting progressive hypoxia on swimming performance and oxygen consumption of the pile perch, Phanerodon vacca, at their optimal speed (Uopt =29 cm·s−1). P. vacca is a labriform, median-paired fin (MPF) swimmer that exhibits a clear gait transition from primarily oxidative muscle-powered, pectoral fin swimming to primarily anaerobic-powered muscle burst swimming using the caudal fin (BCF) when facing high speeds or low oxygen.
Methods and hypothesis: We expected that P. vacca swimming at Uopt would maintain oxygen consumption (ṀO2) alongside decreasing oxygen levels and continue to swim using MPF propulsion until they approached their critical oxygen saturation at their optimal swimming speed (Scrit at Uopt). At this point, we expected a gait transition to occur (i.e., from MPF to BCF propulsion), which is observed by a decrease in pectoral fin beat frequency and an increase in caudal fin or bursting frequency.
Results: In a closed-system swimming respirometer, P. vacca maintained strictly pectoral fin swimming at a consistent frequency and metabolic rate until reaching a critical oxygen saturation at their Scrit at Uopt of 38.6 ± 1.7% air saturation (O2sat). Below Scrit at Uopt, P. vacca significantly increased pectoral fin beat frequency, followed by a transition to caudal bursting at 33.7% O2sat. Switching to burst swimming allowed P. vacca to swim for 44.4 min beyond Scrit at Uopt until reaching 29.2% O2sat. Excess post-hypoxia oxygen consumption (EPHOC) led to a significant increase in metabolic rate during recovery, which took 1.89 h to return to the routine metabolic rate (RMR).
Discussion: Time to return to RMR and EPHOC did not differ when comparing exhaustive exercise and hypoxia exposure, suggesting that this species has an anaerobic energy reserve that does not differ when stressed during hypoxia or exercise. This study demonstrates that in hypoxia, the modulation of swimming mode from pectoral to caudal fin–based locomotion can maintain swimming well below Scrit at Uopt and provides a fundamental understanding of the physiological basis of sustained swimming in hypoxia.
Anthropogenic impacts such as global warming have led to a rise in surface water temperatures, causing a decrease in the solubility of oxygen in the water while increasing the respiration of marine organisms (1). In coastal waters, hypoxia is exacerbated due to an increased input of nutrients and organic matter, commonly leading to eutrophication (2). The cost of swimming is a large portion of a fish's energy budget and is highly dependent on available oxygen. Oxygen availability can affect preferred, maximum, sprint, sustained, and critical swimming speeds (3–9); escape response (10, 11); schooling (12, 13); and swimming mode (14) in fish. Physiological and behavioral changes in swimming influence growth (15), reproduction (16, 17), and, consequently, perceived fitness and survival (18). Because swimming consumes a large portion of a fish's aerobic scope and has a strong influence on many other aspects of fish behavior, more research is needed to determine how swimming is impacted when the aerobic scope is limited by hypoxia.
Previous studies observing the effects of hypoxia on swimming behavior have focused on maximum swimming speed or activity of free-swimming species under hypoxic conditions. Active fish tend to increase swimming speed in hypoxic conditions (likely reflective of an attempt to escape) while benthic, sedentary fish reduce activity and swimming speeds [likely to conserve energy reserves; see review Domenici et al. (4)]. Few studies, however, have examined swimming behavior under controlled hypoxic conditions or in relation to specific swimming modes and speeds. Optimal swimming speed (Uopt), for instance, is the most efficient speed for foraging, migration, and routine behavior because it requires the lowest amount of energy per unit traveled and often reflects the preferred swimming speed of fish (19–21). Indeed, many aquaculture operations maintain fish swimming at Uopt to increase muscle growth and food-conversion efficiency while decreasing stress and disease (22–29). Yet only one study has examined the effects of hypoxia on optimal swimming speed. Vagner et al. (9) demonstrated that flathead mullet swimming at their Uopt during acute hypoxia (15% O2sat) reduced stamina (time to fatigue). They also suggest that anaerobic metabolism was used to maintain swimming speeds during hypoxia because significantly higher ṀO2 occurred after reaching fatigue in hypoxia compared to reaching fatigue in normoxia (>80% O2sat). Further examination of the mechanisms behind swimming performance under hypoxia can be useful for improving models of fish activity during hypoxic events (30–32).
One way to determine the impacts of hypoxia on fish swimming is to investigate swimming mode. Fish in the family Embiotocidae exhibit a clear transition from median-paired fin swimming (MPF; swimming using strictly the pectoral fins) to using body-caudal-fin swimming (BCF; swimming utilizing a combination of the pectoral and caudal fins as speed increases) (33–35). MPF swimming is powered by six major pectoral muscle groups: the abductor superficialis, the arrector ventralis, the abductor profundus, the adductor superficialis, the arrector dorsalis, and the adductor profundus. Whereas the segmented myotomal musculature powers body-caudal movement. This is useful to determine when anaerobic metabolism is used because pectoral fins primarily consist of red oxidative muscle, whereas the segmented mytomal muscle primarily consists of white glycolytic muscle (36, 37). Svendsen et al. (35) examined the transition from MPF-based steady swimming to unsteady BCF-based burst swimming in Embiotoca laterali. The study found bursting to positively correlate with the magnitude of excess post-exercise oxygen consumption (EPOC) (35). Therefore, caudal bursting is a good indication of anaerobically powered swimming.
The reasoning behind the gait transition to unsteady BCF is not fully resolved. Burst-and-coast swimming is triggered in Embiotocidae as swimming speeds increase or oxygen levels decrease (33, 38). Energetic biomechanical models have suggested that burst-and-coast swimming has an energetic advantage over continuous swimming (39, 40), and therefore may be beneficial in hypoxic conditions (14). Dutil et al. (14) supported this argument by showing that burst-and-coast movements in Atlantic cod, Gadus morhua, were more frequent and occurred at lower speeds in hypoxia. Dutil et al.'s results also suggest that a limited aerobic scope can cause a gait transition. Regardless, the gait transition from MPF to burst swimming may allow fish to keep swimming in hypoxic waters once at Uopt and solely aerobic swimming is no longer possible. However, burst-and-coast relies on anaerobic musculature and, therefore, is not sustainable. If hypoxia is prolonged or progresses, the anaerobic metabolites will build to a point at which swimming is no longer supported (35). Understanding the relationship between swimming behavior and decreasing oxygen levels, particularly during and after gait transition, may be crucial for the survival of these fish.
In this study, we tested the effects of hypoxia on swimming mode and metabolism at Uopt in the common pile perch, Phanerodon vacca. This species is in the Embiotocidae family and utilizes an MPF swimming mode with a clear gait transition into BCF bursting as swimming speed increases (34, 41). This is a common recreational fishing species, found in shallow, mid, and deep water, with a wide distribution across the Northeast Pacific Ocean (41, 42). The fjords and the Hood Canal, which P. vacca inhabits, frequently experience hypoxia due to runoff, upwellings, and El Niño events (43–47). Under the common assumption that most fish are oxygen-regulators, meaning that they maintain their metabolic rate over a range of oxygen levels (48, 49), we expect that P. vacca swimming at Uopt in a swim tunnel will maintain oxygen consumption (ṀO2) alongside decreasing oxygen levels and continue to swim using MPF propulsion. However, as oxygen levels approach the critical oxygen saturation at Uopt, the oxygen saturation at which fish can no longer maintain their metabolic rate (Scrit at Uopt), and when activity is supported primarily anaerobically, we expect gait transition to occur (i.e., from MPF to BCF propulsion), which is observed by a decrease in pectoral fin beat frequency and an increase in caudal fin or bursting frequency. As oxygen declines and limits the aerobic scope, swimming would become primarily powered by the anaerobic axial musculature.
We also compared the repayment of oxygen debt accrued during hypoxia vs. exhaustive exercise. Recovery time gives an indication of how long the species is vulnerable to predation after a stressful event. Many species must remain swimming after reaching fatigue due to high currents or predator evasion. Both exhaustive exercise and hypoxia exposure in P. vacca involve burst swimming and anaerobic respiration (50–52). Oxygen levels below Scrit at Uopt suppress adenosine triphosphate (ATP) demand, whereby exhaustive exercise increases ATP demand beyond the ability of oxidative phosphorylation, yet both activate substrate-level phosphorylation (51, 53, 54). This leads to similar end products in both cases, where depleted creatine phosphate and glycogen must be resynthesized (51, 55). Therefore, because exhaustive exercise and hypoxia exposure produce similar end products, we expect the substantial oxygen debt accumulated during progressive hypoxia to be similar to the post-exhaustive exercise oxygen debt, both of which will be repaid during recovery by a significant EPOC. Understanding energy expenditure and fish recovery processes when encountering episodes of hypoxia can inform environmental management by improving optimal foraging models, seasonal fish movement, habitat selection, and fish growth (56–59).
Adult P. vacca (n = 18; total length=14.84 ± 0.55 cm, min = 14.1 cm, max = 15.7 cm; mass = 50.8 ± 6.96 g, min = 41.03 g, max = 65.25 g; means ± SD) were collected using a beach seine net at Jackson's Beach (48.51° N, 123.01° W) (Table 1) on San Juan Island, Washington, USA, in August (52). Fish were held in flow-through aquaria at the University of Washington's Friday Harbor Laboratories at an ambient light regime (12:12). Tanks were continuously supplied with flow-through filtered seawater (approximately 34 ppt) at a mean temperature of 13.16 °C ± 1.70 °C (mean ± SEM) (Table 1). Because the fish were captured at the same location as the water source, there was no need to acclimate to temperature. Fish were fasted for a minimum of 24 h before the experimental trials to ensure that satiation was standardized among individuals (60–62). The experimental protocol was approved by the University of Washington in accordance with Institutional Animal Care and Use Committee standards (IACUC permit no. 52-03).
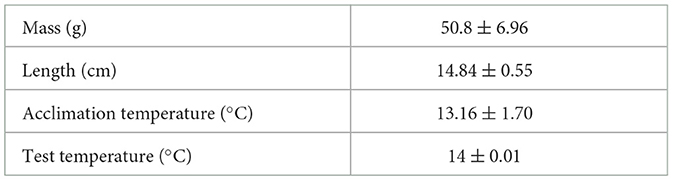
Table 1. Water quality and fish info (mean ± SD).
An 8.31-L clear Plexiglass Steffensen-type respirometer was used for all parts of the experiment (63). Oxygen levels in the respirometer were recorded using a fiber optic oxygen meter (PreSens Fibox 3, Regensburg, Germany), monitored with AutoResp V1 (Loligo Systems, Copenhagen, Denmark). To calibrate the flow, a digital TAD W30 flow meter (Höntzsch, Waiblingen, Germany) was used within the working section of the respirometer to obtain a six-point calibration, ranging from 0 to 75 ± 0.5 cm s−1 (mean ± SEM), a range that fully covers the performance of the test organisms (see Supplementary Figure S1). Solid blocking effects of the fish were corrected by respirometry software (AutoResp V1) using the fractional error formula (64).
Blanks were run after each trial for 30 min to account for bacterial respiration; the background respiration data were then averaged and subtracted from each ṀO2 measurement (20.1 ± 4.7%, O2sat of the average ṀO2 at 0.5 bl s−1; 7.41 ± 0.09 cm s−1). This approach was taken due to the length of the trials and that most ṀO2 values being analyzed were taken toward the end of the trial. ṀO2 values with an R2 value of 0.9 or greater were used for all analysis.
At the start of a trial, fish (n = 8) were removed from the holding tank, and their length, weight, height, and width were measured before being transferred into the respirometer (<1 min air exposure) and allowed to acclimate for 6 to 8 h (flush; 240 s, wait; 60 s, measure; 300 s) at a swimming speed of 0.5 body lengths s−1 (bl s−1; 7.41 ± 0.09 cm s−1) until their oxygen consumption rate stabilized. This speed corresponded to the lowest water flow necessary to ensure constant swimming. Eight fish were used to measure ṀO2 as a function of steady swimming speed (U) starting at 0.5 bl s−1 and increasing flow velocity by increments of 0.5 bl s−1 (7.41 ± 0.09 cm s−1) every 30 min, following a standard critical swimming speed (Ucrit) protocol (65, 66). When the fish were unable to continue swimming, swimming speed was reduced back to 0.5 bl s−1, and the fish were allowed to recover for 3–4 h until ṀO2 returned to within 10% of the pretrial oxygen consumption (i.e., routine metabolic rate, RMR), at 0.5 bl s−1 (67). ṀO2 was calculated using AutoResp V1 as the slope of the linear regression of oxygen concentration decline over time for each determination cycle, using the equation:
where V is the volume of the respirometry chamber in liters and corrected for the body mass of the fish (M, in kg), Δ PO2/t is the change in oxygen partial pressure (kPa) per unit time, and α is the solubility coefficient of oxygen in water (salinity of 35 ppt, 14.0°C) in mg O2 kpa−1. At each swimming speed (i.e., every 30 min), ṀO2 was measured for three 10-min cycles (flush; 240 s, wait; 60 s, measure; 300 s). Cost of transport (COT; an estimate of swimming efficiency relative to distance covered) was later calculated for each swimming speed by dividing ṀO2 by swimming speed. The relationship between COT and swimming speed was then plotted using the equation (68):
where COT is the oxygen uptake rate in mg O2 h−1 and U is the swimming speed in cm s−1. The resulting parabola-shaped plot was fitted to a second-order (k = 2) polynomial regression model and the speed with the lowest COT was determined as the optimal swimming speed (Uopt).
Aerobic scope was determined by fitting each fish's ṀO2 during the Ucrit protocol to a three-parameter power function:
The standard metabolic rate (SMR) was determined by the a parameter, which represents ṀO2 at 0 cm s−1. The maximum metabolic rate (MMR) was the highest ṀO2 observed during the trial. The aerobic scope was determined as MMR – SMR.
Following exhaustion induced by the Ucrit protocol, the fish remained in the swim tunnel respirometer at 0.5 bl s−1 to recover for a minimum of 3 h. This allowed us to measure the oxygen debt (i.e., the amount of oxygen needed to be repaid to tissues and muscles after anaerobic exercise) associated with reaching their critical swimming speed. ṀO2 measurements for each individual fish (n = 8) were fitted to a double exponential decay function using SigmaPlot:
where a, b, c, and d are parameters and t is time in hours.
Time to recovery (trecovery) was determined when the function's upper 95 confidence intervals (CIs) crossed the average ṀO2 in normoxia at 0.5 bl s−1; this is similar to several previous studies (35, 69–71). EPOC was estimated by determining the integral under the curve, the base of which is the average ṀO2 in normoxia at 0.5 bl s−1.
To measure oxygen consumption under hypoxia, naïve fish (i.e., fish not used in the Ucrit trials) were placed in the respirometer and left to acclimate for 6 to 8 h at a swimming speed of 0.5 bl s−1 (flush, 240 s; wait, 60 s; measure. 300 s). The swimming speed was then increased by 0.5 bl s−1 every 30 min until the Uopt was reached. This estimate of Uopt was based on the first three fish runs in the Ucrit protocol and equated to 1.8 bl s−1 (29 cm s−1). This was rounded to 2 bl s−1 (29.6 ± 0.3 cm s−1) for all trials. At the end of the trials, four more individuals were tested (n = 7 total), and the Uopt was found to be 1.9 bl s−1 (29 cm s−1). Each fish was then swum at Uopt for three 10-min cycles (flush, 240 s; wait, 60 s; measure, 300 s) to estimate ṀO2 at Uopt. To ensure only aerobic swimming was occurring, swimming speed was then reduced back to 0.5 bl s−1 (7.41 ± 0.09 cm s−1) for an additional three 10-min cycles to determine if there was any oxygen debt associated with swimming at Uopt. Once validated, swimming speed was then increased back to Uopt for another three 10-min cycles, after which the flush pump was turned off, closing the system. This allowed the fish to deplete O2 in the chamber. During this time, ṀO2 measurements were taken every 10 min without flushing the chamber. At 50% O2sat, the flush pump was turned back on, and O2 levels were replenished back to normoxia within one 240 s flush. ṀO2 was again measured for three 10-min cycles to determine if an oxygen debt was induced at Uopt. Finally, the flush pump was turned off again and, this time, remained off until the fish was unable to swim (Squit), that is, when the tail rested on the back grate for 5 s (Supplementary Figure S2), at which point chamber O2sat was recorded (protocol illustrated in Supplementary Figure S2).
The O2sat at which the fish burst (Sburst), defined by a full oscillation of the body/caudal fin that propelled the fish forward and when the pectoral fins were flush against the body of the fish (72), was observed and recorded for each trial. RMR at 2 bl s−1 (RMR at Uopt) was determined by fitting a double Gaussian curve to ṀO2 measurements >80% O2sat. Elevated values of ṀO2 were excluded using the first (higher) normal distribution, whereas the second normal distribution was used as the best estimate of RMR at Uopt (48, 71, 73, 74). This value was then used as the minimum accepted ṀO2 value (75). The RMR at Uopt was also calculated using the method described by Chabot et al. (76); however, there were no significant differences in RMR at Uopt using either method (Supplementary Table S1) (76). Scrit at Uopt was determined using the calcO2crit and plotO2crit functions in R with the supplementary script provided by Claireaux and Chabot (75). In short, the O2crit function first finds the minimum accepted ṀO2 measurements (ṀO2 measurements in normoxia above the lowest fifth percentile). Since fish were swum at Uopt, Scrit is based on the minimal ṀO2 measurements at Uopt, not 0.5 bl s−1. The first candidate for the breakpoint was then calculated by identifying the ṀO2 at the lowest O2sat. A regression was subsequently calculated using observed ṀO2 measurements at O2sat below the breakpoint and the first estimate of Scrit at Uopt was calculated as the intersection of the regression line and the minimum accepted ṀO2. This was then validated to ensure that the slope does not pass below any ṀO2 values in normoxia or has an intercept greater than 0. See Claireaux and Chabot (75) for the script and details.
Recovery from hypoxia occurred immediately after Squit for a minimum of 3 h (n = 8). Once the pumps were turned on oxygen returned to 84.74 ± 1.44% O2sat within the first cycle (10 min). Unlike EPOC determination, excess post-hypoxia oxygen consumption (EPHOC) was measured at 2 bl s−1. EPHOC and time to recover were calculated in the same way as EPOC with the exception that the average MO2pre − hyp was determined at 2 bl s−1 (29.6 ± 0.3 cm s−1) since this is the speed at which the fish recovered. One fish was excused from the analysis as there were not enough ṀO2 measurements that met the previously mentioned R−2 threshold. A regression was also determined using the average ṀO2 for all fish every 10 min for visualization.
Video recordings were used to analyze fin beat frequency and fin amplitude for three fish during Ucrit trials and for each fish during hypoxia exposure. A GoPro Hero 4 was mounted 27 cm above the chamber, and a mirror was placed at an approximately 45° angle on the side of the tank, allowing the GoPro to capture both top and side view. During the Ucrit protocol, videos were taken for 10–15 min at each speed for three fish. For hypoxia, 15-min recordings were taken at 100%, 50%, and 40%−30% O2sat and around Squit; recordings were between 10–15 min. A Logitech webcam was also set up perpendicular to the swim chamber to monitor the fish without disturbance for the duration of the experiment.
Pectoral fin beat frequency and caudal burst frequency (beats · s−1) were averaged from 3–10 randomly selected 1-min periods within the 15-min videos from each fish taken in normoxia (100–80% O2sat), mild hypoxia (55% O2sat Scrit at Uopt), and severe hypoxia (<Scrit at Uopt). The pectoral fin beat was measured as one entire cycle of the fin, that is, the abduction and adduction movements of the pectoral fin (34, 77). Videos were uploaded to a VLC Media Player (Version 3.0.0 Vetinari; Intel 64 bit) and played at half-speed, and pectoral fin beat frequency was counted using a tally counter.
Pectoral fin amplitude was obtained by measuring the angle of the pectoral fin to the body at full extension (34, 78). Individual frames (60 Hz) from the previously measured 1-min videos were used to measure the angle of the first 10 fin beats (approximately the first 5 s). The frame was uploaded into ImageJ (Version 1.48, National Institutes of Health, USA), and the angle tool was used to measure the angle between the body of the fish and the trailing edge of the pectoral fin.
To illustrate unsteady swimming and fin beat frequency in severe hypoxia, the corrected speed (Uc) and fin beat frequency were calculated for one fish during two burst sequences. Uc was determined by calculating the change in position (ΔD) of the fish over time (T) with consideration of the set speed (Uopt):
Pectoral fin beat frequency was also calculated during this burst sequence by playing the video at 10 Hz for two burst sequences.
To determine if there was an oxygen debt at 50% O2sat, a paired Student's t-test was performed comparing avgṀO2 at 2 bl s−1 in normoxia before depletion to 50% O2sat and after depletion. Comparisons between EPOC vs. EPHOC (magnitude, time to recovery, and peak) were determined by two sample t-tests or a Mann–Whitney rank-sum test if the normality test failed.
Swimming metrics were all modeled using linear mixed-effects models, with the final models selected by Akaike information criterion (AIC). Pectoral fin beat was modeled using a generalized linear mixed-effects model, with a gamma response and log link with fish ID as a random effect and bursting frequency and categorical oxygen level (normoxia, mild hypoxia, and severe hypoxia) as fixed effects. A Tukey post hoc test was then performed to determine the differences in the frequency of categorical oxygen levels after accounting for the effect of fish ID and bursting frequency. Bursting frequency was modeled using a generalized linear mixed-effect model with a binomial response, with fish ID as a random effect and O2sat as a fixed effect. To determine if the presence of bursting was affected by categorical oxygen level, a binomial exact test was performed under the null hypothesis that bursting was equally likely to occur in any category. Pectoral fin amplitude was modeled using a linear mixed-effects model with fish ID as a random effect, and categorical oxygen level, O2sat, and their interaction as fixed effects. Denominator degrees of freedom for both Tukey tests were estimated by the inner–outer method (79) to account for non-independent observations. All statistical analysis was done in R (v 3.6.2, https:/r-project.org/) using the R packages lme4, emmeans, and lmerTest.
The relationship between ṀO2 (in mg O2 h−1) and swimming speed U (in cm s−1) is shown in Figure 1A, fitted by the regression (R2 = 0.87):
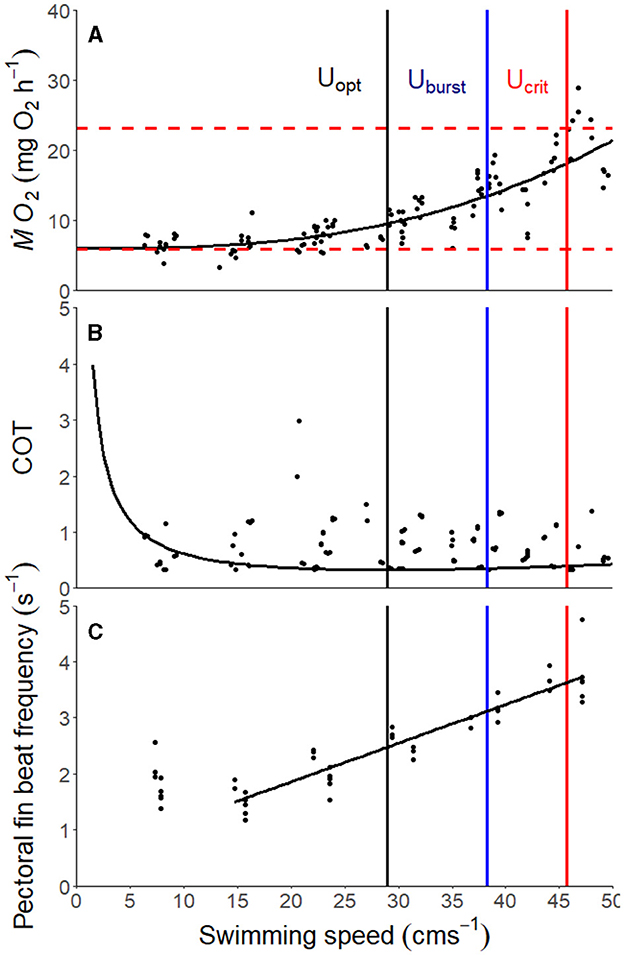
Figure 1. (A) Metabolic costs as a function of swimming speed (U) following Brett's (65) standard critical swimming speed protocol for the pile perch, Phanerodon vacca (n = 8). The function is a power curve fitted on ṀO2 as a function of swimming speed. Gray points represent individual measurements obtained. The standard metabolic rate (SMR) is represented by the lower red dashed line, and the maximum metabolic rate (MMR) is represented by the upper red dashed line equals. (B) Cost of transport (MO2/U) as a function in relation with increasing swimming speeds (U) in the pile perch, Phanerodon vacca. COT was calculated from the derivative of the function of metabolic costs and swimming speed. Uopt, Uburst, and Ucrit are depicted by the black, blue, and red vertical lines, respectively. (C) Pectoral fin beat frequency in relation to swimming speed (U) in the pile perch, Phanerodon vacca.
Ucrit was 45.99 ± 0.87 (mean ± SEM; Figure 1, n = 8). The cost of transport was calculated as
with a Uopt of 29 cm s−1 (Figure 1B).
After acclimation to the respirometers, SMR was estimated to be 5.89 ± 0.42 mg O2 h−1 (mean ± SEM). MMR was 23.16 ± 1.37 mg O2 h−1 (mean ± SEM), leading to an apparent aerobic scope of 17.27 ± 1.11 mg O2 h−1 (mean ± SEM; Figure 1A, Table 2).
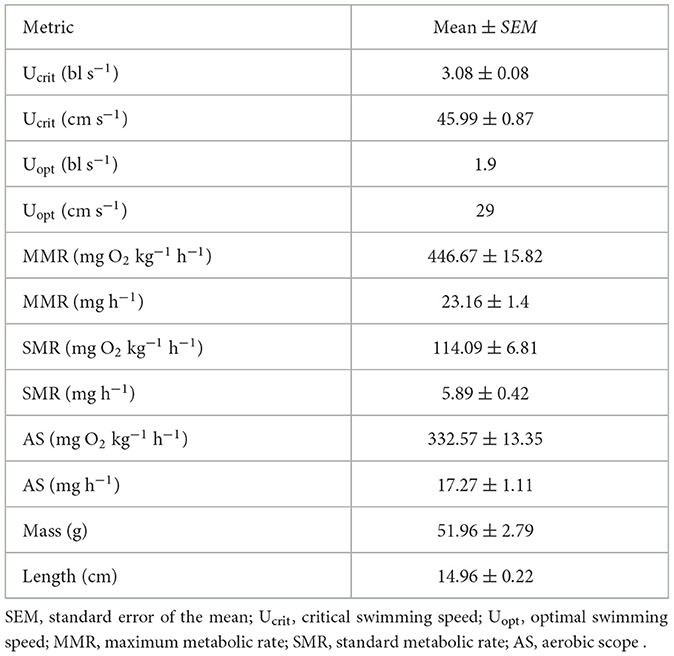
Table 2. Swim performance metrics during determination of Ucrit trials (mean ± SEM, n = 8).
There was a positive relationship between pectoral fin beat frequency (fp) and swimming speed (R2 = 0.88; Figure 1C, Equations 1–9) under normoxic conditions:
This relationship excluded 0.5 bl s−1 because fish swimming behavior was inconsistent at this speed (Figure 1C). The gait transition at which fish first began caudal bursting occurred at 38.29 ± 2.10 cm s−1 (mean ± SEM).
During optimal swimming tests, RMR at Uopt was 8.68 ± 0.48 mg O2 h−1 (mean ± SEM). ṀO2 was maintained until they reached their Scrit at Uopt of 38.58 ± 1.65% O2sat, with fish beginning to burst (Sburst) at 33.68 ± 1.14% O2sat and unable to continue swimming at 29.16 ± 1.43% O2sat (Table 2, Figure 2A). Fish took 4.15 ± 0.32 h to reach Scrit at Uopt and continued to swim below Scrit at Uopt for an average of 44.38 ± 8.0 min (Table 2, Figure 2A). No caudal bursts were observed from any fish (n = 9) when oxygen saturation levels were above Scrit at Uopt. However, below Scrit at Uopt, burst swimming ranged from 0–0.5 bursts s−1, with a mean of 0.10 bursts s−1 (Table 3, Figure 2C). As O2sat decreased, the probability of caudal bursting increased significantly (GLM, p = 0.009). There was strong evidence that Scrit at Uopt was predictive of the occurrence of bursting (binomial exact test, p < 0.0001), as bursting only occurred after Scrit at Uopt.
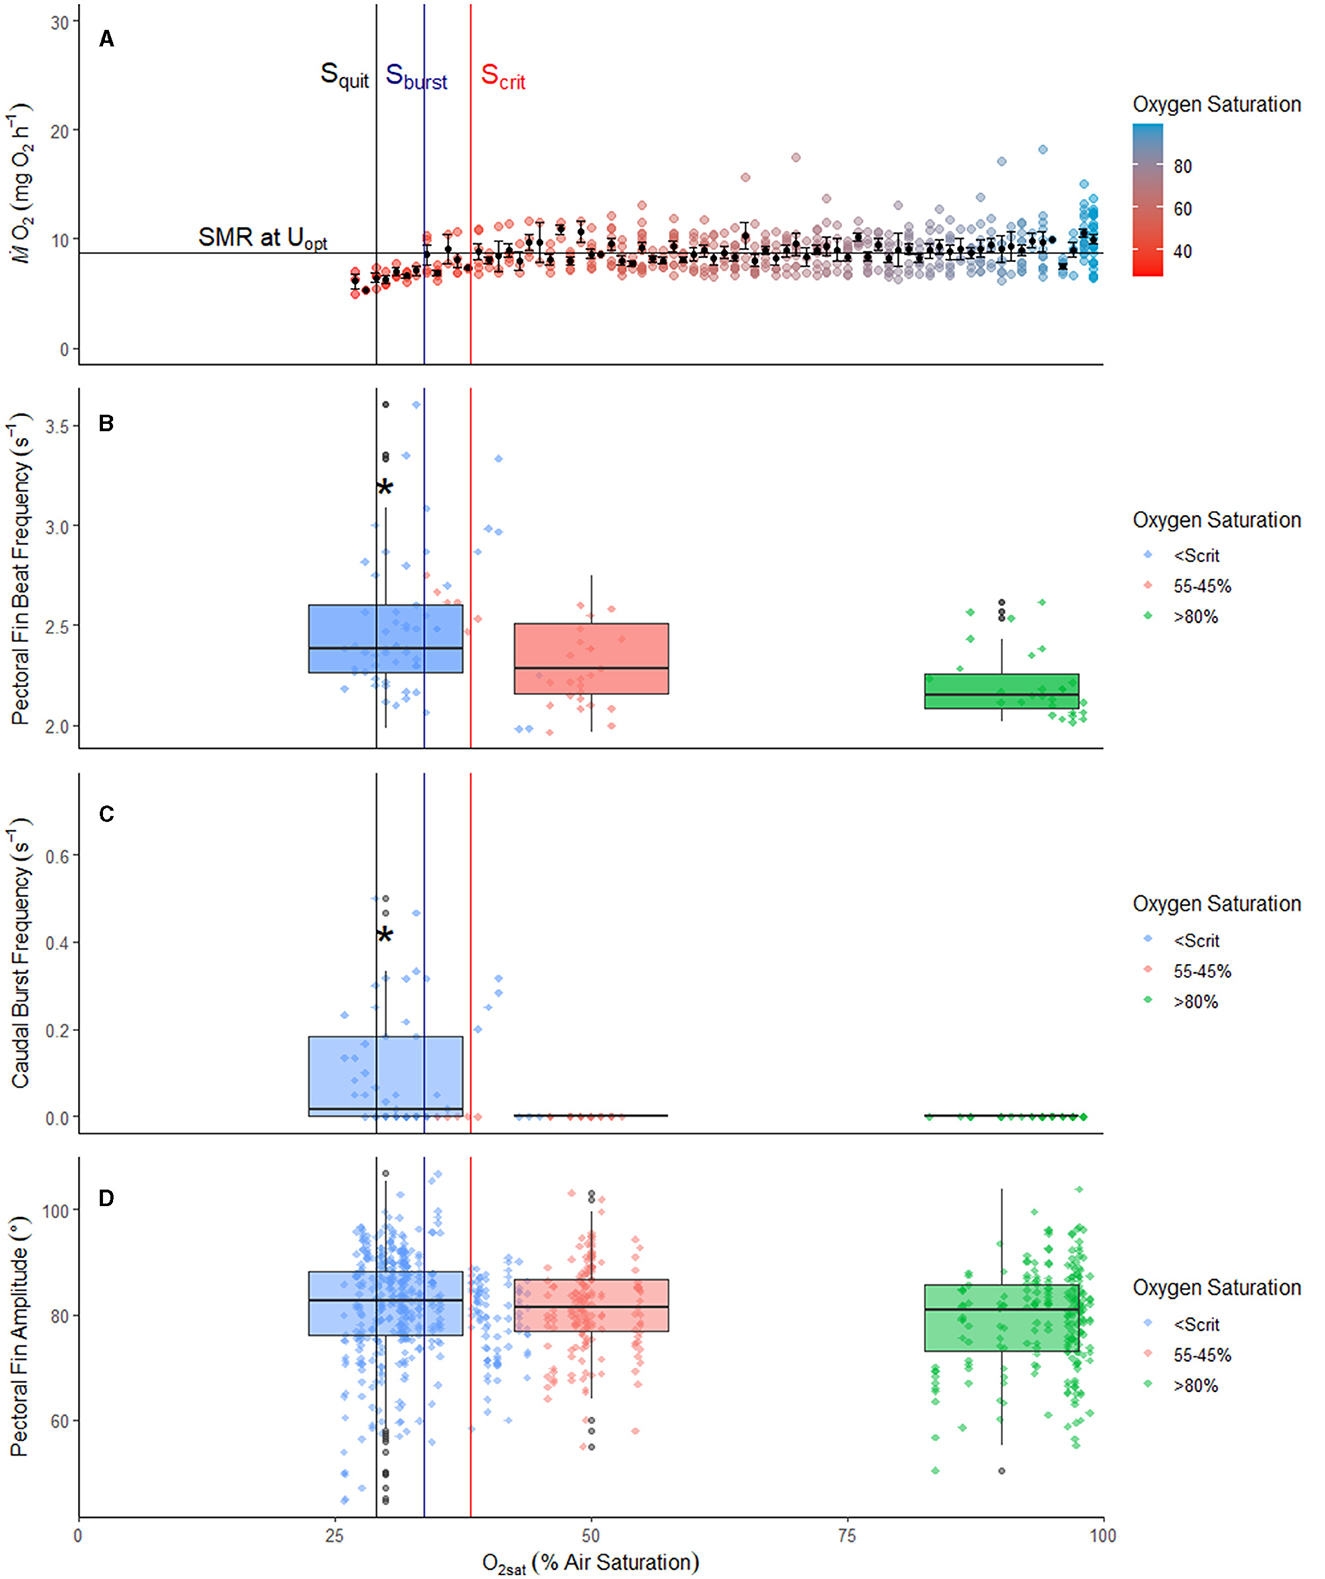
Figure 2. Scrit: Oxygen consumption (A), pectoral fin beat frequency (B), caudal burst frequency (C), and pectoral fin amplitude (D) during progressive hypoxia in the pile perch, Phanerodon vacca, while maintaining optimal swimming speed (i.e., 29 cm s−1). (A) Black points represent the averaged ṀO2 ± SEM per % O2sat, while the gradient points represent the raw ṀO2values at the corresponding saturation value of all fish (n = 9). The horizontal line indicates routine metabolic rate (RMR) at Uopt (8.68 mg O2 h−1). The red, blue, and black vertical lines indicate the average Scrit, Sburst, and Squit, respectively. In (B–D), raw data points are in green, red, or blue depending on oxygen saturation, normoxia, mild hypoxia, or severe hypoxia, respectively. In (A, B), the asterisk indicates a significant difference (general linear model (GLM) followed by a Tukey post hoc test and a binomial exact test, respectively; p < 0.0001).
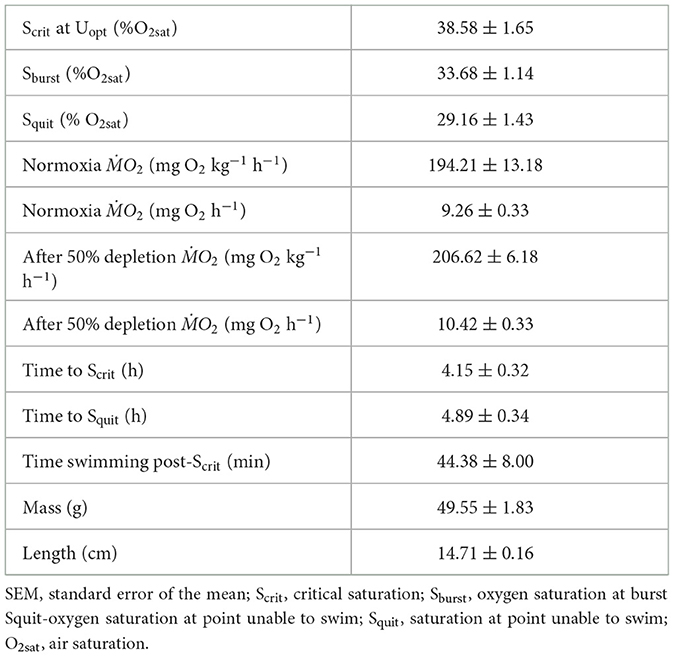
Table 3. Swim performance metrics during hypoxia trials (mean ± SEM, n = 9).
Bursting frequency and the level of oxygen both significantly affected pectoral fin beat frequency (GLM, p < 0.0001), with an increased bursting frequency leading to an increased pectoral fin beat frequency. Pectoral fin beat frequency was consistent from normoxia to mild hypoxia (p = 0.40), but pectoral fin beat frequency below Scrit at Uopt was significantly higher than both normoxia and mild hypoxia after adjusting for the effects of bursting frequency and fish ID in the GLM (Tukey post hoc test, p < 0.0001 and p = 0.001, respectively; Table 3, Figure 2B), with an 8% expected increase in frequency in severe hypoxia compared to normoxia and a 5.6% expected increase in pectoral fin beat frequency from mild hypoxia to severe hypoxia. Pectoral fin amplitude was not significantly different between the levels (Table 3, Figure 2D).
The average ṀO2 at Uopt in > 80% O2sat was 9.26 ± 0.33 (mean ± SEM) mg O2 h−1. The average ṀO2 during recovery after reaching 50% O2sat was 10.42 ± 0.27 mg O2 h−1 (mean ± SEM) and did not differ significantly from normoxia (paired t-test, p > 0.05, Table 2).
Average EPOC (n = 6) was 23.24 ± 10.35 mg O2 with a peak ṀO2 of 17.88 ± 0.94 mg O2 h−1 (mean ± SEM) and took 1.20 ± 0.35 h (mean ± SEM) to return to the average ṀO2. The average EPHOC (n = 8) was 28.01 ± 5.70 mg O2 (mean ± SEM), with a peak ṀO2 of 16.00 ± 0.99 mg O2 h−1, and took 1.93 ± 0.40 h (mean ± SEM) to recover. There were no significant differences between EPOC and EPHOC, peak ṀO2, or trecovery (Mann–Whitney rank-sum test, t-test, and Mann–Whitney rank-sum test, respectively, p > 0.05; Figure 3, Table 4)Two individuals were excluded from the analysis due to insufficient measurements during recovery with an R2 > 0.9 to determine EPOC.
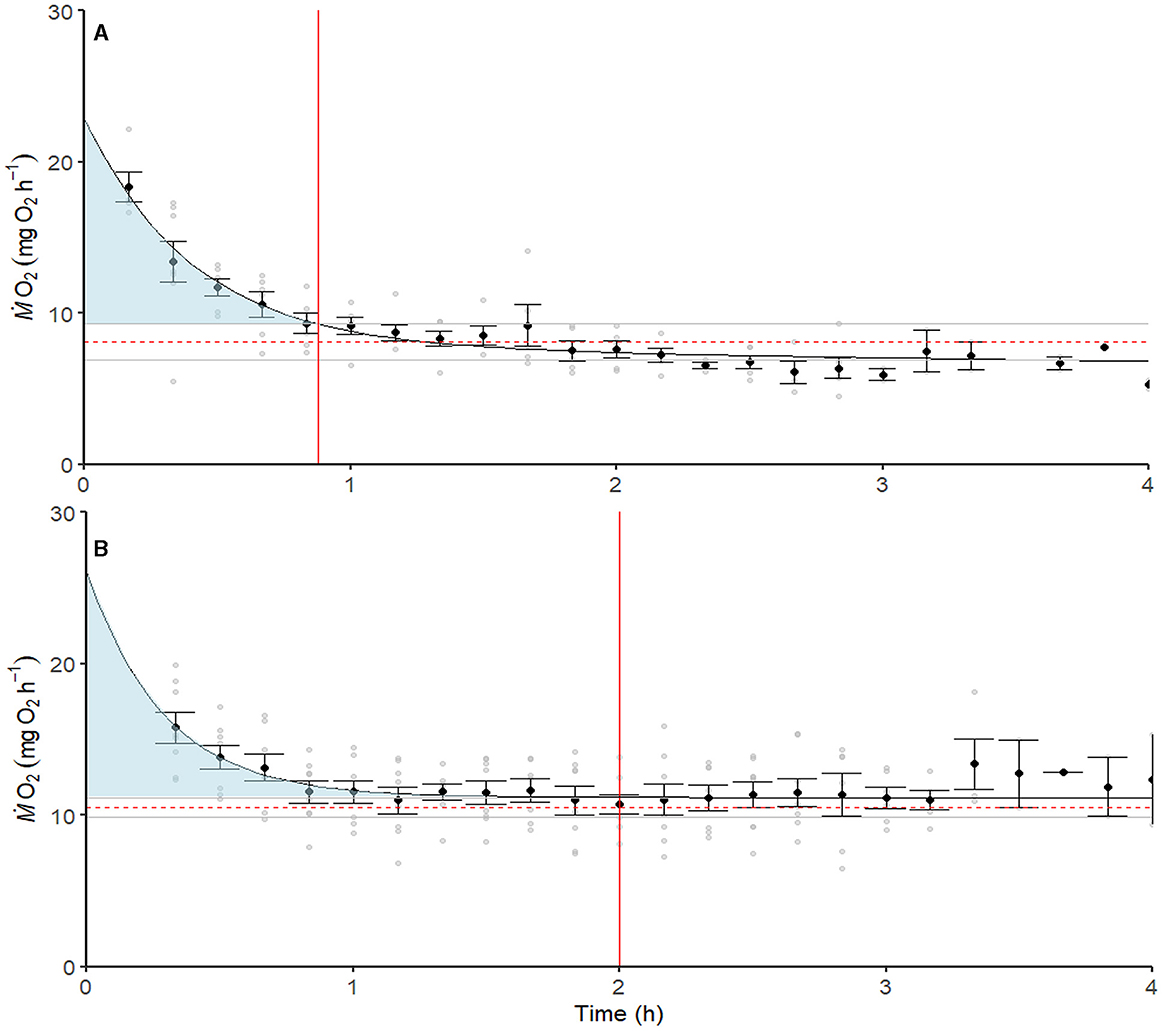
Figure 3. Average recovery from Ucrit (n = 8, A) and hypoxia (n = 8, B), respectively. Black data points represent the average ṀO2 for the time point, while the black line is the double exponential decay function found from the raw ṀO2 points (gray). Fish were deemed recovered from either Ucrit or hypoxia when ṀO2 was within the 95% percentile range of the average ṀO2 indicated by the gray horizontal lines above and below the average ṀO2 (red dashed line).
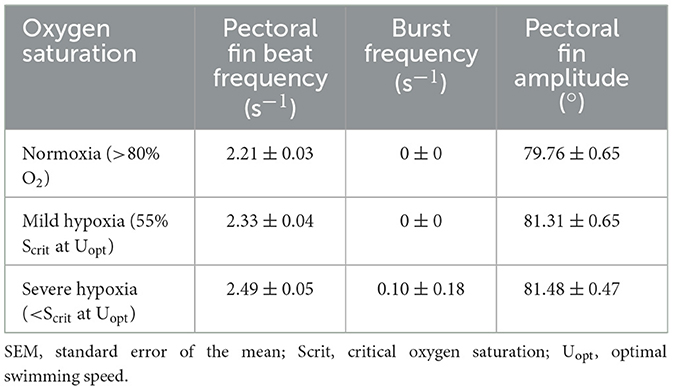
Table 4. Fin beat frequency and amplitude during hypoxia trials (mean ± SEM).
To further examine this unexpected increase in pectoral fin beat frequency, two burst sequences were analyzed in detail, and one sequence visualized from fish 10 (see Supplementary Figure S3). During a burst, the fish propels forward in the swim tunnel, that is, swimming faster than Uopt, then during the glide; maintains its position for a short amount of time before drifting backward, that is, swimming slower than Uopt; and then resumes MPF swimming with the pectoral fins at Uopt. Pectoral fin beat is absent during a burst and glide, but its frequency is increased between bursts as the fish increases its speed back to Uopt, maintaining its position in the center of the tunnel. This is denoted by the increased coefficient in variation in severe hypoxia (0.14 in severe compared to 0.08 in normoxia).
In this study, we showed that P. vacca was able to maintain optimal swimming speed, typically regarded as the most energetically efficient swimming speed and the swimming speed typically associated with long-distance migrations, under hypoxic conditions, even after Scrit at Uopt was reached. Optimal swim speed was maintained at oxygen saturation levels lower than Scrit at Uopt by a partial transition to BCF propulsion. The gait transition from pectoral to unsteady bursting and the accumulated oxygen debt associated with this transition suggests that the continuation of swimming below Scrit at Uopt was aided by a partial shift from aerobic red muscle to anaerobically powered white muscle. This transition, combined with a significant EPHOC, indicates that P. vacca can maintain optimal swimming speed in hypoxic environments and that swimming can occur past Scrit at Uopt, where P. vacca are unable to maintain their routine metabolic rate.
In line with most teleost fish, P. vacca are oxygen regulators and maintained their metabolic rate until Scrit at Uopt (38.6 ± 1.7% O2sat), where they switched from being an oxyregulator to an oxyconformer (48, 80). Yet, once P. vacca reached Scrit at Uopt, they continued swimming for an average of 44.4 min. This was accomplished by exhibiting a gait transition at 33.7% O2sat until they quit at 29.2% O2sat. P. vacca used strictly pectoral fin swimming at a consistent frequency at optimal speed. However, when approaching Scrit at Uopt, pectoral fin beat frequency significantly increased along with a gait transition from strictly pectoral swimming to unsteady bursts using pectoral fins between bursts. During a burst, fish swim faster than 2 bl s−1, glide and, as they drift backward, begin using their pectoral fins at a faster frequency.
The increased frequency can be interpreted through three non-mutually exclusive explanations: (a) P. vacca were briefly swimming slightly faster than the flow when returning to Uopt; (b) swimming in hypoxia may be less efficient than in normoxia (through metrics other than amplitude), and therefore, increased frequency is required to maintain the same speed; and/or (c) while ventilation frequency and synchrony with pectoral fin beats were not measured in this study, the increased pectoral fin beat frequency may be caused by increased ventilation or balancing efforts by P. vacca in severe hypoxia. Some studies show that MPF swimming is less efficient as a trade-off to gain maneuverability (81), while others have shown that MPF swimming is more efficient than BCF swimming due to reduced drag (82, 83). In the white crappie, Pomoxis annularis, a decrease in MO2 was found when they transitioned from MPF to BCF swimming (84).
Conversely, efficiency may have little to do with why gait transition occurs. Cannas et al. (33) found that COT is higher in speeds that require BCF swimming than the theoretical curve extrapolated for MPF swimming in striped surfperch Embiotoca lateralis, and Svendsen et al. (35) found that that the pectoral–caudal gait transition in the same species is driven by a need to supply additional mechanical power rather than to minimize swimming costs. Fish such as the bluegill, Lepomis macrochirus, and the shiner perch, Cymatogaster aggregate, synchronize their ventilation and pectoral fin motion (83, 85). Therefore, if ventilation is increased to extract oxygen in lower PO2 water, pectoral fin frequency may increase as well. Branchial ventilation produces turbulence and therefore increased ventilation efforts have the potential to increase drag (86). Although, to our knowledge, no studies have directly proven that increased ventilation affects propulsive efficiency, the transition from active to ram ventilation in rainbow trout that are swum at a constant speed decreased oxygen consumption by 10.2% (87). Therefore, increased fin beat frequency may be a response to counteract a putative reduction in propulsive efficiency created by increased ventilatory efforts. Some fish also exhibit more erratic behavior while in hypoxia and a loss of equilibrium, and therefore the increased pectoral frequency could be due to increased self-righting efforts.
While fish exhibit a different swimming strategy in hypoxia than in normoxia, our results confirm that they are capable of being active below Scrit at Uopt when forced to do so. This finding corresponds with species like the juvenile yellowtail amberjack, Seriola lalandi, which do not change swimming speed in inescapable hypoxia but transition to burst-and-glide swimming mode to maintain speed (10). In a closely related species, the surfperch, Embiotoca lateralis, swimming activity was also unchanged until below Pcrit, when swimming was reduced (88). Poulsen et al. (89) found that in rainbow trout, Oncorhynchus mykiss, an avoidance of hypoxia was not linked to changes in swimming speeds in mild hypoxia. Gadus morhua and S. lalandi do not exhibit any avoidance behaviors or change in speed in hypoxia if there is a normoxic refuge (10, 90).
These results demonstrate that the point at which fish are unable to maintain ṀO2 (i.e., Scrit at Uopt), is not a predictor of the termination of swimming activity. Scrit at SMR is the limit at which maintenance functions are primarily supported aerobically (80). Measuring swimming performance and behavior as fish face declining oxygen saturation gives insight into how fish may respond when encountering hypoxia. After reaching Scrit at Uopt, caudal (i.e., primarily anaerobic) bursting began, which allowed P. vacca to swim for an additional 44.4 min, which may be critical for survival. This study emphasizes the importance of examining metrics beyond Scrit, such as swimming mode, to estimate hypoxia tolerance in a given species, since both behavior and metabolic activity may play an important role in survival (80, 91, 92). It is important for a fish's survival to consider the behaviors that are occurring at oxygen levels at and below their Scrit while actively swimming.
Anaerobic metabolism, primarily used in powering BCF swimming, produces a buildup of lactic acid and depletion of creatine phosphate and glycogen, creating an oxygen debt that leads to a significant EPHOC (50, 51, 55, 93). Progressive hypoxia exposure at Uopt led to an 83.7% increase in metabolic rate that took 1.9 h to repay. To examine if any oxygen debt was accumulated before Pburst, fish were returned to normoxia after depleting O2sat to 50%. There were no significant differences in ṀO2 after depletion to 50% compared to pre-hypoxia normoxic ṀO2 (Table 2), which suggests that in O2sat greater than Scrit at Uopt, fish do not accumulate an oxygen debt. Furthermore, previous studies in labriform fish have found an absence or scarcity of red myotomal muscles, suggesting the vast majority of caudal bursting behavior was supported by anaerobic metabolism (86, 94–97). These findings echo that of Svendsen (35), who found that the magnitude of EPOC after exercise directly correlated with bursting frequency (although not gait transition). While this study cannot separate how much oxygen debt can be attributed to anaerobic metabolism to power swimming vs. other metabolic processes, it demonstrates the use of anaerobic metabolism to sustain swimming in hypoxic conditions (5, 6, 9, 98).
Previous work comparing a Ucrit protocol vs. a chase protocol suggests that the extent of EPOC may differ depending on the method (99) and that such differences also depend on the species (62). The maximum metabolic rate, time to recover, and oxygen debt during recovery from hypoxia were not statistically different than those found during recovery from excessive exercise (Figure 3, Table 5). Using EPHOC as an estimate for aerobic scope could be especially useful for less active, benthic species, providing a more relevant and reliable estimate. In larval toadfish (Opsanus beta), progressive hypoxia led to a 363% higher MMR than the standard chase and air exposure protocol (100). This agrees with a study in goldfish which found that severe hypoxia (<0.1 mg O2 l−1) and exhaustive exercise both lead to similar increases of ethanol (an anaerobic waste product found in some cyprinids), muscle lactate, phosphocreatine, and metabolic [H+] and took similar times to recover (51). In the common carp, Cyprinus carpio, similar levels of phosphocreatine were depleted and lactate accumulated by both exhaustive exercise and hypoxia, but a lower pH(i), slower recovery, and higher tissue acidification were found after exhaustive exercise compared to hypoxia exposure (55). In rainbow trout (Oncorhynchus mykiss), ṀO2peak after hypoxia exposure was 69.1% of the AS (71). In our study, ṀO2peak after hypoxia exposure was 77.2% of the AS (Table 4). While the variations may be due to differences in protocol or species, the present work suggests that recovery from severe hypoxia exposure consumes the majority of P. vacca's aerobic scope, which leaves them vulnerable to predation and over-exertion if exposed to additional stress after exposure.
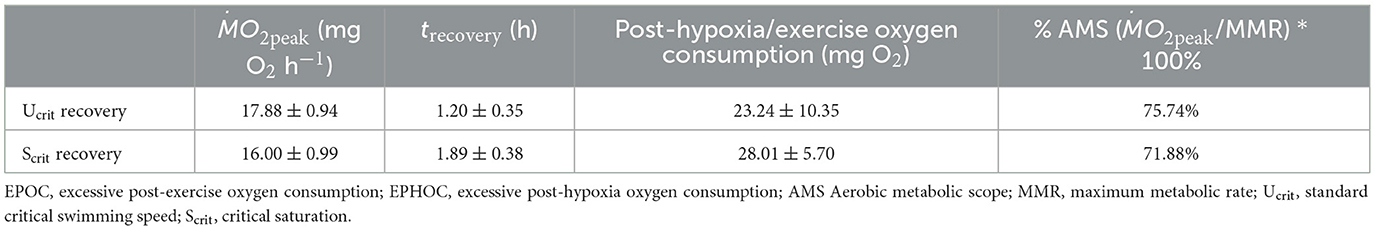
Table 5. Comparison of EPOC and EPHOC.
This study is the first to look at swimming mode and metabolism before, at, and after Scrit at Uopt and shows that P. vacca can maintain swimming at Uopt beyond oxygen tensions in which they can no longer regulate their metabolic rate by transitioning to unsteady burst swimming. P. vacca only resorted to swimming powered primarily by anaerobic glycolysis when aerobic metabolism could no longer be maintained. Understanding how hypoxia affects swimming can help improve models used to predict how these fish and other Embiotocids respond to hypoxia, especially in coastal areas and in environments where fish remain swimming, such as in currents (30–32). Filling the knowledge gap of swimming ability in hypoxia can assist in predicting the relationship between hypoxia exposure, avoidance, and survival. Combining these data with metabolic scope data can be used to forecast fish abundance by modeling the areas in which abiotic factors like temperature and oxygen level allow fish to be within their aerobic metabolic scope (30). This study demonstrates the importance of integrating oxygen consumption with swimming metrics and provides insights on how fish will react, from both a metabolic and a behavioral perspective, when facing hypoxia. Since swimming is energetically costly and can take up a large portion of their aerobic scope, understanding the mechanisms behind fish swimming energetics in various environmental conditions may also help predict fish growth (101, 102), reproduction (103–105), and, consequently, fitness and survival (106–109).
The raw data supporting the conclusions of this article will be made available by the authors, without undue reservation.
The animal study was approved by Institutional Animal Care and Use Committee. The study was conducted in accordance with the local legislation and institutional requirements.
LF: Conceptualization, Data curation, Formal analysis, Investigation, Methodology, Visualization, Writing – original draft, Writing – review & editing. LP: Conceptualization, Data curation, Investigation, Methodology, Writing – original draft, Writing – review & editing. MS: Conceptualization, Data curation, Investigation, Methodology, Writing – original draft, Writing – review & editing. PD: Conceptualization, Funding acquisition, Project administration, Resources, Supervision, Writing – review & editing. JJ: Conceptualization, Formal analysis, Funding acquisition, Resources, Supervision, Writing – review & editing. JS: Funding acquisition, Resources, Software, Supervision, Writing – review & editing.
The author(s) declare that no financial support was received for the research, authorship, and/or publication of this article.
We would like to thank the University of Washington's Friday Harbor Laboratory for hosting the Fish Swimming course where these experiments were held and everyone involved in the course for all their support in fish collection and care.
The authors declare that the research was conducted in the absence of any commercial or financial relationships that could be construed as a potential conflict of interest.
The author(s) declared that they were an editorial board member of Frontiers, at the time of submission. This had no impact on the peer review process and the final decision.
All claims expressed in this article are solely those of the authors and do not necessarily represent those of their affiliated organizations, or those of the publisher, the editors and the reviewers. Any product that may be evaluated in this article, or claim that may be made by its manufacturer, is not guaranteed or endorsed by the publisher.
The Supplementary Material for this article can be found online at: https://www.frontiersin.org/articles/10.3389/frish.2024.1289848/full#supplementary-material
1. Bopp L, Resplandy L, Orr JC, Doney SC, Dunne JP, Gehlen M, et al. Multiple stressors of ocean ecosystems in the 21st century: projections with CMIP5 models. Biogeosciences. (2013) 10:6225–45. doi: 10.5194/bg-10-6225-2013
2. Diaz RJ, Rosenberg R. Spreading dead zones and consequences for marine ecosystems. Science. (2008) 321:926–9. doi: 10.1126/science.1156401
3. Bushnell PG, Brill RW. Responses of swimming skipjack (Katsuwonus pelamis) and yellowfin (Thunnus albacares) tunas to acute hypoxia, and a Model of their Cardiorespiratory Function. Physiol Zool. (1991) 64:787–811. doi: 10.1086/physzool.64.3.30158207
4. Domenici P, Herbert N, Lefrançois C, Steffensen J, McKenzie D. The effect of hypoxia on fish swimming performance and behaviour. In: Swimming Physiology of Fish. Cham: Springer. (2013) p. 129–59.
5. Farrell A, Gamperl A, Birtwell I. Prolonged swimming, recovery and repeat swimming performance of mature sockeye salmon Oncorhynchus nerka exposed to moderate hypoxia and pentachlorophenol. J Exp Biol. (1998) 201:2183–93. doi: 10.1242/jeb.201.14.2183
6. Herbert NA, Steffensen JF. The response Of Atlantic Cod, Gadus morhua, to progressive hypoxia: fish swimming speed and physiological stress. J Marine Biol. (2005) 147:1403–12. doi: 10.1007/s00227-005-0003-8
7. Kraskura K, Nelson JA. Hypoxia sprint swimming performance of juvenile striped bass, Morone saxatilis. Physiol Biochem Zool. (2018) 91:682–90. doi: 10.1086/694933
8. Schurmann H, Steffensen JF. Spontaneous swimming activity of Atlantic cod Gadus morhua exposed to graded hypoxia at three temperatures. J Exp Biol. (1994) 197:129–42. doi: 10.1242/jeb.197.1.129
9. Vagner M, Lefrançois S, Ferrari R, Satta A, Domenici P. The effect of acute hypoxia on swimming stamina at optimal swimming speed in flathead grey mullet Mugil cephalus. Mar Biol. (2008) 155:183–90. doi: 10.1007/s00227-008-1016-x
10. Cook DG, Herbert NA. The physiological and behavioural response of juvenile kingfish (Seriola lalandi) differs between escapable and inescapable progressive hypoxia. J Exp Mar Bio Ecol. (2012) 413:138–44. doi: 10.1016/j.jembe.2011.12.006
11. Lefrançois C, Shingles A, Domenici P. The effect of hypoxia on locomotor performance and behaviour during escape in Liza aurata. J Fish Biol. (2005) 67:1711–29. doi: 10.1111/j.1095-8649.2005.00884.x
12. Domenici P, Steffensen JF, Batty RS. The effect of progressive hypoxia on swimming activity and schooling in Atlantic herring. J Fish Biol. (2000) 57:1526–38. doi: 10.1111/j.1095-8649.2000.tb02229.x
13. Herbert NA, Steffensen JF. Hypoxia increases the behavioural activity of schooling herring: a response to physiological stress or respiratory distress? Mar Biol. (2006) 149:1217–25. doi: 10.1007/s00227-006-0284-6
14. Dutil JD, Sylvestre EL, Gamache L, Larocque R, Guderley H. Burst coast use. swimming performance and metabolism of Atlantic cod Gadus morhua in sub-lethal hypoxic conditions. J Fish Biol. (2007) 71:363–75. doi: 10.1111/j.1095-8649.2007.01487.x
15. Davison W, Herbert N. Swimming-enhanced growth. In: Swimming Physiology of Fish. Cham: Springer. (2013) p. 177–202. doi: 10.1007/978-3-642-31049-2_8
16. Ghalambor CK, Reznick DN, Walker JA. constraints on adaptive evolution: the functional trade-off between reproduction and fast-start swimming performance in the trinidadian guppy (Poecilia reticulata). Am Nat. (2004) 164:38–50. doi: 10.1086/421412
17. Palstra AP, van den Thillart JM. Swimming physiology of European silver eels (Anguilla anguilla L): energetic costs and effects on sexual maturation and reproduction. Fish Physiol Biochem. (2010) 36:297–322. doi: 10.1007/s10695-010-9397-4
18. Domenici P. Context-dependent variability in the components of fish escape response: integrating locomotor performance and behavior. J Exp Zool. (2010) 313:59–79. doi: 10.1002/jez.580
19. Tucker VA. Energetic cost of locomotion in animals. Comp Biochem Physiol. (1970) 34:841–6. doi: 10.1016/0010-406X(70)91006-6
20. Tudorache C, O'Keefe RA, Benfey TJ. Optimal swimming speeds reflect preferred swimming speeds of brook charr (Salvelinus fontinalis Mitchill, 1874). Fish Physiol Biochem. (2011) 37:307–15. doi: 10.1007/s10695-011-9498-8
21. Ware DM. Bioenergetics of pelagic fish: Theoretical change in swimming speed and ration with body size. J Fish Res. (1978) 35:220–8. doi: 10.1139/f78-036
22. Adams CE, Huntingford FA, Krpal J, Jobling M, Burnett SJ. Exercise, agonistic behaviour and food acquisition in Arctic charr, Salvelinus alpinus. Environ Biol Fishes. (1995) 43:213–8. doi: 10.1007/BF00002494
23. Davison W, Goldspink G. The effect of prolonged exercise on the lateral musculature of the brown trout (Salmo trutta). J Exp Biol. (1977) 70:1–12. doi: 10.1242/jeb.70.1.1
24. East P, Magnan P. The effect of locomotor activity on the growth of brook charr, Salvelinus fontinalis Mitchill. Can J Zool. (2011) 65:843–6. doi: 10.1139/z87-134
25. Liu GY, Wu YJ, Qin XH, Shi XT, Wang XL. The effect of aerobic exercise training on growth performance, innate immune response and disease resistance in juvenile Schizothorax prenanti. Aquaculture. (2018) 486:18–25. doi: 10.1016/j.aquaculture.2017.12.006
26. Palstra AP, Planas JV. Fish under exercise. Fish Physiol Biochem. (2011) 37:259–72. doi: 10.1007/s10695-011-9505-0
27. Totland GK, Kryvi H, Jødestøl KA, Christiansen EN, Tangerås A, Slinde E. Growth composition of the swimming muscle of adult Atlantic salmon (Salmo salar L) during long-term sustained swimming. Aquaculture. (1987) 66:299–313. doi: 10.1016/0044-8486(87)90115-3
28. Tudorache C, De Boeck G, Claireaux G. Forced preferred swimming speeds of fish: a methodological approach. In: Swimming Physiology of Fish. (2013) p. 81–108. doi: 10.1007/978-3-642-31049-2_4
29. Young PS, Cech JJ. Optimum exercise conditioning velocity for growth, muscular development, and swimming performance in young-of-the-year striped bass (Morone saxatilis). Can J Fish Aquatic Sci. (1994) 51:1519–27. doi: 10.1139/f94-151
30. Cucco A, Sinerchia M, Lefrançois C, Magni P, Ghezzo M, Umgiesser NA, et al. A metabolic scope based model of fish response to environmental changes. Ecol Modell. (2012) 237–238:132–41. doi: 10.1016/j.ecolmodel.2012.04.019
31. Karim MR, Sekine M, Higuchi T, Imai T, Ukita M. Simulation of fish behavior and mortality in hypoxic water in an enclosed bay. Ecol Modell. (2003) 159:27–42. doi: 10.1016/S0304-3800(02)00282-X
32. LaBone E, Justic D, Rose K, Wang L, Huang H. Modeling fish movement in 3-D in the Gulf of Mexico hypoxic zone. Estuaries and Coasts. (2019) 42:1662–85. doi: 10.1007/s12237-019-00601-6
33. Cannas M, Schaefer J, Domenici P, Steffensen JF. Gait transition And oxygen consumption in swimming striped surfperch Embiotoca lateralis Agassiz. J Fish Biol. (2006) 69:1612–25. doi: 10.1111/j.1095-8649.2006.01225.x
34. Mussi M, Summers A, Domenici P. Gait transition speed, pectoral fin-beat frequency and amplitude in Cymatogaster aggregata, Embiotoca lateralis and Damalichthys vacca. J Fish Biol. (2002) 61:1282–93. doi: 10.1111/j.1095-8649.2002.tb02471.x
35. Svendsen JC, Tudorache C, Jordan AD, Steffensen JF, Aarestrup K, Domenici P. Partition of aerobic and anaerobic swimming costs related to gait transitions in a labriform swimmer. J Exp Biol. (2010) 213:2177–83. doi: 10.1242/jeb.041368
36. Greer-Walker M, Pull G. A survey of red and white muscle in marine fish. J Fish Biol. (1975) 7:295–300. doi: 10.1111/j.1095-8649.1975.tb04602.x
37. Westneat M, Walker J. Motor patterns of labriform locomotion: kinematic and electromyographic analysis of pectoral fin swimming in the labrid fish Gomphosus varius. J Exp Biol. (1997) 200:1881–93. doi: 10.1242/jeb.200.13.1881
38. Drucker EG. The use of gait transition speed in comparative studies of fish locomotion. Am Zool. (1996) 36:555–66. doi: 10.1093/icb/36.6.555
39. Videler J, Weihs D. Energetic advantages of burst-and-coast swimming of fish at high speeds. J Exp Biol. (1982) 97:169–78. doi: 10.1242/jeb.97.1.169
40. Weihs D. Energetic advantages of burst swimming of fish. J Theor Biol. (1974) 48:215–29. doi: 10.1016/0022-5193(74)90192-1
41. Longo G, Bernardi C, Lea RN. Taxonomic revisions within Embiotocidae (Teleostei, Perciformes) based on molecular phylogenetics. Zootaxa. (2018) 4482:591–6. doi: 10.11646/zootaxa.4482.3.10
42. Fritsche R, Nilsson S. Cardiovascular responses to hypoxia in the Atlantic cod, Gadus morhua. J Exp Biol. (1989) 48:153–60.
43. Anderson RD, Chew KK. Preliminary study on the transient species of fish in big beef harbor. Trans Am Fish Soc. (1972) 101:726–9.
44. Connolly T, Hickey B, Geier S, Cochlan W. Processes influencing seasonal hypoxia in the northern California Current System. J GeophysRes: Oceans. (2010) 115. doi: 10.1029/2009JC005283
45. Gasbarro R, Chu JWF, Tunnicliffe V. Disassembly of an epibenthic assemblage in a sustained severely hypoxic event in a northeast Pacific basin. J Marine Syst. (2019) 198:103184. doi: 10.1016/j.jmarsys.2019.103184
46. Grantham BA, Chan F, Nielsen KJ, Fox DS, Barth JA, Huyer A, et al. Upwelling-driven nearshore hypoxia signals ecosystem and oceanographic changes in the northeast Pacific. Nature. (2004) 429:749–54. doi: 10.1038/nature02605
47. Palsson W, Pacunski R, Parra TR, Beam J. The effects of hypoxia on marine fish populations in southern Hood Canal, Washington. Am Fish Soc Symp. (2008) 64:255–80.
48. Steffensen JF. Oxygen consumption of fish exposed to hypoxia:: Are they all oxyregulators or are any oxyconformers? Fish Physiol Toxicol Water Qual. (2007) 2007:239–44.
49. Ultsch GR, Jackson DC, Moalli. Metabolic oxygen conformity among lower vertebrates: the toadfish revisited. J Comparat Physiol. (1981) 142:439–43. doi: 10.1007/BF00688973
50. Hochachka PW, Buck LT, Doll CJ, Land SC. Unifying theory of hypoxia tolerance: molecular/metabolic defense and rescue mechanisms for surviving oxygen lack. Proc Nat Acad Sci. (1996) 93:9493–8. doi: 10.1073/pnas.93.18.9493
51. Mandic M, Lau GY, Nijjar MMS, Richards JG. Metabolic recovery in goldfish: a comparison of recovery from severe hypoxia exposure and exhaustive exercise. Comparat Biochem Physiol Part C. (2008) 148:332–8. doi: 10.1016/j.cbpc.2008.04.012
52. Richards J, Heigenhauser G, Wood C. Glycogen phosphorylase pyruvate dehydrogenase transformation in white muscle of trout during high-intensity exercise. Am J Physiol-Regulat Integrat Comparat Physiol. (2002) 282:R828–36. doi: 10.1152/ajpregu.00455.2001
53. Bickler PE, Buck LT. Hypoxia tolerance in reptiles, amphibians, and fishes: life with variable oxygen availability. Annu Rev Physiol. (2007) 69:145–70. doi: 10.1146/annurev.physiol.69.031905.162529
54. Moyes CD, West TG. Chapter 16 Exercise metabolism of fish. Biochemistry and Mol Biol. (1995) 4:367–392. doi: 10.1016/S1873-0140(06)80019-6
55. Hallman TM, Rojas-Vargas AC, Jones DR, Richards JG. Differential recovery from exercise and hypoxia exposure measured using 31P- and 1H-NMR in white muscle of the common carp Cyprinus carpio. J Exp Biol. (2008) 211:3237–48. doi: 10.1242/jeb.019257
56. Behrens JW, Svendsen JC, Neuenfeldt S, Andersen NG, van Deurs M. Individual variation in aerobic scope affects modeled vertical foraging migration in Atlantic cod Gadus morhua, but only in moderate hypoxia. Mar Ecol Prog Ser. (2018) 599:201–8. doi: 10.3354/meps12629
57. Brijs J, Sandblom E, Axelsson M, Sundell K, H, Sundh H, Huyben D, et al. The final countdown: Continuous physiological welfare evaluation of farmed fish during common aquaculture practices before and during harvest. Aquaculture. (2018) 495:903–911. doi: 10.1016/j.aquaculture.2018.06.081
58. Del Raye G, Weng KC. An aerobic scope-based habitat suitability index for predicting the effects of multi-dimensional climate change stressors on marine teleosts. Deep Sea Res Part II. (2015) 113:280–90. doi: 10.1016/j.dsr2.2015.01.014
59. Kramer DL. Dissolved oxygen and fish behavior. Environ Biol Fishes. (1987) 18:81–92. doi: 10.1007/BF00002597
60. Johansen JL, Vaknin R, Steffensen JF, Domenici P. Kinematics energetic benefits of schooling in the labriform fish, striped surfperch Embiotoca lateralis. Journal of Marine Ecology Progress Series. (2010) 420:221–9. doi: 10.3354/meps08885
61. Niimi A, Beamish F. Bioenergetics growth of largemouth bass (Micropterus salmoides) in relation to body weight and temperature. Can J Zool. (1974) 52:447–56. doi: 10.1139/z74-056
62. Roche DG, Binning SA, Bosiger Y, Johansen JL, Rummer JL. Finding the best estimates of metabolic rates in a coral reef fish. J Exp Biol. (2013) 216:2103–10. doi: 10.1242/jeb.082925
63. Steffensen JF, Johansen K, Bushnell PG. An automated swimming respirometer. J Comparat Biochem Physiol–Part A: Physiol. (1984) 79:437–40. doi: 10.1016/0300-9629(84)90541-3
64. Bell WH, Terhune LDB. Water Tunnel Design for Fisheries Research. Nanaimo, BC: Fisheries Research Board of Canada, Biological Station. (1970).
65. Brett JR. The respiratory metabolism and swimming performance of young Sockeye Salmon. J Fish Res. (1964) 21:1183–226. doi: 10.1139/f64-103
66. Plaut I. Critical swimming speed: its ecological relevance. Comp Biochem Physiol Part A. (2001) 131:41–50. doi: 10.1016/S1095-6433(01)00462-7
67. Krogh A. The quantitative relation between temperature and standard metabolism in animals. (1914) Internationale Zeitschrift für Physikalisch-Chemische Biologie. 1:491–508.
68. Videler JJ. The costs of swimming. In: Fish swimming. Cham: Springer. (1993) p. 185–205. doi: 10.1007/978-94-011-1580-3_9
69. Bushnell P, Steffensen J, Schurmann H, Jones D. Exercise metabolism in two species of cod in arctic waters. Polar Biol. (1994) 14:43–8. doi: 10.1007/BF00240271
70. Scarabello M, Heigenhauser G, Wood C. The oxygen debt hypothesis in juvenile rainbow trout after exhaustive exercise. Respir Physiol. (1991) 84:245–59. doi: 10.1016/0034-5687(91)90121-X
71. Svendsen JC, Steffensen JF, Aarestrup K, Frisk M, Etzerodt A, Jyde M. Excess posthypoxic oxygen consumption in rainbow trout (Oncorhynchus mykiss): Recovery in normoxia and hypoxia. Can J Zool. (2012) 90:1–11. doi: 10.1139/z11-095
72. Videler J. Swimming movements, body structure and propulsion in Cod Gadus morhua. In: Symposium of the Zoological Society of London. London (1981) p. 48.
73. Herskin J. Effects of social and visual contact on the oxygen consumption of juvenile sea bass measured by computerized intermittent respirometry. J Fish Biol. (1999) 55:1075–85. doi: 10.1111/j.1095-8649.1999.tb00742.x
74. Steffensen JF, Bushnell PG, Schurmann H. Oxygen consumption in four species of teleosts from Greenland: no evidence of metabolic cold adaptation. Polar Biol. (1994) 14:49–54. doi: 10.1007/BF00240272
75. Claireaux G, Chabot D. Responses by fishes to environmental hypoxia: integration through Fry's concept of aerobic metabolic scope. J Fish Biol. (2016) 88:232–51. doi: 10.1111/jfb.12833
76. Chabot, D. JF, Steffensen JF, Farrell AP. The determination of standard metabolic rate in fishes. J Fish Biol. (2016) 88:81–121. doi: 10.1111/jfb.12845
77. Drucker E, Jensen J. Pectoral fin locomotion in the striped surfperch. I Kinematic effects of swimming speed and body size. J Exp Biol. (1996) 199:2235–42. doi: 10.1242/jeb.199.10.2235
78. Binning SA, Fulton CJ. Non-lethal measurement of pectoral fin aspect ratio in coral-reef fishes. J Fish Biol. (2011) 79:812–8. doi: 10.1111/j.1095-8649.2011.03070.x
79. Pinheiro J, Bates D. Mixed-effects models in S and S-PLUS. New York, NY: Springer p. 530. (2000).
80. Ultsch GR, Regan MD. The utility and determination of Pcrit in fishes. J Exp Biol. (2019) 222:jeb203646. doi: 10.1242/jeb.203646
82. Korsmeyer KE, Steffensen JF, Herskin J. Energetics of median and paired fin swimming, body and caudal fin swimming, and gait transition in parrotfish (Scarus schlegeli) and triggerfish (Rhinecanthus aculeatus). J Exp Biol. (2002) 205:1253–63. doi: 10.1242/jeb.205.9.1253
83. Webb PW. Synchrony of locomotion and ventilation in Cymatogaster aggregata. Can J Zool. (1975) 53:904–7. doi: 10.1139/z75-104
84. Parsons GR, Sylvester JL. Swimming efficiency of the white crappie, Pomoxis annularis. Copeia. (1992) 1992:1033–8. doi: 10.2307/1446634
85. Tytell ED, Alexander JK. Bluegill Lepomis macrochirus synchronize pectoral fin motion and opercular pumping. J Fish Biol. (2007) 70:1268–79. doi: 10.1111/j.1095-8649.2007.01416.x
86. Freadman M. Swimming energetics of striped bass (Morone saxatilis) and bluefish (Pomatomus saltatrix): hydrodynamic correlates of locomotion and gill ventilation. J Exp Biol. (1981) 90:253–65. doi: 10.1242/jeb.90.1.253
87. Steffensen JF. The transition between branchial pumping and ram ventilation in fishes: energetic consequences and dependence on water oxygen tension. J exp Biol. (1985) 114:141–50. doi: 10.1242/jeb.114.1.141
88. Cook D, Brown E, Lefevre S, Domenici P, Steffensen JF. The response of striped surfperch Embiotoca lateralis to progressive hypoxia: Swimming activity, shoal structure, and estimated metabolic expenditure. J Exp Mar Bio Ecol. (2014) 460:162–9. doi: 10.1016/j.jembe.2014.07.002
89. Poulsen SB, Jensen LF, Nielsen KS, Malte H, Aarestrup K, Svendsen JC. Behaviour of rainbow trout Oncorhynchus mykiss presented with a choice of normoxia and stepwise progressive hypoxia. J Fish Biol. (2011) 79:969–79. doi: 10.1111/j.1095-8649.2011.03069.x
90. Herbert NA, Skjæraasen JE, Nilsen T, Salvanes AGV, Steffensen JF. The hypoxia avoidance behaviour of juvenile Atlantic cod (Gadus morhua L.) depends on the provision and pressure level of an O2 refuge. Mar Biol. (2011) 158:737–746. doi: 10.1007/s00227-010-1601-7
91. Reemeyer JE, Rees BB. Standardizing the determination and interpretation of P[[sb]]crit[[/s]] in fishes. J Exp Biol. (2019) 222:jeb210633. doi: 10.1242/jeb.210633
92. Wood CM. The fallacy of the P[[sb]]crit[[/s]]–are there more useful alternatives? J Exp Biol. (2018) 221. doi: 10.1242/jeb.163717
93. Peake SJ, Farrell AP. Locomotory behaviour and post-exercise physiology in relation to swimming speed, gait transition and metabolism in free-swimming smallmouth bass (Micropterus dolomieu). J Exp Biol. (2004) 207:1563–75. doi: 10.1242/jeb.00927
94. Davison W. The median fin muscles of the leatherjacket, Parika scaber (Pisces: Balistidae). Cell Tissue Res. (1987) 248:131–5. doi: 10.1007/BF01239973
95. Fernández DA, Calvo J, Johnston IA. Characterisation of the swimming muscles of two Subantarctic notothenoids. Sci Mar. (1999) 63:477–84. doi: 10.3989/scimar.1999.63s1477
96. Kronnie GT, Tatarczuch L, Van Raamsdonk W, Kilarski W. Muscle fibre types in the myotome of stickleback, Gasterosteus aculeatus L.; a histochemical, immunohistochemical and ultrastructural study. J Fish Biol. (1983) 22:303–316. doi: 10.1111/j.1095-8649.1983.tb04754.x
97. Martínez II, Cano FG, Zarzosa GR, Vázquez J, Latorre R, Albors OL, et al. Histochemical and morphometric aspects of the lateral musculature of different species of teleost marine fish of the Percomorphi order. Anat Histol Embryol. (2000) 29:211–20. doi: 10.1046/j.1439-0264.2000.00255.x
98. Muusze B, Marcon J, van den Thillart G, Almeida-Val V. Hypoxia tolerance of Amazon fish: respirometry and energy metabolism of the cichlid Astronotus ocellatus. Comp Biochem Physiol Part A. (1998) 120:151–6. doi: 10.1016/S1095-6433(98)10023-5
99. Reidy SP, Nelson JA, Tang Y, Kerr SR. Post-exercise metabolic rate in Atlantic cod and its dependence upon the method of exhaustion. J Fish Biol. (1995) 47:377–86. doi: 10.1111/j.1095-8649.1995.tb01907.x
100. Frank L, Serafy J, Grosell M. A large aerobic scope and complex regulatory abilities confer hypoxia tolerance in larval toadfish, Opsanus beta, across a wide thermal range. Science of The Total Environment. (2023) 899:165491. doi: 10.1016/j.scitotenv.2023.165491
101. Chabot D, Dutil JD. Reduced growth of Atlantic cod in non-lethal hypoxic conditions. J Fish Biol. (1999) 55:472–91. doi: 10.1111/j.1095-8649.1999.tb00693.x
102. Wang T, Lefevre S, Van Cong N, Bayley M. The effects of hypoxia on growth and digestion. In: Fish Physiology. Vol. 27. Amsterdam: Elsevier. (2009) p. 361–396.
103. Wang SY, Lau K, Lai KP, Zhang JW, Tse ACK, Li JW, et al. Hypoxia causes transgenerational impairments in reproduction of fish. Nat Commun. (2016) 7:12114. doi: 10.1038/ncomms12114
104. Wu RSS. Effects of hypoxia on fish reproduction and development. In: Fish Physiology. Amsterdam: Elsevier. (2009) p. 79–141.
105. Wu RSS, Zhou BS, Randall DJ, Woo NYS, Lam PKS. Aquatic hypoxia is an endocrine disruptor and impairs fish reproduction. Environ Sci Technol. (2003) 37:1137–41. doi: 10.1021/es0258327
106. Cheek AO. Diel hypoxia alters fitness in growth-limited estuarine fish (Fundulus grandis). J Exp Mar Bio Ecol. (2011) 409:13–20. doi: 10.1016/j.jembe.2011.07.006
107. DePasquale E, Baumann H, Gobler CJ. Vulnerability of early life stage Northwest Atlantic forage fish to ocean acidification and low oxygen. Mar Ecol Prog Ser. (2015) 523:145–56. doi: 10.3354/meps11142
108. Musa SM, Ripley DM, Moritz T, Shiels HA. Ocean warming and hypoxia affect embryonic growth, fitness and survival of small-spotted catsharks, Scyliorhinus canicula. J Fish Biol. (2020) 97:257–64. doi: 10.1111/jfb.14370
Keywords: respirometry, hypoxia, oxygen debt, optimal speed, critical oxygen tension, fish swimming
Citation: Frank LC, Prescott LA, Scott ME, Domenici P, Johansen JL and Steffensen JF (2024) The effect of progressive hypoxia on swimming mode and oxygen consumption in the pile perch, Phanerodon vacca. Front. Fish Sci. 2:1289848. doi: 10.3389/frish.2024.1289848
Received: 06 September 2023; Accepted: 30 January 2024;
Published: 04 March 2024.
Edited by:
Diana Amaral Monteiro, Federal University of São Carlos, BrazilReviewed by:
Jay A. Nelson, Towson University, United StatesCopyright © 2024 Frank, Prescott, Scott, Domenici, Johansen and Steffensen. This is an open-access article distributed under the terms of the Creative Commons Attribution License (CC BY). The use, distribution or reproduction in other forums is permitted, provided the original author(s) and the copyright owner(s) are credited and that the original publication in this journal is cited, in accordance with accepted academic practice. No use, distribution or reproduction is permitted which does not comply with these terms.
*Correspondence: Paolo Domenici, cGFvbG8uZG9tZW5pY2lAY25yLml0
†These authors have contributed equally to this work
Disclaimer: All claims expressed in this article are solely those of the authors and do not necessarily represent those of their affiliated organizations, or those of the publisher, the editors and the reviewers. Any product that may be evaluated in this article or claim that may be made by its manufacturer is not guaranteed or endorsed by the publisher.
Research integrity at Frontiers
Learn more about the work of our research integrity team to safeguard the quality of each article we publish.