 Monica D. Bacchus
 Paolo Domenici
 Shaun S. Killen
 Mark I. McCormick
 Lauren E. Nadler
- 1Department of Marine and Environmental Sciences, Nova Southeastern University, Dania Beach, FL, United States
- 2Consiglio Nazionale delle Ricerche (CNR)-Instituto di Biofisica (IBF), Institute of Biophysics, Pisa, Italy
- 3College of Medical, Veterinary, and Life Sciences, School of One Health, Biodiversity and Veterinary Medicine, University of Glasgow, Glasgow, United Kingdom
- 4Coastal Marine Field Station, School of Science, University of Waikato, Tauranga, New Zealand
- 5Department of Marine Biology and Aquaculture, ARC Centre of Excellence for Coral Reef Studies, James Cook University, Townsville, QLD, Australia
- 6School of Ocean and Earth Science, University of Southampton, National Oceanography Centre, Southampton, United Kingdom
Introduction: Escaping predation is essential for species survival, but prey must effectively match their response to the perceived threat imposed by a predator. For social animals, one mechanism to reduce risk of predation is living in larger group sizes, which dilutes each individual's risk of capture. When a predator attacks, individuals from a range of taxa (e.g., fishes, sharks, and amphibians) perform an escape response, to evade the attack.
Methods: Using the schooling coral reef damselfish Chromis viridis, we assess if there is an optimal group size that maximizes both individual escape response performance as well as group cohesion and coordination following a simulated predator attack, comparing schools composed of four, eight, and sixteen fish. The escape response was assessed through simulated predator attacks, measuring escape latency, kinematics (average turning rate, and distance covered), and group dynamics (school cohesion and coordination). The experiments were conducted with varying group sizes to analyze the impact on escape performance and group behavior.
Results: We found that fish in various group sizes exhibited no difference in their reaction timing to a simulated predator attack (i.e., escape latency), but larger groups exhibited slower kinematics (i.e., lower average turning rate and shorter distance covered during the escape response), potentially because larger groups perceived the predator attack as less risky due to safety in numbers. Both school cohesion and coordination (as measured through alignment and nearest neighbor distance, respectively) declined in the 100 ms after the predator's attack. While there was no impact of group size on alignment, larger group sizes exhibited closer nearest neighbor distances at all times.
Discussion: The findings suggest that larger group sizes in schooling coral reef fish may lead to energy conservation by displaying less costly behavioral responses to predator threats. This potential energy saving could be attributed to a higher threshold of perceived threat required to trigger a rapid escape response in larger groups. The study emphasizes the intricate interplay between individual and collective behaviors in response to predation and sheds light on the nuanced dynamics of group living in the face of predation.
1 Introduction
Numerous fish species use social behavior as a strategy to reduce the risk of predation and share the costs associated with predator vigilance (1, 2). An individual's vulnerability to predation depends on factors such as the predator's ability to detect the group, the predator's attack rate, and the likelihood of the individual escaping the attack (3). Compared to individuals in smaller shoals, individuals in larger shoals benefit from dilution of individual risk of predation but also face a higher risk of being spotted by predators due to increased visibility (4, 5). When a predator is detected, shoals collectively adapt their response based on available sensory and social information (6–8), with socially transmitted information communicated more effectively when the group exhibits a higher level of organization and greater connectedness between neighbors (9).
However, larger group sizes also come with a tradeoff between the defensive benefits they offer and the increased competition for limited resources like food, habitat, and breeding partners (10, 11). Social fishes may modify their coordination (e.g., polarized alignment) and cohesion (e.g., distance to the nearest neighbor) based on the context. For example, hungrier fish have been shown to become less cohesive, possibly to prioritize individual foraging (12, 13). Conversely, shoals enhance cohesion and coordination when facing threats (14). These tradeoffs lead to an optimal group size that balances the costs of group living against its potential benefits (5, 15, 16). In resource-scarce habitats, smaller groups may be favored over larger groups to minimize competition (1). Conversely, larger groups are likely preferred over smaller groups when predation risk is high (17). Ward and Webster (18) found that mid-sized groups (composed of 12–20 fish) of the three-spined sticklebacks (Gasterosteus aculeatus) balanced decisions related to foraging and risk better than either the smallest (with as few as two fish) or largest group sizes (composed of up to 29 fish) tested. Yet, we know little about the effect of group size on the response to an attacking predator in the crucial first few milliseconds after a predator attacks.
During predator attacks, fishes employ escape responses to swiftly move away from danger, increasing their chances of evading the predator and enhancing survival. These responses involve a high-energy, anaerobic burst of movement, initiated either from rest or routine swimming (19). This burst-swimming behavior can be triggered by the acoustic-lateralis system and the brain stem escape network, including a significant neuron pair called Mauthner cells (M-cells) that process the threat information and rapidly send signals to motor neurons (20–23). While escape responses can occur in the absence of M-cell firing, the reaction timing and angular speed of the response are significantly slower than if the M-cell is stimulated (24). Following activation of this neural network, the body contracts and bends into a C- or S-shape, while typically positioning the head away from the startling stimulus, before rapidly accelerating away from the predator (21, 25). Individuals in social groups must adjust these escape responses to coordinate with their shoal mates, both to limit collisions when moving at high speeds and to maximize predator “confusion” (i.e., the confusion effect, in which predators struggle to focus on a single individual to attack in a rapidly moving and highly coordinated group) (26).
The benefits of social grouping to defense become particularly crucial in coral reef environments, which typically have high predation pressure on small-bodied fishes (27, 28). Social coral reef fishes develop strategies to avoid predation in these environments, with some species relying on the protection provided by living coral structures and displaying high site fidelity (such as many damselfishes from the Pomacentridae family) (29). The blue-green Chromis damselfish Chromis viridis is one example of a site-attached, live-coral associated fish species, ranging in group sizes composed of just three individuals to larger aggregations comprising hundreds of members (30–32). Several factors contribute to this observed variation in group size. Coral cover and structural complexity are vital factors influencing the distribution and group size of C. viridis, with higher coral cover and greater structural complexity offering habitat that can support larger aggregations (33). Predation risk also plays a role, with higher predation pressure leading to larger group formations as a defensive mechanism (34). Additionally, competition for resources, such as food and nesting sites, can impact group size, with larger groups forming in areas with abundant resources (35).
In this study, we compared the collective escape behavior and individual escape response among schools consisting of four, eight, and sixteen individuals of the tropical damselfish species C. viridis, which represent ecologically-relevant group sizes for this species. We hypothesized that schools with fewer individuals would display higher school cohesion and coordination due to a perceived elevated threat level than individuals in larger groups (5), resulting in shorter latency times and higher kinematic performance due to greater connectedness between neighbors (9) and reduced interactions within the smaller group (36). This study seeks to enhance our understanding of the factors influencing escape behavior in animals living in a social context to better understand the fitness consequences for different size groups.
2 Materials and methods
Experimental work was conducted in November to December 2014. The following research was performed with approval from the James Cook University Animal Ethics Committee (approved protocol number A2103), the Great Barrier Reef Marine Park Authority (Permit G13/25909.1), and Queensland Government General Fisheries (Permit 170251).
2.1 Study species, collection, and husbandry
Using monofilament barrier netting, schools of juvenile blue-green Chromis damselfish C. viridis (n = 336 fish) were captured from reefs in the lagoon adjacent to the Lizard Island Research Station (LIRS) in the northern Great Barrier Reef, Australia (14°40′ 08″S; 145°27′34″E) and immediately returned to the flow-through aquarium facilities at LIRS. Schools were maintained in groups of four, eight, and 16 individuals each (n = 36 schools; n = 12 schools per treatment) in 68L tanks (65 cm L × 41 cm W × 40 cm H). Due to the possibility that differences in body size within and among schools could affect performance at both the individual and school level (37), body size variation in terms of standard length was minimized both within schools (0.5 cm range from smallest to largest individual in a group) and among schools (mean standard error: 3.32 cm ± 0.01 cm; range: 2.86 cm−3.70 cm). Fish were fed a body-mass specific diet composed of freshly hatched Artemia spp. and INVE aquaculture pellets twice daily, calculated using the mean mass of all fish (1.96 g) and the number of fish in the tank (4–16 fish per tank). To ensure that each school had sufficient time to recover from the stress of collection, all fish were given 7–10 days following collection before experimental testing. This species can acclimatize to a new social context within 1–2 weeks (26). Fish were maintained in a natural light cycle for the time of year at Lizard Island (13-h light:11-h dark).
2.2 Escape response experimental procedure
Experimental trials were conducted in a laminar flow swim chamber that replicated the natural flow of a coral reef on a calm-weather day (3.2 cm/s; Figure 1) (38). The water conditions (i.e., oxygen, temperature) in the flow chamber were maintained throughout each trial through continuous aeration and a chiller unit in the sump for the swim chamber. The working section measured 50 cm L × 40 cm W (filled to 9 cm depth), resulting in a total two-dimensional area of 2000 cm2, with each fish having 125 cm2 (in groups of 16 fish) to 500 cm2 (in groups of 4 fish) of space on average to execute behavioral responses. Food was withheld from all fish for 6–12 h prior to testing. Once each experimental school was placed in the swim chamber, they were acclimated for 4 h, as preliminary testing indicated that all shoals resumed routine swimming behavior within this time frame following introduction to the swim tunnel (39). Following this acclimation period, the school's escape response was stimulated using a standardized and reproducible threat protocol, in which a black tapered test tube (2.5 cm diameter × 12 cm length, 37.0 g) was released remotely from 137 cm above the arena using an electromagnet. This stimulus was discharged through a white PVC pipe (to prevent visual detection of the stimulus prior to reaching the water surface) once >50% of the school had gathered in the center of the arena (i.e., more than two body lengths from any arena wall) (26). A piece of fishing line kept this stimulus from striking the experimental arena. Both the tapered shape of the stimulus and the fishing line aided in minimizing any ripples generated when the stimulus first made contact with the water's surface. Each trial was filmed using a high-speed video camera through a mirror that was angled 45° beneath the transparent swim chamber (240 fps; Casio Exilim HS EX-ZR1000). Between each trial, the swim chamber was drained and refilled with seawater from the LIRS flow-through system. During the experiment, we conducted two trials per day, with one in the morning and one in the afternoon, such that the acclimation for the morning trial began ~2 h after sunrise and the afternoon trial finished ~2 h prior to sunset. These times were balanced among group sizes.
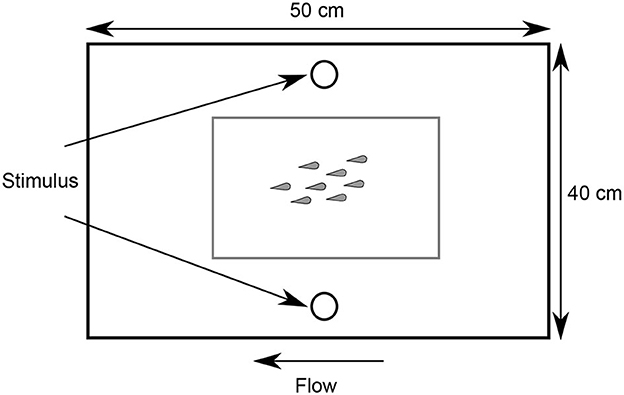
Figure 1. Illustration of the laminar flow swim chamber.
2.3 Behavioral analysis
Video recordings were examined frame by frame using the application Potplayer (v. 1.7.21566) to find crucial points in the individual's and school's response to the stimulus. Screenshots of these timepoints were analyzed in ImageJ (v. 1.53n 7). Individual escape performance was evaluated using reaction timing and kinematics, including latency (the interval between the aerial mechanical stimulus first breaking the water's surface and the fish's initial head movement), average turning rate (the maximum turning angle, θ, achieved by the fish during stage 1 divided by the time it took to achieve that angle, which serves as a proxy for the fish's agility through speed of muscle contraction), and distance covered [distance moved in the first 42 ms of the reaction, which is the average time for this species to achieve stages 1 and 2 (26); used as a proxy for swimming speed]. Since these traits are influenced by the stimulus distance (the distance between the fish's center of mass and the stimulus), this trait was also measured and included as a covariate in all analyses (23). Non-responders (n = 3 total, n = 1 in groups of 8 and n = 2 in groups of 16, 0.8% of all fish included in this study; those fish that did not respond within 2 s of the stimulus) were assigned the maximum measured latency in this study (1003.8 ms), though non-responders were not included in analyses of average turning rate and distance covered. Due to the limits that proximity to wall of the experimental arena can have on kinematic performance (40), the kinematic attributes (average turning rate and distance covered) were only assessed if the fish was >3 cm (i.e., ~one body length) away from any wall of the experimental arena to ensure that our kinematic data was not impacted by effects imposed by the walls of the arena.
Throughout the response, the school's cohesion and coordination were measured through nearest neighbor distance and alignment, respectively. Nearest neighbor distance represents the distance between each fish's center of mass and their most proximal neighbor's center of mass in the school. Alignment measures the variation in each school's member orientation with respect to the water's flow (0°) (41). This variation was quantified by using the program Oriana 4 (42) and determining each school members' angle then calculating the length of mean circular vector (r) of the group, which ranges from 0 (all members are at random angles) to 1 (all angles perfectly aligned). These characteristics were examined at intervals following the stimulus, including 0 ms (representing the school's cohesiveness and coordination immediately prior to the stimulus), 30 ms (representing the typical time for this species to complete stage 1), and 100 ms (the average time for individuals to complete both stages 1 and 2). Here, time was used as a categorical variable with these time stamps representing different stages of the escape response.
2.4 Statistical analyses
R Programming Language (v. 1.3.1093) was used for all statistical analyses (43). The differences among treatment groups were evaluated using linear mixed-effects models (LMM), using the packages “lme4” (44), “car” (45), “MuMIn” (46), “emmeans” (47) and “ggplot2” (48). Latency, average turning rate, and distance covered were analyzed using LMMs, with group size as a fixed effect, stimulus distance as a covariate, the interaction between group size and stimulus distance, and school identifier as a random effect (so that each individual was nested within their school). School traits (nearest neighbor distance and alignment) were measured with group size, time post-stimulus (0, 30, 100 ms), and their interaction as fixed effects. For the alignment analysis, school identifier was included as a random effect to account for the repeated measures design. Nearest neighbor distance was measured on an individual level, so individual was nested within the school identifier as a random effect. To verify that the assumptions of normality and homogeneity of variance were met for each model, we visually inspected the quantile-quantile and residuals plots and used Shapiro–Wilk and Bartlett tests. To meet these assumptions, all response variables (except average turning rate and alignment) were boxcox transformed using the package “car” (45). Best-fit models were identified using the Akaike Information Criterion (AIC) (49) model selection. When significant fixed effects were identified, they were further explored using Tukey's multiple comparison post-hoc tests. The R2 for all models is also detailed below, including the marginal and conditional R2 (R2m and R2c, respectively), which represent the variance explained by the fixed effects only (R2m) and the fixed effects plus the random effects (R2c).
3 Results
3.1 Individual escape performance
For latency, the most complex model was deemed the best-fit through AIC model selection, including group size, stimulus distance, and their interaction as fixed effects. There was no effect of group size on latency [LMM: F(2, 35) = 2.07, p = 0.14, R2m = 0.17, R2c = 0.30], with all group sizes exhibiting comparable reaction timing. However, there was a non-significant trend in the interaction between group size and stimulus distance [LMM: F(2, 307) = 2.98, p = 0.05; Figure 2], as the relationship between latency and stimulus distance varied with group size. As expected, latency increased (indicating a slower reaction timing) as stimulus distance increased [LMM: F(1, 328) = 52.02, p < 0.0001].
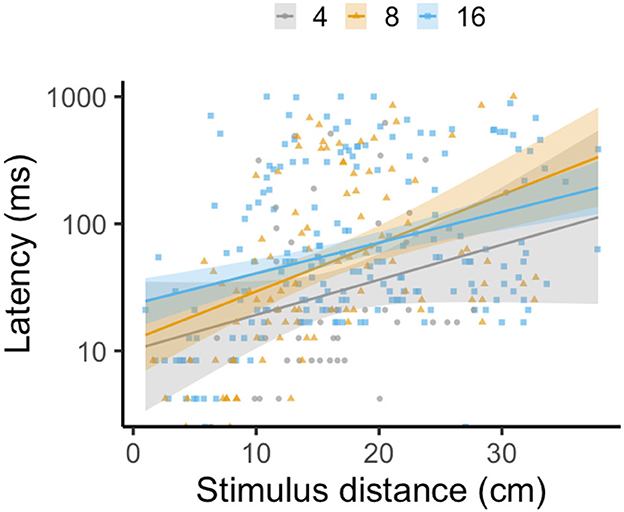
Figure 2. Effect of group size on the latency of escape response in groups composed of four (gray circles), eight (yellow triangles), and sixteen (blue squares) fish with twelve schools per treatment, as stimulus distance increases. Each data point represents one individual, with lines indicating a linear regression by treatment and shading representing the 95% CI. The y-axis is logged for visual clarity of trends among treatments.
For average turning rate, the best-fit model was again the most complex model, including group size, stimulus distance, and their interaction. Average turning rate decreased as group size increased [LMM: F(2, 34) = 4.15, p = 0.02, R2m = 0.15, R2c = 0.33; Figure 3], as individuals from groups of 16 exhibited an ~25% lower average turning rate than individuals from groups of four (Tukey's post-hoc test: p4 − 16 = 0.02; all other pairwise comparisons had p > 0.05). Average turning rate also declined with rising stimulus distance [LMM: F(1, 267) = 16.35, p < 0.0001]. There was a significant interaction between group size and stimulus distance [LMM: F(2, 267) = 4.33, p = 0.01], due to variation in the strength of the relationship between average turning rate and stimulus distance in different group sizes.
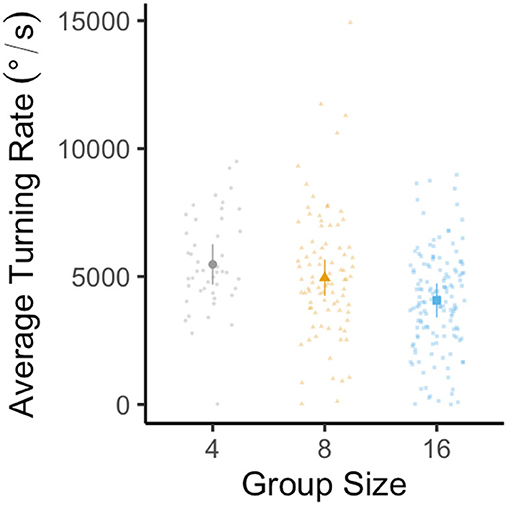
Figure 3. Effect of group size on the average turning rate of the escape response in groups composed of four (gray circles), eight (yellow triangles), and sixteen (blue squares) fish with twelve schools per treatment. Large data points represent the estimated marginal mean for each group size (±95% CI) from linear mixed-effects model analysis (controlling for stimulus distance, with each individual nested within the school with which they were tested). Small data points represent one individual.
The best-fit model for distance covered was the most complex model, including group size, stimulus distance, and their interaction. As with average turning rate, distance covered decreased with group size [LMM: F(2, 35) = 5.51, p = 0.008, R2m = 0.18, R2c = 0.29; Figure 4], with individuals from groups of sixteen exhibiting a 35% reduction in distance covered when compared to individuals in groups of four (Tukey's post-hoc test: p4 − 16 = 0.005; all other pairwise comparisons had p > 0.05). While distance covered decreased with rising stimulus distance [LMM: F(1, 271) = 36.06, p < 0.0001], the interaction between group size and stimulus distance was not significant [LMM: F(2, 263) = 1.51, p = 0.22].
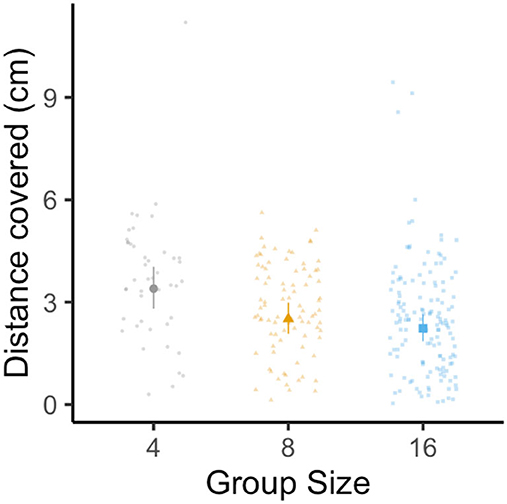
Figure 4. Effect of group size on the distance covered of the escape response in groups composed four (gray circles), eight (yellow triangles), and sixteen (blue squares) fish with twelve schools per treatment. Large data points represent the estimated marginal mean for each group size (±95% CI) from linear mixed-effects model analysis (controlling for stimulus distance and the interaction between stimulus distance and group size, with each individual nested within the school with which they were tested). Small data points represent one individual.
3.2 School traits
All school traits were influenced by time after the predator stimulus, while group size impacted how school cohesion (i.e., nearest neighbor distance) changed in the period following the predator stimulus. For nearest neighbor distance, the best-fit model was the most complex model, including group size, time, and their interaction. As group size increased, nearest neighbor distance declined [LMM: F(2, 40) = 14.32, p < 0.0001, R2m = 0.09, R2c = 0.61; Figure 5], indicating that individuals in larger groups were closer to their nearest neighbor (Tukey's post-hoc test: p4 − 8 = 0.003; p4 − 16 = 0.0003; p8 − 16 > 0.05). Conversely, nearest neighbor distance increased with time post predator stimulus [LMM: F(2, 666) = 10.56, p < 0.0001], as groups decreased cohesion as individuals mounted individual escape responses (Tukey's post-hoc test: p0 − 100 = 0.0004; p30 − 100 = 0.0003). At each time point, individuals in groups of four exhibited an ~30%−40% higher nearest neighbor distance than groups composed of sixteen fish (Tukey's post-hoc test, 0 ms: p4 − 8 = 0.002; 30 ms: p4 − 16 = 0.0007; 100 ms: p4 − 16 < 0.0001). Groups of eight and sixteen were not significantly different at any time point (Tukey's post-hoc test: p > 0.05 for all pairwise comparisons) and the interaction between time and group size was not statistically significant [LMM: F(4, 66) = 1.60, p = 0.17].
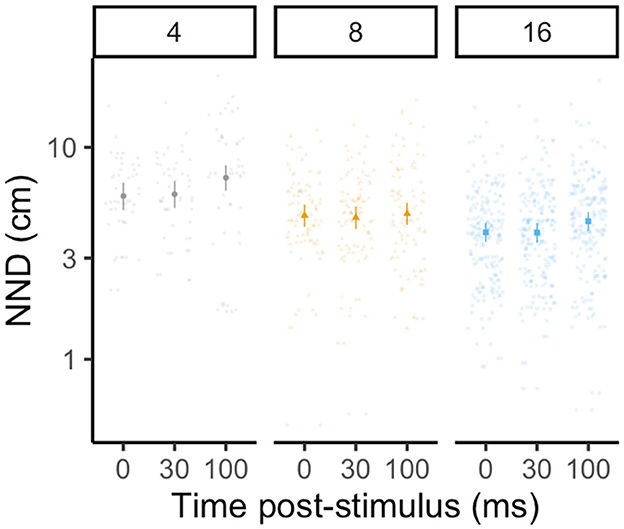
Figure 5. Effect of group size (four, eight, and sixteen fish with twelve schools per treatment, in gray circles, yellow triangles, and blue squares, respectively) on nearest neighbor distance at 0, 30, and 100 ms following a stimulated predator threat. Large data points represent the estimated marginal mean for each group size (±95% CI) from linear mixed-effects model analysis (controlling for the interaction between stimulus distance and group size, with each individual nested within the school with which they were tested). Small data points represent one individual. Time was included as a categorical fixed effect, as data was only collected at three distinct time points.
For alignment, the best-fit model was the most complex model, including group size, time, and their interaction. While group size did not have a significant effect on alignment [LMM: F(2, 33) = 1.44, p = 0.25, R2m = 0.22, R2c = 0.64; Figure 6], alignment decreased significantly with time post-simulated predator threat [LMM: F(2, 66) = 21.70, p < 0.0001]. Alignment was 17% higher immediately prior to stimulation than it was at 30 and 100 ms after this simulated threat (Tukey's post-hoc test: p0 − 100 < 0.0001; p0 − 30 < 0.0001; p30 − 100 > 0.05). The interaction between group size and time was not significant [LMM: F(4, 66) = 1.98, p = 0.11].
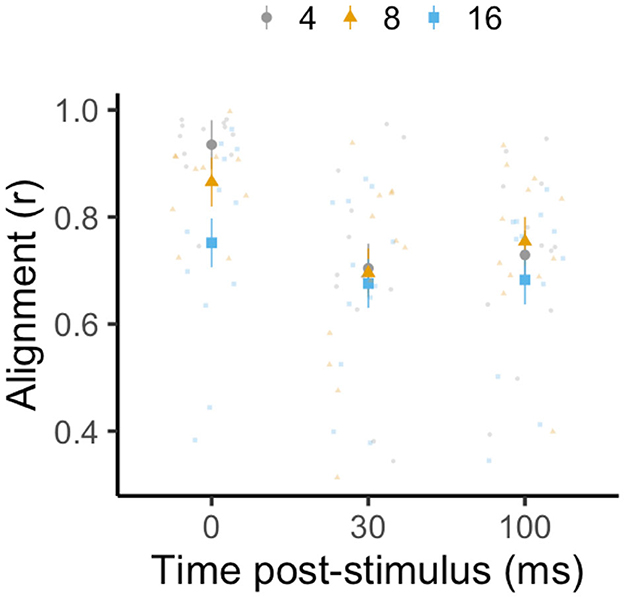
Figure 6. Effect of group size (four, eight, and sixteen fish with twelve schools per treatment, in gray circles, yellow triangles, and blue squares, respectively) on alignment (in terms of length of mean circular vector, r) at 0, 30, and 100 ms following a stimulated predator threat. Large data points represent the estimated marginal mean for each group size (± SE) from linear mixed-effects model analysis (controlling for the interaction between stimulus distance and group size, with each individual nested within the school with which they were tested). Small data points represent one individual. Time was included as a categorical fixed effect, as data was only collected at three distinct time points.
4 Discussion
The results of this study demonstrate that the escape performance of individual fish is plastic and influenced by social group size. Individuals' preferred group size can change depending on the context (50, 51). For example, group size typically increases in response to a predation cue (i.e., chemical alarm cue) and decreases in response to a food resource (10). While reaction timing (i.e., latency) was consistent across group sizes, kinematic traits, including average turning rate and distance covered, declined as group size increased. The kinematic results are in line with those of Domenici and Batty (36), who measured a higher average turning rate in solitary than schooling fish, similar to the results presented here. While faster performance in solitary fish has been linked to increased escape success (52), our results suggest that larger groups exhibit lower performance than small groups. Kinematic performance may have declined with group size due to lower perceived risk of predation due to safety in numbers, higher risk of false alarms, and to avoid collisions with group-mates, which are all more likely to occur in larger schools (36).
Prey in smaller shoals are more at risk of predation per capita than those in larger shoals (4), so they may need to maintain higher individual kinematic performance to effectively avoid predators. In addition to diluting individual risk of predation, individuals in larger schools benefit from information sharing with group-mates that results in a greater collective intelligence (53), including information about predator risk (54). As a result, in larger groups, schooling fish may perceive a reduced risk due to safety in numbers through social buffering of stress (55–58), and hence reduce investment in kinematic performance. For example, in the gregarious cichlid Neolamprologus pulcher, individuals mount a reduced behavioral (activity) and physiological (cortisol) stress response to a predation-like stressor (i.e., air exposure) when they recovered with group-mates than alone (57). Conversely, larger groups may experience a higher frequency of false alarms, where individuals mistakenly initiate rapid defensive maneuvers, which is likely more prevalent in larger group sizes (59). Similarly, due to smaller nearest neighbor distances, fish in larger schools may be more at risk of collisions with group-mates, so fish may reduce their locomotor performance to limit risk of colliding other rapidly moving fish (36, 60). The M-cell response is highly plastic, with evidence suggesting that responses in the absence of M-cell firing result in reduced kinematic performance (24), as seen here in fish from larger group sizes. Any factor that increases the threshold of threat necessary to initiate a rapid, M-cell driven escape response, such as perceived safety, frequency of false alarms, or collision risk, could act to reduce each individual's kinematic performance.
In contrast to past studies that compared solitary and schooling fishes (36, 61), we found no change in reaction timing (i.e., latency) as group size increased. Social context could modulate latency for a range of reasons. A faster latency could be expected as predator detection increases with larger group sizes or responsiveness increases with greater socially transmitted information in a larger group (62, 63). Conversely, a slower latency may occur if schooling fish are distracted by unfamiliar group mates (26) or if fish are attempting to more accurately determine the most effective escape trajectory based on socially-transmitted information (19). While Domenici and Batty (36) measured a slower latency in schooling vs. solitary fish, Webb (61) found that several schooling fishes either reacted more quickly or the same as solitary counterparts. Here, we found no change in latency with group size, which could stem from several sources. Unlike Domenici and Batty (36) and Webb (61), we compared latency across a group-size gradient, rather than a solitary vs. social condition. Further, we used different species and predator stimuli [mechanical vs. sound as in Domenici and Batty (36) or electric shock as in Webb (61)], which may affect the initiation of the escape response.
Group cohesion increased with group size, suggesting that school performance may have increased despite reduced individual performance. Partridge (64) found a similar effect in schooling minnows (Phoxinus phoxinus), in which nearest neighbor distance decreased by more than half when the group size increase from two to four individuals. In the study presented here, as the size of the arena was consistent across treatments, the density in the experimental arena would also have increased with group size. In schooling herring (Clupea harengus), Rieucau et al. (65) found that higher density schools execute more cohesive collective escape responses than lower density schools, potentially due to faster propagation of social information between neighboring fish than under lower density conditions. Further, in larger groups, individuals may join smaller sub-groupings to promote cohesion and swimming performance among its members, with the larger group acting according to the consensus of its sub-groups (66, 67). While density of group-mates was inevitably higher in the larger groups, all fish had at least 125 cm2 on average to execute their responses (see details in “Materials and Methods” section). Thus, space limitation was likely not the driving factor altering kinematic performance. However, research into the space requirements necessary for ecologically relevant behavioral measurements in social fishes would be useful to confirm space limitation did not influence these findings.
To successfully survive a predator's attack, prey must effectively initiate rapid defensive behavior (52, 68). Synchronization was traditionally thought to be an essential component of a successful collective antipredator response to minimize the oddity effect (69, 70) and maximize predator confusion caused by the coordinated movements of its group-living prey (7). In some contexts, confusion may be generated more effectively when the prey's response is random than if the group remains highly coordinated (71). A study on the same species, C. viridis, observed a similar effect, in which the group's cohesion and coordination declined in the 30–100 ms following the predator's attack (26). Similar reductions in group cohesion and coordination immediately following the predator attack have been seen in other fishes as well. Romenskyy et al. (72) found that schools of the Pacific blue-eye (Pseudomugil signifier) responded to an attack by the predatory flat-headed gudgeon (Philypnodon grandiceps) through a so-called “flash expansion,” a rapid increase in the school's volume in three dimensions but recovered quickly to baseline levels.
While laboratory studies are useful for controlling variation among treatments, natural conditions are rarely fully replicated in a laboratory setting (73). Therefore, field studies are crucial to validate the functional consequences of these behavioral changes to prey survival of predator attacks (74). Freely formed group sizes are highly context dependent, with fish establishing schools of varying sizes in response to food or predator cues (10). However, while the cohesion of larger groups could have been constrained by the size of the experimental arena, C. viridis are often found in large aggregations on coral reefs (33), so a larger group size will often result in higher density conditions in this species. In follow-up studies, allowing schooling fishes to freely form various school sizes may further validate the results found in the present study, particularly in the largest group sizes found for this species (in excess of 100 individuals). Further, we did not record the group size that fish originated from in all experimental schools, which may have influenced the behavioral phenotype of some fish during tests of their fast start response. Future studies could test if the shoal size of fish in the wild influences their anti-predator behavior in groups of varying sizes.
In conclusion, we found that kinematic performance declines in fish in larger groups, though larger group sizes maintain stronger group cohesion than smaller group sizes before, during, and after a predator attack. Though we typically associate a faster escape performance with a greater chance of survival of predator attacks (52), these findings suggest that fish in larger groups may be able to save energy on mounting energetically-costly behavioral responses while evading predator attacks due to a greater perceived safety in numbers (55). The greater capacity for predator vigilance in larger group sizes comes with the tradeoff of greater competition for limited resources, such as food and habitat (11), which theoretically results in an optimal group size that balances these costs against potential benefits (15).
Data availability statement
The datasets generated by this study can be found in the University of Southampton Institutional Research Repository (https://doi.org/10.5258/SOTON/D2777).
Ethics statement
The animal study was approved by James Cook University Animal Ethics Committee (approved protocol number A2103). The study was conducted in accordance with the local legislation and institutional requirements.
Author contributions
MB: Software, Data curation, Formal analysis, Validation, Visualization, Investigation, Methodology, Writing—original draft, Writing—review & editing. PD: Conceptualization, Software, Data curation, Formal analysis, Visualization, Methodology, Writing—review & editing. SK: Conceptualization, Resources, Funding acquisition, Investigation, Methodology, Writing—review & editing. MM: Conceptualization, Resources, Supervision, Funding acquisition, Methodology, Writing—review & editing. LN: Conceptualization, Resources, Software, Data curation, Supervision, Formal analysis, Validation, Funding acquisition, Visualization, Investigation, Methodology, Project administration, Writing—original draft, Writing—review & editing.
Funding
The author(s) declare financial support was received for the research, authorship, and/or publication of this article. Funding was provided by an Australian Postgraduate Award, International Postgraduate Research Scholarship, Lizard Island Reef Research Foundation Doctoral Fellowship, Great Barrier Reef Marine Park Authority Science for Management Award and James Cook University Graduate Research Scheme to LN, a Natural Environment Research Council Advanced Fellowship (NE/J019100/1) to SK, and Australian Research Council Discovery Grant (DP170103372) to MM and ARC Centre of Excellence for Coral Reef Studies funding (EI140100117) to MM.
Acknowledgments
We thank Eva McClure, the staff at the Lizard Island Research Station (a facility of the Australian Museum), Ross Barrett and Stephen Brown for logistical support. In addition, thank you to Professors David Kerstetter and Omar Eldakar for serving on the committee for M.D.B.'s Master thesis, which included this study. Lastly, many thanks to the undergraduate students that assisted with video analysis at various stages, including Robby Spekis, Alianna Jones, Delaney Farrell, James Puentes, and Raghavi Vuppala. This article was published as a preprint on the bioRxiv preprint server (75).
Conflict of interest
The authors declare that the research was conducted in the absence of any commercial or financial relationships that could be construed as a potential conflict of interest.
The author(s) declared that they were an editorial board member of Frontiers, at the time of submission. This had no impact on the peer review process and the final decision.
Publisher's note
All claims expressed in this article are solely those of the authors and do not necessarily represent those of their affiliated organizations, or those of the publisher, the editors and the reviewers. Any product that may be evaluated in this article, or claim that may be made by its manufacturer, is not guaranteed or endorsed by the publisher.
References
1. Krause J, Ruxton GD. Living in Groups. Oxford: Oxford University Press. (2002). doi: 10.1093/oso/9780198508175.001.0001
2. Ward A, Webster M. Sociality: The Behaviour of Group-Living Animals. Switzerland: Springer. (2016). doi: 10.1007/978-3-319-28585-6
3. Roberts G. Why individual vigilance declines as group size increases. Anim Behav. (1996) 51:1077–86. doi: 10.1006/anbe.1996.0109
4. Krause J, Godin JGJ. Predator preferences for attacking particular prey group sizes: consequences for predator hunting success and prey predation risk. Anim Behav. (1995) 50:465–73. doi: 10.1006/anbe.1995.0260
5. Killen SS, Marras S, Nadler L, Domenici P. The role of physiological traits in assortment among and within fish shoals. Philosophical Transactions of the Royal Society B: Biological Sciences. (2017) 372. doi: 10.1098/rstb.2016.0233
6. Brown GE, Bongiorno T, Dicapua DM, Ivan LI, Roh E. Effects of group size on the threat-sensitive response to varying concentrations of chemical alarm cues by juvenile convict cichlids. Can J Zool. (2006) 84:1–8. doi: 10.1139/z05-166
7. Marras S, Batty RS, Domenici P. Information transfer and antipredator maneuvers in schooling herring. Adapt Behav. (2012) 20:44–56. doi: 10.1177/1059712311426799
8. Rieucau G, Boswell KM, De Robertis A, Macaulay GJ. Experimental evidence of threat-sensitive collective avoidance responses in a large wild-caught herring school. PLoS ONE. (2014) 9:e86726. doi: 10.1371/journal.pone.0086726
9. Rosenthal SB, Twomey CR, Hartnett AT, Wu HS, Couzin ID. Revealing the hidden networks of interaction in mobile animal groups allows prediction of complex behavioral contagion. Proc Nat Acad Sci. (2015) 112:4690–5. doi: 10.1073/pnas.1420068112
10. Hoare DJ, Couzin ID, Godin JGJ, Krause J. Context-dependent group size choice in fish. Anim Behav. (2004) 67:155–64. doi: 10.1016/j.anbehav.2003.04.004
11. Gil MA, Emberts Z, Jones H, St Mary CM. Social information on fear and food drives animal grouping and fitness. Am Nat. (2017) 189:227–41. doi: 10.1086/690055
12. Morgan MJ. The effect of hunger, shoal size and the presence of a predator on shoal cohesiveness in bluntnose minnows, Pimephales notatus Rafinesque. J Fish Biol. (1988) 32:963–71. doi: 10.1111/j.1095-8649.1988.tb05439.x
13. Krause J. The influence of hunger on shoal size choice by three-spined sticklebacks, Gasterosteus aculeatus. J Fish Biol. (1993) 43:775–80. doi: 10.1006/jfbi.1993.1183
14. Herbert-Read JE, Rosen E, Szorkovszky A, Ioannou CC, Rogell B, Perna A, et al. How predation shapes the social interaction rules of shoaling fish. Proc Royal Soci Biol Sci. (2017) 284. doi: 10.1098/rspb.2017.1126
15. Brown JL. Optimal group size in territorial animals. J Theor Biol. (1982) 95:793–810. doi: 10.1016/0022-5193(82)90354-X
16. Pulliam HR, Caraco T. Living in groups: Is there an optimal group size? In:JR Krebs, NB Davies., , editors Behavioral Ecology: An Evolutionary Approach. Sunderland, MA: Blackwell (1984).
17. Hager MC, Helfman GS. Safety in numbers: Shoal size choice by minnows under predatory threat. Behav Ecol Sociobiol. (1991) 29:271–6. doi: 10.1007/BF00163984
18. Ward AJW, Webster MM. Mid-sized groups perform best in a collective decision task in sticklebacks. Biol Lett. (2019) 15:20190335. doi: 10.1098/rsbl.2019.0335
19. Domenici P, Batty RS. Escape maneoeuvres of schooling Clupea harengus. J Fish Biol. (1994) 45:97–110. doi: 10.1111/j.1095-8649.1994.tb01086.x
20. Eaton RC, Didomenico R, Nissanov J. Role of the Mauthner cell in sensorimotor integration by the brain stem escape network. Brain Behav Evol. (1991) 37:272–85. doi: 10.1159/000114365
21. Sillar KT, Picton LD, Heitler WJ. The Neuroethology of Predation and Escape. Oxford: Wiley-Blackwell (2016).
22. Brownstone RM, Chopek JW. Reticulospinal systems for tuning motor commands. Front Neural Circ. (2018) 12:30. doi: 10.3389/fncir.2018.00030
23. Domenici P, Hale ME. Escape responses of fish: a review of the diversity in motor control, kinematics and behaviour. J Exp Biol. (2019) 222. doi: 10.1242/jeb.166009
24. Hecker A, Schulze W, Oster J, Richter DO, Schuster S. Removing a single neuron in a vertebrate brain forever abolishes an essential behavior. Proc Nat Acad Sci. (2020) 117:3254–60. doi: 10.1073/pnas.1918578117
25. Yasargil GM, Diamond J. Startle-response in teleost fish: An elementary circuit for neural discrimination. Nature. (1968) 220:241–3. doi: 10.1038/220241a0
26. Nadler LE, Mccormick MI, Johansen JL, Domenici P. Social familiarity improves fast-start escape performance in schooling fish. Commun Biol. (2021) 4:897. doi: 10.1038/s42003-021-02407-4
27. Hixon MA, Beets JP. Predation, prey Refuges, and the structure of coral-reef fish assemblages. Ecol Monogr. (1993) 63:77–101. doi: 10.2307/2937124
28. Almany GR, Webster MS. The predation gauntlet: Early post-settlement mortality in reef fishes. Coral Reefs. (2005) 25:19–22. doi: 10.1007/s00338-005-0044-y
29. Jones GP, Mccormick MI, Srinivasan M, Eagle JV. Coral decline threatens fish biodiversity in marine reserves. Proc Nat Acad Sci. (2004) 101:8251–3. doi: 10.1073/pnas.0401277101
30. Öhman MC, Munday PL, Jones GP, Caley MJ. Settlement strategies and distribution patterns of coral-reef fishes. J Exp Mar Bio Ecol. (1998) 225:219–38. doi: 10.1016/S0022-0981(97)00224-4
31. Pratchett MS, Coker DJ, Jones GP, Munday PL. Specialization in habitat use by coral reef damselfishes and their susceptibility to habitat loss. Ecol Evol. (2012) 2:2168–80. doi: 10.1002/ece3.321
32. Nadler LE, Mcneill DC, Alwany MA, Bailey DM. Effect of habitat characteristics on the distribution and abundance of damselfish within a Red Sea reef. Environ Biol Fishes. (2014) 97:1265–77. doi: 10.1007/s10641-013-0212-9
33. Hobbs JP, Jones GP, Munday PL. Extinction risk in endemic marine fishes. Conservation Biology. (2011) 25:1053–5. doi: 10.1111/j.1523-1739.2011.01698.x
34. Holbrook SJ, Schmitt RJ, Stephens JS. Changes in an assemblage of temperate reef fishes associated with a climate shift. Ecol Appl. (1997) 7:1299–310. doi: 10.1890/1051-0761(1997)007(1299:CIAAOT)2.0.CO;2
35. Almany GR. Differential effects of habitat complexity, predators and competitors on abundance of juvenile and adult coral reef fishes. Oecologia. (2004) 141:105–13. doi: 10.1007/s00442-004-1617-0
36. Domenici P, Batty RS. Escape behaviour of solitary herring (Clupea harengus) and comparisons with schooling individuals. Mar Biol. (1997) 128:29–38. doi: 10.1007/s002270050065
37. Morley JW, Buckel JA. Effects of temperature and prey size on predator–prey interactions between bluefish and bay anchovy. J Exp Mar Bio Ecol. (2014) 461:449–57. doi: 10.1016/j.jembe.2014.08.023
38. Johansen JL. Quantifying water flow within aquatic ecosystems using load cell sensors: a profile of currents experienced by coral reef organisms around Lizard Island, Great Barrier Reef, Australia. PLoS One. (2014) 9:e83240. doi: 10.1371/journal.pone.0083240
39. Nadler LE, Killen SS, Domenici P, McCormick MI. Role of water flow regime in the swimming behaviour and escape performance of a schooling fish. Biol Open. (2018) 7:31997. doi: 10.1242/bio.031997
40. Eaton RC, Emberley DS. How stimulus direction determines the trajectory of the mauthner-inthated escape response in a teleost fish. J Exp Biol. (1991) 161:469–87. doi: 10.1242/jeb.161.1.469
42. Kovach WL. Oriana - Circular Statistics for Windows ver 4. Pentraeth: Kovach Computing Services (2011).
43. R Development Core Team. R: A Language and Environment for Statistical Computing. Vienna: R Foundation for Statistical Computing (2022).
44. Bates D, Mächler M, Bolker B, Walker S. Fitting linear mixed-effects models using lme4. J Stat Softw. (2015) 67:1–48. doi: 10.18637/jss.v067.i01
46. Barton K. MuMIn: Multi-Model Inference. (2009). Available online at: http://R-forge.r-project.org/projects/mumin/ci.nii.ac.jp/naid/20001420752/#cit (accessed June 22, 2022).
47. Lenth R. V. (2021). emmeans: Estimated marginal means, aka least-squares means (Version 1, 5.5-1). Available online at: https://CRAN.R-project.org/package=emmeans (accessed June 22, 2022).
48. Wickham H. ggplot2: Elegant Graphics for Data Analysis. New York, NY: Springer-Verlag New York (2016).
49. Hunsicker ME, Ciannelli L, Bailey KM, Buckel JA, Wilson White J, Link JS, et al. Functional responses and scaling in predator–prey interactions of marine fishes: contemporary issues and emerging concepts. Ecol Lett. (2011) 14:1288–99. doi: 10.1111/j.1461-0248.2011.01696.x
50. Magurran AE, Seghers BH, Carvalho GR, Shaw PW. Behavioural consequences of an artificial introduction of guppies Poecilia reticulata in N. trinidad: evidence for the evolution of anti-predator behaviour in the wild. Proc Royal Soc Biol Sci. (1992) 248:117–22. doi: 10.1098/rspb.1992.0050
51. Beauchamp G. Reduced flocking by birds on islands with relaxed predation. Proc Royal Soc Biol Sci. (2004) 271:1039–42. doi: 10.1098/rspb.2004.2703
52. Walker JA, Ghalambor CK, Griset OL, Mckenney D, Reznick DN. Do faster starts increase the probability of evading predators? Funct Ecol. (2005) 19:808–15. doi: 10.1111/j.1365-2435.2005.01033.x
53. Papageorgiou D, Farine DR. Group size and composition influence collective movement in a highly social terrestrial bird. Elife. (2020) 9:e59902. doi: 10.7554/eLife.59902.sa2
54. Magurran AE, Higham A. Information transfer across fish shoals under predator threat. Ethology. (1988) 78:153–8. doi: 10.1111/j.1439-0310.1988.tb00226.x
55. Lehtonen J, Jaatinen K. Safety in numbers: the dilution effect and other drivers of group life in the face of danger. Behav Ecol Sociobiol. (2016) 70:449–58. doi: 10.1007/s00265-016-2075-5
56. Nadler LE, Killen SS, Mcclure EC, Munday PL, Mccormick MI. Shoaling reduces metabolic rate in a gregarious coral reef fish species. J Exp Biol. (2016) 219:2802–5. doi: 10.1242/jeb.139493
57. Culbert BM, Gilmour KM, Balshine S. Social buffering of stress in a group-living fish. Proc Royal Soc Biol Sci. (2019) 286:20191626. doi: 10.1098/rspb.2019.1626
58. Yusishen ME, Yoon GR, Bugg W, Jeffries KM, Currie S, Anderson WG, et al. Love thy neighbor: Social buffering following exposure to an acute thermal stressor in a gregarious fish, the lake sturgeon (Acipenser fulvescens). Comp Biochem Physiol Mol Integ Physiol. (2020) 243. doi: 10.1016/j.cbpa.2020.110686
59. Gray L, Webster MM. False alarms and information transmission in grouping animals. Biol Rev. (2023) 98:833–48. doi: 10.1111/brv.12932
60. Herbert-Read JE. Understanding how animal groups achieve coordinated movement. J Exp Biol. (2016) 219:2971–83. doi: 10.1242/jeb.129411
61. Webb PW. Does schooling reduce fast-start response latencies in teleosts? Comp Biochem Physiol. (1980) 65:231–4. doi: 10.1016/0300-9629(80)90230-3
62. Treherne JE, Foster WA. The effects of group size on predator avoidance in a marine insect. Anim Behav. (1980) 28:1119–22. doi: 10.1016/S0003-3472(80)80100-X
63. Godin JGJCLJ, Abrahams MV. Group vigilance and shoal size in a small characin fish. Behaviour. (1988) 104:29–40. doi: 10.1163/156853988X00584
64. Partridge BL. The effect of school size on the structure and dynamics of minnow schools. Anim Behav. (1980) 28:68–77. doi: 10.1016/S0003-3472(80)80009-1
65. Rieucau G, Robertis D, Boswell AKM, Handegard NO. School density affects the strength of collective avoidance responses in wild-caught Atlantic herring Clupea harengus: a simulated predator encounter experiment. J Fish Biol. (2014) 85:1650–64. doi: 10.1111/jfb.12520
66. Hemelrijk CK, Hildenbrandt H. Schools of fish and flocks of birds: their shape and internal structure by self-organization. Interface Focus. (2012) 2:726–37. doi: 10.1098/rsfs.2012.0025
67. Kao AB, Couzin ID. Modular structure within groups causes information loss but can improve decision accuracy. Philos Trans Royal Soc Biol Sci. (2019) 374:20180378. doi: 10.1098/rstb.2018.0378
68. McCormick MI, Allan BJ. Interspecific differences in how habitat degradation affects escape response. Sci Rep. (2017) 7:426. doi: 10.1038/s41598-017-00521-0
69. Landeau L, Terborgh J. Oddity and the 'confusion effect' in predation. Anim Behav. (1986) 34:1372–80. doi: 10.1016/S0003-3472(86)80208-1
70. Conradt L, Roper TJ. Activity synchrony and social cohesion: a fission-fusion model. Proc Royal Soc Biol Sci. (2000) 267:2213–8. doi: 10.1098/rspb.2000.1271
71. Ruxton GD, Jackson AL, Tosh CR. Confusion of predators does not rely on specialist coordinated behavior. Behav Ecol. (2007) 18:590–6. doi: 10.1093/beheco/arm009
72. Romenskyy M, Herbert-Read JE, Ioannou CC, Szorkovszky A, Ward AJW, Sumpter DJT, et al. Quantifying the structure and dynamics of fish shoals under predation threat in three dimensions. Behav Ecol. (2020) 31:311–21. doi: 10.1093/beheco/arz197
73. Campbell DLM, Weiner SA, Starks PT, Hauber ME. Context and control: behavioural ecology experiments in the laboratory. Ann Zool Fennici. (2009) 46:112–23. doi: 10.5735/086.046.0204
74. McCormick MI, Fakan E, Allan BJM. Behavioural measures determine survivorship within the hierarchy of whole-organism phenotypic traits. Funct Ecol. (2018) 32:958–69. doi: 10.1111/1365-2435.13033
Keywords: schooling behavior, escape response, group living, predator avoidance, locomotor performance
Citation: Bacchus MD, Domenici P, Killen SS, McCormick MI and Nadler LE (2024) Kinematic performance declines as group size increases during escape responses in a schooling coral reef fish. Front. Fish Sci. 1:1294259. doi: 10.3389/frish.2023.1294259
Received: 14 September 2023; Accepted: 29 December 2023;
Published: 19 January 2024.
Edited by:
Christel Lefrancois, UMR7266 Littoral, Environnement et Sociétés (LIENSs), FranceReviewed by:
Marie Vagner, UMR6539 Laboratoire des Sciences de L'environnement Marin (LEMAR), FranceCristiano Bertolucci, University of Ferrara, Italy
Copyright © 2024 Bacchus, Domenici, Killen, McCormick and Nadler. This is an open-access article distributed under the terms of the Creative Commons Attribution License (CC BY). The use, distribution or reproduction in other forums is permitted, provided the original author(s) and the copyright owner(s) are credited and that the original publication in this journal is cited, in accordance with accepted academic practice. No use, distribution or reproduction is permitted which does not comply with these terms.
*Correspondence: Monica D. Bacchus, bW9uaWNhZGlhbmViQGdtYWlsLmNvbQ==; Lauren E. Nadler, bC5uYWRsZXJAc290b24uYWMudWs=