
95% of researchers rate our articles as excellent or good
Learn more about the work of our research integrity team to safeguard the quality of each article we publish.
Find out more
ORIGINAL RESEARCH article
Front. Ethol. , 16 January 2025
Sec. Social Behavior and Communication
Volume 3 - 2024 | https://doi.org/10.3389/fetho.2024.1513231
 Matthew Peroš1
 Lakshita Vij2Elana Anavian2Kevin Almeida Arteaga2Fatima Iya Haruna2Aliza Siegman2Wei Fang3
 Sebastian Gaston Alvarado1,2*
Animals organize into social groups to increase collective fitness. These groups use behavior and morphological traits like color to communicate social status. Male bluegill (Lepomis macrochirus) form breeding collectives during the reproductive months. However, whether these colonies generate resource-stratified social hierarchies to manage intrasexual competition is unknown. We hypothesize that territorial position within the colony results in different body colors and behavioral profiles. To test this hypothesis, we quantified color patterns in wild communities of bluegill using computer vision, scored the behavior of lek occupying parental males, and categorically classified lek position as a function of neighboring males. From these data, we show that body coloration and behavior vary with lek position, suggesting a division of labor in the construction and maintenance of grouped territories where courtship and sexual selection take place. Collectively, these data underline the importance of male-specific morphological plasticity and its impacts on social organization.
Social organization within animal groups can facilitate defense against predators, foraging, and reproduction. Groups use social cues that require the ability to broadcast and interpret information from these cues to modulate the appropriate behavioral responses. These cues allow members of social systems to evaluate others and update their behavioral responses accordingly (Green and Marler, 1979). Social systems are often organized into hierarchies of social statuses that represent different levels of resource access privilege: when an individual obtains ranking within a hierarchy, their ability to exploit territory, food, mates, and other resources will change (Fernald and Maruska, 2012). Lower hierarchical positions are often restricted from exploiting resources by higher-ranking individuals (Alberts, 1994). Several internal biological mechanisms regulate movement between levels in the hierarchy, such as reproductive behaviors that motivate courtship and copulation (Abbot et al., 1997; Desjardins and Fernald, 2008). How signaling between community members of the same species influences these behavioral programs and their overall contribution to the fitness of the individual is of great interest to the field of animal behavior.
Sunfishes of the genus Lepomis are among the most common fish found in North America (Roe et al., 2002). During warmer months, reproductive males form circular territories in shallow lake beds (Avila, 1976). Bluegill sunfish (L. macrochirus) form leks, which are colonies of territories of variable sizes with their borders touching (Figures 1C, D). Many sunfishes, including bluegill, have male morphs specializing in alternative reproductive tactics (ARTs), entering sperm competition with conspecifics instead of defending territory and courting mates (Gross, 1982; Garner and Neff, 2013). This conflict generates pressure for territorial males to defend their territories and clutches of eggs from infiltrating males and larval predators through agonistic behaviors, only permitting females through courtship (Miller, 1963). In other territorial species, the degree of territorial defense may be used as a proxy for brood defense, which could be a sexual indicator of condition influencing female mate choice (Censky, 1997; Swierk et al., 2012; White and Rundle, 2015). Aggregating into leks lends certain direct/indirect benefits and costs to paternal bluegill males and their offspring. While natural predation by large- and smallmouth bass is less of an issue for paternal males due to their size and dorsal spines, higher territory density likely provides a physical barrier against heterospecific predators of eggs and larvae instead. However, fertilized eggs and larvae remain at risk of opportunistic predation by bluegill males and females (Gross and MacMillan, 1981).
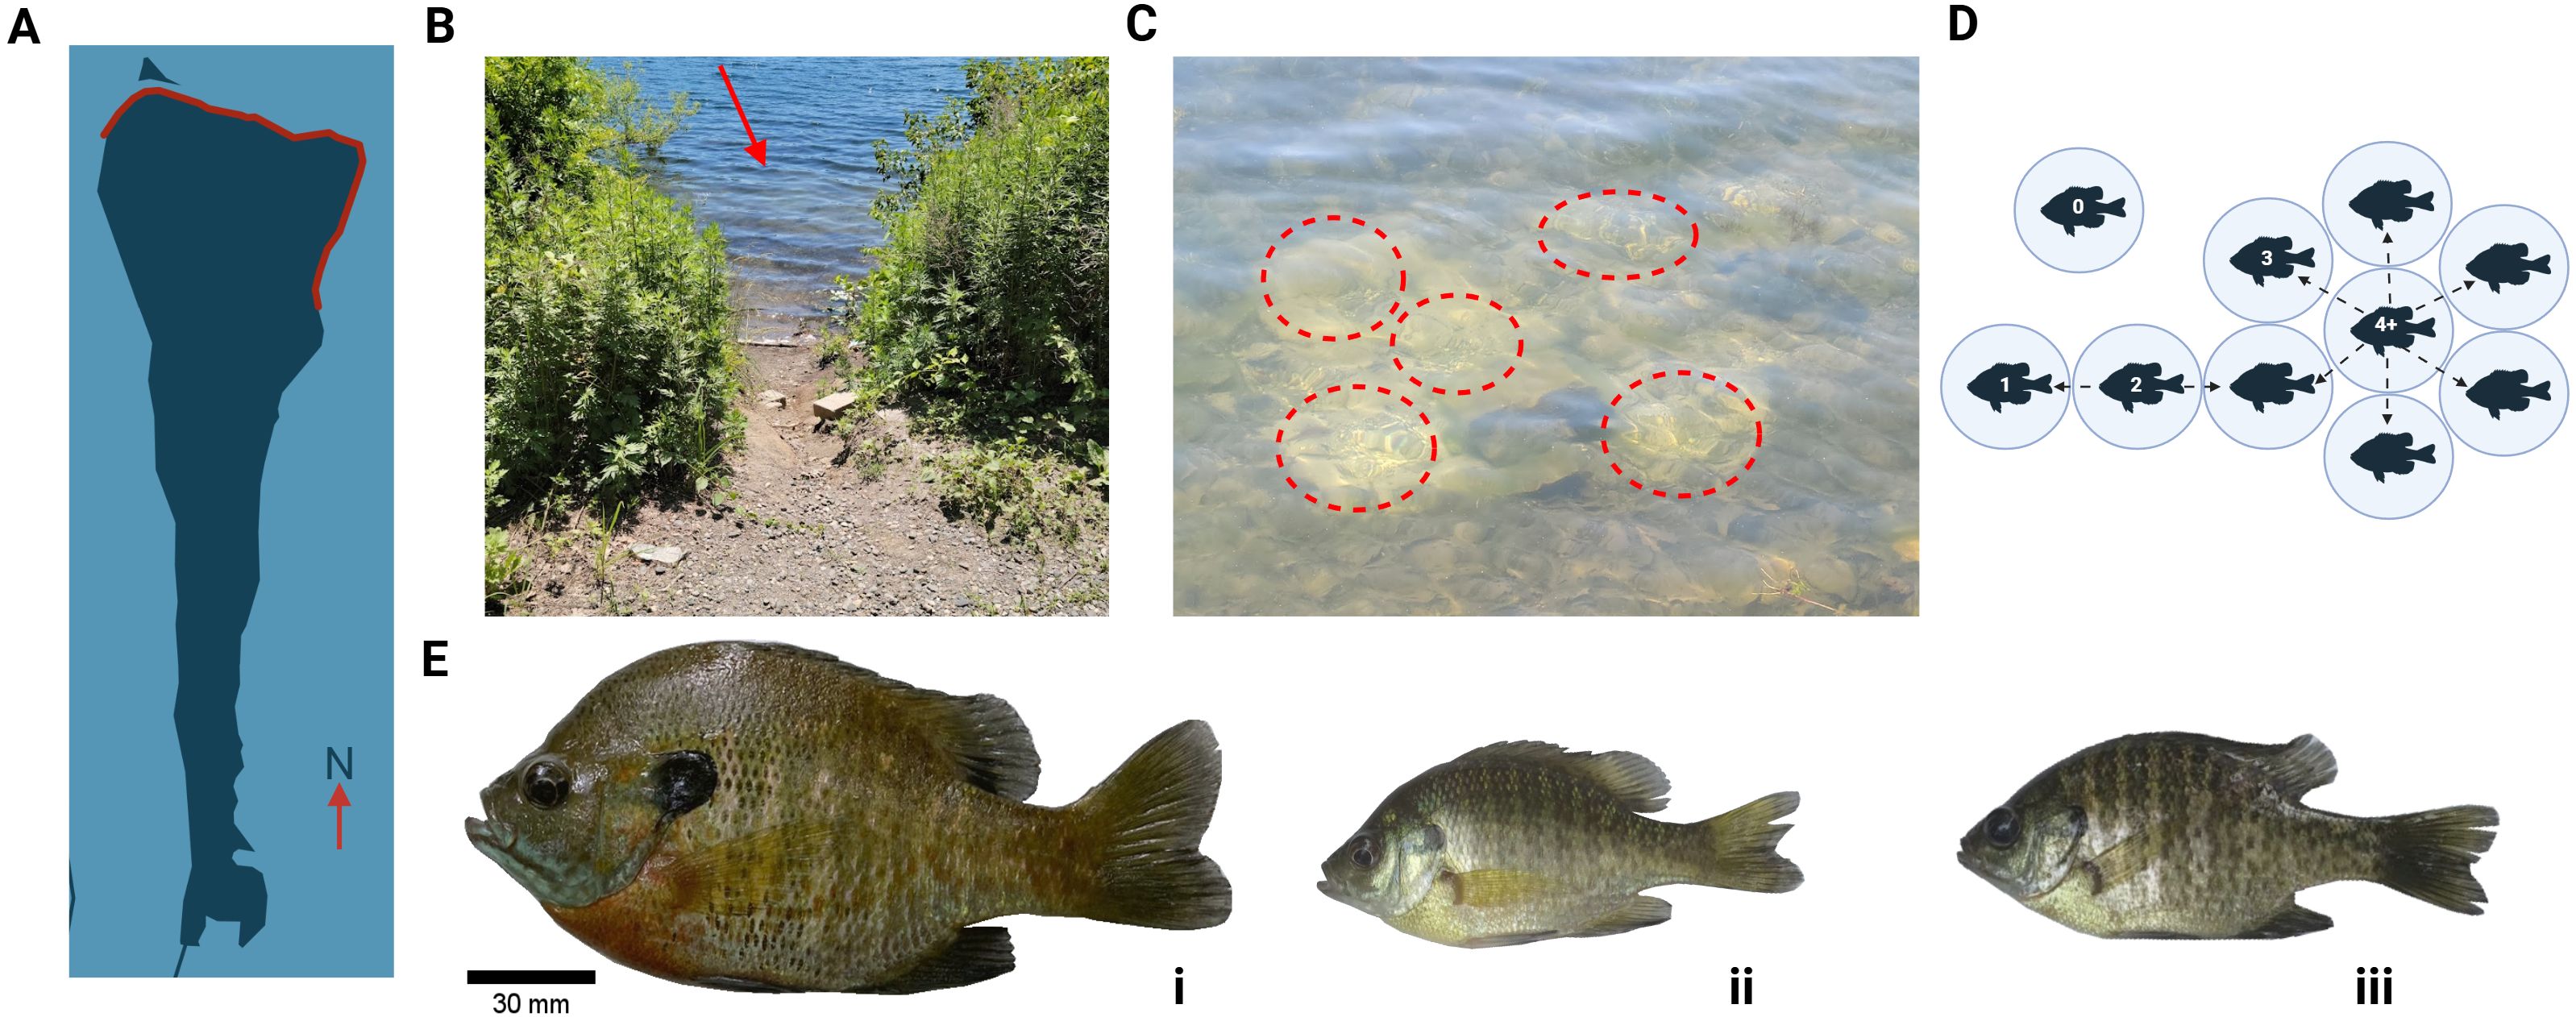
Figure 1. Study summary. (A) A map of Byram Lake Reservoir with the study area highlighted in red. (B) Example of study site. Sunfish territories can be spotted on the shallow shoreline (red arrow). (C) An example of a bluegill lek. Individual territories are circled in red. (D) Schematic of a lek and approximation of territory position based on the number of neighboring territories. (E) Bluegill sunfish (Lepomis macrochirus) males are found in two distinct morphs (i, ii) tied to life history that governs reproductive behavior programming. One male morph, the satellite, mimics females (iii) and is not pictured.
Previous reports have described color changes in bluegill as a response to stress and reproductive cues, specifically overall darkening of the body (Miller, 1963). Males display less aggression towards approaching females who express darker pigmentation, possibly signaling reproductive intent to the male. Generally, bluegill darken in overall appearance as a response to stressful stimuli and during territory defense (Miller, 1963). Additionally, specific areas of color on the bluegill body plan, including the cheek, breast, and opercular flap, have been previously found to be sexual ornaments that vary with vegetation via reflectance (Cogliati, 2009; Cogliati et al., 2010). However, little is known about variation in whole-body color pattern expressions or whether these color patterns are expressed by short-term physiological or long-term morphological changes (Alvarado, 2020). For example, bluegill paternal male morphs exclusively sport a rostroventral patch of red-orange color. The pumpkinseed (L. gibbosus) expresses rostral iridescent striping patterns, a color bluegill express on their mandible. Pumpkinseed and red-breasted sunfish (L. microlophus) express a scarlet trim on the edge of the opercular flap, while bluegill opercular flaps are dark. These specific color patterns can be an important selective indicator for females, acting as an identifier to prevent hybridization similar to what has been observed in other fish (Siebeck et al., 2010; Selz et al., 2014, 2016). Additionally, if these color patterns express a degree of plasticity, they may convey socially relevant information to conspecifics. This has been extensively reported in the colors of various teleost systems relating to behavior, male condition, social status, and aesthetic attractiveness (Kodric-Brown, 1998; Leclercq et al., 2010; Peroš et al., 2024).
For bluegill, visual indicators of social position could be advantageous to display and interpret, subverting some costs of territorial conflicts. For example, in an African cichlid, neural control of an eyebar via cranial nerves innervating the face inhibits those patterns in males descending to a subordinated social rank (Muske and Fernald, 1987). In Lepomis, little is known about these patterns or how intraspecific signaling may shape social structure or lekking, despite a breadth of knowledge on reproductive behavior, ARTs, and ecological niches. It is unclear whether paternal males exclusively control individual territories within the lek or whether it is dynamic within a community. Frontal displays at territory boundaries have been previously observed, but agonistic behavior towards males within the lek has not been recorded. Male competition, a feature among lekking animals, often revolves around competing for quality territories, resources, and female attention. In bluegill, where there is competition among conspecific males that use ARTs, the degree by which neighboring males within the lek compete with each other for females or territory location is unknown. Previous literature on birds suggests that lekking males compete for ‘hotspots’ of reproductive activity, becoming high-quality mates that females would prefer (Bradbury and Gibson, 1983; Beehler and Foster, 1988). However, differences in specific behaviors between parental bluegill males consistent with social position remain unclear. A predictive variable to the outcome of these residency disputes is size, with larger parental males more likely to take over a smaller male’s nest (Miller, 1963). However, what is unclear is whether territorial takeovers are done by other residents of the lek as an outcome of intrasexual competition for better territory or by non-territory holding males, an important distinction for determining behavioral motivation. Bluegill females prefer to visit males with large clutches of eggs and have a greater chance of participating in courtship with neighboring males when compared to males located further away from the ‘popular’ male (Miller, 1963). A similar effect can be seen in three-spine sticklebacks, where this preference incentivizes egg theft by some males to influence female choice (Rohwer, 1978).
Female mate choice, a driving force behind sexual selection, leads to the development of physical and behavioral traits in males that aid in mate evaluation (Jennions and Petrie, 1997). Patterns of conspicuous color expression are classic examples of sexual dimorphism and can be used to indicate mate quality (Peretti, 2014). Males who successfully defend territories are more likely to attract potential mates, potentially serving as a quality measure of paternal care (White and Rundle, 2015). Likewise, reproductively successful males within leks are more likely to accumulate mating events, resulting in a reproductive ‘hotspot’ in the community. Physical traits or behaviors that shape female preference for these territories are unclear, yet several variables could contribute. Firstly, overall lek size attracts more visiting females of lekking species, but whether this is due to the density of males or the size of a lek is unknown. Secondly, successful defense of territory from parasitic conspecifics might be measured both individually by males and collectively as a lek, which can explain levels of aggression between territorial males within a lek (Avila, 1976). Finally, color patterns among the males within the lek might hint at a social hierarchy that is preferred by females and targeted by conspecific parasites. Here, we present data that integrates an interplay between behavior, lek positioning, and coloration to understand this social structure better.
Wild caught bluegill located along the lakeshore of Byram Lake Reservoir in Westchester, N.Y., were caught between June and July 2020 (territorial males n = 27) among 7 lek sites identified from shore. Byram Lake (Figure 1A) is a municipally managed primary water source near Mt. Kisco. Leks are easily identified from the lakeshore (Figure 1B). Leks used contained > 5 occupied territories that were colocalized within ~0.5m center to center (Figure 1C). To preserve information about which animals occupy which territories, paternal male morphs occupying single territories were manually mapped out, with individual males captured using a hand net after 1 hr of recording between 12 pm and 1 pm (Figure 1D). Paternal males are easily identifiable based on body size from other bluegill morphs (Figure 1E). All animals were treated and handled ethically to reduce stress and expedite proper tissue collection and processing as per IACUC protocol #199.
Behavior performed in parental male territories within the leks was recorded for 1hr using GoPro Hero 8 cameras set to 1080p resolution and mounted on aluminum tripods between 11:00 am-12:30 pm. Only one recording was carried out for scoring 1-3 male(s) used in this study based on whether a territory in the lek was captured by the angle of the camera filming the scene. Tripods were set approximately 60cm above substrate level at the outer border of the territory and angled downwards toward occupied male territories using the digital viewfinder. Males were manually captured using handheld landing nets (PLUSSINO) and quickly photographed using a Samsung S20 smartphone camera and an X-Rite ColorChecker color card as a color and lighting correction standard. After being photographed, fish were weighed, measured, and cervically translocated (IACUC protocol #199). Gonads were dissected and weighed to confirm the gonadosomatic index (GSI) as a measure of reproductive potential.
Videos were analyzed using BORIS behavioral observation software (Friard and Gamba, 2016a). All behaviors were scored and classified into three categories: defensive, reproductive, and constructive. Other behaviors that don’t fit these descriptions were included in a separate category. An ethogram of bluegill behavior was adapted from previous literature, and behaviors not previously named were included in Table 1 (Miller, 1963). We report the spread of behavioral frequencies for each scored behavior included (Supplementary Figure S1). Intruding male behavior was recorded only if the intruder reached the territory’s center. Markov chain models, which illustrate the probability of transitioning from one behavior to another, were generated using Python version 3.11.5 and its libraries, NumPy, pandas, NetworkX, and Matplotlib, to visualize behavioral transition matrices where nodes represent behavior, along with their sizes reflecting how frequently each behavior occurred and arrows representing the direction of transition and probability (Foundation, 2023). Arrow thickness was made continuously variable with the likelihood of transitions, such that higher probabilities (e.g., A→B = 0.7) are denoted by thicker arrows, while thinner arrows indicate lower probabilities (e.g., B→A = 0.3).

Table 1. Ethogram of L. macrochirus behaviors described in Miller, 1963.
Analysis of body color was performed similarly to previous work by our group (Peroš et al., 2024). In short, images of the bodies were standardized and aligned using the R package patternize (Belleghem et al., 2018). Photo background, eyes, and fins were masked using the FIJI image processing package to avoid pixel variation unrelated to body color (Schindelin et al., 2012). To reduce color variation, the photos were blurred using the ‘blurImage’ function in recolorize. To segment color patterns and quantify the relative area covered by specific colors, the ‘recolorize’ package was used to carry out a k-means clustering of all colors in all images to a palette of 15 colors for each neighbor group for remapping on each image (Weller et al., 2022). Considering no apparent bluegill color morphotypes, we generated one palette for all fish collected. This analysis guided false coloring of color areas that surpassed a set 5% threshold for total area. Colors that significantly correlated with lek position were then remapped using false colors to examine patterns of color seen across individuals as heatmaps via ‘patternize’ for the whole body and dorsal/ventral halves.
Score logs from BORIS event logging software were exported and summarized in RStudio-2023.12.1-402, using base R and packages such as ‘stats’, ‘dplyr’, ‘ggplot2’, ‘tidyr’, and ‘patchwork’ (Wickham, 2016; Friard and Gamba, 2016b; Wickham et al., 2023; Pedersen, 2024; Team, 2024; Wickham et al., 2024). Behaviors were normalized within individual fish by dividing the frequency of a behavioral category by the total number of behaviors scored for that individual. All statistical tests were conducted using GraphPad Prism v. 10.2.2. To test whether behavior or number of neighbors accounted for variance, two-way ANOVA with Tukey posthoc multiple comparisons was used. GraphPad Prism was also used to generate multiple correlation tables for color and behavior on the dorsal and ventral halves of the sunfish body plan to test whether color patterns correlated with behavioral frequency.
To test whether position within the lek (see Figure 1D) is informative of behavioral differences, we used Pearson’s r to detect significant correlations between the number of neighboring bluegill territories and scored behavior (Figure 2A). Additionally, we included GSI in this analysis to examine whether gonad size, a measure of reproductive investment, varied with the number of neighbors to address whether the reproductive potential or behavior correlated with individual position. We found that ‘Driving’ behaviors and infiltrations by other fish strongly correlated with ‘Neighbors’ while no significant effect of GSI or all other behaviors were found (r < 0.27, p > 0.05). ‘Driving,’ a nest-building behavior, was negatively correlated with the number of neighbors (Pearson correlation, r= -0.62, p<0.005). Intrusions (Pearson correlation, r= 0.557, p<0.01) positively correlated with the number of neighbors.
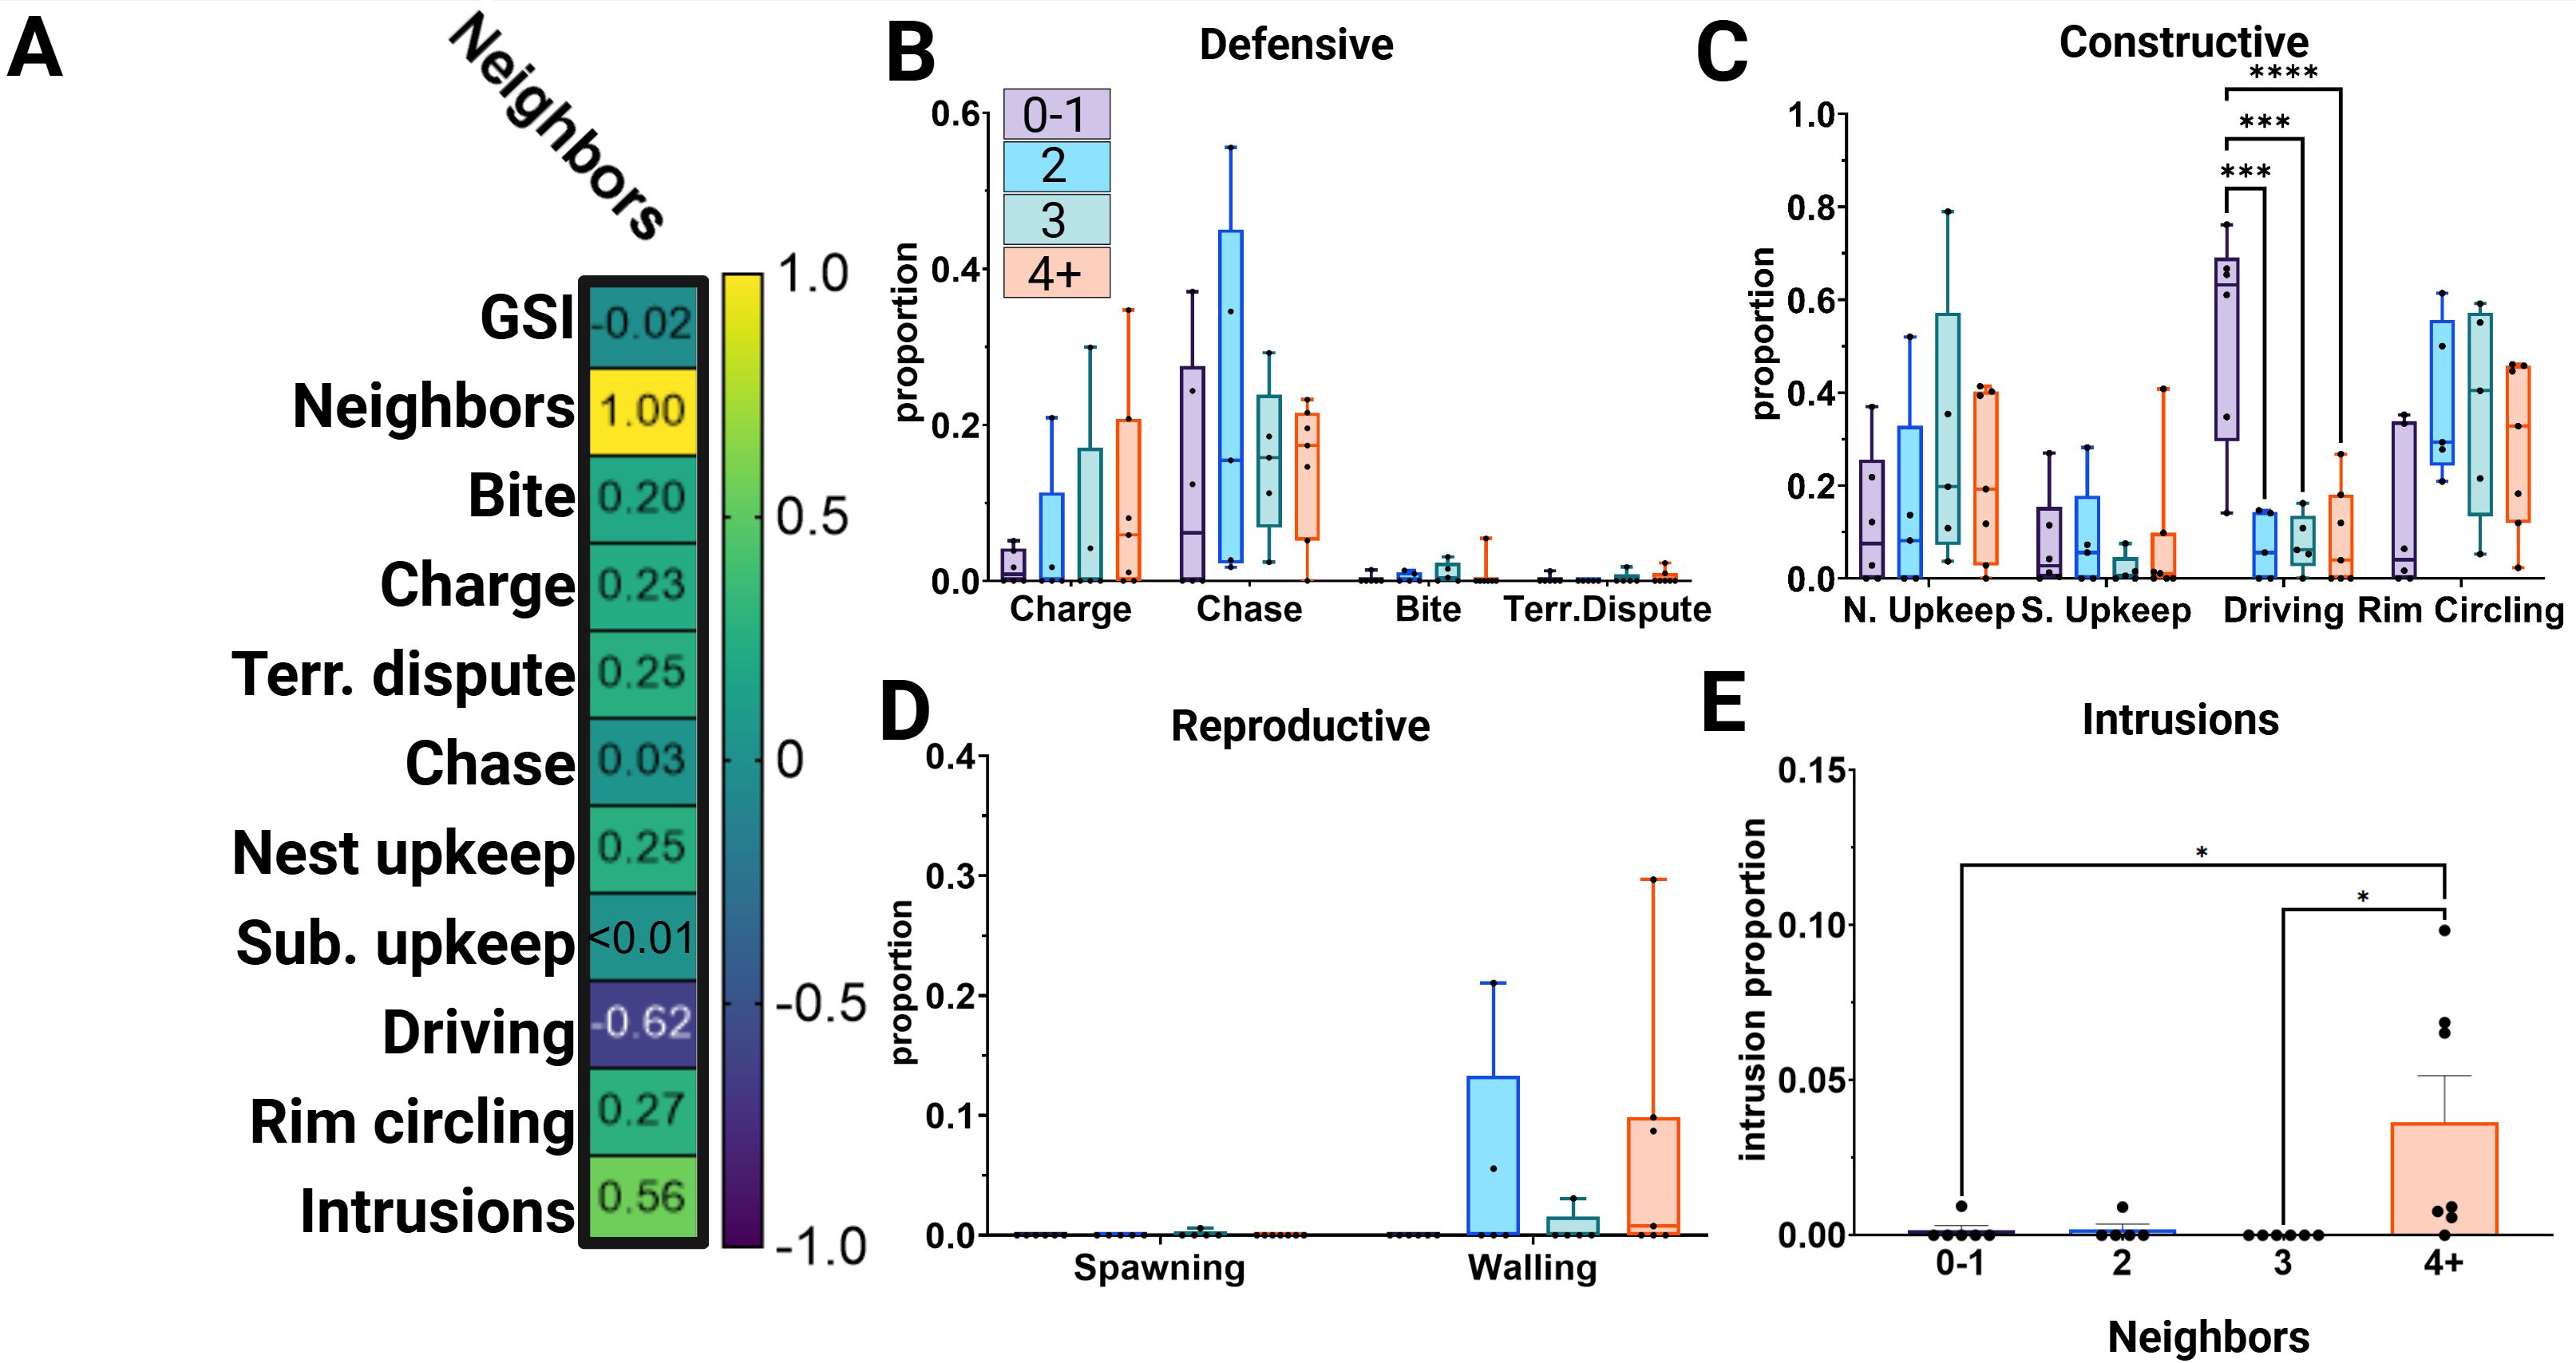
Figure 2. Bluegill lek position varies with nest construction behaviors and intrusions. (A) Pearson’s r correlation matrix for relationships between number of neighbors and scored behavior. Boxes labeled with r values. (B–D) Box-and-whisker plots of frequency proportions (behavior frequency ÷ total behavior scored) grouped by number of neighbors. Significant comparisons using Tukey multiple comparisons test post-hoc of ANOVA are indicated: *p<0.05, ***p<0.001, ****p<0.0001. (E) Bar plot of the proportion of intrusion behaviors scored for each neighbor group. Significant comparisons using Tukey multiple comparisons test are indicated: *p<0.05, ***p<0.001, ****p<0.0001.
Considering these significant correlations, we tested whether male behaviors varied between neighbor groups (0-1, 2, 3, and 4+, Figures 2B–E). Neighbor number and the interaction between neighbor number and behavior did not significantly explain the variance in defensive behaviors (Figure 2B, two-way ANOVA, Fneighbor(3)=0.57, p=0.6382; Finteraction(9)= 0.51, p=0.8663). No significant difference was detected between groups for each defensive behavior (Tukey post-hoc, DF=76, p>0.05). No differences were reported among ‘Reproductive’ behaviors (Figure 2D, two-way ANOVA, Fneighbor(3)=1.18, p=0.3269; Finteraction(6)=1.49, p=0.1989; Tukey multiple comparisons, DF=57, p>0.05). Differences in behaviors used to maintain the structure and order of the male’s territory were explained by the interaction between the number of neighbors and behavior (Figure 2C, two-way ANOVA, Fneighbors(3)=0.39, p=0.7597; Finteraction(9)= 4.76, p<0.0001). Maintenance behaviors, ‘Nest upkeep’ and ‘Substrate upkeep,’ did not differ between neighbor groups (Tukey post-hoc, DF=76, pnest>0.05, psubstrate>0.05). ‘Driving’ in the 0-1 neighbor group was significantly higher (t0-1 vs 2(76)= 4.540, p<0.001; t0-1 vs 3(76)= 4.458, p<0.001; t0-1 vs 4+(76)= 4.746, p<0.0001) than all other groups. Rim circling, a repetitive behavior performed around the border of the territory, was not significantly different among groups (t(76)=0.760-2.469, p>0.05). Regarding intrusions by other fish (Figure 2E, one-way ANOVA, F=4.265, p<0.05), the variance within behavior was explained by the number of neighbors. Males in the 4+ group encountered more intrusions overall.
To illustrate whether differences in behavioral sequences are tied to neighbor groups, we generated behavior transition probability models for the likelihood of one behavior transitioning to another (Figure 3). Qualitatively, neighbor group 0-1 displays sparser behavioral transitions compared to the other neighbor groups, with more involvement of ‘Driving,’ ‘Nest upkeep,’ ‘Border upkeep,’ ‘Sweeping,’ and ‘Rim circling’ and a lack of reproductively categorized behavior (purple nodes). Intrusions by other fish appear in 2, 3, and 4+ neighbor groups, with a high probability of being followed by ‘Chase’ behavior. In neighbor group 4+, a sequence of reproductive behaviors is strongly associated compared to the other neighbor groups. However, these behaviors are also followed by defensive behaviors (blue nodes). While less connected to the other behaviors in the chain, territorial building behaviors (red nodes) are still performed in all neighbor groups. These behavior transitions from Figure 3 are quantified in Table 2, summarizing the relationship between the number of unique behavioral transitions a specific behavior is involved in and its prevalence within the neighbor group and the dataset. Unique transition counts refer to the total number of transitions that a particular behavior is involved in regardless of transition position (A → B). Both mean total behavior and occurrence show the spread of behavior in the entire dataset and break down behavior frequency per neighbor group as added context. Among all groups, “Defensive” behaviors like ‘Charge’ and ‘Chase’ are among the most central behaviors with the greatest frequencies. At the same time, ‘Bite’ and ‘Territorial dispute’ are among the least central behaviors in the category. Within “Constructive” behaviors, physically constructive behaviors, ‘Driving’ and ‘Sweeping’ are much more frequent within the 0-1 neighbor group but relatively central in all categories. Constitutive behaviors performed at the territory, such as ‘Nest’ and ‘Border’ upkeep behaviors and ‘Rim circling,’ are relatively consistent across neighbor groups. Reproductive behaviors are infrequent in all groups but increase centrality in the 4+ neighbor group.
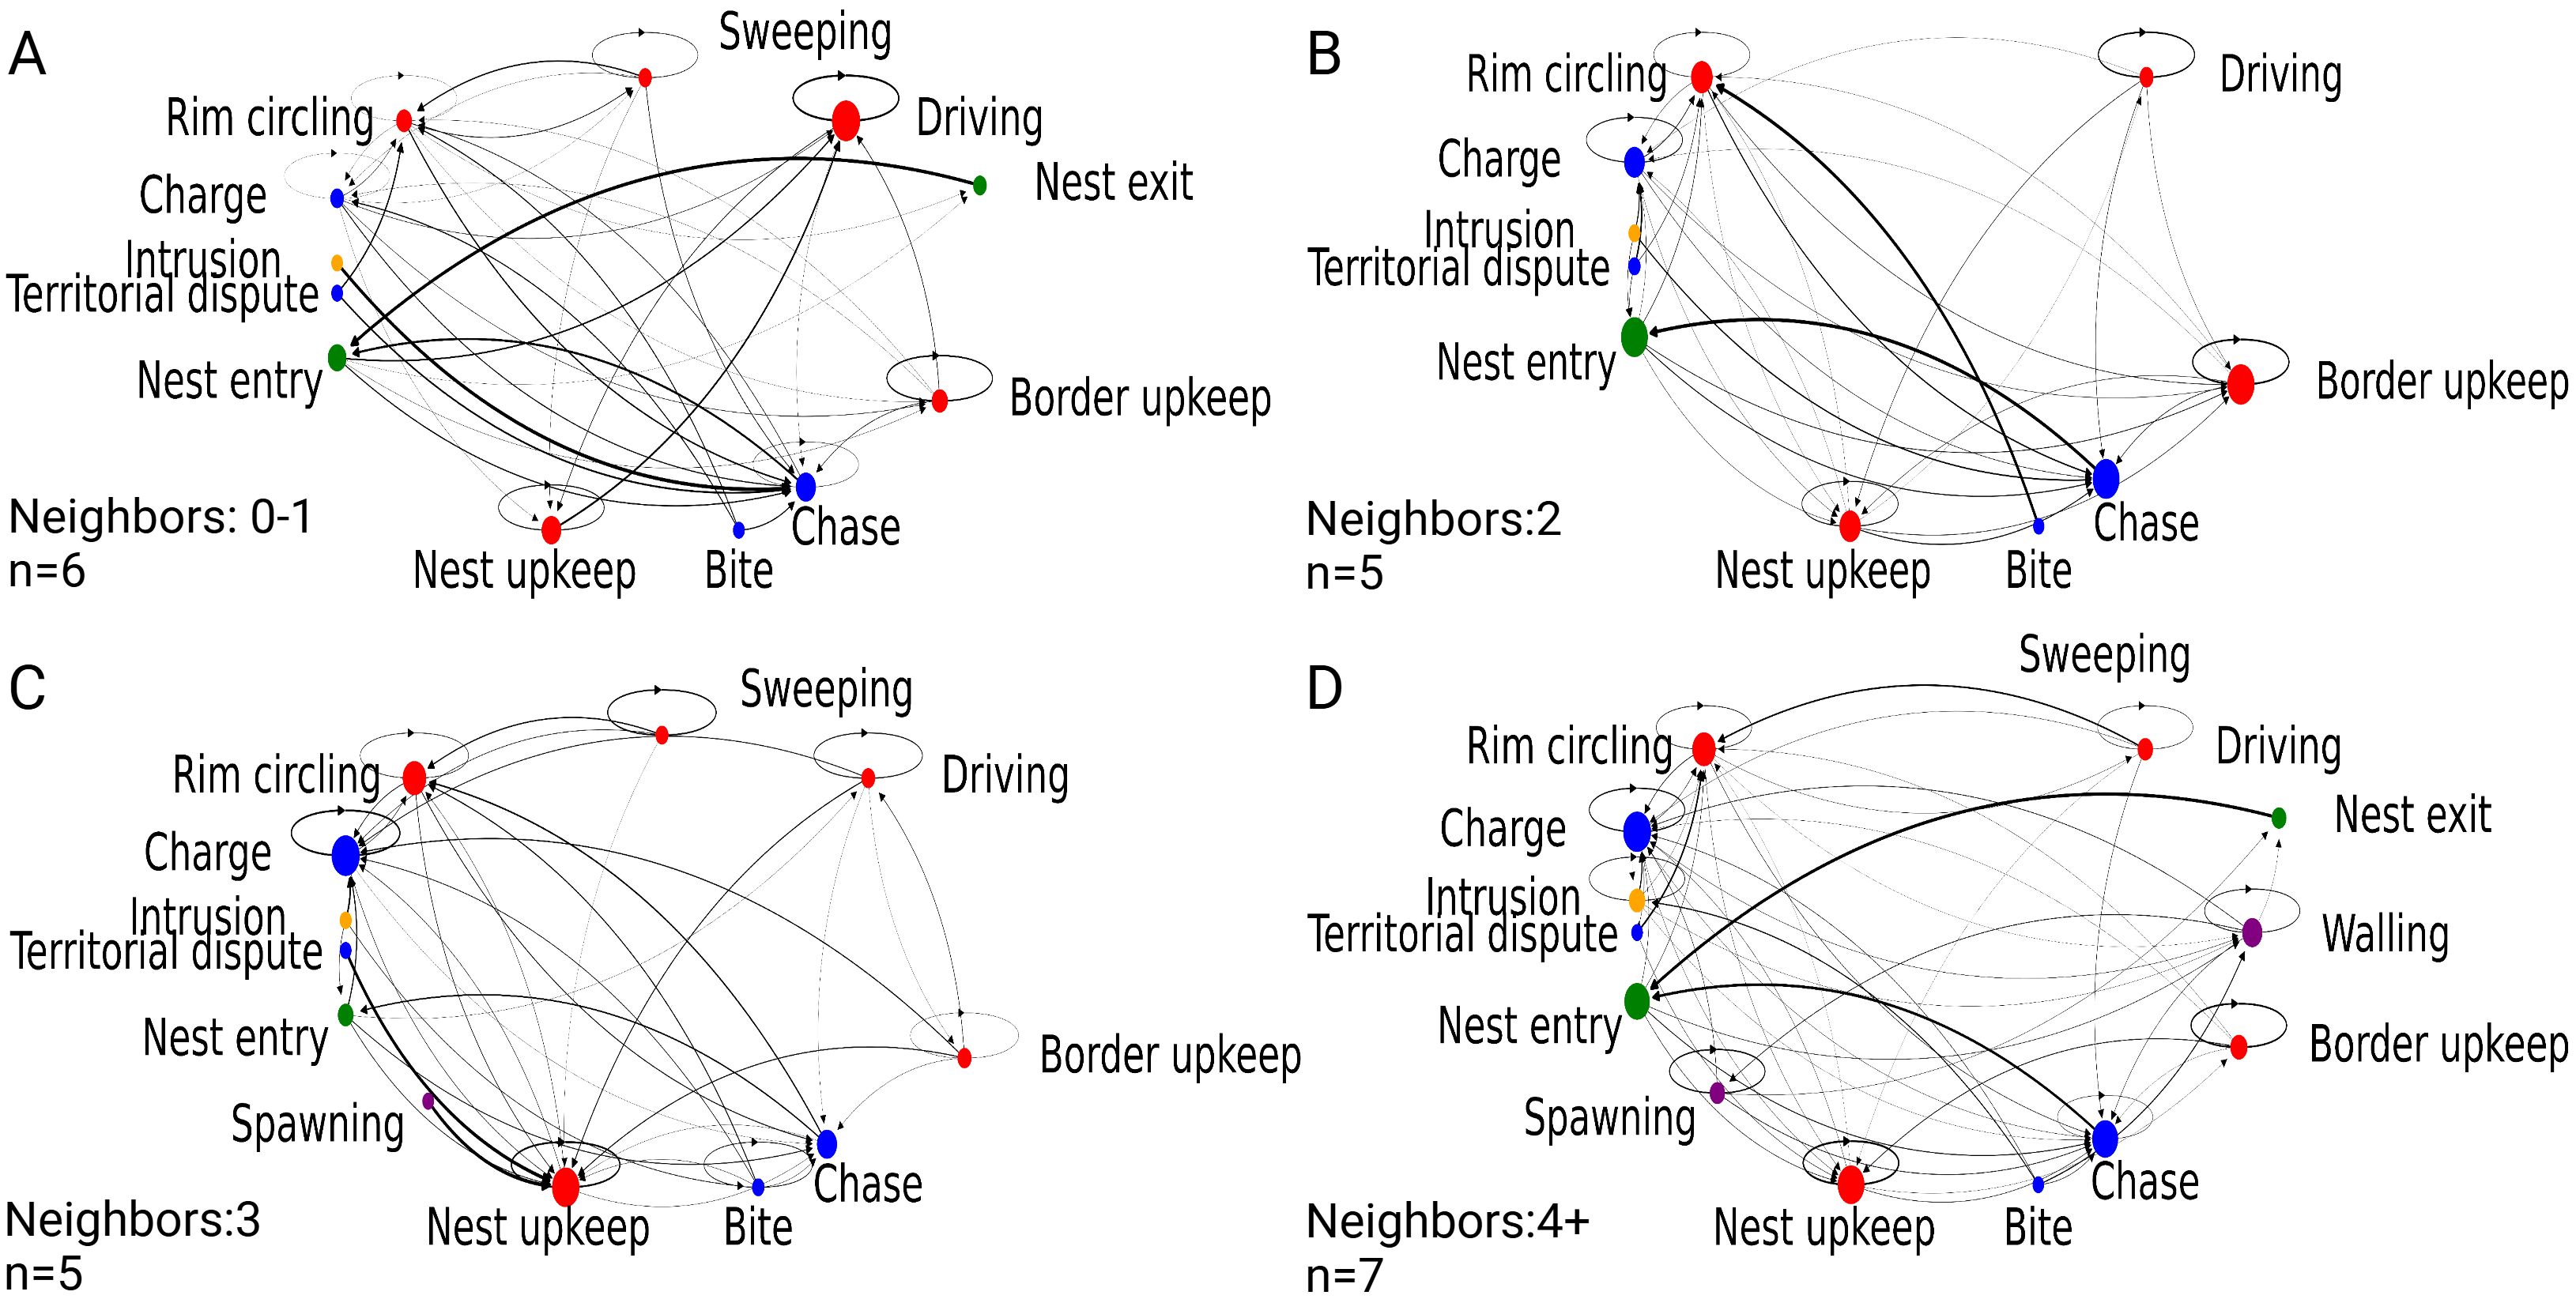
Figure 3. Behavioral transition modeling of bluegill behavior. Models of paternal bluegill behavior transition probabilities in different lek locations. (A) 0-1 neighbors; (B) 2 neighbors; (C) 3 neighbors; (D) 4+ neighbors. Node size denotes relative frequency proportion. Arrow direction and thickness denote an individual behavioral transition and probability, respectively. Circular arrows denote the probability of a behavior being repeated.
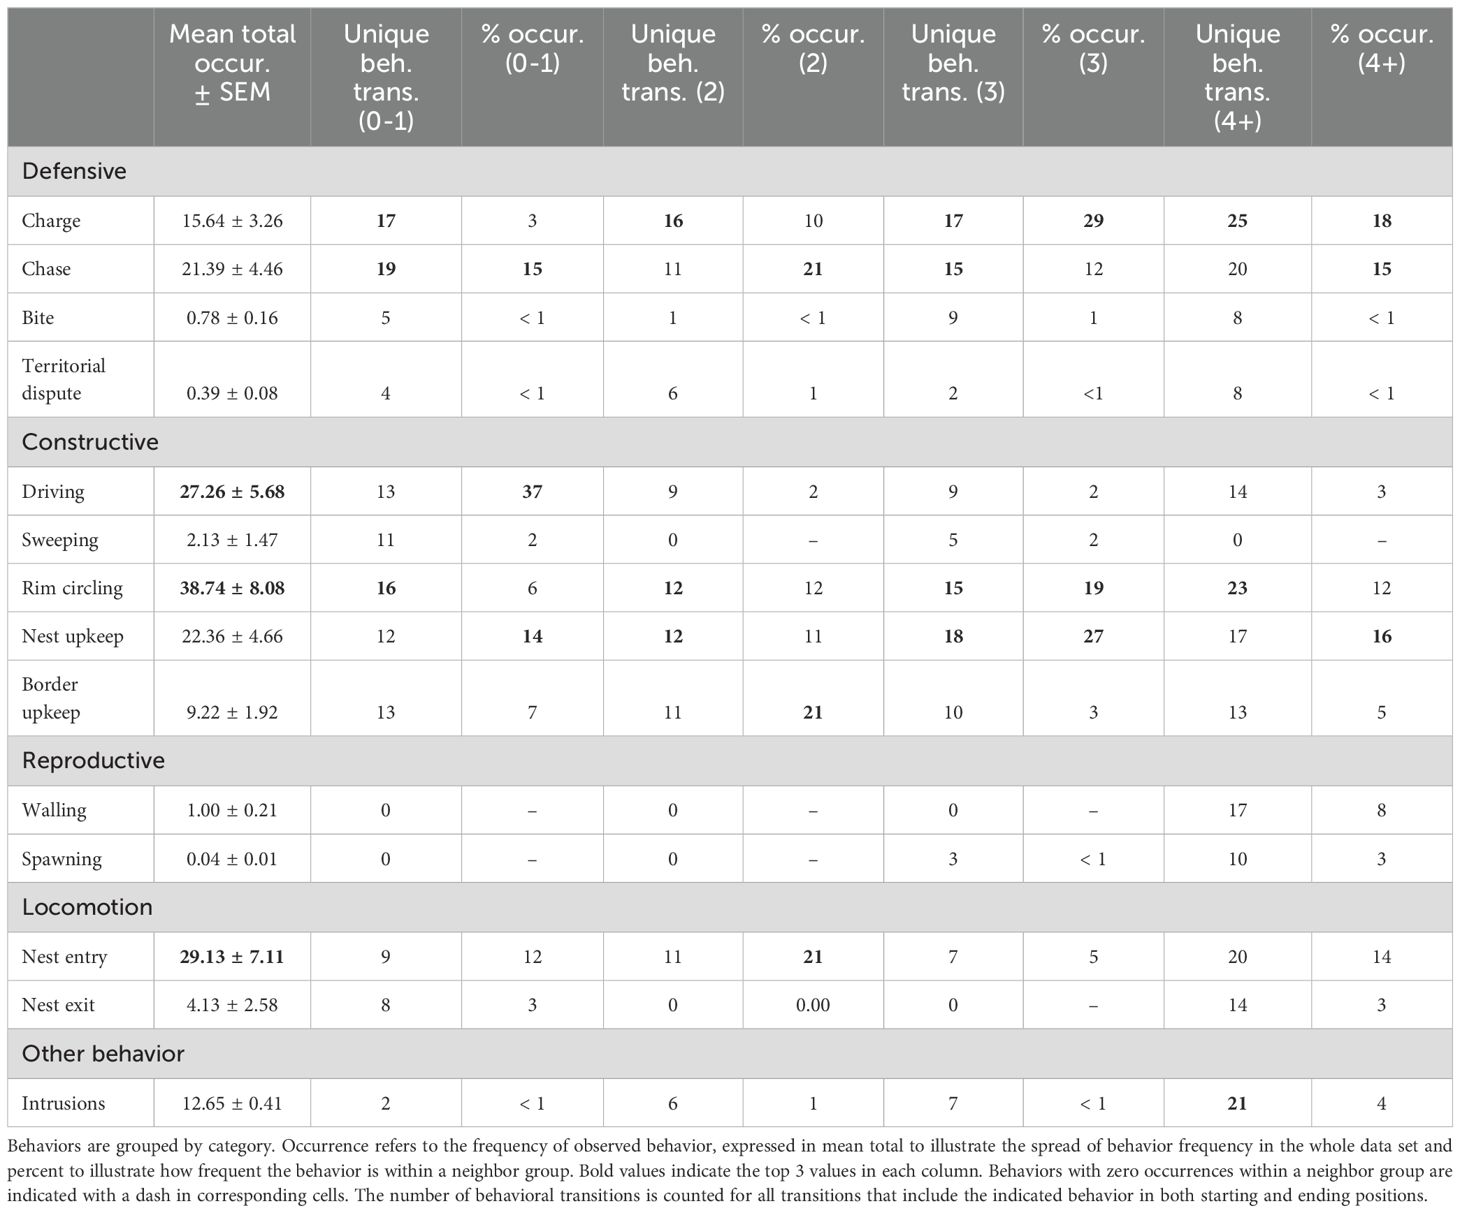
Table 2. Transitional analysis of scored behaviors in neighbor groups.
To see if the transition trends in Table 2 are associated with decision-making, we quantified the latency of each behavioral transition category and excluded transitions with counts below the total mean transition frequency to filter out behavior transitions that are too infrequent (Supplementary Figure S3, two-way ANOVA, Fneighbor(3, 4529) = 3.181, p<0.05; F transitions(45, 4529) = 1.472, p < 0.05; Tukey multiple comparisons, p < 0.05) and plotted transition latencies that described significant differences between groups (Figure 4). In each transition, except for “Chase → Chase,” neighbor group 2 was significantly slower to transition from starting behavior to ending behavior than all other groups. The “Chase → Chase” transition resulted in a longer latency for neighbor group 0-1. Overall, transition latency was much lower in groups 3 and 4+ than in the distal groups, with no significant differences (Tukey multiple comparisons, p > 0.05).
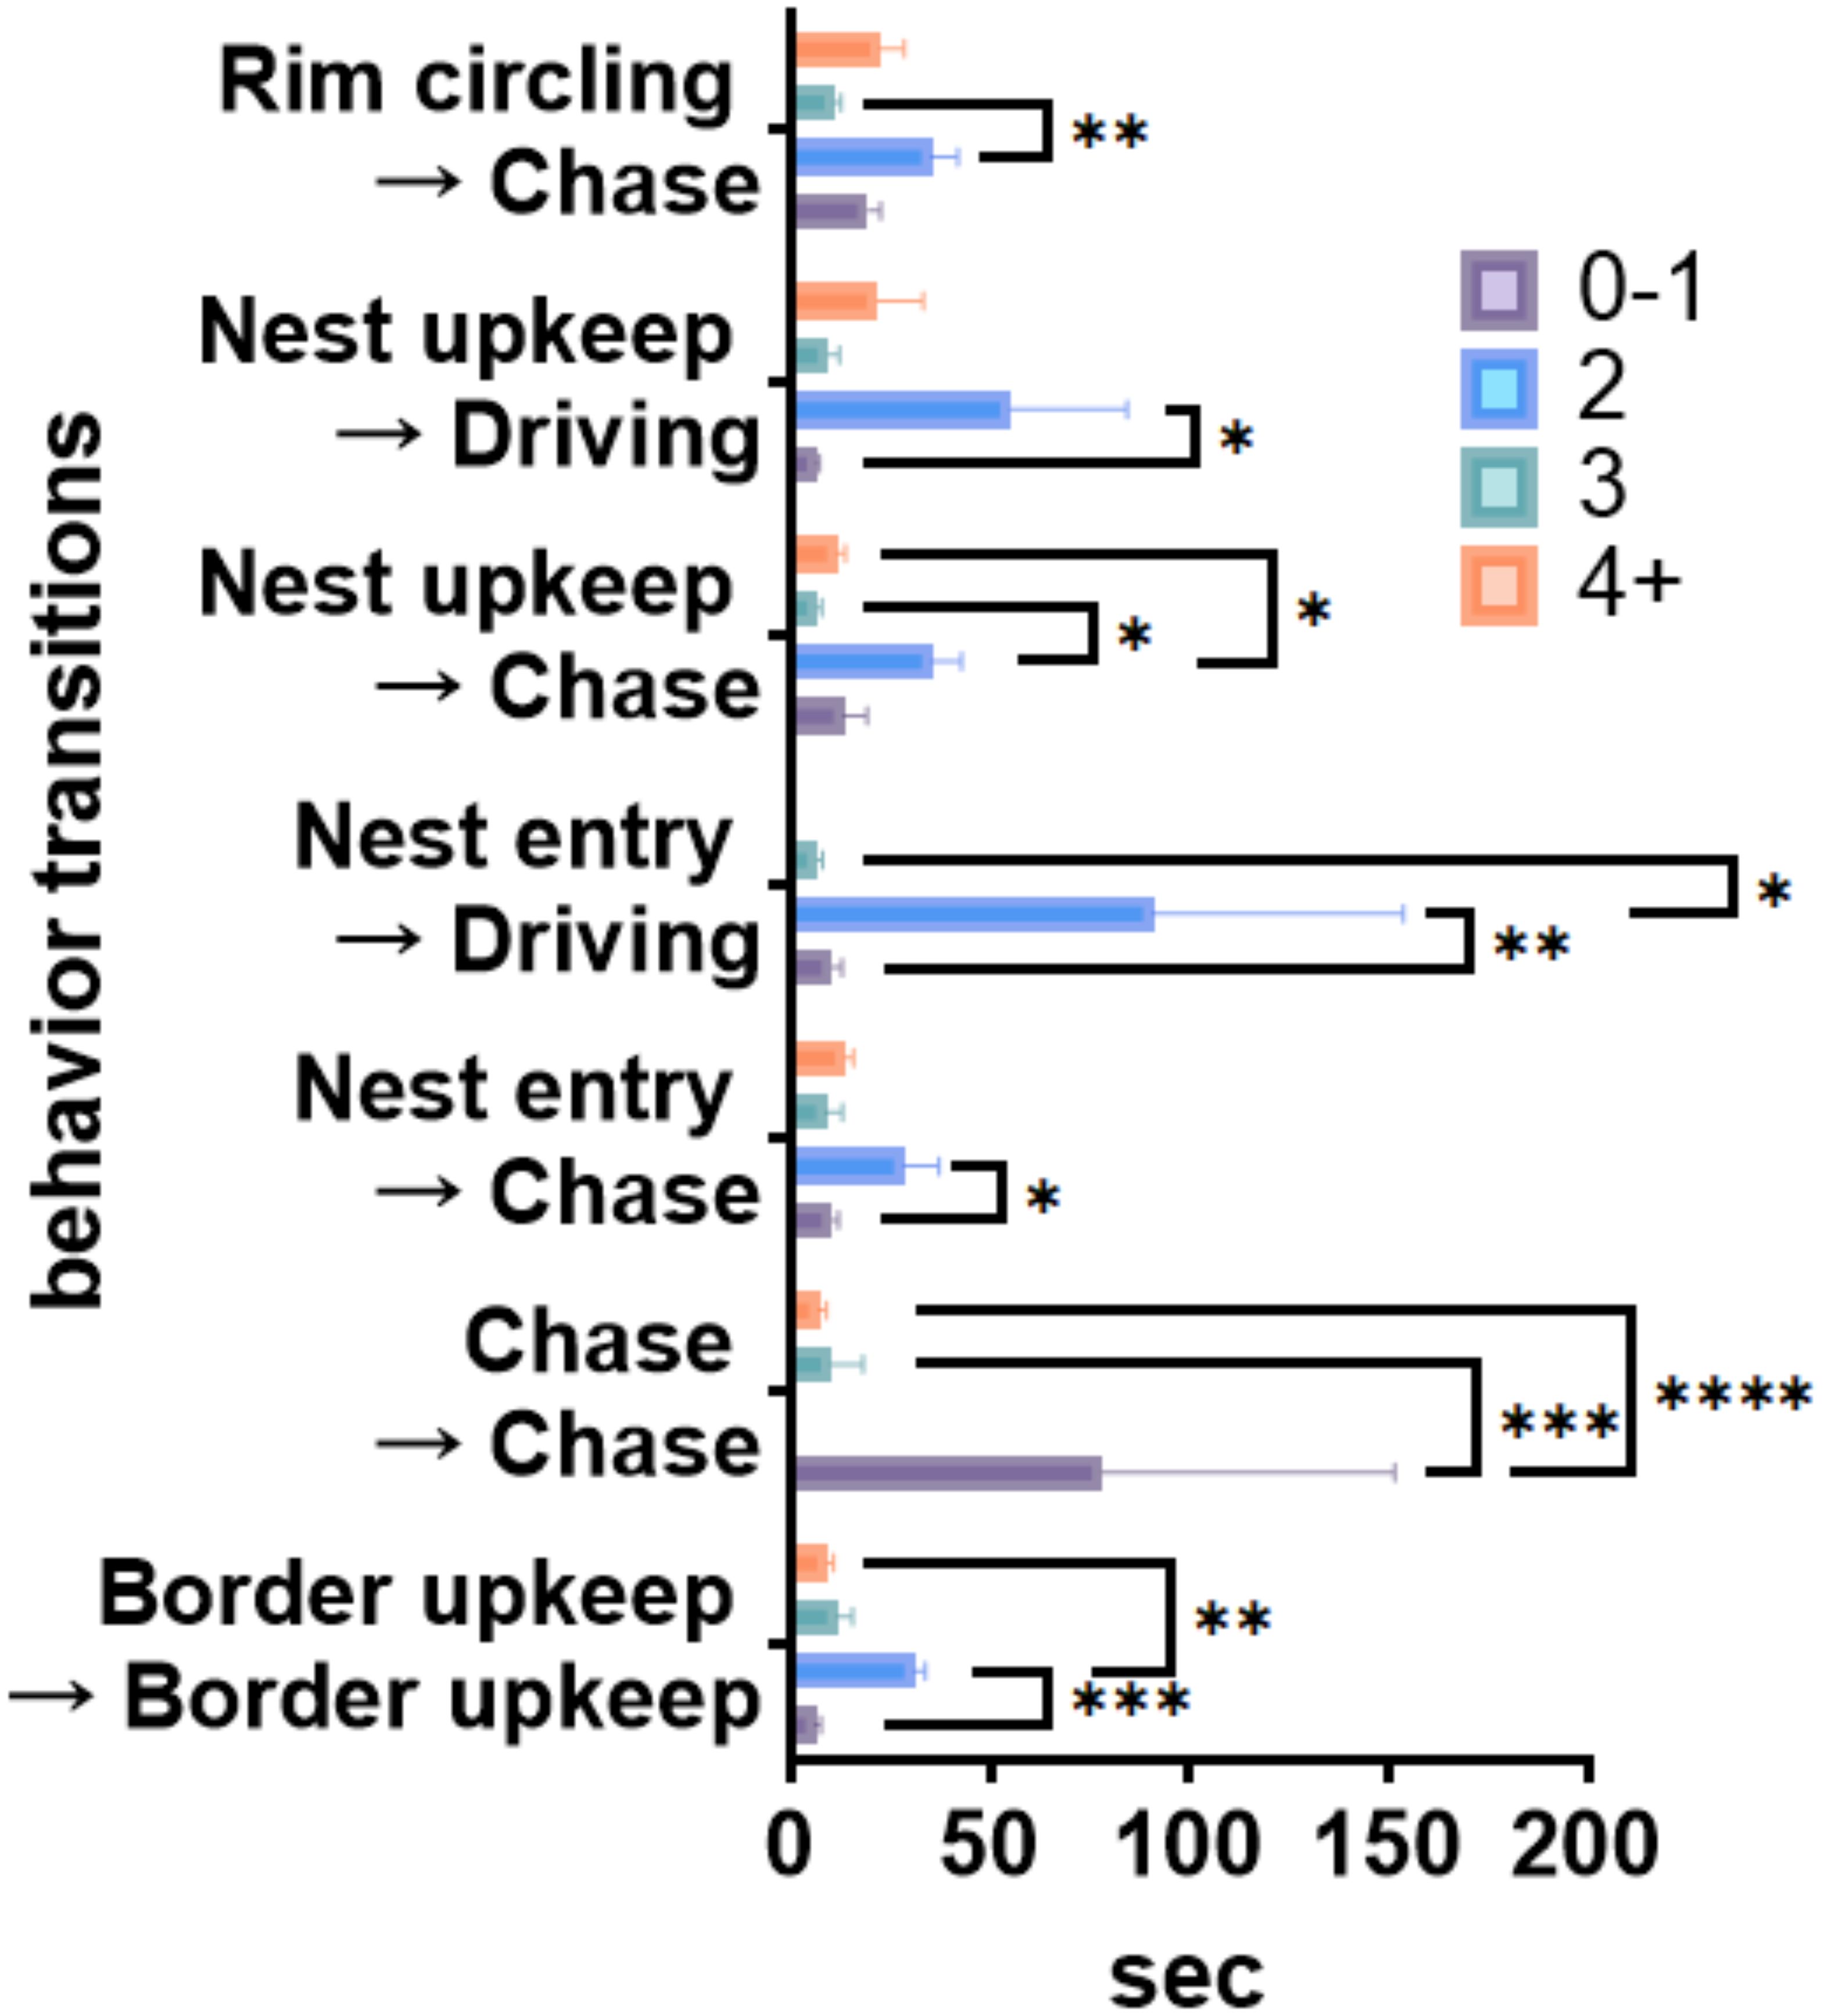
Figure 4. Mean latencies of behavioral transitions that significantly differ between neighbor groups. Mean latency (seconds) of behavioral transitions that contained significant comparisons with error bars showing S.E.M. Two-way ANOVA with significant comparisons using Tukey multiple comparisons test are indicated: *p<0.05, **p<0.01, ***p<0.001, ****p<0.0001.
To localize discrete color patterns to dorsal and ventral portions of the body, we used the R package recolorize to generate a consistent palette of 15 colors and remap them onto the bluegill images (Figure 5A). With this approach, we found correlations between areas of color within the palette and behavior (Figure 5B, see Supplementary Figure S4 for full matrices). However, not all colors are distributed equally on the bluegill body plan, with some observed to be more prevalent above or below midline (i.e., reddish breast color on the anteroventral body region, but total lack of red in the dorsal half of the body). To identify which colors could be involved in differences in lek location, we asked whether there were colors that covered more area on the bluegill than others. We graphed color area proportional to total body area and excluded colors that fell below 5% of the body surface area (Figure 5A. Then, heat maps were generated using the ‘patternize’ package to visualize patterns of color, remapped on the bluegill body plan, only including colors that a) showed a significant difference between groups and b) surpassed the applied cutoff, indicating how much agreement in overlapping color areas was among the neighbor groups (Figure 5B). A gradient between these color patterns is visible between distal and central neighbor groups, suggesting unique relationships between color and lek position. Dark coloration (Color 5) mainly increases from dorsal to ventral sides as neighbors increase, while lighter ventral coloring (Color 11) decreases. We then asked whether fin morphology changes with lek position. The dorsal fin was chosen due to its large area and shift in shape between the spiny rostral portion and soft caudal portion. A two-way ANOVA found no significant differences in effects or in Tukey multiple comparisons (Supplementary Figure S5, two-way ANOVA, Fneighbor(3, 38) = 0.1057, p>0.05; Fsegment(1, 38) = 1.493, p > 0.05; Finteraction(3, 38) = 0.0624, p > 0.05; Tukey multiple comparisons, p > 0.05).
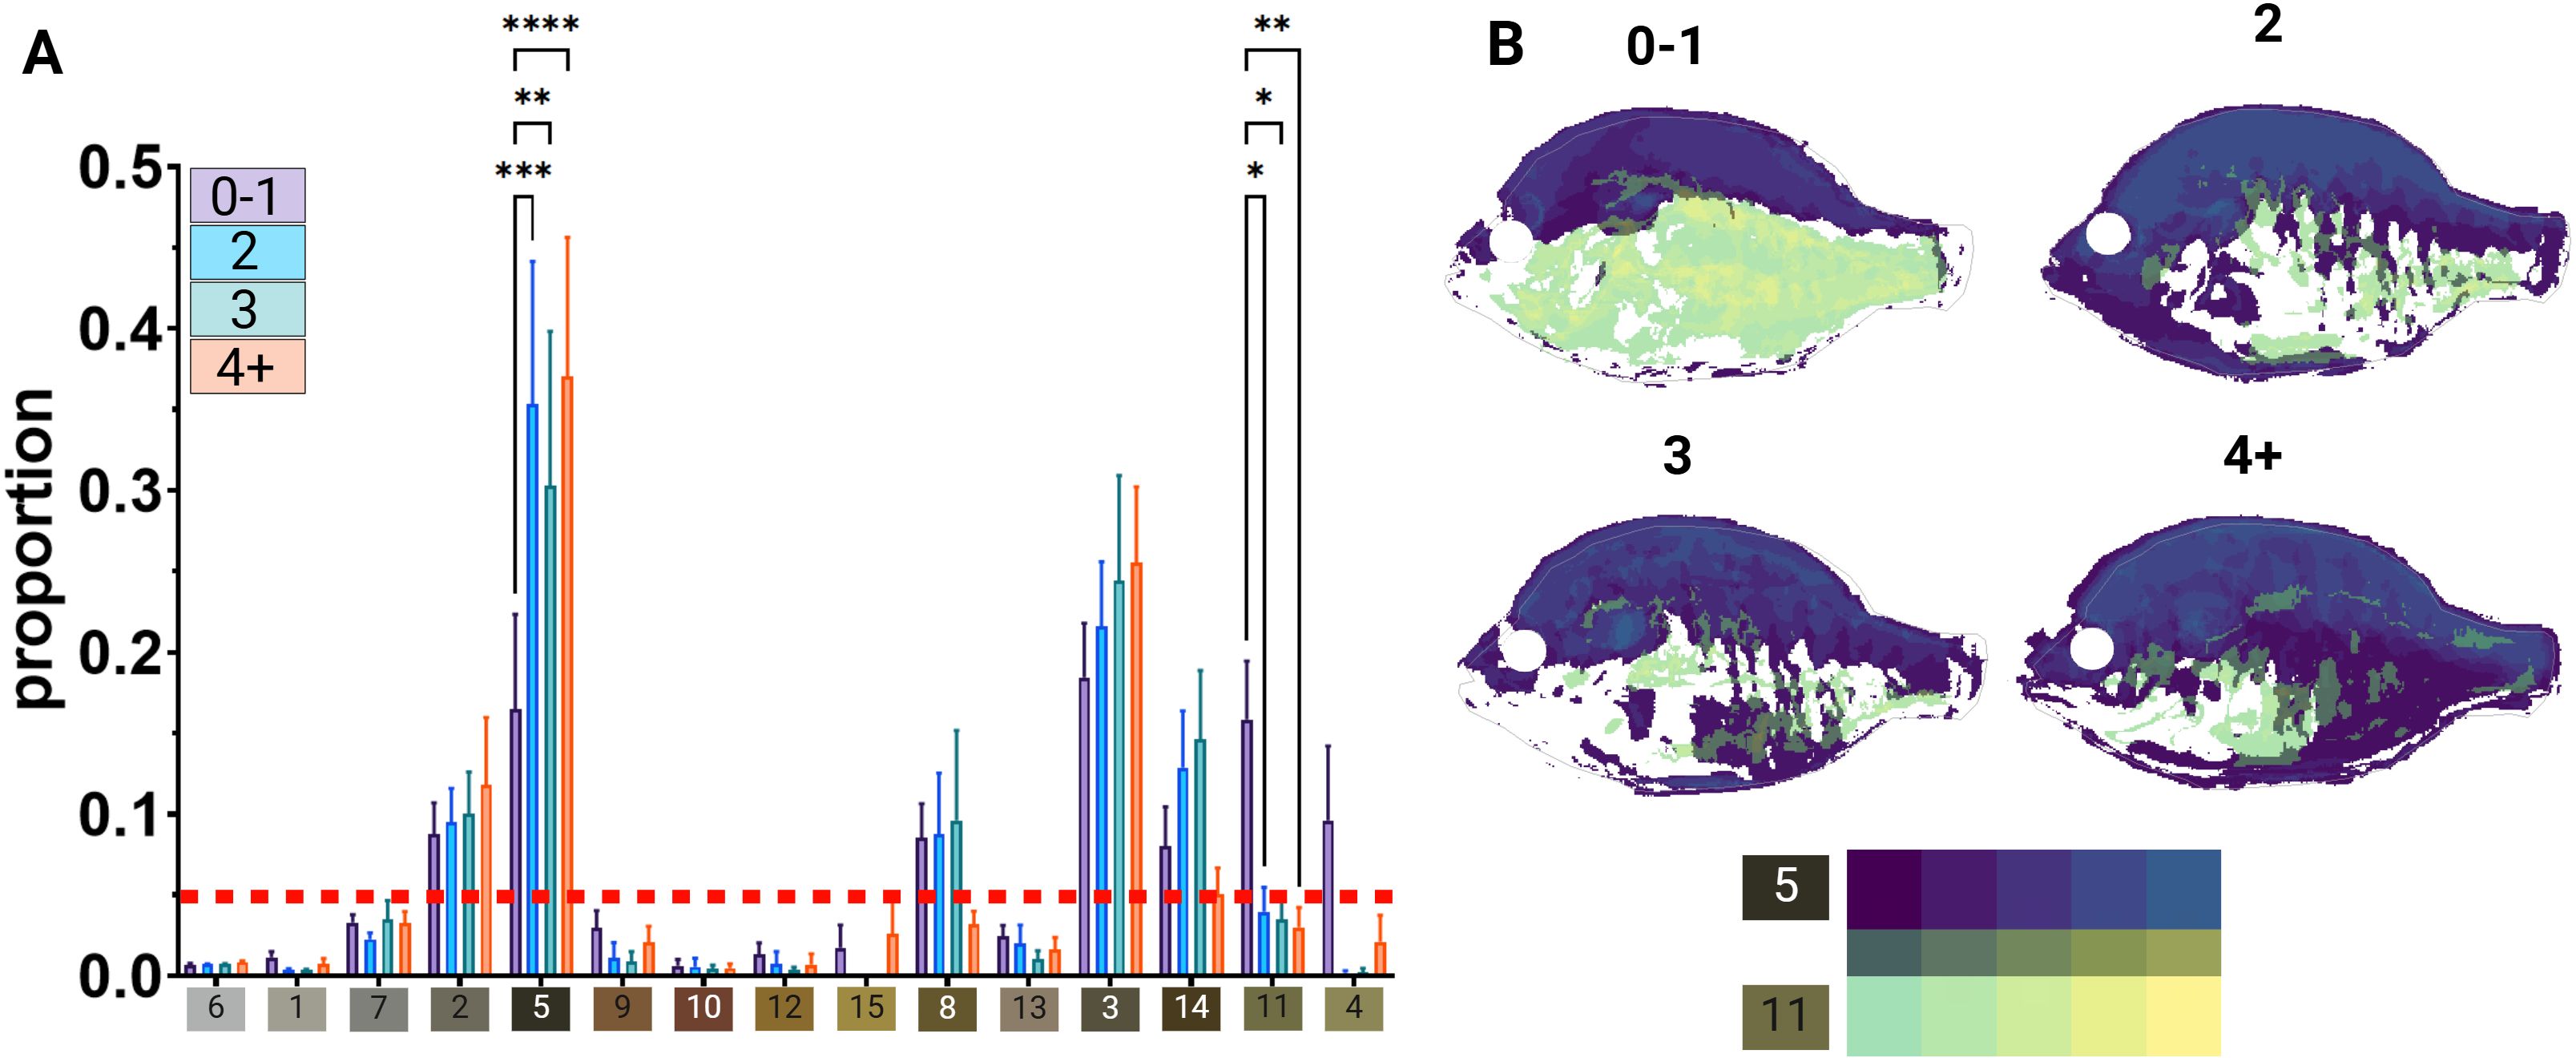
Figure 5. Significant color areas vary between neighbor groups (A) Bar graph visualizing the proportional area of each color by neighbor group. (B) Heat maps of colors significantly different between neighbor groups and exceed a threshold of 5% body area. Two-way ANOVA, significant comparisons using Tukey multiple comparisons test are indicated: *p<0.05, **p<0.01, ***p<0.001, ****p<0.0001. neighbor group. Two-way ANOVA detected no significant variance between segments or neighbor groups (p>0.05).
Our study tested whether bluegill paternal males and their social dynamics are mediated through behavior and visual signaling to manage competition within the lek. Furthermore, we employed emerging computer vision workflows to quantify and localize coloration on the bluegill body plan. Our data shows that bluegill social structure does vary with position within the lek, resulting in different behavioral and color patterns. First, defensive behavior observed in our study, typically aimed at lek outsiders, does not play a significant role in interactions between lek members in a stable bluegill lek in either frequency or sequence centrality. This is important considering a common aspect of lekking as a reproductive strategy often includes intense male competition to secure reproductive opportunities (DuVal and Kempenaers, 2008). Second, nest building, intrusion risk, and reproductive opportunity vary with position within the lek, suggesting a temporal logic to lek membership. However, nest-central behaviors do still occur at all levels of lek position. Lastly, we show that distinct color patterns on the dorsal and ventral parts of the bluegill body plan vary with lek position.
Bluegill leks likely start with an individual founder or group of founders that select optimum locations for territory building. Additional males could join the lek by broadcasting what may be considered their motivation for approaching with dorsal body darkening, similar to what females are described doing prior to courtship, avoiding aggression usually aimed at intruders (Miller, 1963). These data describe a relationship between spatial position, color, and behavior that adds further detail to the described reproductive and social strategies of the paternal bluegill morph. Social hierarchies require the presence of stratified social positions that gain expanded access to resources. Bluegill males with centrally located territories within the lek belong to an elevated social position with increased reproductive opportunity as evidenced by reproductive behavior centrality (Figure 3; Table 2), elevated territoriality via connections between behaviors like ‘Charge,’ ‘Chase,’ and ‘Rim circling.’This is mainly illustrated by an increased probability of ‘Chase’ followed by intrusions when an individual had 0-2 neighbors versus those with 3 or more. These males perform more reproductive behaviors than parentals in the exterior and are likely to occupy their territory for an extended period without food. Meanwhile, distal male behavior is heavily centered around territory construction and defense, as noted by the negative correlation between the number of neighbors and ‘Driving’ behaviors (Figures 2A, C, 3), suggesting their joining after initial territory establishment by central male territories. Mixed-status coalitions like bluegill leks have been most commonly described in manakins, with territory holders collaborating courtship displays with lower-status males (Ryder et al., 2011). Additionally, we noted that 2-neighbor groups seem to be driving much of the variation in behavioral transition latencies (Figure 4, Supplementary Figure S3). While our sampling is limited, we speculate that this variation may indicate lek maturation since no leks were observed that included fewer than 6 territories (personal observation). This could mean that individuals bordering two neighbors play a more integral role in expanding leks.
Most of the described and reported behavior observed in bluegill is centered around the alternative reproductive strategies of males and less so for the social behaviors between males of the same reproductive strategy. Our data shows parental bluegill males form coalitions with other males using the same reproductive strategy while maintaining clear territorial boundaries. Our data, in context with previous studies on bluegill social behavior, suggest that the social hierarchy underlying bluegill lekking might not be apparent by solely analyzing agonistic interactions after the formation of the lek, supporting the so-called ‘dear enemy’ effect (Wilson, 2000). Instead of consistent and intense intrasexual competition and conflict between neighbors, lek members may choose to cooperate to receive direct and indirect benefits of being part of a lek, becoming ‘dear enemies’ that are paradoxically competing (i.e., at the female mate choice level) and cooperating (i.e., at the social level) simultaneously. Figures 2 and 3 demonstrate a lack of clear dominance hierarchies mediated through agonistic, defensive behaviors. Further, male bluegill seem to spend more time maintaining the ‘nest’ portion of their territories than the ‘border’ region, suggesting that the boundaries between each territory are less important as a perimeter keeping other bluegill out (Supplementary Figure S3). However, we note that physical position within the lek seems to be associated with differences in behavior and body color. Color patterns varied greatest between established lek members (groups 2, 3, and 4+) and newcomer parentals (group 0-1), demonstrating clear segregation on the bluegill body plan that may contribute to recognizable visual stimulus consistent with aggressive habituation (Colgan et al., 1979). While territory-building behaviors and intrusion risks are present and vary with physical position in the lek, our data suggest that intralek aggressive behaviors are not a common occurrence after established lek membership. However, our study is limited to a fraction of a bluegill’s behavior during 1-2 hours of their day. Considering this, bluegill behavior may have substantial variability when considering the breadth of the mating season or the duration of an individual’s tenure within the lek. This opens several possibilities about the logic of bluegill lek formation, which is still poorly understood. Little is known about lek founding and whether a founding male or males establish the lek hierarchy after choosing a lek site. Cooperation among lekking bluegill males is evident in the depression of aggressive behavior towards fellow lek members. However, to what extent are bluegill motivated to cooperate is of great interest.
The infrequency of intralek aggression resembles a cooperative breeding community, similar to Neolamprologus pulcher, where subordinate individuals cooperate with the dominant breeding pair and assist with rearing (Wong and Balshine, 2011). In bluegill leks, established lek members cooperate with newcomers, allowing them to construct new territories to possibly attract females to the lek and help defend against infiltrations. Joining and participating in a lek may be mediated hormonally similarly to dominance hierarchies, with each member regulating their reproductive physiology relative to their neighbors. Examples of this can be seen in several taxa, including female wolverines (Gulo gulo) and African cichlids (Dalerum et al., 2006; Dijkstra et al., 2007; Maruska et al., 2022). In the case of the cichlid Astatotilapia burtoni, territory-possessive dominant males suppress non-territorial males, consistently attacking low-ranked males and preventing the expression of color patterns and behaviors typically associated with dominant rank (Maruska et al., 2013). This is reflected in the hypothalamic-pituitary-gonadal (HPG) axis, with subordinated males expressing smaller GnRH1 neurons and testes and exhibiting lower circulating sex hormones than dominant males (Bushnik and Fernald, 1995; Hofmann and Fernald, 2000; Maruska et al., 2011). Several mammalian species signal social status via various scent markers and enforce their positions with aggression as well (Torres et al., 2023). These effects, in combination, may allow for scale in lek size seen in bluegill, where the number of lek members could be proportional to the number of reproductively successful central members, incentivizing males to join the lek and wait for vacancies. While our study did not survey egg clutches in leks, we suspect that the distribution and number of clutches may also vary based on intrusions and behavioral variation between being more distal and central within the lek and will be the focus of future studies.
It is important to note that pigment cells called chromatophores represent this coloration at a cellular/physiological level. In teleosts, these stellate cells exist between dispersed or aggregated states of pigment granules and are organized in layers within the skin as the dermal chromatophore unity (DCU). This DCU can be innervated, subject to hormonal regulation, and can change the colors of bluegill males rapidly. In this study, photographs were taken after the fish was captured and removed from the water before sacrifice (within 1-2 minutes). As such, handling stress could have subtly changed the colors used for computer vision analyses. Since all animals were treated the same in this study, we expect that the coloration our analyses revealed may be morphological and illustrated as a function of chromatophore density and organization within the DCU than the rapid changes that may happen in the wild. From our data, we identified robust qualitative changes in the body coloration and patterning between central/distal members of the lek. While two colors came out in our screen (Figure 5B), the darkness in the body appeared to be highest dorso-ventrally on central males (4+ neighbors) compared to distal males (0-1 neighbors). These data suggest that dark patterning on central males may present highly contrasting body coloration for females. In the African cichlid Melanochromis auratus, whole-body darkening and melanogenesis have been reported to be facilitated by increased innervation of the skin and are most evident in dominant rank males compared to yellow females and non-territorial males (Liang et al., 2020). Typically, body darkening is modulated by the surrounding visual environment as a camouflage tactic for antipredator defense (Masazumi, 1993; Sugimoto, 2002; Sugimoto et al., 2005).
Here, we reveal insights into bluegill breeding leks’ social structure and behavioral dynamics. We found that a male’s position within the lek correlates with specific behavioral patterns and color variations. Central positions in the lek were associated with an increased risk of intrusions by other fish, while peripheral positions showed higher rates of nest-building behaviors. Interestingly, aggressive behaviors between territorial males were infrequent, suggesting a possible cooperative aspect to the lek structure. We also documented distinct color patterns on the dorsal and ventral parts of the fish that varied with lek position. These findings contribute to understanding how social hierarchies and visual signaling may function in lekking species to manage intra-lek competition.
The original contributions presented in the study are included in the article/Supplementary Material. Further inquiries can be directed to the corresponding author.
The animal study was approved by Queens College Institutional Animal Care and Use Committee. The study was conducted in accordance with the local legislation and institutional requirements.
MP: Data curation, Formal analysis, Investigation, Methodology, Project administration, Writing – original draft, Writing – review & editing. LV: Software, Writing – review & editing, Visualization, Methodology. EA: Data curation, Writing – review & editing, Methodology. KA: Data curation, Methodology, Writing – review & editing. FI: Data curation, Methodology, Writing – review & editing. AS: Data curation, Methodology, Writing – review & editing. WF: Data curation, Writing – review & editing, Formal analysis, Supervision. SA: Data curation, Formal analysis, Supervision, Writing – review & editing, Conceptualization, Funding acquisition, Investigation, Project administration, Resources, Visualization, Writing – original draft.
The author(s) declare financial support was received for the research, authorship, and/or publication of this article. This work was supported by an NSF grant (#1921773, 2019) awarded to SGA to support MP. AS was also awarded a Summer Undergraduate Research Program at Queens College (QC-SURP) to support her efforts on the project.
We would like to thank Marci Goodman, the director of the College Now STEM Research Academy, for recruiting high school students Adeeb Saleh, Peilei Yang, Grace Liu, and Evelyn Vasquez as field assistants in this study. Thanks to Renisha Sharma and Symone Rambaran for their support in collecting and scoring behavior. We also thank Dr. Maral Tajerian for her feedback and comments on this manuscript and project and our two peer reviewers for reading our manuscript and offering their thoughtful comments. Lastly, we thank Dr. Jonathan Waldman for inspiring this direction in our lab by sharing his boyhood fishing spot for the sunfish species studied here.
The authors declare that the research was conducted in the absence of any commercial or financial relationships that could be construed as a potential conflict of interest.
The author(s) declare that Generative AI was used in the creation of this manuscript. Grammarly was used to correct grammar, sentence structure, and punctuation.
All claims expressed in this article are solely those of the authors and do not necessarily represent those of their affiliated organizations, or those of the publisher, the editors and the reviewers. Any product that may be evaluated in this article, or claim that may be made by its manufacturer, is not guaranteed or endorsed by the publisher.
The Supplementary Material for this article can be found online at: https://www.frontiersin.org/articles/10.3389/fetho.2024.1513231/full#supplementary-material
Supplementary Figure 1 | Distribution of behavioral frequency among all bluegill studied. Violin plots of behavior frequencies quantified in total (A) and by behavior category (B). Individual points indicate individual bluegill frequency totals (n=23). Dashed lines denote quartiles and median.
Supplementary Figure 2 | Counts of unique transitions grouped by behavior. Total count of behavioral transitions involving a particular behavior category as a function of neighbor grouping. These counts include behavior sequences that both start and end in a particular behavior (ex: Charge → X, X → Charge, and Charge → Charge).
Supplementary Figure 3 | All mean latencies of behavioral transitions. Mean latency of specific behavioral transition with error bars showing S.E.M. Two-way ANOVA with significant comparisons using Tukey multiple comparisons test are indicated: * p<0.05, ** p<0.01, *** p<0.001, p<0.0001.
Supplementary Figure 4 | Expanded color-behavior correlations. Complete Pearson’s r correlation matrices for relationships between proportional areas of color for whole body (A), dorsal (B), and ventral (C) body portions and scored behavior.
Supplementary Figure 5 | Morphometric analysis of bluegill dorsal fin in two segments. (A) Schematic of analysis. Sampled dorsal fins were measured for area in two morphologically distinct regions: spiny dorsal fin (red) and soft dorsal fin (blue). Grouped bar plots of (B) mean area and (C) area percentage of each dorsal fin segment for each neighbor group. Two-way ANOVA detected no significant variance between segments or neighbor groups (p>0.05).
Supplementary Figure 6 | Proportion of territory upkeep behaviors by location. Scored bluegill males (n=23) spend more time maintaining the centrally located nest than maintaining the outer border substrate region. p < 0.01, two-tailed Wilcoxon test (W = -176).
Abbot D. H., Saltzman W., Schultz-Darken N. J., Smith T. E. (1997). Specific neuroendocrine mechanisms not involving generalized stress mediate social regulation of female reproduction in cooperatively breeding marmoset monkeys. Ann. Ny Acad. Sci. 807, 219–238. doi: 10.1111/j.1749-6632.1997.tb51923.x
Alberts A. C. (1994). Dominance hierarchies in male lizards: Implications for zoo management programs. Zoo Biol. 13, 479–490. doi: 10.1002/zoo.1430130510
Alvarado S. G. (2020). Molecular plasticity in animal pigmentation: emerging processes underlying color changes. Integr. Comp. Biol. 60, 1531–1543. doi: 10.1093/icb/icaa142
Avila V. L. (1976). A field study of nesting behavior of male bluegill sunfish (Lepomis macrochirus rafinesque). Am. Midl Nat. 96, 195. doi: 10.2307/2424577
Beehler B. M., Foster M. S. (1988). Hotshots, hotspots, and female preference in the organization of lek mating systems. Am. Nat. 131, 203–219. doi: 10.1086/284786
Belleghem S. M. V., Papa R., Ortiz-Zuazaga H., Hendrickx F., Jiggins C. D., McMillan W. O., et al. (2018). patternize: An R package for quantifying colour pattern variation. Methods Ecol. Evol. 9, 390–398. doi: 10.1111/2041-210x.12853
Bradbury J. W., Gibson R. M. (1983). “Leks and mate choice,” in Mate Choice. Ed. Bateson P. (Cambridge, UK: Cambridge University Press), 109–138.
Bushnik T. L., Fernald R. D. (1995). The population of gnRH-containing neurons showing socially mediated size changes project to the pituitary in a teleost, hapiochromis burtoni. Brain Behav. Evol. 46, 371–377. doi: 10.1159/000113287
Censky E. J. (1997). Female mate choice in the non-territorial lizard Ameiva plei (Teiidae). Behav. Ecol. Sociobiol. 40, 221–225. doi: 10.1007/s002650050336
Cogliati K. M. (2009). Multiple social and ecological factors influence coloration in bluegills (Lepomis macrochirus). (Windsor, Ontario: University of Windsor Electronic Theses and Dissertations).
Cogliati K. M., Corkum L. D., Doucet S. M. (2010). Bluegill coloration as a sexual ornament: evidence from ontogeny, sexual dichromatism, and condition dependence. Ethology 116, 416–428. doi: 10.1111/j.1439-0310.2010.01755.x
Colgan P. W., Nowell W. A., Gross M. R., Grant J. W. A. (1979). Aggressive habituation and rim circling in the social organization of bluegill sunfish (Lepomis macrochirus). Environ. Biol. Fish. 4, 29–36. doi: 10.1007/bf00005925
Dalerum F., Creel S., Hall S. B. (2006). Behavioral and endocrine correlates of reproductive failure in social aggregations of captive wolverines (Gulo gulo). J. Zoöl. 269, 527–536. doi: 10.1111/j.1469-7998.2006.00116.x
Desjardins J. K., Fernald R. D. (2008). How do social dominance and social information influence reproduction and the brain? Integr. Comp. Biol. 48, 596–603. doi: 10.1093/icb/icn089
Dijkstra P. D., Hekman R., Schulz R. W., Groothuis T. G. G. (2007). Social stimulation, nuptial colouration, androgens and immunocompetence in a sexual dimorphic cichlid fish. Behav. Ecol. Sociobiol. 61, 599–609. doi: 10.1007/s00265-006-0289-7
DuVal E. H., Kempenaers B. (2008). Sexual selection in a lekking bird: the relative opportunity for selection by female choice and male competition. Proc. R Soc. B: Biol. Sci. 275, 1995–2003. doi: 10.1098/rspb.2008.0151
Fernald R. D., Maruska K. P. (2012). Social information changes the brain. Proc. Natl. Acad. Sci. 109, 17194–17199. doi: 10.1073/pnas.1202552109
Foundation P. S. (2023). Python (Version 3.9.5). Available online at: https://www.python.org/ (Accessed October 18, 2024).
Friard O., Gamba M. (2016a). BORIS: a free, versatile open-source event-logging software for video/audio coding and live observations. Methods Ecol. Evol. 7, 1325–1330. doi: 10.1111/2041-210x.12584
Friard O., Gamba M. (2016b). BORIS: a free, versatile open-source event-logging software for video/audio coding and live observations. Methods Ecol. Evol. 7, 1325–1330. doi: 10.1111/2041-210x.12584
Garner S. R., Neff B. D. (2013). Alternative male reproductive tactics drive asymmetrical hybridization between sunfishes (Lepomis spp.). Biol. Lett. 9, 20130658. doi: 10.1098/rsbl.2013.0658
Green S., Marler P. (1979). Social behavior and communication. Soc. Behav. Commun. 73–158. doi: 10.1007/978-1-4615-9116-0_3
Gross M. R. (1982). Sneakers, satellites and parentals: polymorphic mating strategies in North American sunfishes. Z. für Tierpsychol. 60, 1–26. doi: 10.1111/j.1439-0310.1982.tb01073.x
Gross M. R., MacMillan A. M. (1981). Predation and the evolution of colonial nesting in bluegill sunfish (Lepomis macrochirus). Behav. Ecol. Sociobiol. 8, 163–174. doi: 10.1007/bf00299826
Hofmann H. A., Fernald R. D. (2000). Social status controls somatostatin neuron size and growth. J. Neurosci. 20, 4740–4744. doi: 10.1523/jneurosci.20-12-04740.2000
Jennions M. D., Petrie M. (1997). Variation in mate choice and mating preferences: A review of causes and consequences. Biol. Rev. 72, 283–327. doi: 10.1111/j.1469-185x.1997.tb00015.x
Kodric-Brown A. (1998). Sexual dichromatism and temporary color changes in the reproduction of fishes. Integr. Comp. Biol. 38, 70–81. doi: 10.1093/icb/38.1.70
Leclercq E., Taylor J. F., Migaud H. (2010). Morphological skin colour changes in teleosts. Fish Fish. 11, 159–193. doi: 10.1111/j.1467-2979.2009.00346.x
Liang Y., Meyer A., Kratochwil C. F. (2020). Neural innervation as a potential trigger of morphological color change and sexual dimorphism in cichlid fish. Sci. Rep-uk. 10, 12329. doi: 10.1038/s41598-020-69239-w
Maruska K. P., Anselmo C. M., King T., Mobley R. B., Ray E. J., Wayne R. (2022). Endocrine and neuroendocrine regulation of social status in cichlid fishes. Horm. Behav. 139, 105110. doi: 10.1016/j.yhbeh.2022.105110
Maruska K. P., Becker L., Neboori A., Fernald R. D. (2013). Social descent with territory loss causes rapid behavioral, endocrine and transcriptional changes in the brain. J. Exp. Biol. 216, 3656–3666. doi: 10.1242/jeb.088617
Maruska K. P., Levavi-Sivan B., Biran J., Fernald R. D. (2011). Plasticity of the reproductive axis caused by social status change in an African cichlid fish: I. Pituitary Gonadotropins. Endocrinol. 152, 281–290. doi: 10.1210/en.2010-0875
Masazumi S. (1993). Morphological color changes in the medaka, Oryzias latipes, after prolonged background adaptation—I. Changes in the population and morphology of melanophores. Comp. Biochem. Physiol. Part Physiol. 104, 513–518. doi: 10.1016/0300-9629(93)90457-f
Miller H. C. (1963). The behavior of the pumpkinseed sunfish, lepomis gibbosus (Linneaus), with notes on the behavior of other species of lepomis and the pigmy sunfish, elassoma evergladei. Behaviour 22, 88–150. doi: 10.1163/156853963x00329
Muske L. E., Fernald R. D. (1987). Control of a teleost social signal: I. Neural basis for differential expression of a color pattern. J. Comp. Physiol. 160, 89–97. doi: 10.1007/bf00613444
Pedersen T. L. (2024).patchwork: the composer of plots. Available online at: https://CRAN.R-project.org/package=patchwork (Accessed October 18, 2024).
Peretti A. V. (2014). “Sexual Selection in Neotropical Species: Rules and Exceptions,” in Sexual Selection: Perspectives and Models from the Neotropics. Eds. Macedo R. H., MaChado G. (London, UK: Academic Press), 33–52.
Peroš M., Chang A., Martashvili A., Alvarado S. G. (2024). Facial and body colouration is linked to social rank in the African cichlid Astatotilapia burtoni. bioRxiv. doi: 10.1101/2024.08.21.608989
Roe K. J., Harris P. M., Mayden R. L. (2002). Phylogenetic relationships of the genera of North American sunfishes and basses (Percoidei: centrarchidae) as evidenced by the mitochondrial cytochrome b gene. Copeia 2002, 897–905. doi: 10.1643/0045-8511(2002)002[0897:protgo]2.0.co;2
Rohwer S. (1978). Parent cannibalism of offspring and egg raiding as a courtship strategy. Am. Nat. 112, 429–440. doi: 10.1086/283284
Ryder T. B., Blake J. G., Parker P. G., Loiselle B. A. (2011). The composition, stability, and kinship of reproductive coalitions in a lekking bird. Behav. Ecol. 22, 282–290. doi: 10.1093/beheco/arq213
Schindelin J., Arganda-Carreras I., Frise E., Kaynig V., Longair M., Pietzsch T., et al. (2012). Fiji: an open-source platform for biological-image analysis. Nat. Methods 9, 676–682. doi: 10.1038/nmeth.2019
Selz O. M., Pierotti M. E. R., Maan M. E., Schmid C., Seehausen O. (2014). Female preference for male color is necessary and sufficient for assortative mating in 2 cichlid sister species. Behav. Ecol. 25, 612–626. doi: 10.1093/beheco/aru024
Selz O. M., Thommen R., Pierotti M. E. R., Anaya-Rojas J. M., Seehausen O. (2016). Differences in male coloration are predicted by divergent sexual selection between populations of a cichlid fish. Proc. R. Soc. B Biol. Sci. 283, 20160172. doi: 10.1098/rspb.2016.0172
Siebeck U. E., Parker A. N., Sprenger D., Mäthger L. M., Wallis G. (2010). A species of reef fish that uses ultraviolet patterns for covert face recognition. Curr. Biol. 20, 407–410. doi: 10.1016/j.cub.2009.12.047
Sugimoto M. (2002). Morphological color changes in fish: Regulation of pigment cell density and morphology. Microsc Res. Tech. 58, 496–503. doi: 10.1002/jemt.10168
Sugimoto M., Yuki M., Miyakoshi T., Maruko K. (2005). The influence of long-term chromatic adaptation on pigment cells and striped pigment patterns in the skin of the zebrafish, Danio rerio. J. Exp. Zool. Part Comp. Exp. Biol. 303A, 430–440. doi: 10.1002/jez.a.177
Swierk L., Ridgway M., Langkilde T. (2012). Female lizards discriminate between potential reproductive partners using multiple male traits when territory cues are absent. Behav. Ecol. Sociobiol. 66, 1033–1043. doi: 10.1007/s00265-012-1351-2
Team R. C. (2024). R: A Language and Environment for Statistical Computing. Available online at: https://www.R-project.org/ (Accessed October 18, 2024).
Torres M. V., Ortiz-Leal I., Sanchez-Quinteiro P. (2023). Pheromone sensing in mammals: A review of the vomeronasal system. Anatomia 2, 346–413. doi: 10.3390/anatomia2040031
Weller H. I., Belleghem S. M. V., Hiller A. E., Lord N. P. (2022). Flexible color segmentation of biological images with the R package recolorize. Biorxiv. doi: 10.1101/2022.04.03.486906
White A. J., Rundle H. D. (2015). Territory defense as a condition-dependent component of male reproductive success in Drosophila serrata. Evolution 69, 407–418. doi: 10.1111/evo.12580
Wickham H. (2016).ggplot2: elegant graphics for data analysis. Available online at: https://ggplot2.tidyverse.org (Accessed October 18, 2024).
Wickham H., François R., Henry L., Müller K., Vaughan D. (2023). dplyr: A Grammar of Data Manipulation. Available online at: https://CRAN.R-project.org/package=dplyr (Accessed October 18, 2024).
Wickham H., Vaughan D., Girlich M. (2024). tidyr: Tidy Messy Data. Available online at: https://CRAN.R-project.org/package=tidyr (Accessed October 18, 2024).
Wilson E. O. (2000). Sociobiology: The New Synthesis. Available online at: https://books.google.com/books?id=v7lV9tz8fXAC&printsec=frontcover&source=gbs_ViewAPIv=onepage&q&f=false (Accessed 2023 Nov 21).
Keywords: coloration, lek behavior, Lepomis, social behavior, bluegill, Lepomis machrochirus, body coloration, lek attendance
Citation: Peroš M, Vij L, Anavian E, Almeida Arteaga K, Haruna FI, Siegman A, Fang W and Alvarado SG (2025) Male bluegill vary in color and behavior relative to their position in a lek. Front. Ethol. 3:1513231. doi: 10.3389/fetho.2024.1513231
Received: 18 October 2024; Accepted: 25 November 2024;
Published: 16 January 2025.
Edited by:
Aras Petrulis, Georgia State University, United StatesReviewed by:
Malgorzata Pilot, Polish Academy of Sciences, PolandCopyright © 2025 Peroš, Vij, Anavian, Almeida Arteaga, Haruna, Siegman, Fang and Alvarado. This is an open-access article distributed under the terms of the Creative Commons Attribution License (CC BY). The use, distribution or reproduction in other forums is permitted, provided the original author(s) and the copyright owner(s) are credited and that the original publication in this journal is cited, in accordance with accepted academic practice. No use, distribution or reproduction is permitted which does not comply with these terms.
*Correspondence: Sebastian Gaston Alvarado, U2ViYXN0aWFuLkFsdmFyYWRvQHFjLmN1bnkuZWR1
Disclaimer: All claims expressed in this article are solely those of the authors and do not necessarily represent those of their affiliated organizations, or those of the publisher, the editors and the reviewers. Any product that may be evaluated in this article or claim that may be made by its manufacturer is not guaranteed or endorsed by the publisher.
Research integrity at Frontiers
Learn more about the work of our research integrity team to safeguard the quality of each article we publish.