 Sheketha R. Hauser1,2*
 Laura B. Ferguson3,4
 Tiebing Liang5
 Erin E. Jarvis1
 R. Dayne Mayfield3
 Richard L. Bell1,2
- 1Department of Psychiatry, Indiana University School of Medicine, Indianapolis, IN, United States
- 2Paul and Carole Stark Neurosciences Research Institute, Indiana University School of Medicine, Indianapolis, IN, United States
- 3Waggoner Center for Alcohol and Addiction Research, University of Texas at Austin, Austin, TX, United States
- 4Department of Neuroscience, University of Texas at Austin, Austin, TX, United States
- 5Department of Gastroenterology, Indiana University School of Medicine, Indianapolis, IN, United States
Background: The interaction between genetics, epigenetics, and the environment plays a key role in the development of alcohol use disorder (AUD). Pharmacological treatments targeting histone deacetylases (HDACs) suggest that HDAC inhibitors (HDACi) may be potential pharmacotherapeutic treatments for AUD. The objective of the current study was to test the effects of different HDACi on ethanol intake in two rat lines selectively bred for high ethanol-consumption.
Method: Adult naïve male high alcohol drinking line 1 (HAD1) or alcohol-preferring (P) rats were given continuous 24-h, 3-bottle, free-choice access to 15%, 30% ethanol concurrently with water for 8 weeks prior to testing entinostat (selective HDAC1i and HADC3i, 0, 1.25, 2.5, 5 mg/kg, i. p.), quisinostat (pan HADCi, 0, 0.5, 1.0, 2.0 mg/kg, i. p.), or tubastatin-A (selective HDAC6i, 0, 1.25, 2.5, 5 mg/kg, i. p.) over 4-5 consecutive days.
Results: In HAD1 rats, entinostat reduced 2-, 4-, and 24-h ethanol intake across the 2nd – 5th test days; while, in P rats, entinostat’s effect was primarily seen at the 24-h time-point, at the highest dose and only across three test days. The high dose of quisinostat effectively reduced 24-h ethanol intake across the 1st—4th test days in HAD1 rats but was ineffective in P rats. Tubastatin-A did not alter ethanol intake in either rat line.
Conclusion: Overall, the results confirmed that a pan and a more selective (HDAC1 and HDAC3) HDACi effectively reduced ethanol intake in HAD1, while only the more selective HDACi reduced ethanol intake in P rats. Inhibition of HDAC6 does not appear to regulate ethanol intake in HAD1 or P rats.
Introduction
Chronic alcohol use is a leading cause of preventable death in the United States (Center for Disease Control, 2025). It causes or exacerbates health and social problems, increases mortality rate, and costs society nearly a quarter trillion dollars each year (c.f., National Institute of Alcohol Abuse and Alcoholism [NIAAA], 2023; Rehm and Imtiaz, 2016). There are only a limited number of FDA-approved pharmacotherapies for alcohol use disorder (AUD) (e.g., Koob and Mason, 2016). Therefore, it is critical that we identify novel, efficacious pharmacotherapeutics for AUD. Genetic studies indicate that individuals with a family history positive (FHP) for alcoholism are more susceptible to developing AUD than family history negative (FHN) subjects (e.g., Lai et al., 2022). However, not every FHP individual develops an AUD, and FHN individuals can often develop AUD. Environmental risk factors such as other drugs of abuse, stress, history of child abuse, poverty, etc., can also contribute to the development of AUD (Deeken et al., 2020). Thus, the interaction of genes and environmental risk factors combine to enhance the risk for developing an AUD (Nieratschker, Batra, and Fallgatter, 2013). In addition, environmental risk factors can alter epigenetics, resulting in changes in phenotypes by modifying the chromatin structure or controlling gene expression without affecting the underlying DNA sequence (e.g., Peedicayil, 2023). Therefore, interactions between genetics, epigenetics, and environmental risk factors, all play a role in the development of AUD (e.g., Nieratschker, Batra, and Fallgatter, 2013). A commonly studied epigenetic modification is induced by histone (de)acetylation processes, which generally increase genetic transcription or accelerate rates of protein production (e.g., Moore, 2017; Pandey and Bohnsack, 2020). Clinical and pre-clinical studies have shown that alcohol exposure can alter histone acetylation and deacetylation via histone acetyltransferases (HATS), histone deacetylase (HDAC) enzymes, and other epigenetic processes (López-Moreno et al., 2015; Pandey et al., 2017; De Carvalho et al., 2021).
Epigenetic modifications are stable but can be reversed. For example, administrating HDAC inhibitors (HDACi) can reverse some of these epigenetic modifications, such as (de)acetylation. HDACs are repressors of gene transcription by deacetylating histone proteins, leading to a transcriptionally repressed chromatin structure. HDACs are divided into zinc-dependent and nicotinamide-adenine-dinucleotide (NAD)-dependent sirtuins (Hull et al., 2016). The HDAC class I family (HDACs 1, 2, 3, and 8), class IIa and IIb families (HDACs 4, 5, 6, 7, 9, and 10), as well as class IV family (HDAC 11) are zinc-dependent, and widely expressed in the brain (Hull et al., 2016; Palmisano and Pandey, 2017). In particular, isoforms of class I, II, and IV HDACs are expressed in brain neurons (Broide et al., 2007). There are low levels of HDACs found in astrocytes and HDACS 2, 3, 4, 5, and 11 are expressed in oligodendrocytes (Graff and Tsai, 2013). Class I HDACs, except for HDCAC six (only cytoplasm), are located in both the nucleus and cytoplasm (Gibson and Murphy, 2010). As noted above, HDACs are implicated in the development of alcohol dependence, ethanol-seeking, and other ethanol/drug-associated behaviors (Werner et al., 2021; Palmisano and Pandey, 2017; Pandey et al., 2017; Kamat et al., 2016). In vivo ethanol exposure and ethanol withdrawal can increase the expression of Class I HDACs, particularly HDAC2, in rodents (Arora et al., 2013; Pandey et al., 2015; Bohnsack et al., 2018; Chen et al., 2019), while in vitro exposure to alcohol can upregulate gene and protein expression levels of HDAC2 in human cells (Agudelo et al., 2011; Agudelo et al., 2016). Agudelo and colleagues (2016) found that all class I HDACs (1, 2, 3, and 8) when examined ex vivo in human primary monocyte-derived dendritic cells, from alcohol users, displayed significantly higher HDAC-associated RNA and protein levels compared to their controls (Agudelo et al., 2016).
The first generation pan HDACi (i.e., an inhibitor of Class I and Class II HDACs), trichostatin A (TSA), is a common HDACi used to examine the involvement of HDACs in excessive ethanol intake by rodents. TSA reduces voluntary ethanol drinking in alcohol-preferring (P) rats, to a greater extent than that observed in alcohol-nonpreferring (NP) rats (Sakharkar et al., 2014). It also reduced ethanol-drinking by outbred Wistar rats using an intermittent 2-bottle choice protocol (Bohnsack et al., 2018). These findings suggest that TSA attenuates ethanol consumption in both genetically selected and non-selected rodents. Clinically, HDAC inhibitors are used as anticancer treatments. However, pan-HDAC inhibitors lead to more adverse side effects such as diarrhea, nausea, vomiting, fatigue, thrombopenia, and neutropenia (c.f., Hontecillas-Prieto et al., 2020). These adverse side effects are reduced when treated with more selective HDACi’s (c.f., Hontecillas-Prieto et al., 2020). To date, there have been no published research examining the effects of entinostat (predominantly an HDAC1 and HADC3 inhibitor), quisinostat (second generation pan HADCi), and tubastatin-A (selective HDAC6 inhibitor) on ethanol consumption in rodents.
The risk for developing an AUD can be modeled through rodent bidirectional selective breeding for high ethanol consumption and preference vs. low ethanol consumption and nonpreference. The P and high alcohol drinking (HAD1) rat lines rats satisfy criteria put forth for an animal model of alcoholism (c.f., Bell et al., 2012; 2017; McBride and Li, 1998; McBride et al., 2014; Murphy et al., 2002). Research on genetic factors contributing to a vulnerability for developing high ethanol-consuming behavior have paralleled findings with FHP, versus control, individuals (e.g., Li et al., 1993; alpha-synuclein; Liang et al., 2003). Both P and HAD rats achieve pharmacologically, often exceeding that associated with binge-drinking (80 mg%), relevant blood alcohol concentrations under limited access, continuous access, and relapse-like conditions (Bell et al., 2006; 2011; 2012; 2014; Dhaher et al., 2012; Murphy et al., 1986; 2002). Therefore, the objectives of the present study were to examine the effects of entinostat, quisinostat, and tubastatin-A on ethanol drinking by adult male HAD1 and P rats.
Materials and methods
Animals
Only male rats were used in the current study. The subjects were ethanol-naïve P and HAD1 rats. Subjects were at least 60 days old at the start of the experiments. All rats received free access to standard laboratory chow (Teklad 2,918X; Envigo, Indianapolis, IN, United States) and water throughout the experiments. The animals were maintained on a 12/12-h reverse dark/light cycle (lights off at 1,100 h). Subjects were housed in a temperature- (21°C) and humidity- (50%) controlled vivarium. All research protocols were approved by the Institutional Animal Care and Use Committee (IACUC) of the Indiana University School of Medicine (Indianapolis, IN, United States) and are in accordance with the guidelines of the IACUC of the National Institute on Alcohol Abuse and Alcoholism (NIAAA), National Institute on Drug Abuse (NIDA), National Institutes of Health (NIH), and the Guide for the Care and Use of Laboratory Animals (Research Institute for Laboratory Animal Research, 2011).
Test compounds
The ethanol solution was prepared as 15% and 30% v/v in tap water from 190-proof ethanol (Fischer Scientific, Waltham, MA, United States). Entinostat (selective HDAC1-HADC3 inhibitor; SelleckChem, Houston, TX, United States), quisinostat (second generation pan-HDAC inhibitor; SelleckChem, Houston, TX, United States), and tubastatin-A (selective HDAC6 inhibitor; SelleckChem, Houston, TX, United States) were mixed daily with 0.25% Tween (Sigma-Aldrich, St. Louis, MO, United States) in sterile saline for a volume of 1.5 mL/kg body weight. Quisinostat (N = 60; n = 10/dose for HAD1 rats; n = 5/dose for P rats) was administered intraperitoneally (i.p.) at the following doses: 0, 0.5, 1.0, or 2.0 mg/kg. These doses were selected to approximate those previously reported for TSA, another pan-HDACi, that reduced ethanol drinking in P rats (Sakharkar et al., 2014). Entinostat (N = 72; n = 10/dose for HAD1 rats; n = 8/dose for P rats) and tubastatin-A (N = 80; n = 10/dose for HAD1 rat; n = 10/dose for P rats) were administered i. p. at the following doses: 0, 1.25, 2.5, or 5.0 mg/kg. The entinostat doses were selected to approximate those previously reported by Warnault et al. (2013), and similar doses were used for tubastatin-A. The vehicle consisted of 0.25% Tween in sterile saline.
Continuous 24-h (3-bottle choice) access to ethanol
The rats were individually housed in hanging stainless steel wire-mesh cages (with individual Plexiglas platform in the cages) for 3-bottle choice (3BC) ethanol (15% and 30%, concurrently) drinking access. The rats were allowed to consume 15% and 30% ethanol with water for 8 weeks of 24-h continuous access drinking (Figure 1, experimental timeline created with BioRender®).

Figure 1. Depicts the experimental timeline.
Compound testing procedures
The effects of entinostat, quisinostat, or tubastatin-A on ethanol intake in HAD1 and P rats were examined at 2-h (1300 h), 4-h (1500 h), and 24-h (∼1045 h) post-injection (injection at 1030–1100 h). A different cohort of animals was used for each test compound to avoid any carry-over effects. The rats were randomly assigned to treatment groups and dose group membership was balanced using the last 5 days of ethanol drinking, before the week of testing, as the baseline. During the test week (Monday-Friday), ethanol, water, food, and body weight measures were collected at 1,000 h (1 h prior to lights out). Entinostat, quisinostat, or tubastatin-A were administered daily at ∼1,030 h (30 min prior to lights out) for four or five consecutive days. P rats were treated with quisinostat for only four test days due to the limited availability of the test compound (to ensure drugs from the same lot number were used). Tubastatin-A was tested for 4 days in P and HAD1 rats due to the limited availability of the test compound (to ensure drugs from the same lot number were used). Ethanol and water access were returned at 1,100 h (lights out) on test days.
Data analyses and statistics
Ethanol and water intakes were determined as the difference in the weight of glass bottle, and its contents, prior to and after each time-point (2-, 4-, and 24-h). Ethanol intake was then converted to g of absolute (i.e., corrected for ethanol’s specific gravity) ethanol consumed/kg of body weight/unit of time measurement (g/kg/time-period), water-intake was measured as ml/time-period, food-intake was measured as g/kg body weight, and body weight measured in grams. IBM SPSS version 29 was used to analyze data, and GraphPad version 10.3.1 was used to graph the data (mean ± SEM). Data were analyzed with mixed ANOVAs, with repeated measures for time-point and test day, and appropriate simple main effects with one-way ANOVAs, followed by Dunnett’s t-test for planned comparisons (i.e., dose vs. control). P-values <0.05 were considered statistically significant.
Results
Effects of entinostat on ethanol intake
P rats
Two-hour ethanol intake. For the P rats, analysis of the 2-h ethanol intake data revealed significant main effects of Dose [F(3,28) = 2.938, p = 0.05; partial eta-squared = 0.239 with a power of 0.633] and Test Day [F(4,112) = 6.452, p < 0.001; partial eta-squared = 0.187 with a power of 0.989] (Figure 2). Planned comparison Dunnett t-tests revealed the middle dose of entinostat significantly reduced ethanol intake on the third test day.
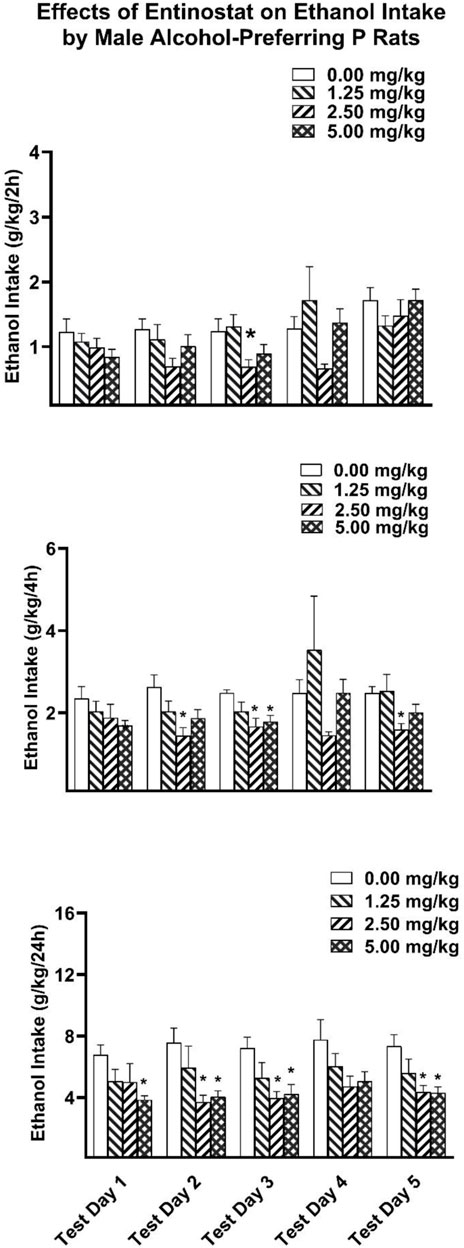
Figure 2. Depicts the mean (±SEM) ethanol intake (g/kg) in male P rats at (Upper Panel) 2-h, (Middle Panel) 4-h, and (Lower Panel) 24-h time points following i. p. administration 0, 1.25, 2.5, 5 mg/kg of entinostat. *(p < 0.05) Indicates that entinostat significantly reduced ethanol compared to control values in male P rats.
Four-hour ethanol intake. Analysis of the 4-h ethanol intake revealed a significant main effect of Dose [F(3,28) = 3.814, p = 0.021; partial eta-squared = 0.290 with a power of 0.759]. Planned comparison Dunnett t-tests revealed the middle dose of entinostat significantly reduced ethanol intake on the second, third, and fifth test days, with the highest dose of entinostat significantly reducing ethanol intake on the third test day.
Twenty 4-h ethanol intake. Analysis of the 24-h ethanol intake revealed a significant main effect of Dose [F(3,28) = 4.648, p = 0.009; partial eta-squared = 0.332 with a power of 0.844]. Planned comparison Dunnett t-tests revealed that the two higher doses of entinostat significantly reduced ethanol intake on the second, third, and fifth test days, with the highest dose of entinostat also reducing ethanol intake on the first test day.
HAD1 rats
Two-hour ethanol intake. For the HAD1 rats, analysis of the 2-h ethanol intake data revealed significant main effects of Dose [F(3,36) = 23.857, p < 0.001; partial eta-squared = 0.665 with a power of 0.999] and test day [F(4,144) = 20.983, p < 0.001; partial eta-squared = 0.368 with a power of 0.999] (Figure 3). Planned comparison Dunnett t-tests revealed on the first test day the lowest and highest doses of entinostat significantly reduced ethanol intake. All three doses significantly reduced ethanol intake on the second through fifth test days.
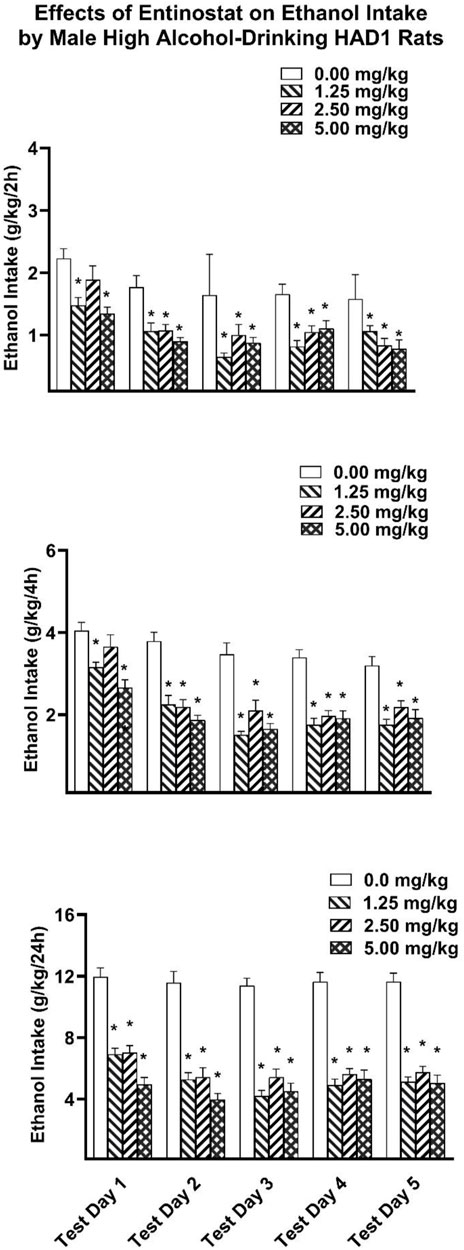
Figure 3. Depicts the mean (±SEM) ethanol intake (g/kg) in male HAD1 rats at (Upper Panel) 2-h, (Middle Panel) 4-h, and (Lower Panel) 24-h time points following i. p. administration 0, 1.25, 2.5, 5 mg/kg of entinostat. *(p < 0.05) Indicates that entinostat significantly reduced ethanol compared to control values in male HAD1 rats.
Four-hour ethanol intake. Analysis of the 4-h ethanol intake revealed a significant Dose × Test Day interaction [F(12,144) = 2.530, p = 0.005; partial eta-squared = 0.174 with a power of 0.968] as well as main effects of Dose [F(3,36) = 33.928, p < 0.001; partial eta-squared = 0.739 with a power of 0.999] and Test Day [F(4,144) = 39.123, p < 0.001; partial eta-squared 0.521 with a power of 0.999]. Planned comparison Dunnett t-tests revealed the lowest and highest doses of entinostat significantly reduced ethanol intake on the first test day. All three doses significantly reduced ethanol intake on the second through fifth test days.
Twenty 4-h ethanol intake. Analysis of the 24-h ethanol intake revealed a significant Dose × Test Day interaction [F(12,144) = 3.572, p < 0.001; partial eta-squared = 0.229 with a power of 0.997] as well as main effects for Dose [F(3,36) = 53.422, p < 0.001; partial eta-squared = 0.817 with a power of 0.999] and Test Day [F(4,144) = 15.560, p < 0.001; partial eta-squared = 0.302 with a power of 0.999]. Planned comparison Dunnett t-tests revealed that all three doses of entinostat significantly reduced ethanol intake across all five Test Days.
Effects of entinostat on water intake
P rats
For the P rats, analysis of the 2-h water intake data revealed no significant Dose (p > 0.05) effects (Supplementary Figure S1). Analysis of the 4-h water intake revealed no significant Dose (p > 0.05) effects. Analysis of the twenty-four -hour water intake revealed a significant main effect for Dose [F(3,28) = 5.629, p = 0.004; partial eta-squared = 0.376 with a power of 0.910].
For the 2-h water intake, the planned comparison Dunnett t-tests revealed the middle dose of Entinostat significantly increased water intake on the third test day, whereas there were no significant Dose effects for the 4-h water intake. For the 24-h water intake, planned comparison Dunnett t-tests revealed that the lowest entinostat Dose increased water intake on the second test day, the lowest and mid doses of entinostat significantly increased water intake on the third test day, and all entinostat doses significantly increased water intake on the fourth test day.
HAD1 rats
For the HAD1 rats, analysis of the 2-h water intake data revealed a main effect of Dose [F(3,36) = 3.790, p = 0.018; partial eta-squared = 0.240 with a power of 0.770] (Supplementary Figure S2). Analysis of the 4-h water intake revealed a significant Dose × Test Day interaction [F(12,144) = 2.789, p = 0.002; partial eta-squared = 0.189 with a power of 0.982] as well as a significant Dose main effect [F(3,36), p = 0.028; partial eta-squared = 0.221 with a power of 0.719]. Analysis of the 24-h water intake revealed a significant Dose × Test Day interaction [F(9,108) = 2.124, p = 0.033; partial eta-squared = 0.150 with a power of 0.856] as well as a main effect for Dose [F(3,36) = 11.306, p < 0.001; partial eta-squared = 0.485 with a power of 0.998].
Two-hour water intake: planned comparison Dunnett t-tests revealed the highest dose of entinostat significantly increased water intake on the second and the third test days. In addition, the lowest entinostat dose significantly increased water intake on the fourth test day. Four-hour water intake: the planned comparison Dunnett’s t-tests revealed the highest entinostat Dose significantly increased water intake on the first and second test days and the lowest entinostat Dose significantly increased water intake on the third and fourth test days. Twenty-four-hour water intake: planned comparison Dunnett’s t-tests revealed that the lowest and highest entinostat Dose significantly increased water intake on the first test day. In addition, all three entinostat doses significantly increased water intake on the second, third, and fourth test days.
Effects of entinostat on body weight and food intake
P rats
For the P rats, analysis of the body weight revealed a significant Dose × Test Day interaction [F(12,112) = 7.355, p < 0.001; partial eta-squared = 0.441 with a power of 0.999] but the Dose main effect was not significant (Supplementary Figure S7). Analysis of the food intake data revealed a significant Dose main effect [F(3,28) = 7.445, p < 0.001; partial eta-squared = 0.444 with a power of 0.971], which was primarily driven by the high entinostat dose significantly decreasing food intake across test days 2 through 4.
HAD1 rats
For the HAD1 rats, analysis of the body weight revealed a significant Dose × Test Day interaction [F(12,144) = 13.851, p < 0.001; partial eta-squared = 0.536 with a power of 0.999] but the Dose main effect was not significant (Supplementary Figure S8). Analysis of the food intake data revealed a significant Dose main effect [F(3,36) = 6.853, p < 0.001; partial eta-squared = 0.363 with a power of 0.963], which was primarily driven by the high entinostat Dose significantly decreasing food intake across Test Days 2 through 4.
Effects of quisinostat on ethanol intake
P rats
For the P rats, analysis of the 2-h ethanol intake data revealed significant main effect for Test Day [F(3,48) = 5.678, p = 0.002; partial eta-squared = 0.262 with a power of 0.929] (Figure 4). Analysis of the 2-h ethanol intake data did not reveal any significant Dose effects. Analysis of the 4-h and twenty-four ethanol intakes revealed that there were no significant interactions or main effects of dose and test day.
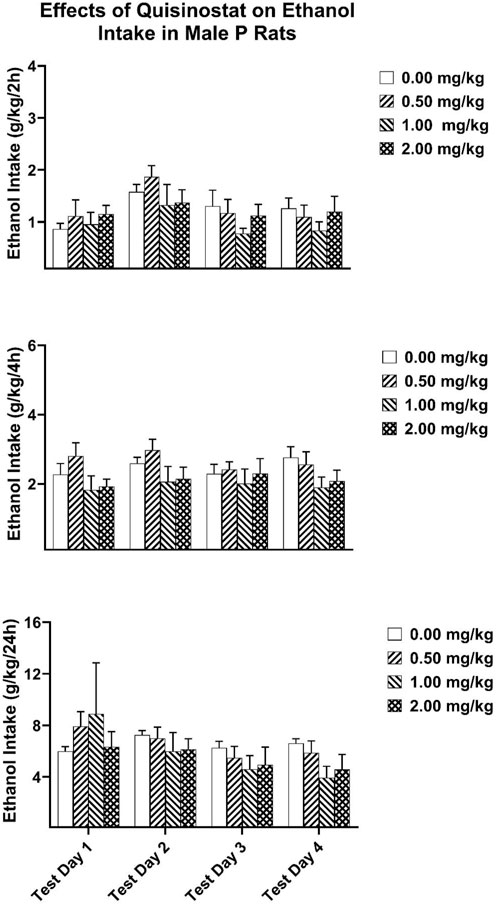
Figure 4. Depicts the mean (±SEM) ethanol intake (g/kg) in male P rats at (Upper Panel) 2-h, (Middle Panel) 4-h, and (Lower Panel) 24-h time points following i. p. administration 0, 0.5, 1, 2 mg/kg of quisinostat.
HAD rats
For the HAD1 rats, analysis of the 2-h ethanol intake data revealed a significant Dose × Test Day interaction [F(9,108) = 4.601, p < 0.001; partial eta-squared = 0.277 with a power of 0.998] as well as significant main effects for Dose [F(3,36) = 9.702, p = 0.011; partial eta-squared = 0.447with a power of 0.995] and Test Day [F(3,108) = 20.921, p < 0.001; partial eta-squared = 0.368 with a power of 0.999] (Figure 5). Analysis of the 4-h ethanol intake revealed a significant Dose × Test Day interaction [F(9,108) = 5.456, p < 0.001; partial eta-squared = 0.313 with a power of 0.999] as well as main effects of Dose [F(3,36) = 5.157, p = 0.005; partial eta-squared = 0.301 with a power of 0.893] and Test Day [F(3,108) = 16.699, p < 0.001; partial eta-squared 0.317 with a power of 0.999]. Analysis of the 24-h ethanol intake revealed a significant Dose × Test Day interaction [F(9,108) = 8.779, p < 0.001; partial eta-squared = 0.422 with a power of 0.999] as well as main effects for Dose [F(3,36) = 13.980, p < 0.001; partial eta-squared = 0.5838 with a power of 0.999] and Test Day [F(3,108) = 37.792, p < 0.001; partial eta-squared = 0.477 with a power of 0.999].

Figure 5. Depicts the mean (±SEM) ethanol intake (g/kg) in male HAD1 rats at (Upper Panel) 2-h, (Middle Panel) 4-h, and (Lower Panel) 24-h time points following i. p. administration 0, 0.5, 1, 2 mg/kg of quisinostat. *(p < 0.05) Indicates that quisinostat significantly reduced ethanol compared to control in male HAD1 rats.
Two-hour ethanol intake: planned comparison Dunnett t-tests revealed the highest dose of quisinostat significantly reduced ethanol on the first test day. All three doses significantly reduced ethanol intake on the third and fourth test days. Four-hour ethanol intake: planned comparison Dunnett t-tests revealed the highest dose of quisinostat significantly reduced ethanol intake on the third test day. All three doses significantly reduced ethanol intake on the fourth test day. Twenty-four-hour ethanol intake: planned comparison Dunnett t-tests revealed that the highest dose of quisinostat significantly reduced ethanol intake across all four test days. The lowest and mid-dose of quisinostat significantly reduced ethanol intake on the fourth test day.
Effects of quisinostat on water intake
P rats
For the P rats, analysis of the 2-h water intake data revealed no significant Dose (p > 0.05) effects. Analysis of the 4-h water intake revealed no significant Dose (p > 0.05) effects (Supplementary Figure S3). Analysis of the 24-h water intake revealed a significant Dose × Test Day interaction [F(9,48) = 2.211, p = 0.037; partial eta-squared = 0.293 with a power of 0.834] as well as a main effect of Dose [F(3,16) = 5.442, p < 0.009; partial eta-squared = 0.505 with a power of 0.863]. For the Twenty-four hour water intake, the planned comparison Dunnett t-tests revealed that the highest quisinostat dose increased water intake on the first and fourth test days.
HAD1 rats
For the HAD1 rats, analysis of the 2-h water intake data revealed a significant Dose × Test Day interaction [F(9,108) = 2.778, p = 0.006; partial eta-squared = 0.188 with a power of 0.946] as well as a main effect of Dose [F(3,36) = 11.120, p < 0.011; partial eta-squared = 0.481 with a power of 0.998] (Supplementary Figure S4). Analysis of the 4-h water intake revealed a significant Dose × Test Day interaction [F(9,108) = 3.547, p < 0.001; partial eta-squared = 0.228 with a power of 0.985] as well as a significant Dose main effect [F(3,36) = 9.236, p < 0.001; partial eta-squared = 0.435 with a power of 0.993]. Analysis of the 24-h water intake revealed a significant Dose × Test Day interaction [F(9,108) = 3.655, p < 0.001; partial eta-squared = 0.233 with a power of 0.988] as well as a main effect for Dose [F(3,36) = 7.043, p < 0.001; partial eta-squared = 0.370 with a power of 0.967].
Two-hour water intake: planned comparison Dunnett t-tests revealed the highest dose of quisinostat significantly increased water intake on the second and fourth test days. Four-hour water intake: the planned comparison Dunnett’s t-tests revealed the highest quisinostat dose significantly increased water intake on the first through fourth test days. Twenty-four-hour water intake: planned comparison Dunnett’s t-tests revealed that the highest quisinostat dose significantly increased water intake on the first, third, and fourth test days.
Effects of quisinostat on body weight and food intake
P rats
For the P rats, analysis of the body weight revealed a significant Dose × Test Day interaction [F(9,48) = 3.096, p = 0.005; partial eta-squared = 0.367 with a power of 0.949] but the Dose main effect was not significant (Supplementary Figure S9). Analysis of the food intake data revealed a significant Dose × Test Day interaction [F(9,48) = 2.989, p = 0.007; partial eta-squared = 0.359 with a power of 0.941]. There was also a Dose main effect [F(3,16) = 9.748, p < 0.001; partial eta-squared = 0.646 with a power of 0.987] and Test Day main effect [F(3,48) = 12.649, p < 0.001; partial eta-squared = 0.442 with a power of 0.999], which was primarily driven by the high quisinostat Dose significantly decreasing food intake across test days 2 through 4.
HAD1 rats
For the HAD1 rats, analysis of the body weight revealed a significant Dose × Test Day interaction [F(9,108) = 5.501, p < 0.001; partial eta-squared = 0.314 with a power of 0.999] but the Dose main effect was not significant (Supplementary Figure S10). Analysis of the food intake data revealed a significant Dose × Test Day interaction [F(9,108) = 5.475, p < 0.001; partial eta-squared = 0.313 with a power of 0.999] but the Dose main effect was not significant.
Effects of tubastatin-A on ethanol intake
P rats
For the P rats, the Dose × Test Day x Test Time mixed ANOVA revealed a significant Dose × Test Time [F(6,70) = 2.848, p = 0.015; partial eta-squared = 0.196 with a power of 0.860] as well as a Test Day x Test Time [F(6,210) = 2.310, p = 0.035; partial eta-squared = 0.062 with a power of 0.794] interaction (Figure 6). Analysis of the two- and 4-h ethanol intake data did not reveal any significant Dose effects. Analysis of the 24-h ethanol intake only revealed a main effect of Dose that approached significance [F(3,35) = 2.762, p = 0.057; partial eta-squared = 0.191 with a power of 0.617].
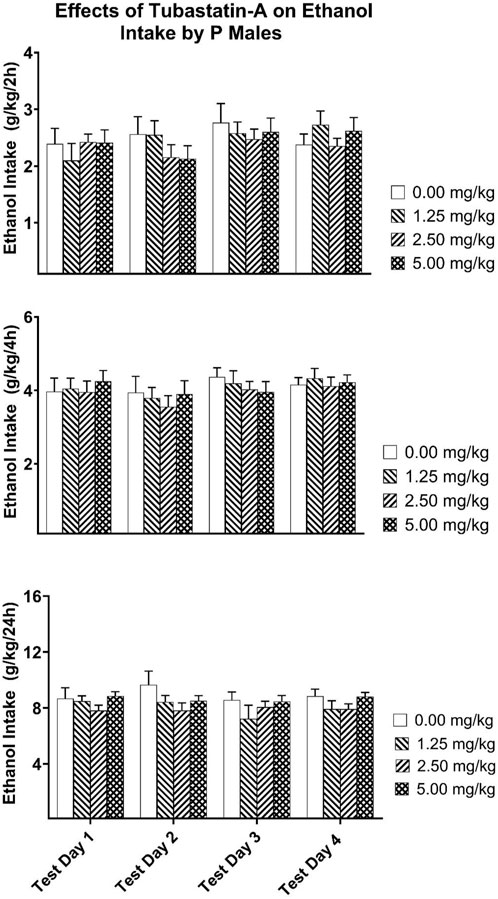
Figure 6. Depicts the mean (±SEM) ethanol intake (g/kg) in male P rats at (Upper Panel) 2-h, (Middle Panel) 4-h, and (Lower Panel) 24-h time points following i. p. administration 0, 1.25, 2.50, 5.00 mg/kg of tubastatin-A in male P rats.
HAD1 rats
For the HAD1 rats, the Dose × Test Day × Test Time mixed ANOVA revealed a significant Test Day × Test Time [F(6,210) = 2.310, p = 0.035; partial eta-squared = 0.062 with a power of 0.794] interaction (Figure 7). Analysis of the two-, four-, and 24-h ethanol intake data did not reveal any significant Dose effects.
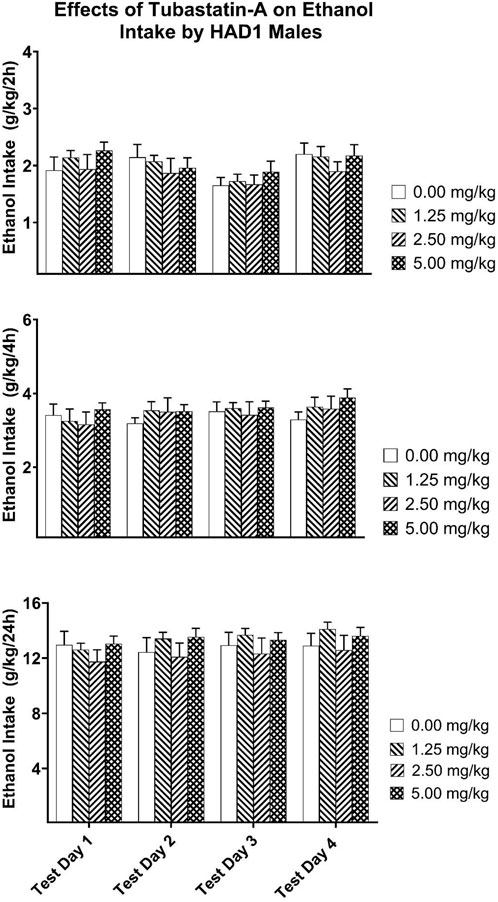
Figure 7. Depicts the mean (±SEM) ethanol intake (g/kg) in male HAD1 rats at (Upper Panel) 2-h, (Middle Panel) 4-h, and (Lower Panel) 24-h time points following i. p. administration 0, 1.25, 2.50, 5.00 mg/kg of tubastatin-A in male HAD1 rats.
Effects of tubastatin-A on water intake
P rats
For the P rats (Supplementary Figure S5), the Dose x Test Day x Test Time mixed ANOVA revealed no significant Dose effects. Analysis of the two- and twenty-four water intake data revealed no significant Dose effects (Supplementary Figure S5). Analysis of the 4-h water intake revealed a significant Dose [F(3,35) = 5.139, p = 0.005; partial eta-squared 0.306, with a power of 0.891] main effect.
HAD1 rats
For the HAD1 rats (Supplementary Figure S6), the Dose × Test Day x Test Time mixed ANOVA revealed a significant Dose × Test Time [F(6,72) = 7.531, p < 0.001; partial eta-squared = 0.386, with a power of 0.999] interaction as well as a Dose [F(3,36) = 3.592, p = 0.023; partial eta-squared = 0.230, with a power of 0.745] main effect (Supplementary Figure S6). Analysis of the two- and 4-h water intake data revealed no significant Dose effects. Analysis of the 24-h water intake revealed a significant Dose [F(3,36) = 5.945, p = 0.002; partial eta-squared = 0.331, with a power of 0.934] main effect.
Effects of tubastain-A on food intake and body weight
For the P (Supplementary Figure S11) and HAD1 (Supplementary Figure S12) rats, analysis of food intake and body weight data revealed no significant Dose effects.
Discussion
The major findings of the present study were that the HDAC inhibitors (HDACi) entinostat, with selectivity for HDAC1 and HDAC3 (Figure 3; Table 1), and quisinostat, a second generation pan-HDACi (Figure 5; Table 1), reduced ethanol intake in HAD1, while only entinostat reduced ethanol intake in P rats (Figure 2; Table 1). The HDACi tubstatin-A, with selectivity for HDAC6, did not alter ethanol intake in HAD1 or P rats (Figures 6, 7; Table 1). In the current study, all doses of entinostat reduced ethanol intake in HAD1 rats both acutely (2-h and 4-h post-injection) and chronically (24-h). In contrast, the highest dose of entinostat was the most effective in reducing 24-h ethanol intake in P rats. These findings suggest that entinostat has a more robust effect in reducing ethanol drinking by HAD1 rats than by P rats. One possible explanation for the differences is the different genetic backgrounds of the rats, although both rat lines were selectively bred using the same criteria (>5 g of ethanol/kg bodyweight/day; Bell et al., 2016; Bell et al., 2017; McBride et al., 2014). P rats were selected from a closed colony of Wistar rats at Walter Reed Army Hospital and transferred to the Indiana University School of Medicine in Indianapolis, Indiana, United States (cf., McBride and Li, 1998).
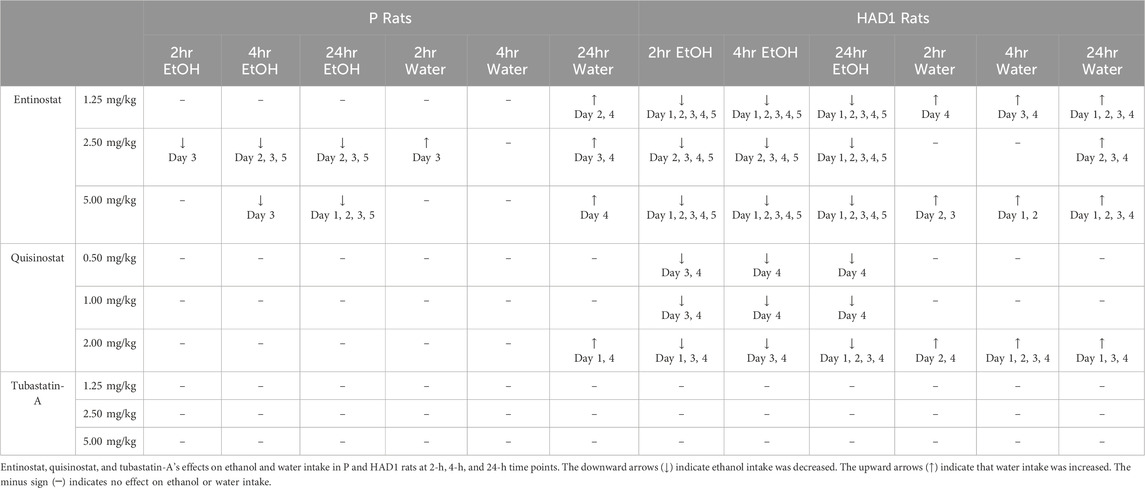
Table 1. The full results are summarized.
In contrast, HAD1 rats were derived from N/NIH heterogeneous stock rats (derived from eight inbred strains [ACI, BN, BUF, F344, M520, MR, WKY, and WN]) at Indiana University School of Medicine in Indianapolis, Indiana, United States (cf., Bell et al., 2012). Another possibility is entinostat’s higher binding specificity for HDAC1 (IC 50 values = 190 nM) and HDAC3 (IC 50 values = 420 nM), over other HDACs (Marks et al., 2011). This may have limited its effect on P rat drinking. It has been reported that P rats do not have innate differences in HDAC 1, 3, 4, 5, or six protein levels within the amygdala compared to their control non-alcohol preferring (NP) rats, but P rats have an innately higher level of HDAC2 compared to NP rats (Moonat et al., 2013). NP rats are the low alcohol-consuming counterpart from the bidirectional selection that yielded P rats (Bell et al., 2012; McBride and Li, 1998). Therefore, entinostat effects on P rats may be via inhibition of HDAC2 (binding specificity IC50 value = 1900 nM; Marks et al., 2011). No published work to date has examined HDAC levels in HAD1 rats, compared with their low alcohol consuming low-alcohol-drinking (LAD1) counterparts (c.f., Bell et al., 2012), or HDAC levels in other brain areas of P rats.
Our findings are in line with previous studies, which demonstrated that entinostat can reduce ethanol intake in rodents. For example, systemic administration of entinostat (also known as MS-275) can robustly reduce excessive ethanol intake in ethanol-dependent rats using an oral operant ethanol self-administration procedure while not having an effect in non-dependent rats (Simon-O'Brien et al., 2015). Jeanblanc et al. (2015) reported that intracerebroventricular administration of entinostat reduced operant ethanol self-administration, decreased motivation to consume ethanol, and blocked relapse. Even after it was discontinued, Entinostat effectively reduced reacquisition to ethanol self-administration in rats (Jeanblanc et al., 2015). This may be due to entinostat’s long half-life (i.e., 9.8 h in rats and >50 h in humans) (Yang et al., 2014; Kurmasheva et al., 2019).
Entinostat has also been shown to reduce binge-like ethanol drinking in mice without altering saccharin consumption at a dose as high as 20 mg/kg (Warnault et al., 2013). This indicates that entinostat can selectively decrease ethanol drinking without altering the intake of natural rewards. However, the current study demonstrated that the highest dose (5 mg/kg) reduced food intake in both HAD1 and P rats during the last 2 or 3 test days without altering body weight. Thus, repeated administration of entinostat may result in possible cumulative effects on food intake. In addition, there may be species-dependent effects that differ between mice and rats. Entinostat tended to increase water intake, which may be a compensatory effect on liquid intake.
Ethanol has a strong modulating effect on the neuroimmune system (Crews et al., 2015; Cui et al., 2014; Erickson et al., 2019). The overexpression of neuroinflammatory factors observed following excessive ethanol consumption has been postulated to be a critical biological link between excessive ethanol consumption and the development of AUD (Crews et al., 2015; Cui et al., 2014; Erickson et al., 2019). Moreover, previous work from our laboratories has demonstrated that treatments with anti-neuroinflammatory agents can attenuate ethanol intake in HAD1 and P rats (ibudilast: Bell et al., 2015; PDE4 modulators; Franklin et al., 2015). Inhibition of HDACs can also reduce neuroinflammatory responses (Kannan et al., 2013; Patnala et al., 2017; Suliman et al., 2012; Xia et al., 2017). HDAC1 and HDAC3, like other Class I HDACs, are involved in innate immunity and cytokine production (Daskalaki et al., 2018; Kouzarides, 2007; Shakespear et al., 2011). Durham et al. (2017) reported that treatment with entinostat or siRNA knockdown of HDAC1 can reduce cytokine expression [i.e., tumor necrosis factor-α (TNF)-α and interleukin 6 (IL-6)] in microglia activated with lipopolysaccharide (LPS). Inhibition of HDAC3 has also been reported to reduce LPS-stimulated toll-like receptors in microglia, attenuate TNF-α and IL-6 production, and partially inhibit signal transducer and activator of transcription 3 (STAT3) and STAT5 as well (Xia et al., 2017). The latter are activated by cytokines and growth factors (e.g., Xia et al., 2017). Taken together, this suggests that entinostat’s ability to reduce ethanol intake in HAD1 and P rats may partly be due to its ability to inhibit inflammatory responses.
Quisinostat is a second-generation Class I and Class II HDAC inhibitor (Gatla et al., 2019), a good brain penetrant (Lo Cascio et al., 2023) with a half-life of about an hour in mice (Lo Cascio et al., 2023), and 8.8-h half-life in humans (Venugopal et al., 2013). At subnanomolar concentrations, it is specific for HDAC1 (IC 50 values = 0.1 nM) and HDAC2 (IC 50 values = 0.3 nM) (Lo Cascio et al., 2023), with ≥14-fold selectivity against the other Class I HDACs (i.e., HDAC3 [IC 50 values = 4.8 nM] and HDAC 8 [IC 50 values = 4.26 nM] as well the Class II HDACs; Arts et al., 2009). Compared with entinostat, quisinostat was not as effective in reducing HAD1 rats’ ethanol intake at the lowest and middle doses. Only the highest dose of quisinostat effectively decreased HAD1 rats' 24-h ethanol intake on all test days, with the greatest decrease on the third and fourth days. For the 2-h and 4-h drinking time points, quisinostat only effectively reduced ethanol intake on the third and fourth test days.
Interestingly, quisinostat did not significantly alter the P rats’ ethanol intake at any time point. Like entinostat, the highest dose of quisinostat tended to increase water intake suggesting a possible compensatory effect on liquid intake. However, HAD1 and P rats’ food intake was significantly reduced during the last 2 to 3 test days. To our knowledge, this is the first study to examine quisinostat’s effects on ethanol intake.
As previously mentioned, chronic ethanol exposure is associated with an overexpression of class I HDACs, particularly HDAC2, in limbic brain regions (i.e., hippocampus and amygdala). Therefore, it is possible that quisinostat’s attenuating effects on ethanol intake may, in part, be via inhibition of HDAC2 activity. However, Quisinostat was not effective in reducing P rats' ethanol drinking even though it has been reported that P rats have innately higher nuclear HDAC2 activity in the central and medial amygdala compared with their NP counterparts (Moonat et al., 2013). In addition, these authors reported that small interfering RNA (siRNA) knock-down of HDAC2 expression in the central nucleus of the amygdala (CeA) of P rats corrected ethanol-induced deficits by attenuating anxiety-like behaviors and inhibited ethanol-drinking behaviors in P rats (Moonat et al., 2013). A subsequent study found that trichostatin-A (TSA) can decrease HDAC2 levels as well as correct deficits in brain-derived neurotrophic factor, activity-regulated cytoskeleton-associated protein, and neuropeptide Y expression levels within the CeA of P rats (Sakharkar et al., 2014). It is noteworthy that this same trio of genes/proteins has been implicated in the development of AUD (Pandey et al., 2017).
Similar to pre-clinical research, HDAC2 expression in the amygdala was reported to be higher in the post-mortem brains of AUD subjects compared with control subjects (De Carvalho et al., 2021). An in vitro study revealed that ethanol exposure of a human neuronal cell line (SK-N-MC) upregulates gene and protein expression levels of HDAC2 through mechanisms involving oxidative stress, which often leads to inflammation (Agudelo et al., 2011). Moreover, TSA inhibition of HDAC2 gene and protein expression decreased reactive oxygen species production (Agudelo et al., 2011). Furthermore, TSA inhibited the effects following ethanol exposure of all class I HDACs (Agudelo et al., 2016). Collectively, these findings indicate that ethanol modulates class I HDAC activity and inhibition of class I HDACs may be useful for the treatment of AUD.
Quisinostat’s ineffectiveness in reducing P rat’s ethanol intake may be due to the sample size of five. However, the significant findings for water and food intake in P rats suggest against this conjecture. Another possibility is that a higher dose of quisinostat may be needed to reduce ethanol intake in P rats.
Tubastatin-A is highly specific for HDAC6 as a Class IIb HDAC with an IC50 of 15 nM for HDAC 6 (Butler et al., 2010). This was the only epigenetic compound tested in the current study that did not alter ethanol intake in HAD1 or P rats. This suggests HDAC6 may not regulate ethanol intake, at least in HAD1 and P rats. HDAC6 substrates, such as tubulin, heat shock proteins, and cortactin (Shen et al., 2020), are known to be affected by alcohol consumption (Azizov et al., 2023; Labisso et al., 2018; Mandrekar et al., 2008). The potential ineffectiveness of tubastatin-A could be due to alcohol altering different classes of the HDAC6 substrates than those targeted by tubastatin-A. Despite its low brain penetrance (Kozikowski et al., 2019) and a plasma half-life between 1 and 2 h in mice (Jochems et al., 2014; Shen et al., 2020), higher doses of tubastatin-A have shown promise in other animal disease models (e.g., Alzheimer’s disease, Parkinson’s disease, cardiac and pulmonary diseases; Shen et al., 2020). Therefore, another possible explanation is that a higher dose of tubastatin-A may be needed to reduce ethanol intake in rats.
Interestingly, López-Moreno et al. (2015) using RT qPCR reported that ethanol operant self-administration did not alter HDAC6 gene expression in rats, but acute ethanol intoxication in humans increased HDAC6 gene expression in peripheral blood samples. However, Hdac6 mRNA levels were found to be increased in the central and basolateral amygdala in ethanol-dependent male rats compared to non-dependent male rats (De Carvalho et al., 2021; Repunte-Canonigo et al., 2015). Moreover, a recent clinical study reported an increase in HDAC6 levels in the amygdala of AUD individual’s post-mortem brain tissue (De Carvalho et al., 2021). Inhibition of HADC6 has also been shown to attenuate LPS-induced inflammation markers in macrophages such as TNF-α, IL-1β, and IL-6 (Zhang et al., 2019). Therefore, further research is warranted to examine HDAC6 involvement in AUD as well as examine the effects of other HDAC6 inhibitors.
The current study does have some limitations. One limitation is that we did not examine female P and HAD1 rats. It is possible that female rats may respond differently to the HDAC inhibitors compared to male rats. The current study also did not examine whether the attenuating effects of the HDAC inhibitors were specific to ethanol drinking or whether they would reduce other reward drinking solutions, such as sucrose. Another limitation is that we did not investigate the effects of alcohol on HDAC genes and proteins across the different alcohol models, nor did we explore how the various HDAC inhibitor treatments might modify the effects of alcohol on HDAC gene and protein levels. Therefore, future studies should focus on assessing potential sex differences with different HDAC inhibitors and other rewards, as well as measuring gene and protein levels before and after HDAC inhibitor administration.
Conclusion
In conclusion, the current study indicated that entinostat effectively reduced ethanol intake in two genetic rat models selected for high ethanol consumption, while quisinostat had a robust effect, it was effective in only one of these genetic rat models. Thus, genetic background may influence the effectiveness of certain HDAC inhibitors in reducing ethanol consumption. Finally, this study provides further evidence that targeting Class I HDACs may be an effective treatment for AUD.
Data availability statement
The raw data supporting the conclusions of this article will be made available by the authors, without undue reservation.
Ethics statement
The animal study was approved by Indiana University School of Medicine-Indianapolis Institutional Animal Care and Use Committee. The study was conducted in accordance with the local legislation and institutional requirements.
Author contributions
SH: Data curation, Formal Analysis, Investigation, Supervision, Writing–original draft, Writing–review and editing. LF: Data curation, Investigation, Writing–review and editing. TL: Investigation, Writing–review and editing. EJ: Data curation, Supervision, Writing–review and editing. RM: Conceptualization, Data curation, Investigation, Writing–review and editing. RB: Conceptualization, Formal Analysis, Funding acquisition, Investigation, Methodology, Supervision, Writing–review and editing.
Funding
The author(s) declare that financial support was received for the research, authorship, and/or publication of this article. This study was supported by the National Institute of Alcohol Abuse and Alcoholism (NIAAA) grant AA013522 (INIA), K99AA030821 (LF), medication contract grant HHSN75N94019C00009, AA029788, and National Institutes of Health (NIH) Shared Instrument grant 1S10OD021805-01 (S10 grant). The content of the manuscript is solely the responsibility of the authors and does not necessarily represent the official views of the NIAAA or the NIH. None of the authors have a conflict of interest associated with this research.
Conflict of interest
The authors declare that the research was conducted in the absence of any commercial or financial relationships that could be construed as a potential conflict of interest.
The author(s) declared that they were an editorial board member of Frontiers, at the time of submission. This had no impact on the peer review process and the final decision.
Generative AI statement
The author(s) declare that no Generative AI was used in the creation of this manuscript.
Publisher’s note
All claims expressed in this article are solely those of the authors and do not necessarily represent those of their affiliated organizations, or those of the publisher, the editors and the reviewers. Any product that may be evaluated in this article, or claim that may be made by its manufacturer, is not guaranteed or endorsed by the publisher.
Supplementary material
The Supplementary Material for this article can be found online at: https://www.frontiersin.org/articles/10.3389/freae.2024.1503093/full#supplementary-material
References
Agudelo, M., Figueroa, G., Parira, T., Yndart, A., Muñoz, K., Atluri, V., et al. (2016). Profile of class I histone deacetylases (HDAC) by human dendritic cells after alcohol consumption and in vitro alcohol treatment and their implication in oxidative stress: role of HDAC inhibitors trichostatin A and mocetinostat. PLoS One 11, e0156421. doi:10.1371/journal.pone.0156421
Agudelo, M., Gandhi, N., Saiyed, Z., Pichili, V., Thangavel, S., Khatavkar, P., et al. (2011). Effects of alcohol on histone deacetylase 2 (HDAC2) and the neuroprotective role of trichostatin A (TSA). Alcohol Clin. Exp. Res. 35, 1550–1556. doi:10.1111/j.1530-0277.2011.01492.x
Arora, D. S., Nimitvilai, S., Teppen, T. L., McElvain, M. A., Sakharkar, A. J., You, C., et al. (2013). Hyposensitivity to gamma-aminobutyric acid in the ventral tegmental area during alcohol withdrawal: reversal by histone deacetylase inhibitors. Neuropsychopharmacology 38, 1674–1684. doi:10.1038/npp.2013.65
Arts, J., King, P., Mariën, A., Floren, W., Beliën, A., Janssen, L., et al. (2009). JNJ-26481585, a novel “second-generation” oral histone deacetylase inhibitor, shows broad-spectrum preclinical antitumoral activity. Clin. Cancer Res. 15 (22), 6841–6851. doi:10.1158/1078-0432.CCR-09-0547
Azizov, V., Hübner, M., Frech, M., Hofmann, J., Kubankova, M., Lapuente, D., et al. (2023). Alcohol-sourced acetate impairs T cell function by promoting cortactin acetylation. iScience 26, 107230. doi:10.1016/j.isci.2023.107230
Bell, R. L., Hauser, S., Rodd, Z. A., Liang, T., Sari, Y., McClintick, J., et al. (2016). A genetic animal model of alcoholism for screening medications to treat addiction. Int. Rev. Neurobiol. 126, 179–261. doi:10.1016/bs.irn.2016.02.017
Bell, R. L., Hauser, S. R., Liang, T., Sari, Y., Maldonado-Devincci, A., and Rodd, Z. A. (2017). Rat animal models for screening medications to treat alcohol use disorders. Neuropharmacology 122, 201–243. doi:10.1016/j.neuropharm.2017.02.004
Bell, R. L., Lopez, M. F., Cui, C., Egli, M., Johnson, K. W., Franklin, K. M., et al. (2015). Ibudilast reduces alcohol drinking in multiple animal models of alcohol dependence. Addict. Biol. 20, 38–42. doi:10.1111/adb.12106
Bell, R. L., Rodd, Z. A., Engleman, E. A., Toalston, J. E., and McBride, W. J. (2014). Scheduled access alcohol drinking by alcohol-preferring (P) and high-alcohol-drinking (HAD) rats: modeling adolescent and adult binge-like drinking. Alcohol 48, 225–234. doi:10.1016/j.alcohol.2013.10.004
Bell, R. L., Rodd, Z. A., Lumeng, L., Murphy, J. M., and McBride, W. J. (2006). REVIEW: the alcohol-preferring P rat and animal models of excessive alcohol drinking. Addict. Biol. 11 (3-4), 270–288. doi:10.1111/j.1369-1600.2005.00029.x
Bell, R. L., Rodd, Z. A., Smith, R. J., Toalston, J. E., Franklin, K. M., and McBride, W. J. (2011). Modeling binge-like ethanol drinking by peri-adolescent and adult P rats. Pharmacol. Biochem. Behav. 100, 90–97. doi:10.1016/j.pbb.2011.07.017
Bell, R. L., Sable, H. J., Colombo, G., Hyytia, P., Rodd, Z. A., and Lumeng, L. (2012). Animal models for medications development targeting alcohol abuse using selectively bred rat lines: neurobiological and pharmacological validity. Pharmacol. Biochem. Behav. 103, 119–155. doi:10.1016/j.pbb.2012.07.007
Bohnsack, J. P., Hughes, B. A., O'Buckley, T. K., Edokpolor, K., Besheer, J., and Morrow, A. L. (2018). Histone deacetylases mediate GABA(A) receptor expression, physiology, and behavioral maladaptations in rat models of alcohol dependence. Neuropsychopharmacology 43, 1518–1529. doi:10.1038/s41386-018-0034-8
Broide, R. S., Redwine, J. M., Aftahi, N., Young, W., Bloom, F. E., and Winrow, C. J. (2007). Distribution of histone deacetylases 1-11 in the rat brain. J. Mol. Neurosci. 31, 47–58. doi:10.1007/bf02686117
Butler, K. V., Kalin, J., Brochier, C., Vistoli, G., Langley, B., and Kozikowski, A. P. (2010). Rational design and simple chemistry yield a superior, neuroprotective HDAC6 inhibitor, tubastatin A. J. Am. Chem. Soc. 132, 10842–10846. doi:10.1021/ja102758v
Center for Disease Control (2025). Facts About U.S. Deaths from Excessive Alcohol Use. Available at: https://www.cdc.gov/alcohol/facts-stats/index.html (Accessed January 21, 2025).
Chen, W. Y., Zhang, H., Gatta, E., Glover, E. J., Pandey, S. C., and Lasek, A. W. (2019). The histone deacetylase inhibitor suberoylanilide hydroxamic acid (SAHA) alleviates depression-like behavior and normalizes epigenetic changes in the hippocampus during ethanol withdrawal. Alcohol 78, 79–87. doi:10.1016/j.alcohol.2019.02.005
Crews, F. T., Sarkar, D. K., Qin, L., Zou, J., Boyadjieva, N., and Vetreno, R. P. (2015). Neuroimmune function and the consequences of alcohol exposure. Alcohol Res. 37 (331-41), 344–351.
Cui, C., Shurtleff, D., and Harris, R. A. (2014). Neuroimmune mechanisms of alcohol and drug addiction. Int. Rev. Neurobiol. 118, 1–12. doi:10.1016/b978-0-12-801284-0.00001-4
Daskalaki, M. G., Tsatsanis, C., and Kampranis, S. C. (2018). Histone methylation and acetylation in macrophages as a mechanism for regulation of inflammatory responses. J. Cell. Physiology 233, 6495–6507. doi:10.1002/jcp.26497
De Carvalho, L. M., Wiers, C. E., Sun, H., Wang, G. J., and Volkow, N. D. (2021). Increased transcription of TSPO, HDAC2, and HDAC6 in the amygdala of males with alcohol use disorder. Brain Behav. 11 (2), e01961. doi:10.1002/brb3.1961
Deeken, F., Banaschewski, T., Kluge, U., and Rapp, M. A. (2020). Risk and protective factors for alcohol use disorders across the lifespan. Curr. Addict. Rep. 7, 245–251. doi:10.1007/s40429-020-00313-z
Dhaher, R., Toalston, J. E., Hauser, S. R., Bell, R. L., McKinzie, D. L., McBride, W. J., et al. (2012). Effects of naltrexone and LY255582 on ethanol maintenance, seeking, and relapse responding by alcohol preferring (P) rats. Alcohol 46, 17–27. doi:10.1016/j.alcohol.2011.08.011
Durham, B. S., Grigg, R., and Wood, I. C. (2017). Inhibition of histone deacetylase 1 or 2 reduces induced cytokine expression in microglia through a protein synthesis independent mechanism. J. Neurochem. 143, 214–224. doi:10.1111/jnc.14144
Erickson, E. K., Grantham, E. K., Warden, A. S., and Harris, R. A. (2019). Neuroimmune signaling in alcohol use disorder. Pharmacol. Biochem. Behav. 177, 34–60. doi:10.1016/j.pbb.2018.12.007
Franklin, K. M., Hauser, S. R., Lasek, A. W., McClintick, J., Ding, Z. M., McBride, W. J., et al. (2015). Reduction of alcohol drinking of alcohol-preferring (P) and high-alcohol drinking (HAD1) rats by targeting phosphodiesterase-4 (PDE4). Psychopharmacol. Berl. 232, 2251–2262. doi:10.1007/s00213-014-3852-3
Gatla, H. R., Muniraj, N., Thevkar, P., Yavvari, S., Sukhavasi, S., and Makena, M. R. (2019). Regulation of chemokines and cytokines by histone deacetylases and an update on histone decetylase inhibitors in human diseases. Int. J. Mol. Sci. 20, 1110. doi:10.3390/ijms20051110
Gibson, C. L., and Murphy, S. P. (2010). Benefits of histone deacetylase inhibitors for acute brain injury: a systematic review of animal studies. J. Neurochem. 115, 806–813. doi:10.1111/j.1471-4159.2010.06993.x
Graff, J., and Tsai, L. H. (2013). Histone acetylation: molecular mnemonics on the chromatin. Nat. Rev. Neurosci. 14, 97–111. doi:10.1038/nrn3427
Hontecillas-Prieto, L., Flores-Campos, R., Silver, A., de Álava, E., Hajji, N., and García-Domínguez, D. J. (2020). Synergistic enhancement of cancer therapy using HDAC inhibitors: opportunity for clinical trials. Front. Genet. 11, 578011. doi:10.3389/fgene.2020.578011
Hull, E. E., Montgomery, M. R., and Leyva, K. J. (2016). HDAC inhibitors as epigenetic regulators of the immune system: impacts on cancer therapy and inflammatory diseases. BioMed Res. Int. 2016, 1–15. doi:10.1155/2016/8797206
Jeanblanc, J., Lemoine, S., Jeanblanc, V., Alaux-Cantin, S., and Naassila, M. (2015). The class I-specific HDAC inhibitor MS-275 decreases motivation to consume alcohol and relapse in heavy drinking rats. Int. J. Neuropsychopharmacol. 18, pyv029. doi:10.1093/ijnp/pyv029
Jochems, J., Boulden, J., Lee, B. G., Blendy, J. A., Jarpe, M., Mazitschek, R., et al. (2014). Antidepressant-like properties of novel HDAC6-selective inhibitors with improved brain bioavailability. Neuropsychopharmacology 39, 389–400. doi:10.1038/npp.2013.207
Kamat, P. K., Mallonee, C. J., George, A. K., Tyagi, S. C., and Tyagi, N. (2016). Homocysteine, alcoholism, and its potential epigenetic mechanism. Alcohol. Clin. Exp. Res. 40, 2474–2481. doi:10.1111/acer.13234
Kannan, V., Brouwer, N., Hanisch, U. K., Regen, T., Eggen, B. J., and Boddeke, H. W. (2013). Histone deacetylase inhibitors suppress immune activation in primary mouse microglia. J. Neurosci. Res. 91, 1133–1142. doi:10.1002/jnr.23221
Koob, G. F., and Mason, B. J. (2016). Existing and future drugs for the treatment of the dark side of addiction. Annu. Rev. Pharmacol. Toxicol. 56, 299–322. doi:10.1146/annurev-pharmtox-010715-103143
Kouzarides, T. (2007). Chromatin modifications and their function. Cell 128, 693–705. doi:10.1016/j.cell.2007.02.005
Kozikowski, A. P., Shen, S., Pardo, M., Tavares, M. T., Szarics, D., Benoy, V., et al. (2019). Brain penetrable histone deacetylase 6 inhibitor SW-100 ameliorates memory and learning impairments in a mouse model of fragile X syndrome. ACS Chem. Neurosci. 10, 1679–1695. doi:10.1021/acschemneuro.8b00600
Kurmasheva, R. T., Bandyopadhyay, A., Favours, E., Del Pozo, V., Ghilu, S., Phelps, D. A., et al. (2019). Evaluation of entinostat alone and in combination with standard-of-care cytotoxic agents against rhabdomyosarcoma xenograft models. Pediatr. Blood and Cancer 66, e27820. doi:10.1002/pbc.27820
Labisso, W. L., Raulin, A. C., Nwidu, L. L., Kocon, A., Wayne, D., Erdozain, A. M., et al. (2018). The loss of α- and β-tubulin proteins are a pathological hallmark of chronic alcohol consumption and natural brain ageing. Brain Sci. 8, 175. doi:10.3390/brainsci8090175
Lai, D., Johnson, E. C., Colbert, S., Pandey, G., Chan, G., Bauer, L., et al. (2022). Evaluating risk for alcohol use disorder: polygenic risk scores and family history. Alcohol. Clin. Exp. Res. 46, 374–383. doi:10.1111/acer.14772
Li, T. K., Lumeng, L., McBride, W. J., and Murphy, J. M. (1993). An experimental approach to understanding the genetic and neurobiological basis of alcoholism. Trans. Am. Clin. Climatol. Assoc. 104, 61–73.
Liang, T., Spence, J., Liu, L., Strother, W. N., Chang, H. W., Ellison, J. A., et al. (2003). α-Synuclein maps to a quantitative trait locus for alcohol preference and is differentially expressed in alcohol-preferring and -nonpreferring rats. Proc. Natl. Acad. Sci. U. S. A. 100, 4690–4695. doi:10.1073/pnas.0737182100
Lo Cascio, C., Margaryan, T., Luna-Melendez, E., McNamara, J. B., White, C. I., Knight, W., et al. (2023). Quisinostat is a brain-penetrant radiosensitizer in glioblastoma. JCI Insight 8, e167081. doi:10.1172/jci.insight.167081
López-Moreno, J. A., Marcos, M., Calleja-Conde, J., Echeverry-Alzate, V., Bühler, K. M., Costa-Alba, P., et al. (2015). Histone deacetylase gene expression following binge alcohol consumption in rats and humans. Alcohol Clin. Exp. Res. 39, 1939–1950. doi:10.1111/acer.12850
Mandrekar, P., Catalano, D., Jeliazkova, V., and Kodys, K. (2008). Alcohol exposure regulates heat shock transcription factor binding and heat shock proteins 70 and 90 in monocytes and macrophages: implication for TNF-α regulation. J. Leukoc. Biol. 84, 1335–1345. doi:10.1189/jlb.0407256
Marks, B. D., Fakhoury, S. A., Frazee, W. J., Eliason, H. C., and Riddle, S. M. (2011). A substrate-independent TR-FRET histone deacetylase inhibitor assay. SLAS Discov. 16, 1247–1253. doi:10.1177/1087057111422102
McBride, W. J., and Li, T. K. (1998). Animal models of alcoholism: neurobiology of high alcohol-drinking behavior in rodents. Crit. Rev. Neurobiol. 12, 339–369. doi:10.1615/critrevneurobiol.v12.i4.40
McBride, W. J., Rodd, Z. A., Bell, R. L., Lumeng, L., and Li, T. K. (2014). The alcohol-preferring (P) and high-alcohol-drinking (HAD) rats--animal models of alcoholism. Alcohol 48, 209–215. doi:10.1016/j.alcohol.2013.09.044
Moonat, S., Sakharkar, A. J., Zhang, H., Tang, L., and Pandey, S. C. (2013). Aberrant histone deacetylase2-mediated histone modifications and synaptic plasticity in the amygdala predisposes to anxiety and alcoholism. Biol. Psychiatry 73, 763–773. doi:10.1016/j.biopsych.2013.01.012
Moore, D. S. (2017). Behavioral epigenetics. Wiley Interdiscip. Rev. Syst. Biol. Med. 9 (1). doi:10.1002/wsbm.1333
Murphy, J. M., Gatto, G. J., Waller, M. B., McBride, W. J., Lumeng, L., and Li, T. K. (1986). Effects of scheduled access on ethanol intake by the alcohol-preferring (P) line of rats. Alcohol 3, 331–336. doi:10.1016/0741-8329(86)90010-8
Murphy, J. M., Stewart, R. B., Bell, R. L., Badia-Elder, N. E., Carr, L. G., McBride, W. J., et al. (2002). Phenotypic and genotypic characterization of the Indiana University rat lines selectively bred for high and low alcohol preference. Behav. Genet. 32, 363–388. doi:10.1023/a:1020266306135
Nieratschker, V., Batra, A., and Fallgatter, A. J. (2013). Genetics and epigenetics of alcohol dependence. J. Mol. Psychiatry 1, 11. doi:10.1186/2049-9256-1-11
Palmisano, M., and Pandey, S. C. (2017). Epigenetic mechanisms of alcoholism and stress-related disorders. Alcohol 60, 7–18. doi:10.1016/j.alcohol.2017.01.001
Pandey, S. C., and Bohnsack, J. P. (2020). Alcohol makes its epigenetic Marks. Cell Metab. 31, 213–214. doi:10.1016/j.cmet.2020.01.008
Pandey, S. C., Kyzar, E. J., and Zhang, H. (2017). Epigenetic basis of the dark side of alcohol addiction. Neuropharmacology 122, 74–84. doi:10.1016/j.neuropharm.2017.02.002
Pandey, S. C., Sakharkar, A. J., Tang, L., and Zhang, H. (2015). Potential role of adolescent alcohol exposure-induced amygdaloid histone modifications in anxiety and alcohol intake during adulthood. Neurobiol. Dis. 82, 607–619. doi:10.1016/j.nbd.2015.03.019
Patnala, R., Arumugam, T. V., Gupta, N., and Dheen, S. T. (2017). HDAC inhibitor sodium butyrate- mediated epigenetic regulation enhances neuroprotective function of microglia during ischemic stroke. Mol. Neurobiol. 54, 6391–6411. doi:10.1007/s12035-016-0149-z
Peedicayil, J. (2023). Genome-environment interactions and psychiatric disorders. Biomedicines 11, 1209. doi:10.3390/biomedicines11041209
Rehm, J., and Imtiaz, S. (2016). A narrative review of alcohol consumption as a risk factor for global burden of disease. Subst. Abuse Treat. Prev. Policy 11, 37. doi:10.1186/s13011-016-0081-2
Repunte-Canonigo, V., Shin, W., Vendruscolo, L. F., Lefebvre, C., van der Stap, L., Kawamura, T., et al. (2015). Identifying candidate drivers of alcohol dependence-induced excessive drinking by assembly and interrogation of brain-specific regulatory networks. Genome Biol. 16, 68. doi:10.1186/s13059-015-0593-5
Research-based information on drinking and its impact (2024). Alcohol Facts Statistics. Available at: https://www.niaaa.nih.gov/alcohols-effects-health/alcohol-topics/alcohol-facts-and-statisticsDownloadedJune4.
Research Institute for Laboratory Animal Research (2011). Guide for the Care and use of laboratory animals. 8th ed. Washington, D.C: The National Academies Press.
Sakharkar, A. J., Zhang, H., Tang, L., Baxstrom, K., Shi, G., Moonat, S., et al. (2014). Effects of histone deacetylase inhibitors on amygdaloid histone acetylation and neuropeptide Y expression: a role in anxiety-like and alcohol-drinking behaviours. Int. J. Neuropsychopharmacol. 17, 1207–1220. doi:10.1017/s1461145714000054
Shakespear, M. R., Halili, M. A., Irvine, K. M., Fairlie, D. P., and Sweet, M. J. (2011). Histone deacetylases as regulators of inflammation and immunity. Trends Immunol. 32, 335–343. doi:10.1016/j.it.2011.04.001
Shen, S., Svoboda, M., Zhang, G., Cavasin, M. A., Motlova, L., McKinsey, T. A., et al. (2020). Structural and in vivo characterization of tubastatin A, a widely used histone deacetylase 6 inhibitor. ACS Med. Chem. Lett. 11, 706–712. doi:10.1021/acsmedchemlett.9b00560
Simon-O'Brien, E., Alaux-Cantin, S., Warnault, V., Buttolo, R., Naassila, M., and Vilpoux, C. (2015). The histone deacetylase inhibitor sodium butyrate decreases excessive ethanol intake in dependent animals. Addict. Biol. 20, 676–689. doi:10.1111/adb.12161
Suliman, B. A., Xu, D., and Williams, B. R. (2012). HDACi: molecular mechanisms and therapeutic implications in the innate immune system. Immunol. Cell Biol. 90, 23–32. doi:10.1038/icb.2011.92
Venugopal, B., Baird, R., Kristeleit, R. S., Plummer, R., Cowan, R., Stewart, A., et al. (2013). A phase I study of quisinostat (JNJ-26481585), an oral hydroxamate histone deacetylase inhibitor with evidence of target modulation and antitumor activity, in patients with advanced solid tumors. Clin. Cancer Res. 19, 4262–4272. doi:10.1158/1078-0432.ccr-13-0312
Warnault, V., Darcq, E., Levine, A., Barak, S., and Ron, D. (2013). Chromatin remodeling--a novel strategy to control excessive alcohol drinking. Transl. Psychiatry 3, e231. doi:10.1038/tp.2013.4
Werner, C. T., Altshuler, R. D., Shaham, Y., and Li, X. (2021). Epigenetic mechanisms in drug relapse. Biol. Psychiatry 89, 331–338. doi:10.1016/j.biopsych.2020.08.005
Xia, M., Zhao, Q., Zhang, H., Chen, Y., Yuan, Z., Xu, Y., et al. (2017). Proteomic analysis of HDAC3 selective inhibitor in the regulation of inflammatory response of primary microglia. Neural Plast. 2017, 1–13. doi:10.1155/2017/6237351
Yang, X., Zhang, Q., Chen, M., and Hu, L. (2014). Pharmacokinetic interaction of entinostat and lapatinib following single and co-oral administration in rats. Xenobiotica 44, 1009–1013. doi:10.3109/00498254.2014.919431
Zhang, W. B., Yang, F., Wang, Y., Jiao, F. Z., Zhang, H. Y., Wang, L. W., et al. (2019). Inhibition of HDAC6 attenuates LPS-induced inflammation in macrophages by regulating oxidative stress and suppressing the TLR4-MAPK/NF-κB pathways. Biomed. and Pharmacother. 117, 109166. doi:10.1016/j.biopha.2019.109166
Keywords: alcohol, alcohol-preferring P rats, high alcohol drinking line-1 HAD-1 rats, entinostat, quisinostat, tubastatin-A, epigenetics, HDAC inhibitors
Citation: Hauser SR, Ferguson LB, Liang T, Jarvis EE, Mayfield RD and Bell RL (2025) Effects of entinostat, quisinostat, and tubastatin-A on alcohol consumption in male high ethanol consuming rats. Front. Epigenet. Epigenom. 2:1503093. doi: 10.3389/freae.2024.1503093
Received: 28 September 2024; Accepted: 19 December 2024;
Published: 03 February 2025.
Edited by:
Ian Maze, Icahn School of Medicine at Mount Sinai, United StatesReviewed by:
Amy Lasek, Virginia Commonwealth University, United StatesHina Sultana, University of North Carolina System, United States
Copyright © 2025 Hauser, Ferguson, Liang, Jarvis, Mayfield and Bell. This is an open-access article distributed under the terms of the Creative Commons Attribution License (CC BY). The use, distribution or reproduction in other forums is permitted, provided the original author(s) and the copyright owner(s) are credited and that the original publication in this journal is cited, in accordance with accepted academic practice. No use, distribution or reproduction is permitted which does not comply with these terms.
*Correspondence: Sheketha R. Hauser, c2hoYXVzZXJAaXUuZWR1