 Yue Yao
 Chi Zhang
 Geping Luo
 Tao Lin
- 1College of Life Sciences, Shihezi University, Shihezi, China
- 2Shandong Provincial Key Laboratory of Water and Soil Conservation and Environmental Protection, College of Resources and Environment, Linyi University, Linyi, China
- 3Xinjiang Institute of Ecology and Geography, Chinese Academy of Sciences, Urumqi, China
- 4Urban Environmental Research Institute, Chinese Academy of Sciences, Xiamen, China
Water resources are the lifelines of the agricultural development in Xinjiang. Currently, the problem of water shortage for agriculture in this region is becoming increasingly severe. Against this backdrop, predicting the changing trends of water supply and agricultural water use in Xinjiang and analyzing the supply and use relationship between them are of great practical significance for ensuring the sustainable development of regional agriculture. Firstly, we conducted an in-depth analysis of the water supply and agricultural water use patterns in Xinjiang over the past two decades. Secondly, we evaluated and compared several mainstream water resource prediction models, ultimately developing a novel GM(1,1)-NN essemble model. Validation results demonstrated that this model exhibits superior accuracy in forecasting water supply and agricultural water use compared to other existing models. Finally, we utilized the newly developed GM(1,1)-NN essemble model to predict short-term water supply and agricultural water use trends in Xinjiang. Based on these findings, we proposed recommendations for water resource conservation from both technological and regional planting perspectives. The key results are as follows: (1) There are significant regional disparities in water resources in Xinjiang, primarily attributed to uneven precipitation distribution and imbalanced economic development. (2) The GM(1,1)-NN essemble model demonstrates high short-term predictive accuracy for both water supply and agricultural water use in Xinjiang. (3) According to our GM(1,1)-NN essemble model’s projections, both water supply and agricultural water use in Xinjiang are expected to exhibit a downward trend in the coming years. The reduction in agricultural water use will help allocate more water resources to non-agricultural sectors. (4) Despite these improvements, the contradiction between water shortage and the high proportion of agricultural water use (approaching to 88%) remains unresolved. Therefore, it is recommended to reduce agricultural water use through the widespread adoption of water-saving facilities and the optimization of crop planting structures across different regions.
1 Introduction
Xinjiang, located in arid and semi-arid regions, serves as China’s largest grain production and sales equilibrium area and a premier high-quality cotton production base (Zhang et al., 2021). Water resources are critical to the development of agriculture in Xinjiang, and the imbalance between water supply and demand has persisted for a long period and is intensifying. As economic growth drove population expansion and accelerated urbanization (Dai et al., 2024a; Jin et al., 2024), this supply-demand imbalance has exacerbated the shortage of agricultural water use. This shortage not only compromises the stability of water use for production, daily life, and ecological purposes, but also posed significant challenges to agricultural development. Therefore, it is imperative to forecast future changes in local water supply and demand.
To address the critical challenges of water resource conflicts in Xinjiang, scholars have concentrated their research efforts on three pivotal dimensions: conducting comprehensive analyses of water scarcity patterns and allocation dynamics in major river basins (Yao et al., 2022), systematically investigating climate change impacts on regional water availability (Shen et al., 2020), and meticulously evaluating the regulatory mechanisms of virtual water flows in maintaining hydrological equilibrium (Tang and Liu, 2023). Some scholars have developed integrated modeling frameworks to project water supply-demand dynamics in Xinjiang under evolving climatic conditions. From the perspective of ecosystem services, Li et al. utilized an integrated valuation and trade-off assessment model to simulate both the production potential and utilization efficiency of water resources in Xinjiang. This approach has expanded the dimensions of water resource evaluation research (Li et al., 2022). Shao et al. utilized a system dynamics model to assess and found that under the scenario of coordinated economic and resource development in Xinjiang (Shao et al., 2020), the model indicates that such planning is conducive to mitigating the water supply-demand imbalance. Yang et al. also developed an economic decision support system for the sustainable management of water resources in arid regions, leveraging this model (Yang et al., 2024). Scholars such as Duan assessed the balance between water supply and demand in Xinjiang using multi-source remote sensing data (Duan et al., 2024). They emphasized that future water resource allocation strategies should prioritize regions with degraded ecological health. Therefore, by leveraging widely recognized and currently applied models in water resources and related fields, conducting predictive analysis on water supply and demand in Xinjiang can not only capitalize on their scientific framework and robust computational capabilities to provide insights into the dynamic trends of water resource supply and demand, but also holds significant practical implications for formulating effective water resource management strategies in the region.
The current mainstream prediction models encompass grey models (Ding, 2021), neural network models (Yang et al., 2023), time series models (González et al., 2024), the Holt-Winters exponential smoothing method (Hayana and Ali, 2022), and their hybrid models (Jin, 2022). These predictive models have not only demonstrated excellent performance in fields such as agriculture, industry, and medicine but have also been extensively applied in water resource management in arid and semi-arid regions. Their applications span multiple critical areas, including water quality assessment (Sang et al., 2024), hydrological monitoring and early warning systems (Zhang, 2021; Zhan et al., 2023), agricultural irrigation management (Brenner et al., 2021), urban water demand forecasting (Iwakin and Moazeni, 2024), and agricultural water footprint evaluation (Du et al., 2014). Xu et al. achieved notably high accuracy in predicting agricultural water consumption using the grey model (Xu et al., 2021). Wu et al. further employed this model to investigate the grey correlation between water resources and the economic system, offering well-founded recommendations for enhancing the interrelationship between these two systems (Wu et al., 2021). Wael et al. significantly reduced the computational time required for water level trend analysis in arid desert oasis regions by employing an improved grey model, achieving a computational efficiency of up to 99.8% (Wael and Kunio, 2014). Wang et al. leveraged this model to evaluate the water resource carrying capacity under semi-arid climate conditions (Wang et al., 2023). Furthermore, several scholars have integrated multiple approaches, including the grey model and linear methods, to forecast China’s future water resources. Their findings indicate that the grey model exhibits superior predictive performance, with predicted values closely aligning with the adjusted water use targets (Bian, 2021). These studies collectively underscore the scientific validity and rationality of the grey prediction model. Additionally, numerous scholars have utilized neural network models to conduct predictive analyses on irrigation water scheduling in arid regions (Zhe et al., 2021), adaptation to climate change (Huo et al., 2012), and crop evapotranspiration estimation (Mohamed et al., 2023), achieving notably accurate results. Regita et al. applied exponential smoothing and neural networks to predict the impact of precipitation on water supply management, finding that the hybrid model combining both methods achieves higher prediction accuracy (Regita et al., 2023). Extensive research has demonstrated that utilizing models to forecast changes and trends in water supply and demand is essential for enhancing the efficiency of water resource management and optimizing water resource allocation. However, each model has its specific application context and distinct advantages and limitations, and no single model can be universally applicable across all research scenarios.
Despite extensive research on the water supply and demand situation in Xinjiang, most studies have primarily focused on ecological systems (Zhen et al., 2024; Fan et al., 2024) and economic decision-making (Shi et al., 2024; Mo et al., 2022) with the objective of enhancing the utilization and allocation of water resources while offering strategic insights for the sustainable development of the region. The commonly employed system dynamics model necessitates setting numerous assumptions (Cui et al., 2025) to construct complex causal relationships for predictive purposes, while remote sensing analysis and other methods heavily depend on the acquisition and processing of extensive spatial data (Dubovik et al., 2021). To date, no scholars have conducted predictive analyses of water supply and agricultural water use issues in Xinjiang using current mainstream prediction models. Therefore, this study aims to use current mainstream models to quantitatively forecast the future water supply and agricultural water use in Xinjiang, with a focus on addressing the following two key issues: (1) How can we investigate the historical patterns and future trends of water supply and agricultural water use in Xinjiang from the perspective of optimizing water resource allocation? (2) Which model is more conducive to predicting water supply and demand in Xinjiang, and lays the foundation for future water resource security, rational allocation, and scientific regulation?
2 Method and data
2.1 Study area
Xinjiang (73° 20´ −96° 25′ E, 34° 15´ −49° 10′ N) is located in the northwest of China (Ling et al., 2012; Zhang Y.-L. et al., 2023). With a land area of 1.6 million km2, it is China’s largest dryland. Xinjiang is the transportation corridor that connects East Asia with West Asia (Dai et al., 2024b), Africa, and Europe, making it the core area of the silk road economic belt. Xinjiang is one of the crucial grain and cotton production base in China, as well as a heavily industrialized province (Wang et al., 2020). In recent years, Xinjiang’s high-tech industries such as monocrystalline silicon and coal chemical industry have developed rapidly, contributing to the continuous growth of industrialization and urbanization (Cao et al., 2018).
Xinjiang is influenced by a continental air mass throughout the year, resulting in a typical inland arid climate. The average annual precipitation is 160 mm, while the potential evaporation is approximately 3,000 mm (Zhang Y.-L. et al., 2023). The Gobi Desert is among the driest regions in the world (Wang L.-Z. et al., 2024). Precipitation is concentrated in the mid- and high-mountain areas, while the low mountain areas and plains are dominated by arid grasslands, dry shrubs, and deserts, with oases in the river basins (Zhang Y.-X. et al., 2023). Xinjiang is divided into northern, southern and eastern parts by the Tianshan Mountain (Yao et al., 2023). The water resources in three regions exhibit substantial disparities (Yan and Jia, 2022). The annual total amount of water resource in Southern Xinjiang, Northern Xinjiang, and Eastern Xinjiang are 93.82 × 10⁸ m3, 73.92 × 10⁸ m3, and 10.15 × 10⁸ m3, respectively, with corresponding annual runoff depth per unit area of 105.73 mm, 46.8 mm, and 7.38 mm. The northwestern and southeastern separately comprise 95.39% and 4.61% of the total amount of water resource. The annual per capita water resource ranked from largest to smallest, are as follows: Northern Xinjiang, Southern Xinjiang and Eastern Xinjiang, with the respective values being for 8,441.73 m3/person, 4,048.21 m3/person and 2085.75 m3/person (Figure 1).
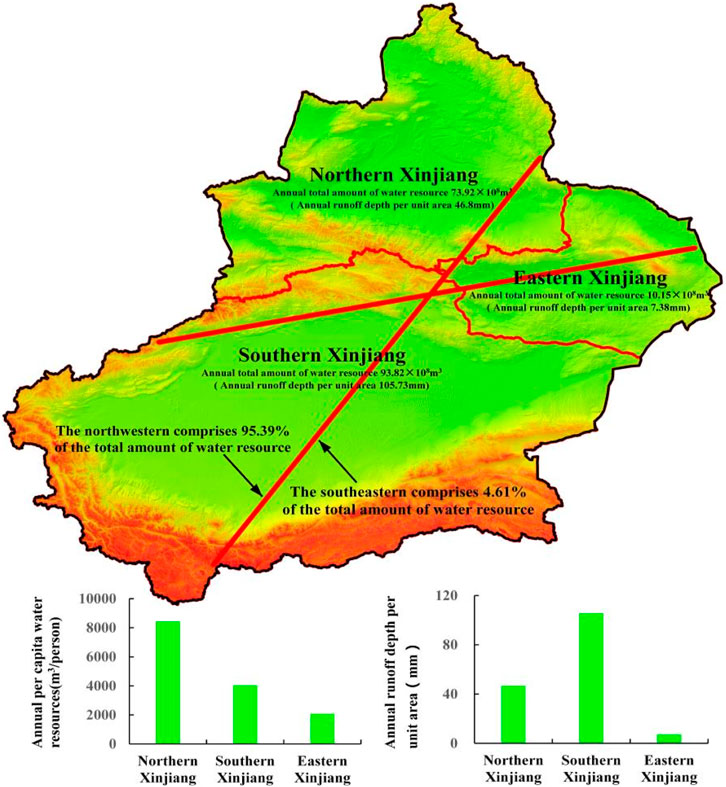
Figure 1. The annual total amount of water resources and their respective proportions, annual per capita water resources, and annual runoff depth per unit area in study region. The total amount of water resources, annual per capita water resources were according to the Xinjiang Statistical Yearbook (2000–2021), the annual runoff depth per unit area for each region were according to Xinjiang Water Resources Bulletin (2010–2021) (slt.xinjiang.gov.cn/). The geospatial remote sensing data is sourced from the Geospatial Data Cloud Network of the Chinese Academy of Sciences. The data can be accessed through the platform of the Computer Network Information Center of the Chinese Academy of Sciences (https://www.gscloud.cn/).
In 2021, the total amount of water resources is about 809.04 × 10⁸ m3. The available surface water is about 767.8 × 10⁸ m3. Xinjiang’s total water supply was 571.4 × 10⁸ m3, of which 420.1 × 10⁸ m3 of surface water supply, 147.1 × 10⁸ m3 of groundwater supply, and 4.2 × 10⁸ m3 from other water resources according to the Xinjiang Water Resources Bulletin (2010–2021) (slt.xinjiang.gov.cn) (Yao et al., 2023). Agriculture is a crucial component of Xinjiang’s social and economic development, and it is the largest sector in terms of water use (Figure 2).
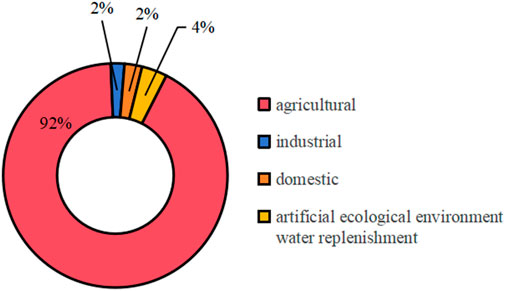
Figure 2. The averaged water resources proportion in different sectors during 2000–2022 in Xinjiang, the agricultural, industrial, domestic water use and artificial ecological environment water replenishment were according to the Xinjiang Statistical Yearbook (2000–2009), Xinjiang Water Resources Bulletin (2010–2021) (https://slt.xinjiang.gov.cn/), Xinjiang Government Work Reports (2022–2023) (https://www.xinjiang.gov.cn/).
2.2 Data resources and processing
2.2.1 Data resources
The data pertaining to water supply and agricultural water use employed in this study were obtained from authoritative sources, namely, the Xinjiang Statistical Yearbooks covering the period from 2000 to 2009, accessible online at http://tjj.xinjiang.gov.cn/, the Xinjiang Water Resources Bulletins for the years between 2010 and 2021, accessible online at https://slt.xinjiang.gov.cn/, and the Xinjiang Government Work Reports for 2022 and 2023, accessible online at https://www.xinjiang.gov.cn/.
Notably, the dataset on water supply is compiled from the aggregation of water provided to end-users by means of reservoir diversion schemes, exploitable water quantities from water treatment facilities, the reuse of treated wastewater, and the desalination of brackish water, thereby encompassing a comprehensive overview of water supply mechanisms within the region (Du et al., 2023). The water supply equals to the gross amount of water withdrawn by various water users, including agricultural water, industrial water, domestic water, and artificial ecological environment compensation water (Qin and Liu, 2024), and water loss. Among them, agricultural water is mainly used for farmland irrigation (Yang and Mu, 2022; Wang and Wang, 2022), industrial water refers to the water used by industrial and mining enterprises in the production process for manufacturing, processing, cooling, air conditioning, purification, washing, etc (Wang and Yan, 2017; Ma et al., 2014). Domestic water includes urban domestic water and rural domestic water (Cui et al., 2010), and artificial ecological environment compensation water is urban environmental water and some rivers, lakes and wetlands are supplied through artificial measures (Zhang et al., 2023c).
2.2.2 Data processing
Data normalization is essential to resolve the problem of inconsistent data dimensions among various variables (Deng, 2014). This process can help reduce the training rate, speed up convergence, and standardize the data within the range from 0 to 1.
The normalization was estimated using the following Equation 1:
where x* is the normalized data. x, xmax and xmin represent the original data, the maximum, and minimum values of the original data, respectively.
In order to obtain the specific predicted value, it is necessary to denormalize the predicted data (Weiss et al., 2023). The denormalization process can be estimated using the following Equation 2:
2.3 Model description
It is very difficult to accurately predict the water supply and demand dynamics in Xinjiang. To reduce the uncertainties related to water supply and use modelling, we compared the performance of five predictive analysis models including the Holt two-parameter linear exponential smoothing model, neural network model, fractional grey GM(1,1) model, fractional grey GM(2,1) model, and our new GM(1,1)-NN ensemble model which integrate the fractional grey GM(1,1) model and neural network model predictions using a linear weighting approach. All the models were trained by using the data of water supply (unit: 108 m3) and agricultural water use (unit: 108 m3) in Xinjiang from 2000 to 2023 (see Section 2.2.1.). In the stage of data processing and validation, the original data are strictly screened and preprocessed, and the data normalization and K-fold cross validation methods are used to improve the stability and prediction accuracy of the model and effectively control the uncertainty of the data. The model with the best performance was used to forecast water supply and agricultural water demand for the next 5 years (2024–2028).
2.3.1 Holt two-parameter linear exponential smoothing model
The Holt two-parameter linear exponential smoothing model is a time series prediction method suitable for data with no obvious seasonality (Kong et al., 2023; Chen et al., 2023). It usually uses a pair of smoothing coefficients, a and b, to estimate the horizontal demand and growth trend time series (Equation 3), respectively (Vadim and Vasiliy, 2023).
The prediction formula is as follows Equation 4:
where Dt corresponds to the empirical measurement or observation taken at time t, whereas Ft+1 is the forecasted value anticipated for the immediate succeeding time interval (t+1). Moreover, Lt embodies the notion of average demand at any given time t, and Tt captures the temporal trend or growth trajectory at the same time instance. Where a and b was the numbers ranging from 0 to 1. This framework facilitates the decomposition of complex time series into their constituent components, thereby enabling more accurate predictions.
2.3.2 Neural network model
The neural network model is a machine learning model based on an artificial neural network (Adedoyin and Omotayo, 2024). The basic structure includes an input layer, hidden layer, and output layer (Zhang and He, 2023). Let the weights from the input layer to the hidden layer be denoted as wij, and the biases as aj; the weights from the hidden layer to the output layer are represented as wjk, with biases bk, following is a brief description of the model training procedure:
(1) Initialization of weights and biases, and determination of the optimal number of hidden layer neurons
Assuming the number of neurons in the input layer is n, in the hidden layer is l, and in the output layer is m. The optimal number of hidden layer neurons is determined through trial and error within a specified range, following the formula:
(2) Selection of activation functions
Owing to the absence of a straightforward technique to pinpoint the best activation function, numerous iterations are conducted to test various activation functions. The selection is guided by observing the model’s accuracy profile. Among the commonly adopted activation functions are logsig (logistic sigmoid) (Equation 5), tansig (hyperbolic tangent sigmoid) (Equation 6), and purlin (linear activation function) (Equation 7). These activation functions introduce non-linearity to the network, enabling it to learn complex patterns and make sophisticated predictions.
The logsig activation function is mathematically defined as:
The tansig activation function is given by:
The purelin activation function is simply as below:
(3) Calculating the output values of the hidden layer and the output layer
The output value of the hidden layer Hj is calculated as Equation 8:
Where f and xj are the activation function of the hidden layer and jth input signal, respectively.
The output value of the output layer is calculated as Equation 9:
where f and Hj are the activation function of the hidden layer and the jth input signal, respectively.
(4) Define the error function
The mean square error is calculated using the following Equation 10:
where yk and Ok are the kth actual value of the output layer and the kth output value of the output layer.
(5) Update the weights and thresholds of the input layer, hidden layer, and output layer
The weights are calculated using the following Equation 11:
The formula for updating thresholds is Equation 12:
where η is the learning rate, and the general value range is from 0 to 1.
(6) Conditions for judging the end
If the end condition is not reached, then return to step (3) to continue the training.In this study, the water supply and agricultural water use data from 2000 to 2020 are set as the training sample. The measured data from every 3 years is used to predict the data for the next year. Experimentation with different numbers of hidden layer nodes is conducted, and the final hidden layer has 10 nodes.
2.3.3 Fractional grey GM(1,1) model
The fractional grey GM(1,1) model is a model that combines grey time series data using the grey differential fitting method (Ouyang et al., 2024). The modeling process is as follows:
Firstly, let the source data set be (Equation 13):
A monotonically increasing sequence can be obtained by accumulating the source data once (Equation 14).
Due to the exponential growth trend observed in the previously accumulated sequence, it conforms to the formula (Equation 15) for the gray differential model.
The parameters (a1 and b1) of the grey differential equation are estimated using the least squares method, with the following Equation 16:
which are calculated as Equation 17:
The expression of the traditional GM(1,1) model (Equation 18) can be solved by substituting a1, b1 and initial conditions x(1) (1) = x(0) (1):
The predicted value of the original observation sequence can be obtained by reconstructing the sequence (Equation 19).
2.3.4 Fractional grey GM(2,1) model
The fractional grey GM(2,1) model applies both a first-order accumulation operation and a first-order reduction operation to the raw observational data, generating sequences that are subsequently utilized for enhanced forecasting and analytical purposes within the framework of grey system theory. These operations facilitate the extraction of embedded patterns and trends that might not be immediately apparent in the original dataset.
The model calculation formula is similar to Section 2.3.3. The main difference between them is the order. The fractional grey GM(2,1) model is a second-order ordinary differential equation (Adedoyin and Omotayo, 2024), while the fractional grey GM(1,1) model is a first-order ordinary differential equation. The fractional grey GM(2,1) model involves performing a first accumulation generating sequence and a first diminution sequence on the original observed values, respectively (Equation 20).
The grey differential equation satisfied by the fractional grey GM(2,1) model is Equation 21:
The parameters can be estimated using the least squares method (Equation 22).
Where
2.3.5 Integrating the fractional grey GM(1,1) model and neural network model to develop the GM(1,1)-NN model
The four models selected in this paper are representative and widely used in the field of water resources prediction. GM(1,1)-NN model is based on the above single model, and two better models are obtained according to the posterior error verification, and the limitations of the two better models were broken to form GM(1,1)-NN model. This model combined the advantages of better stability, suitable for small amount of data prediction and high precision of grey model, as well as the advantages of deep learning and few parameters of the neural network model. It could achieve prediction by improving prediction accuracy and reducing model complexity.
In order to enhance prediction accuracy, an ensemble model (GM(1,1)-NN) is developed based on a fractional grey GM(1,1) model and a neural network model, utilizing linear weighting (Equation 23).
where predcombined is the predicted value of combined model, the parameters a and b are the weights learned by model training, predNN and predGM(1,1) are the predicted values of the neural network model and the fractional grey GM(1,1) model, respectively. Where a and b are the numbers ranging from 0 to 1, respectively.
To derive the parameters a and b, we first determined the fractional grey GM(1,1) model. Next, we use the fractional grey GM(1,1) model to derive the values for each year in the training dataset. As is already known, the GM(1,1)-NN model could be considered an extension of the original neural network model, and its parameters a and b are trained together with the parameters of the neural network.
2.3.6 Model evaluation by K-fold cross-validation
The concept of K-fold cross-validation involves roughly dividing the data into K sub-samples. One sample is taken as the validation data each time, and the remaining K-1 samples are taken as the training data. After the model is constructed, it is used to analyze the verification data and calculate the current error rate. Repeat the process K times, calculate the average error rate over the K trials, and determine the overall error rate. The overall error rate can be used to estimate the error rate of the current dataset for modeling purposes. Compared with simply dividing the data into a training set and a test set, this testing method can ensure the completeness of the data. Possible use to comprehensively evaluate the performance indicators of the model. S-folder cross validation will randomly divide the sample data into S parts. Each time, S-1 is randomly selected as the training set, and the remaining one is used as the test set. When this round is completed, the S-1 is randomly selected again to train the data. After several rounds (less than S), the loss function is chosen to evaluate the optimal model and parameters. The results of cross-validation are only comparable within the same type of data.
In this study, the posterior error ratio (C) is used as the benchmark in model evaluation (Equation 24) (Du et al., 2023).
The S2 and S1 values are calculated as follows Equations 25, 26:
Where
The performances of the models can be evaluated based on the C value (Table 1). According to Table 1., the posterior difference ratio that is no less than 0.35 indicates high model prediction accuracy, and the model is set to grade A. When the posterior difference ratio is greater than 0.65, it indicates that the prediction result of the model is not good, and the model is set to grade D.
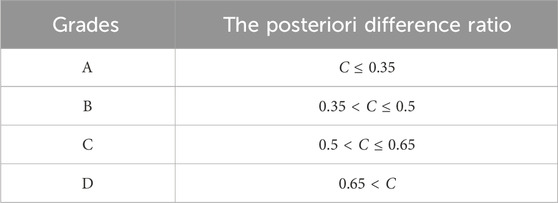
Table 1. Criteria for grading model performance (Li, 2021).
3 Results and analysis
3.1 Agricultural water use and its share in the total water supply from 2000 to 2023
Water supply is determined by water demand. On the whole, the temporal distribution of water use in agriculture exhibits a high degree of non-uniformity. From 2000 to 2018, the volume of water supply and agricultural water use showed a similar trend in variation. The lowest values for both occurred in 2002, at 474.6 × 10⁸ m3 and 448.9 × 10⁸ m3, respectively. They both increased afterward and reached their highest values in 2012, at 590.1 × 10⁸ m3 and 561.7 × 10⁸ m3, respectively. After that, both of them decreased until 2018 (Figure 3). After 2018, the changes in water supply and agricultural water use were no longer synchronous.
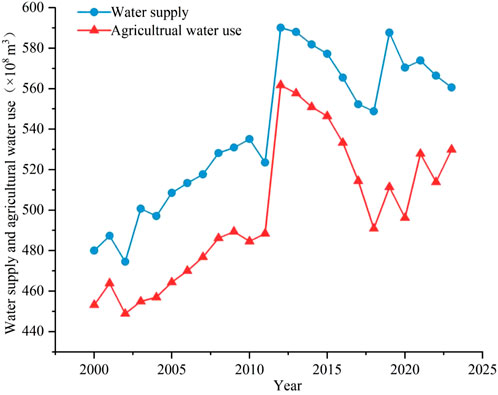
Figure 3. The changes of water supply and agricultural water use in Xinjiang from 2000 to 2023.
Agricultural water use accounts for the highest proportion of total water use. The structure of agricultural water use has undergone significant changes. The proportion of agricultural water use in water supply was 94% in 2000, but decreased to only 87% in 2020, and increased to 91% in 2023 (Figure 4) , other water use has also changed as a result in these years. The average proportion of agricultural water use from 2000 to 2023 was 92%. In the past 2 decades, there have been three increases and three decreases in agricultural water use, the three peaks appeared in 2012, 2021 and 2023 respectively, and the three valley values appeared in 2010, 2020 and 2022, respectively. The highest proportion of agricultural water use was the highest in 2012, reaching to 95%, the lowest proportion of agricultural water use was the highest in 2020, reaching to 87% (Figure 4).
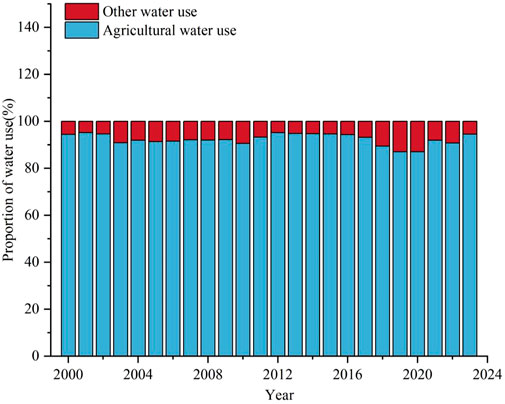
Figure 4. The proportions of agricultural water use in the total water supply from 2000 to 2023.
3.2 Model validation and selection
The posterior error ratios of five models in predicting water supply range from 0.36 to 0.69, agricultural water use range from 0.47 to 1.2 (Table 2). Our GM(1,1)-NN ensemble model is the only one that earned a B grade in predicting results. All the models perform in predicting the water supply, with posterior error ratios ranging from 0.36 to 0.69, with the grades from B to D. Thus, excepted the fractional grey GM(2,1) model, other models all receive the grade B. The GM(1,1)-NN ensemble model has the lowest posterior error ratio of 0.36. As the GM(1,1)-NN ensemble model has the highest performance among all models, it means the model is feasible, so we select it to forecast water supply for the next 5 years (2024–2028).
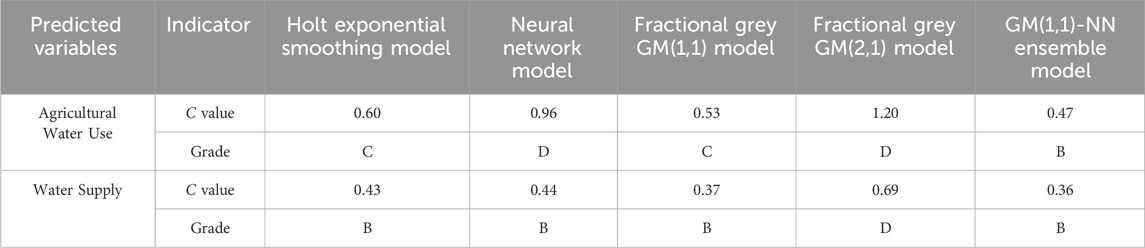
Table 2. Grade the models’ performances based on their posterior error ratio.
From the perspective of agricultural water use values, the predicted posterior error ratios of the five models are between 0.47 and 1.2, rated from B to D grades, with only the GM(1,1)-NN ensemble model performing as B grade. Holt exponential smoothing model and fractional grey GM(1,1) model performing as grade C, neural network model and fractional grey GM(2,1) model performing as grade D. Therefore, we intend to perform a comprehensive integrated analysis of the output results from five models pertaining to water supply and agricultural water use. The GM (1,1)-NN ensemble model has the smallest predicted C value both in water supply and agriculture water use, while the fractional grey GM(2,1) model has the largest predicted C value.
Furthermore, to rigorously assess the accuracy of the model predictions, we employed the widely recognized mean absolute error (MAE) metric to evaluate the precision of five models (Table 3). The MAE of five models in predicting agricultural water use ranged from 0.88 to 5.26. The GM(1,1)-NN ensemble model is the minimum, but the fractional grey GM(2,1) model is the maximum. The MAE of five models in predicting water supply ranged from 0.42 to 4.56. The GM(1,1)-NN ensemble model is the minimum, thus the fractional grey GM(2,1) model is the maximum. Furthermore, it is evident that the GM(1,1)-NN ensemble model received the lowest MAE both in water supply and agricultural water use. The MAE of the GM(1,1)-NN ensemble model is 0.42 in water supply and 0.88 in agricultural water use.
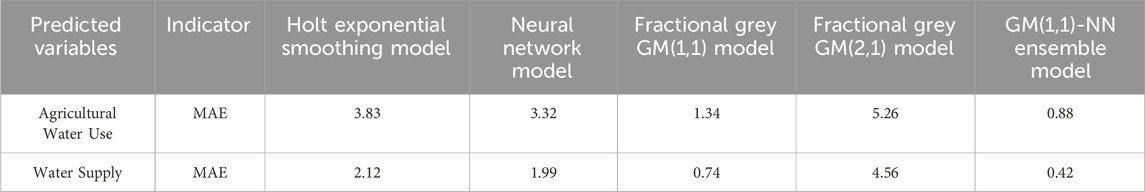
Table 3. The performance of the models, as evaluated by its mean absolute error.
3.3 Predictions of future water supply and agricultural water demand
The GM(1,1)-NN ensemble model predicts that from 2024 to 2028, Xinjiang’s water supply and agricultural water demand will both exhibit a decreasing trend yearly, with the decline expected to be less than 1%. As a result of the greater decline in agricultural water demand, the proportion of agricultural water demand in water supply will decrease from 90% in 2024 to 88% in 2028. The projected non-agricultural water demand exhibits a consistent annual growth trend, increasing from 56.83 × 10⁸ m3 in 2024 to 63.61 × 10⁸ m3 in 2028 (Table 4).
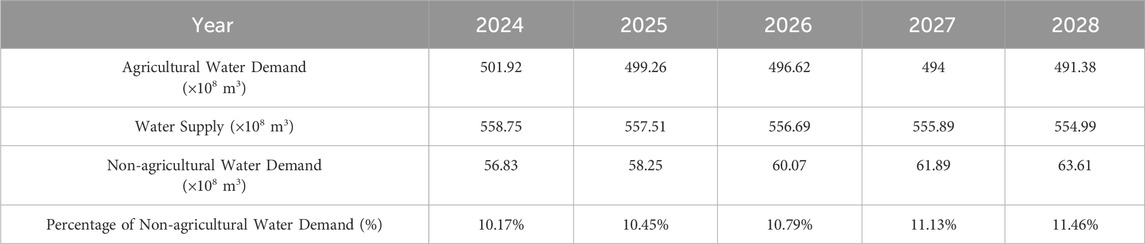
Table 4. Predictions of water supply and agricultural water demand from 2024 to 2028.
4 Discussion
4.1 The discrepancy between the spatial distribution of water resources and the pattern of economic development
The water supply in Xinjiang is closely correlated with precipitation levels. There are significant differences in the average annual precipitation among different regions in Xinjiang. Southern Xinjiang has the highest annual precipitation with an average of 324.02 × 10⁸ m3, followed by Northern Xinjiang with an average of 184.04 × 10⁸ m3, and Eastern Xinjiang has the lowest annual precipitation with an average of 63.88 × 10⁸ m3. There are significant differences in precipitation among different regions in Northern Xinjiang. Ili Prefecture has the highest annual precipitation of 599.04 × 10⁸ m3, while Karamay has the lowest annual precipitation of 7.91 × 10⁸ m3, a difference of 75 times between them. There is not much difference in annual precipitation among different prefectures in Southern Xinjiang, ranging from 200 × 108 m3 to 500 × 108 m3. There are significant regional differences in the average surface water volume and groundwater volume in different regions of Xinjiang, with the order as belows: Southern Xinjiang > Northern Xinjiang > Eastern Xinjiang. Among them, the surface water volume and groundwater volume in Yili Prefecture of Northern Xinjiang are the highest, at 260.13 × 10⁸ m3 and 129.77 × 10⁸ m3, respectively. There is a certain relationship between local precipitation and surface water and groundwater (Table 5).
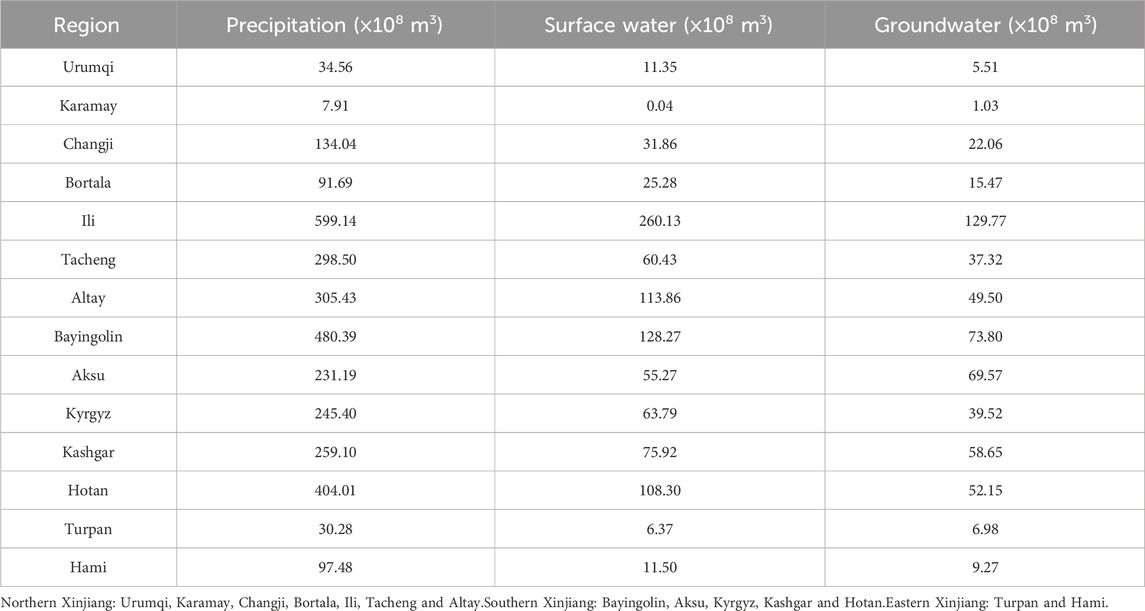
Table 5. The average annual precipitation, surface water volume and groundwater volume among different regions in Xinjiang from 2010–2020.
Despite the Northern Xinjiang accounting for less than half of the province’s total precipitation and water resources, it exhibits a significantly higher level of economic development, contributing over 60% of the province’s economic output (Zuo et al., 2021). The Northern Xinjiang is rich in critical mineral resources such as oil and natural gas and serves as an important industrial base for Xinjiang. Additionally, it has a substantial population with relatively high educational attainment and advanced agricultural production technology, leading to higher water use efficiency in agriculture (Bao et al., 2024). In contrast, while the Southern Xinjiang experiences abundant precipitation, its economic development lags behind. Economic constraints have resulted in limited adoption and understanding of various agricultural water-saving technologies among producers, as well as inadequate infrastructure for basic water conservation measures, thereby contributing to lower water use efficiency in local agriculture (Wang and Shao, 2021).
Therefore, in light of the significant imbalance between economic development and water resource distribution, Xinjiang should focus on building a multi-level and multi-functional water diversion channel network, and lay out the water system connectivity network from the regional, river basin, and city levels, so as to achieve cross-regional water transfer and improve Xinjiang’s water resource allocation capacity.
4.2 The impact of agricultural water use on the development of other industries
Despite being one of China’s major grain and cotton production bases, ensuring the development of industry and urbanization in Xinjiang is crucial. From 2010 to 2020, the industrial and service sectors significantly contributed to Xinjiang’s economic growth, accounting for 12% of the increase in gross domestic product (Zhang et al., 2023c). Correspondingly, the demand for industrial water has risen. The urbanization rate is also high in Xinjiang. For example, the urban area of Urumqi, the capital of Xinjiang, expanded by 6.69 times between 1993 and 2013 (Susu, 2020). This expansion accelerated after 2013, increasing pressure on residential water supplies (Zhang, 2023). Moreover, overexploitation of natural resources (Zhang et al., 2023c) and ecological damage in key watersheds have increased the need for environmental restoration water (Li, 2021). For instance, in the Tarim River Basin of Xinjiang’ main watershed, the ecological water deficit has expanded by 1.79 times over the past 2 decades, posing a threat to the ecological security of the entire basin (Al et al., 2024). However, our study shows that the average proportion of water allocated to agriculture has exceeded 90% in Xinjiang more than 20 years. This high rate of agricultural water consumption rate led to insufficient water resources for other industries and ecological restoration.
Reducing the proportion of agricultural water use could conserve valuable water resources to meet the needs of industrial development, urbanization, and ecological restoration. To analyze the impact of agricultural water use on other sectors, we examine the water usage patterns in Xinjiang for the years 2012 and 2019 (Figure 5). Influenced by global warming and extreme weather conditions, both precipitation and total water resources in Xinjiang exceeded multi-year averages during these periods. In 2019, the total new water volume was 3.89 × 10⁸ m3, with agricultural water usage increasing by 2.37 × 10⁸ m3 compared to 2018. This resulted in a surplus of 1.52 × 10⁸ m3 of water available for industrial, domestic, and ecological restoration purposes, effectively addressing water shortages in these areas. In contrast, the situation in 2012 was less favorable. Despite an increase in total water volume by 6.66 × 10⁸ m3, agricultural water use surged by 7.33 × 10⁸ m3. This significant rise in agricultural water demand necessitated reductions in water allocation for other sectors to prioritize agricultural production. The primary reason for this was the severe drought experienced in the oasis planting areas of the northern Tianshan region and parts of the Southern Xinjiang. Harsh climatic conditions led to a sharp increase in crop water requirements, thereby driving up agricultural water consumption. As the results, the industrial and urban developments are severely limited by water supply in the region, and economic development exceeds the carrying capacity of water resources, resulting in a decrease in the proportion of irrigated farmland and ecosystem degradation in some areas in the Northern Xinjiang (Bao et al., 2024). In contrast, the water resources utilization in Southern Xinjiang, which is dominated by irrigated agriculture, is relatively low-efficient, and agriculture is still dominated by traditional large-scale surface flood irrigation. The water conservancy facilities in this region are weak, the irrigation and drainage systems are not matched, and the water resources are seriously wasted, which restricts the improvement of agricultural water use efficiency (Li, 2021).

Figure 5. Water use by the agriculture and other sectors in 2012 and 2019.
Similar impacts of climate-induced water resource fluctuations have been observed globally. For instance, Pakistan faced floods in 2010 and 2022 due to climate change, significantly affecting local water supplies (Javeria et al., 2023). Additionally, compound disasters such as heatwaves, floods, and debris flows associated with droughts have severely impacted water availability (Agha et al., 2023), leading to a 1.9% reduction in wheat production (Diego et al., 2021). These examples underscore the profound influence of extreme weather events on both water resource availability and agricultural productivity.
4.3 Predictions of future water demand and water supply balance
This study developed a novel GM(1,1)-NN model, which integrates the results of neural network and fractional grey GM(1,1) model, performed best, indicating that ensemble learning can effectively enhance the predictive accuracy of the water supply-demand relationship in Xinjiang. The findings of this study align with those of other scholars who have integrated neural networks and grey models. Xie et al. combined neural networks with grey prediction models, mathematically reducing the number of conditions required for gradient descent and validating the model’s effectiveness (Xie et al., 2023). Ma further applied this integrated model to predict provincial tourism population trends, achieving reasonably accurate results (Ma, 2021). In contrast, when Xiong et al. used this model to forecast the provincial digital economic development index, they found that its prediction accuracy was lower compared to other models and it was only suitable for short-term predictions (Xiong et al., 2025). Therefore, the GM(1,1)-NN model employed in this study demonstrates similar prediction accuracy to previous studies, indicating its suitability for short-term forecasts and higher precision in such contexts.
Using the GM(1,1)-NN model, the interannual changes in water supply and agricultural water demand for the next 5 years is predicted to be less than 1%. The available water resources after deducting agricultural water demand are projected to increase from 56.83 × 10⁸ m3 in 2024 to 63.61 × 10⁸ m3 in 2028, translating into a non-agricultural water demand increase of approximately 12% over the next 5 years. This suggests that more water resources will be available for industrial development, urbanization, and ecological restoration in the future. However, agriculture is still expected to consume over 88% of Xinjiang’s water resources. Without further reduction in agricultural water use through water-saving measures, the socio-economic and ecological sustainability of Xinjiang will continue to be constrained by water shortage.
This article used the GM (1,1) -NN model to predict the water supply-demand relationship that were similar to Aman (Riziya Aman, 2021). It further confirmed the effectiveness of the model in predicting water resources in Xinjiang. In terms of water efficiency and allocation strategies, it was consistent with Zhang’s research (Zhang, 2023) trend that the proportion of agricultural water use in arid and semi-arid areas will still dominate (70%), which greatly limited the development of other industries, especially industry. In addition, with the support of Xinjiang’s unique coal resources, from the perspective of investment in Xinjiang’s coal chemical industry in next 5 years, numerous methanol to olefin projects have been implemented ceaselessly (Chen, 2024). As an extremely water consuming industrial production project, the coal chemical industry would have a certain impact on the future agricultural and aquatic production in Xinjiang. Therefore, the rational allocation and utilization of water resources have a significant impact on the future economic development and social stability in Xinjiang.
4.4 Countermeasures and suggestions
There is considerable room for improvement in the efficiency of agricultural water use in Xinjiang. Expanding the scale of water-saving facilities and developing water-saving irrigation technologies, such as drip irrigation and low-pressure sprinkler irrigation, can improve water use efficiency by up to 70% (Wang et al., 2021). Reducing the area dedicated to high-water-demand crops can also decrease agricultural water demand. For example, the annual average water requirement for Xinjiang’s main cash crop, cotton, is 645 mm, which is 22% higher than that of corn (Wu, 2023). Relatively water-efficient crops such as corn can be cultivated on a larger scale to reduce agricultural water consumption. However, even for the same crop, crop selection is still subject to greater challenges due to factors such as fertilizer, pesticide, machine harvesting prices, and land contracting fees (Wang L. et al., 2024). Taking cotton, for example, there was a significant difference in planting costs and benefits between northern and southern Xinjiang. Assuming that the market sales price is the same and the cotton collection method was excluded, the planting cost in Southern Xinjiang was about 2,750–3,300 yuan/Mu, and the planting cost in northern Xinjiang was about 2,950–3,600 yuan/Mu. It could be seen that from a cost accounting perspective, Southern Xinjiang is more suitable for large-scale cotton planting, which could save about 10% of economic investment.From the perspective of income, crop income was mainly influenced by factors such as market prices, downstream production enterprise layout, and transportation distance. There are a large number of cotton midstream and downstream industries in Southern Xinjiang, such as tie flower factories, textile enterprises, clothing processing, as well as domestic and foreign sales and export enterprises. Therefore, considering the above factors comprehensively, it was recommended that encourage farmers in Southern Xinjiang to use cotton as their main crop through government subsidies and other policy support, and to plant more water-saving crops in Northern Xinjiang to replace cotton. This approach has also achieved typical results in Israel (Tal, 2021), which was known for its arid regions. The local government of Israel implements classified policies, mainly planting high water consuming crops such as rice and grains in the northern to meet domestic food demand, and focusing on planting low water consuming and high value-added economic crops such as vegetables and fruits in the southern for export to boost local economic growth.
Additionally, water-saving cultivation management techniques, such as regulated deficit irrigation, which can stimulate the drought resistance potential of crops and save 5%–28% of irrigation water (Wang, 2021), can be employed. Therefore, optimizing and adjusting the structure of Xinjiang’s agricultural industry, promoting the investment and construction of water conservancy facilities, and strengthening the promotion and service of agricultural water-saving irrigation technology will help improve the irrigation efficiency of Xinjiang’s agricultural water resources (Zhuang et al., 2020; Xie et al., 2018).
4.5 Limitations of the study
Although the GM(1,1)-NN model has achieved success in predicting the supply-demand of water in typical arid areas of Xinjiang, from a regional perspective, the input data of the model was based on past water supply and agricultural water use data in Xinjiang. However, climate change (Fan and Huang, 2023), policy changes, economic changes, and technological progress would all have important impacts on the future water supply-demand relationship in Xinjiang. Under the trend of global warming, a significant reduction in precipitation poses a severe challenge to water resource supply. The increase in extreme weather events, particularly frequent heavy rainfall leading to floods, further exacerbates the imbalance between water supply and demand (Guo et al., 2023; Goutam et al., 2020). Policy adjustments also have a substantial impact on water resource management. Government policies, such as raising water resource tax rates, can encourage more efficient water use and conservation, thereby reducing water demand to some extent (Bai et al., 2021). Industrial restructuring and upgrading also significantly affect water demand. Traditional water-intensive industries consume substantial amounts of water, while the development of low-water-consuming, high-value-added emerging industries can alleviate pressure on water supply and demand while promoting sustainable economic growth. Therefore, comprehensive predictions could be combined from the perspectives of climate change, policy drivers, and economic technological advancements in future.
5 Conclusion
Agricultural water use has long accounted for over 90% of water resources in the arid region of Xinjiang, severely limiting industrial, domestic, and ecological water use, and threatening the achievement of the sustainability of high-quality development in Xinjiang. By analyzing the trends in water supply and agricultural water use in Xinjiang over the past 2 decades, it is evident that significant regional disparities exist in water resources. These disparities are closely linked to variations in precipitation patterns and the spatial distribution of economic activities. Accurate prediction of future water supply and demand balances in this region was essential for formulating proper water resource management and distribution policies. This study found that the GM(1,1)-NN model, which integrates the fractional grey GM(1,1) model and the neural network model, demonstrated superior predictive accuracy compared to commonly used water resource prediction models. Using this model, we forecasted that the interannual changes in agricultural water use and water resource supply in Xinjiang over the next 5 years (2024–2028) would be less than 1%. After deducting agricultural water use, available water resources for non-agricultural use were expected to increase from 56.8 × 10⁸ m3 in 2024 to 63.6 × 10⁸ m3 in 2028, implying a 12% increase in non-agricultural water use over the next 5 years. Even so, agricultural water use will still account for over 88% of the total water supply.
Therefore, it is suggested that measures such as adopting water-saving drip irrigation and optimize the allocation of crop planting areas to further reduce agricultural water demand and increase the supply of industrial, domestic, and ecological water use.
Firstly, regarding water-saving facilities, drip irrigation remains the primary method for alleviating agricultural water shortage and enhancing agricultural water use efficiency. Taking cotton cultivation as an example, traditional flood irrigation typically consumes 80–100 m3/Mu for each irrigation event. In contrast, drip irrigation reduces this to 40–60 m3/Mu, resulting in water savings of approximately 40 m3/Mu (Ma, 2023). Advanced water-saving technologies play a pivotal role in enhancing the efficient utilization of water resources, significantly reducing water wastage and improving overall water use efficiency.
Furthermore, regarding regional planting, the rational division of crop planting areas is a critical measure for optimizing the agricultural production structure, reducing production costs, and enhancing agricultural productivity. The crop planning experience of Heilongjiang Province in China serves as an exemplary model worthy of emulation. Local government departments have effectively coordinated efforts, establishing collaborative platforms that integrate the expertise of research institutions and universities, the premium resources of seed enterprises, and the extensive outreach capabilities of extension services to jointly evaluate and select high-quality, efficient crop varieties. Based on this initiative, 298 crop varieties are scientifically allocated for cultivation across different agro-climatic zones within the province, taking into account their unique climatic characteristics and geographical conditions (Du et al., 2024). This strategic approach has not only significantly reduced agricultural water consumption and enhanced water resource efficiency but also provided a robust foundation for sustained grain yield increases and the overall advancement of agricultural quality.
Data availability statement
The datasets presented in this study can be found in online repositories. The names of the repository/repositories and accession number(s) can be found in the article/supplementary material.
Author contributions
YY: Conceptualization, Data curation, Formal Analysis, Validation, Visualization, Writing – original draft, Writing – review and editing. CZ: Formal Analysis, Methodology, Supervision, Validation, Writing – review and editing. GL: Funding acquisition, Supervision, Writing – review and editing. TL: Supervision, Visualization, Writing – original draft.
Funding
The author(s) declare that financial support was received for the research and/or publication of this article. This work was supported by the Tianshan Talent Cultivation (Grant No. 2022TSYCLJ0001), and the Key Projects of the Natural Science Foundation of Xinjiang Autonomous Region (Grant No. 2022D01D01).
Acknowledgments
We want to thank the editor and reviewers for their constructive comments, which help us improve this manuscript greatly.
Conflict of interest
The authors declare that the research was conducted in the absence of any commercial or financial relationships that could be construed as a potential conflict of interest.
Publisher’s note
All claims expressed in this article are solely those of the authors and do not necessarily represent those of their affiliated organizations, or those of the publisher, the editors and the reviewers. Any product that may be evaluated in this article, or claim that may be made by its manufacturer, is not guaranteed or endorsed by the publisher.
References
Adedoyin, T.-O., and Omotayo, B.-A.-W. (2024). Predicting stock market movements using neural networks: a review and application study. Comput. Sci. and IT Res. J. 3, 651–670. doi:10.51594/csitrj.v5i3.912
Agha, A.-K., Laurie, S.-H., Mojtaba, S., Qin, Y., Yannis, M., Farshid, V., et al. (2023). Toward impact-based monitoring of drought and its cascading hazards. Nat. Rev. Earth Environ. 4, 582–595. doi:10.1038/s43017-023-00457-2
Al, J.-Z., Hao, X., Li, X., Fan, X., and Zhang, S. (2024). Evaluation and regulation strategy for ecological security in the Tarim River Basin based on the ecological footprint. J. Clean. Prod. 435, 140488. doi:10.1016/j.jclepro.2023.140488
Bai, H.-F., Tang, K., and Yu, Z.-J. (2021). Water policy and regional economic development: evidence from Henan province, China. Water Policy 23 (2), 397–416. doi:10.2166/wp.2021.167
Bao, Y.-L., Su, W.-Z., Zhang, L.-Z., and Li, Q.-S. (2024). Analysis regional difference of green agriculture development level in Xinjiang, 3. China: Xinjiang Agricultural Sciences, 773–780.
Bian, H. (2021). Forecast of China's water resource demand in 2030. China: China University of Geosciences. doi:10.27493/d.cnki.gzdzy.2021.000132
Brenner, C., Frame, J., Nearing, G., and Schulz, K. (2021). Schätzung der verdunstung mithilfe von machine-und deep learning-methoden. Österr Wasserund Abfallw 73, 295–307. doi:10.1007/s00506-021-00768-y
Cao, Y.-P., Nan, Z.-T., Cheng, G.-D., and Zhang, L. (2018). Hydrological variability in the arid region of northwest China from 2002 to 2013. Adv. Meteorology 13, 1–13. doi:10.1155/2018/1502472
Chen, H., Tian, E., Wang, L., and Liu, S. (2023). A joint online strategy of measurement outliers diagnosis and state of charge estimation for lithium-ion batteries. IEEE Trans. Industrial Inf. 5, 6387–6397. doi:10.1109/TII.2022.3202949
Chen, Y. (2024). Research on the development status and policies of modern coal chemical industry in Xinjiang during the 14th five year plan period. Coal Process. Compr. Util. 7, 72–77. doi:10.16200/j.cnki.11-2627/td.2024.07.017
Cui, W.-J., Zhou, F.-X., and Xu, C.-P. (2010). Ecological footprint estimation of heavy chemical industry in China. China Population. Resour. Enviroment 8, 137–141.
Cui, Y.-D., Li, Y.-Z., and Ma, C.-X. (2025). Research on passenger flow forecast of tourist-dedicated train based on system dynamics. Tech. Gaz./Teh. Vjesn. 1 (32), 275–287. doi:10.17559/TV-20240113001265
Dai, X.-M., Liu, M.-H., and Lin, Q. (2024b). Research on optimization strategies of regional cross-border transportation networks—implications for the construction of cross-border transport corridors in xinjiang. Sustainability 16, 5337. doi:10.3390/su16135337
Dai, X.-M., Liu, M.-H., Lin, Q., and Li, X.-P. (2024a). Research on regional accessibility and evolution of spatial structure: based on the demonstration of the core zone 30a of the Silk Road economic belt. 7th Int. Conf. Traffic Eng. Transp. Syst. (ICTETS 2023) 8, 10. doi:10.1117/12.3015665
Deng, M.-J. (2014). Top ten ecological environment protection targets and its solutions in Xinjiang. Arid. land Geogr. 37, 866–874.
Diego, N.-L.-P., Ixchel, M.-H.-O., Matthew, R., Kai, S., Anabel, M.-M., and Richard, D.-R. (2021). Climate impact and adaptation to heat and drought stress of regional and global wheat production. Environ. Res. Lett. 5 (16), 54070. doi:10.1088/1748-9326/abd970
Ding, H.-H. (2021). “Grey prediction model based on time delay effect and its application in agricultural drought,” in China: north China university of water resources and electric power. doi:10.27144/d.cnki.ghbsc.2021.000315
Du, G.-M., Ma, S.-R., and Zhang, R. (2024). Research on the division of planting patterns in Heilongjiang province. J. Northeast Agric. Univ. 55 (2), 81–92. doi:10.19720/j.cnki.issn.1005-9369.2024.02.009
Du, X.-Q., He, L.-Y., Ren, S.-R., Yao, H.-R., and Qiao, Q.-T. (2023). Water resources evolution and water supply composition in northern China. J. Jilin Univ. 2, 566–577. doi:10.13278/j.cnki.jjuese.20210294
Du, X.-Y., Cao, X.-B., Li, C., Wang, Y.-H., and Ma, L.-J. (2014). Research on grey prediction model of urban water consumption based on genetic algorithm: a case study of Qinhuangdao water diversion project. J. Water Resour. Water Rngineering 25 (3), 129–132.
Duan, L., Bu, L.-J., Chen, C.-L., and Song, S. (2024). Temporal and spatial variation analysis of groundwater stocks in Xinjiang based on GRACE data. Remote Sens. 5, 813. doi:10.3390/rs16050813
Dubovik, O., Schuster, G.-L., Xu, F., Hu, Y.-X., Bösch, H., Landgraf, J., et al. (2021). Grand challenges in satellite remote sensing. Front. Remote Sens. 1, 619818. doi:10.3389/frsen.2021.619818
Fan, J., and Huang, G.-W. (2023). Flood risk management in Japan in response to climate change: shift from river channel-focused control to watershed-oriented management. Emerg. Manag. Sci. Technol. 3, 0. doi:10.48130/EMST-2023-0023
Fan, S. X., Yan, M., Yu, L.-F., Chen, B.-W., and Zhang, L. (2024). Integrating ecosystem service supply–demand and ecological risk assessment for urban planning: a case study in Beijing, China. Ecol. Indic. 161, 111950. doi:10.1016/j.ecolind.2024.111950
González, P.-R., Camacho, P.-E., and Rodríguez, D.-J.-A. (2024). Attention is all water need: multistep time series irrigation water demand forecasting in irrigation districts. Comput. Electron. Agric. 218, 108723. doi:10.1016/j.compag.2024.108723
Goutam, K., Ashok, K.-M., Yoshihide, W., and Michael, E. (2020). Climate change will affect global water availability through compounding changes in seasonal precipitation and evaporation. Nat. Commun. 11, 3044. doi:10.1038/s41467-020-16757-w
Guo, Q., Yu, C.-X., Xu, Z.-H., Yang, Y., and Wang, X. (2023). Impacts of climate and land-use changes on water yields: similarities and differences among typical watersheds distributed throughout China. J. Hydrology Regional Stud. 45, 101294. doi:10.1016/j.ejrh.2022.101294
Hayana, D., and Ali, N.-A.-P. (2022). Integrated nonlinear autoregressive neural network and Holt winters exponential smoothing for river streaming flow forecasting at Aswan High. Earth Sci. Inf. 1, 773–786. doi:10.1007/s12145-022-00913-5
Huo, Z., Feng, S., Kang, S., and Dai, X. (2012). Artificial neural network models for reference evapotranspiration in an arid area of northwest China. J. Arid Environ. 82, 81–90. doi:10.1016/j.jaridenv.2012.01.016
Iwakin, O., and Moazeni, F. (2024). Improving urban water demand forecast using conformal prediction-based hybrid machine learning models. J. Water Process Eng. 58, 104721. doi:10.1016/j.jwpe.2023.104721
Javeria, N.-S., Sara, S.-J., and Noor, F. (2023). New waves of flash floods and risks perception of climate chane: an overview of the 2022 flood disaster in Pakistan. Pak. J. Humanit. and Soc. Sci. Res. 2 (6), 72–88. doi:10.37605/pjhssr.v6i2.4
Jin, M.-T., Guo, P., Xu, Q., Ba, Y.-J., and Wang, X. (2024). Measuring and decomposing natural capital use in Xinjiang from a regional-industry perspective. Heliyon 4, e26499. doi:10.1016/j.heliyon.2024.e26499
Jin, T.-Y. (2022). Evolution and prediction of water demand in Hebei Province based on water resource tax reform. China: Hebei GEO University. doi:10.27752/d.cnki.gsjzj.2022.000491
Kong, F.-N., Xia, J.-H., Yang, D.-L., and Lan, T.-S. (2023). Hydro-turbine coordination power predictive method of improved multi-layer neural network considered adaptive anti-normalisation strategy. Elektron. Ir. Elektrotechnika 1, 40–48. doi:10.5755/j02.eie.28599
Li, D.-H. (2021). Ecological water requirement estimation and security risk assessment of vegetation in Xinjiang. China: East China Normal University.
Li, F., Li, Y.-M., Zhou, X.-W., Yin, Z., Liu, T., and Xin, Q.-Q. (2022). Modeling and analyzing supply-demand relationships of water resources in Xinjiang from a perspective of ecosystem services. J. Arid Land 2 (14), 115–138. doi:10.1007/s40333-022-0059-z
Ling, H.-B., Xu, H.-L., Fu, J.-Y., and Xu, X.-W. (2012). Analysis of temporal-spatial variation characteristics of extreme air temperature in Xinjiang, China. Quat. Int. 282, 14–26. doi:10.1016/j.quaint.2012.01.033
Ma, C.-Z. (2023). How oasis agriculture can efficiently save water. Econ. Dly. 9. doi:10.28425/n.cnki.njjrb.2023.007913
Ma, H.-L., Xu, J., and Ma, P.-C. (2014). Water resources utilization in the process of urbanization in China. Resour. Sci. 2.
Ma, X. (2021). Tourism demand forecasting based on grey model and BP neural network. Complexity 2021. doi:10.1155/2021/5528383
Mo, L., Cao, X.-X., Liu, D., Fu, Q., Li, T.-X., and Shang, R.-C. (2022). Sustainable management of agricultural water and land resources under changing climate and socio-economic conditions: a multi-dimensional optimization approach. Agric. Water Manag. 259, 107235. doi:10.1016/j.agwat.2021.107235
Mohamed, K., Abdel, F., Sameh, K.-A. E., Zhang, Z.-H., and Abdel, R.-M.-A.-M. (2023). Exploring the applicability of regression models and artificial neural networks for calculating reference evapotranspiration in arid regions. Sustainability 15 (21), 15494. doi:10.3390/su152115494
Ouyang, Z.-Y., Wan, Y.-L., Zhang, T., and Wu, W.-Z. (2024). A novel grey fractional model based on model averaging for forecasting time series. J. Intelligent and Fuzzy Syst. 46, 6479–6490. doi:10.3233/JIFS-237479
Qin, M.-H., and Liu, X.-L. (2024). Driving factors for changes in sectoral water consumption in the Haihe River Basin. Resour. Sci. 3, 621–634. doi:10.18402/resci.2024.03.14
Regita, P.-P., Amri, M., and Sri, H. (2023). Rainfall forecasting withe an intermittent approach using hybrid exponential smoothing neural network. China: 2023 International Conference on Artificial Intelligence, 18. Blockchain, Cloud Computing, and Data Analytics, 1. doi:10.30598/barekengvol18iss1pp0457-0466
Riziya Aman (2021). Research on the Evaluation of water resources carrying capacity and water quantity development model in Xinjiang. China: Xinjiang University. doi:10.27429/d.cnki.gxjdu.2021.000016
Sang, X.-Y., Lin, Y., Liu, B.-M., and Pan, G.-Y. (2024). Neural network model for identifying water sources based on water level, water temperature, sudden water influx, and water quality. J. Henan Univ. Technol. 43 (5), 36–42. doi:10.16186/j.cnki.1673-9787.2022070002
Shao, Z.-Y., Wu, F.-P., Li, F., Zhao, Y., and Xu, X. (2020). System dynamics model for evaluating socio-economic impacts of different water diversion quantity from transboundary river basins—a case study of Xinjiang. Int. J. Environ. Res. Public Health 23, 9091. doi:10.3390/ijerph17239091
Shen, Y.-J., Yang, J., Shen, Y., Guo, Y., Zhang, Y.-C., Pei, H.-W., et al. (2020). Review of historical and projected future climatic and hydrological changes in mountainous semiarid Xinjiang (northwestern China), central Asia. Catena 187, 104343. doi:10.1016/j.catena.2019.104343
Shi, Y., Yang, S.-P., Zhang, L.-W., Chen, W.-W., Fan, Y.-J., Lu, L., et al. (2024). Forecasting and advancing water carrying capacity in Henan Province in China: application of ‘four determinations with water’ in AHP and SD modeling. Sci. Total Environ. 919, 170757. doi:10.1016/j.scitotenv.2024.170757
Susu, D. (2020). Spatio-temporal pattern of Chinese cities development based on nighttime light data. China: Xinjiang University.
Tal, A. (2021). Israeli agriculture-innovation and advancement in: from food scarcity to surplus, 8. Springer. doi:10.1007/978-981-15-9484-7-9
Tang, C., and Liu, Y. (2023). Role of virtual water trade under the generalized trade framework in xinjiang’s economic sustainable development. Water Econ. Policy 4 (9), 2340013. doi:10.1142/S2382624X23400131
Vadim, K., and Vasiliy, A. (2023). Time-series forecasting of seasonal data using machine learning methods. Algorithms 5, 248. doi:10.3390/a16050248
Wael, E.-M., and Kunio, W. (2014). Modified grey model and its application to groundwater flow analysis with limited hydrogeological data: a case study of the Nubian Sandstone, Kharga Oasis, Egypt. Environ. Monit. Assess. 186, 1063–1081. doi:10.1007/s10661-013-3439-1
Wang, G.-J., and Shao, M.-L. (2021). The development of China’s vaccine industry in the past decade: the perspective from drug regulatory science. Hum. Vaccin Immunother. 12, 5666–5672. doi:10.1080/21645515.2021.2002640
Wang, H., and Wang, B. (2022). High-quality development of farmland water conservancy: key problems and countermeasures. J. Northwest A&F Univ. Soc. Sci. Ed. 4, 35–43. doi:10.13968/j.cnki.1009-9107.2022.04.05
Wang, L., He, Y.-B., You, F., Han, S.-N., Wang, X.-Y., Chen, C.-H., et al. (2024b). Analysis of scale and evaluation method for crop planting suitability evaluation. Chin. J. Agric. Resour. Regional Plan. 45 (9), 214–221.
Wang, L.-M. (2021). Effects of climate change on cotton production in Xinjiang and its adaptation measures. China: Northwest A&F University.
Wang, L.-Z., Ma, J.-Y., Wu, Q.-F., Hu, Y.-C., and Feng, J.-X. (2024a). Plants restoration drives the gobi soil microbial diversity for improving soil quality. Plants 13, 2159. doi:10.3390/plants13152159
Wang, Q., Li, G.-C., Li, X.-Y., Zheng, X.-M., Xu, J., and Xu, Z.-H. (2023). Analysis of water resource supply and demand balance in the northwest Shandong plain based on grey model. J. Nat. Sci. Heilongjiang Univ. 9, 191–199. doi:10.13482/j.issn1001-7011.2023.07.107
Wang, W.-G., Li, H.-Y., Wang, J., and Hao, X.-H. (2020). Water vapor from western eurasia promotes precipitation during the snow season in northern Xinjiang, a typical arid region in central Asia. Water 12, 141. doi:10.3390/w12010141
Wang, Y.-H., Li, S.-E., Cui, Y.-K., Qin, S.-J., Guo, H., Yang, D.-N., et al. (2021). Effect of drip irrigation on soil water balance and water use efficiency of maize in northwest China. Water 217, 217. doi:10.3390/w13020217
Wang, Y.-J., and Yan, Z.-F. (2017). Evolution of water use structure and its driving forces in the Manas River basin, Xinjiang, China. Arid Zone Res. 2, 243–250. doi:10.13866/j.azr.2017.02.01
Weiss, O., Bounds, H.-A., Adesnik, H., and Coen, C.-R. (2023). Modeling the diverse effects of divisive normalization on noise correlations. PLOS Comput. Biol. 11, e1011667. doi:10.1371/journal.pcbi.1011667
Wu, L.-F., Guo, X.-R., and Chen, Y. (2021). Grey relational entropy calculation and fractional prediction of water and economy in the Beijing-Tianjin-Hebei Region. J. Math. 1, 1–16. doi:10.1155/2021/4418260
Wu, M.-H. (2023). Analysis of crop water requirement and planting optimization in typical irrigation areas of Yarkand River, Xinjiang. China: North China Electric Power University.
Xie, W.-B., Chen, T., and Liu, G.-Y. (2018). Decoupling relationship and effect decomposition of agricultural water resources utilization and economic growth in Xinjiang. Sav. Irrig. 4, 69–77.
Xie, W.-L., Wu, W.-Z., Xu, Z.-G., Liu, C.-X., and Zhao, K.-Y. (2023). The fractional neural grey system model and its application. Appl. Math. Model. 121, 43–58. doi:10.1016/j.apm.2023.04.028
Xiong, P., Yang, J., Wei, J.-Y., and Shu, H. (2025). Prediction of provincial digital economy development index based on grey combination forecasting model. Grey Syst. Theory Appl. 15 (1), 62–75. doi:10.1108/gs-04-2024-0051
Xu, Y.-H., Wang, H.-D., and Na, L.-H. (2021). Prediction of agricultural water consumption in 2 regions of China based on fractional-order cumulative discrete grey mode. J. Math. 1, 3023385. doi:10.1155/2021/3023385
Yan, H., and Jia, S.-F. (2022). An assessment of the water resources carrying capacity in Xinjiang. Water 14, 1510. doi:10.3390/w14091510
Yang, J., Zheng, J.-H., Han, Q.-Q., Wang, Z., and Lu, B.-B. (2024). Analysis of sustainable water resource management and driving mechanism in arid region: a case study of Xinjiang, China, from 2005 to 2020. Environ. Sci. Pollut. Res. 31, 15900–15919. doi:10.1007/s11356-024-32092-9
Yang, X., and Mu, Y.-Y. (2022). Agricultural water resources risk and its management focus from the perspective of food security. J. South China Agric. Univ. Sci. Soc. Sci. Ed. 3, 83–94.
Yang, Z., Li, B., Wu, H., Li, M., Fan, J., Chen, M., et al. (2023). Water consumption prediction and influencing factor analysis based on PCA-BP neural network in karst regions: a case study of Guizhou Province. Environ. Sci. Pollut. Res. 12, 33504–33515. doi:10.1007/s11356-022-24604-2
Yao, J.-Q., Chen, Y.-N., Guan, X.-F., Chen, J., Wei, Y.-M., and Mao, W. (2022). Recent climate and hydrological changes in a mountain-basin system in Xinjiang, China. Earth-Science Rev. 226, 103957. doi:10.1016/j.earscirev.2022.103957
Yao, X.-F., Ge, B.-Z., Li, A.-B., Chen, G.-J., Fan, F.-X., Dan, H., et al. (2023). Spatio-temporal variation of PM2.5 pollution in Xinjiang and its causes: the growing importance in air pollution situation in China. Front. Environ. Sci. 2022, 10. doi:10.3389/fenvs.2022.1051610
Zhan, W., Du, D.-L., Ding, J., Zhang, W., Zheng, M.-X., Li, L.-X., et al. (2023). Research on urban safety early warning systems and emergency response mechanisms in snowstorms. Emerg. Manag. Sci. Technol. 3, 10. doi:10.48130/EMST-2023-0010
Zhang, J.-Q., and He, X.-J. (2023). Earthquake magnitude prediction using a VMD-BP neural network model. Nat. Hazards 1, 189–205. doi:10.1007/s11069-023-05856-8
Zhang, P., Long, A.-H., Hai, Y., Deng, X.-Y., Wang, H., Liu, J., et al. (2021). The spatiotemporal variations and the driving forces of agricultural water consumption in Xinjiang (1988 - 2015): Based on the statistical analysis of crop water footprint. J. Glaciol. Geocryol. 1, 242–253. doi:10.7522/j.issn.1000-0240.2018.1058
Zhang, R., Zhang, L.-L., and Hao, L. (2023c). Analysis on spatio-temporal heterogeneity analysis of domestic water use-efficiency in China. Ecol. Econ. 39, 143–147.
Zhang, Y.-L., Long, A.-H., Lv, T.-B., Deng, X.-Y., Wang, Y.-Y., Pang, N., et al. (2023a). Trends, cycles, and spatial distribution of the precipitation, potential evapotranspiration and aridity index in xinjiang, China. China. Water 15, 62. doi:10.3390/w15010062
Zhang, Y.-X. (2021). Research on runoff forecasting under special underlying surface conditions in goaf based on improved BP neural network model. China: Taiyuan University of Technology. doi:10.27352/d.cnki.gylgu.2021.000266
Zhang, Y.-X., Mu, Z.-X., and Tian, X.-J. (2023b). Evaluation of spatial equilibrium of water resources in Xinjiang. Water Resour. Power 8, 56–60. doi:10.20040/j.cnki.1000-7709.2023.20222498
Zhang, Z.-Y. (2023). Research on the coordinated development and driving forces of water energy grain coupling in the arid and semi arid regions of middle and high latitudes in Eurasia. China: Lanzhou University. doi:10.27204/d.cnki.glzhu.2022.002854
Zhe, G., Zhu, T.-T., Jiao, X.-Y., Xu, J.-Z., and Qi, Z.-M. (2021). Neural network soil moisture model for irrigation scheduling. Comput. Electron. Agric. 180, 105801. doi:10.1016/j.compag.2020.105801
Zhen, J., Sun, Y.-J., Wang, F., Zhou, C.-H., Pan, F., Meng, W.-X., et al. (2024). Soil conservation ecosystem service supply-demand and multi scenario simulation in the Loess Plateau, China. Glob. Ecol. Conservation 49, e02796. doi:10.1016/j.gecco.2023.e02796
Zhuang, Q.-W., Wu, S.-X., Luo, G.-P., Yang, Y., Niu, Y.-X., et al. (2020). Changes in oasis and coordination of resource allocation in Xinjiang. Arid. Land Geogr. 5, 1298–1306. doi:10.12118/j.issn.1000-6060.2020.05.15
Keywords: water use, water supply, model comparison, forecasting models, arid area
Citation: Yao Y, Zhang C, Luo G and Lin T (2025) Research on water supply and agricultural water use forecasting in arid regions: a case study of Xinjiang. Front. Environ. Sci. 13:1578528. doi: 10.3389/fenvs.2025.1578528
Received: 18 February 2025; Accepted: 26 March 2025;
Published: 09 April 2025.
Edited by:
Yuan Li, Shaanxi Normal University, ChinaReviewed by:
Zhang Jixiao, University of Science and Technology of China, ChinaDaikui Li, Chinese Research Academy of Environmental Sciences, China
Junjie Yi, University of Groningen, Netherlands
Copyright © 2025 Yao, Zhang, Luo and Lin. This is an open-access article distributed under the terms of the Creative Commons Attribution License (CC BY). The use, distribution or reproduction in other forums is permitted, provided the original author(s) and the copyright owner(s) are credited and that the original publication in this journal is cited, in accordance with accepted academic practice. No use, distribution or reproduction is permitted which does not comply with these terms.
*Correspondence: Chi Zhang, emNAbXMueGpiLmFjLmNu; Geping Luo, bHVvZ3BAbXMueGpiLmFjLmNu