 Mastawal Melese
 Mesfin Anteneh
 Simachew Bantigegn
94% of researchers rate our articles as excellent or good
Learn more about the work of our research integrity team to safeguard the quality of each article we publish.
Find out more
ORIGINAL RESEARCH article
Front. Environ. Sci., 09 April 2025
Sec. Land Use Dynamics
Volume 13 - 2025 | https://doi.org/10.3389/fenvs.2025.1569636
This article is part of the Research TopicNew Insights and Advancement of Land Use Analytics in Modern City DevelopmentView all 4 articles
Introduction: Rapid urbanization alters Land Use Land Cover (LULC) patterns, affecting Land Surface Temperature (LST) and intensifying the Urban Heat Island (UHI) effect. However, few studies have examined the long-term thermal impacts of urban expansion, particularly pre- and post-capital designation effects in rapidly growing cities like Bahir Dar, Ethiopia.
Methods: This study analyzes LULC changes and LST dynamics from 1984 to 2024 using remote sensing and geospatial techniques. Supervised classification with the maximum likelihood algorithm was applied to Landsat imagery to classify LULC into five categories. LST was retrieved from thermal infrared bands and analyzed with the normalized difference vegetation index (NDVI), built-up index (NDBI), and modified normalized difference water index (MNDWI) to assess urban heat variations.
Results: The findings reveal a 366% expansion of built-up areas, along with a 26.8% decline in agricultural land and a 34.2% decrease in wetlands. Before 1994, vegetation and wetlands moderated LST, with an LST-NDVI correlation of −0.069 (1984), which weakened to −0.0549 (2024). The LST-MNDWI correlation dropped from −0.1409 to −0.0588, while LST-NDBI shifted from 0.0831 to 0.0235.
Discussion: These results highlight the need for climate-sensitive urban planning. Expanding green infrastructure, restoring wetlands, and adopting climate-adaptive policies are crucial for managing UHI effects in rapidly urbanizing cities. This study offers insights for policymakers and urban planners to enhance climate resilience in Bahir Dar and similar cities.
In the time of rapid urban development, the world has witnessed a record trend of urbanization. Globally over half the population is urban and projected nearly 70% by 2050 largely driven by developing countries (Dodman et al., 2022; UNECA, 2022). Africa exemplifies this as its population is projected to double by 2050 adding 950 million urban inhabitants (Brenner, 2013; UNECA, 2018). Ethiopia has rapid urbanization rates between 4.1% (CSA, 2018) and 5.4% (World Bank, 2015). Urban population increased from 9.1% to 22.7% over the last 5 decades (World Data Atlas, 2022), with projections reaching 42% by 2050 (Tessema, 2017). These rapid urban growth trends and the resulting land cover changes in developing nations transform rural landscapes into urban areas (Eshetie, 2024; Kindu et al., 2020).
The 2030 projected doubling of global urban land underscores the importance of understanding LULC changes for effective urban planning (Seto et al., 2012). Land use reflects human modifications to the land, while land cover refers to its physical features (Foley et al., 2005). Remote sensing techniques have proven invaluable for tracking LULC transformations in developing cities (Din and Mak, 2021; Saleem et al., 2024), particularly in the absence of consistent in-situ monitoring. These approaches facilitate the assessment of urban sprawl, vegetation loss, and surface temperature variations, all of which impact urban resilience and sustainability.
Urbanization drives LULC changes, replacing vegetation with artificial surfaces, which increases LSTs and intensifies the UHI effect (Balew and Korme, 2020; Fan and Wang, 2020). This UHI effect, characterized by higher urban temperatures compared to rural areas, negatively impacts residents’ wellbeing (Mekonnen et al., 2023; Simwanda et al., 2019). For instance, Saleem et al. (2024) found a strong inverse correlation between NDVI and LST, reinforcing the critical role of green spaces in mitigating urban heat islands. Similarly, Din and Mak (2021) demonstrated that built-up expansion in Hyderabad significantly contributed to land degradation and temperature anomalies.
LST, a critical indicator of surface energy balance, varies with land characteristics and significantly affects climate, air quality, and public health (Meng et al., 2022; Shreevastava et al., 2019). Analyzing LULC and LST changes is thus essential for understanding urban climate impacts, informing sustainable planning, and enhancing urban liveability. Since becoming the regional capital in 1994, Bahir Dar’s population has increased from 54,766 in 1984 to nearly 500,000 by 2020 and is projected to reach 4 million by 2063 (Bahir Dar City Structural Plan Preparation Project Office, 2020; CSA, 1995). This has led to rapid expansion which is transforming Bahir Dar’s LULC, increasing LST and intensifying the UHI (Wubie et al., 2020), thus highlighting the need for adaptive urban planning.
Unlike studies in other Ethiopian cities such as Addis Ababa (Balew and Semaw, 2022), Nekemte and Jimma (Dibaba, 2023), or Jimma alone (Moisa et al., 2022), this study addresses Bahir Dar’s unique environmental context near Lake Tana and the Abay River. Prior LST studies in the city often observed limited indices such as Debebe and Miteku (2023) used the NDVI but overlooked NDBI. Similarly, Balew and Korme (2020) and Getu and Bhat (2024) included NDVI and NDBI but overlooked water/wetland-related indices like the NDWI critical for assessing thermal effects of water/wetlands (Mohiuddin and Mund, 2024).
This study adopts a holistic approach by linking LST to indices measuring vegetation (NDVI), built-up areas (NDBI), and water/wetland characteristics. Higher NDVI values reflect denser vegetation, while elevated NDBI values signal urban growth (Arulbalaji and Gurugnanam, 2014). Instead of the standard NDWI, the modified NDWI (MNDWI) as proposed by Xu (2008) is used for better accuracy in assessing impacts of LULC on water/wetland and LST. This comprehensive focus fills critical gaps in prior LST studies of Bahir Dar’s unique urban environment. Additionally, studies such as Ibrahim et al. (2020) have emphasized the role of land use dynamics in shaping economic and social transformations in emerging cities. Their findings align with the patterns observed in Bahir Dar, where the interplay of rapid urbanization, policy changes, and infrastructural development continues to reshape the city’s landscape. Integrating these perspectives strengthens the relevance of this study within the broader discourse on LULC transformations in rapidly developing cities.
Uniquely, this study investigates the impact of Bahir Dar’s capital designation on LULC and LST changes by comparing before and after capital status. It explores how the city’s regional capital status affects LULC and LST. This has relevance for policymakers since there are growing demands for new regional administrations in Ethiopia. Sidama Region, Southwestern Ethiopia Peoples Region and Central Ethiopia Region with capital were new regions created after 2018 (Ethiopia Peace Observatory, 2024). The study does not position itself on the formation of new regions but recognizes the need to remain sensitive to the following environmental implications. Additionally, it includes the often omitted 2002–2008 period by applying destripping techniques to poor Landsat 7 ETM + data. Using remote sensing data, the study covers Bahir Dar’s transformation from 1984 to 2024, filling a key gap in the literature and offering insights for sustainable urban planning, resilience, and climate change mitigation.
Bahir Dar has its history dating back to the 14th century with the establishment of St Kidane Miheret Church (Appelhans, 2017). It was thus named due to its location close to Lake Tana and Blue Nile. Urbanization started during Italian occupation (1936–1941) and accelerated during the post-liberation (1941–1974) (Seyoum, 2014). The city was declared ANRS capital in 1994 (Haregeweyn et al., 2012). The city is famous for tourist destinations such as Blue Nile Falls and Lake Tana Monasteries, and it has been a UNESCO site of biodiversity since 2015 (Stave et al., 2017). The city’s area is around 230 km2, latitudes 11° 25′11″to 11° 58′11″N and longitudes 37° 2′2″to 37° 42′4″E (Figure 1). It is 567 km away from Addis Ababa. It lies between 1,708 and 2,007 m above sea level. It is flat but has very steep slopes by the River Abay.
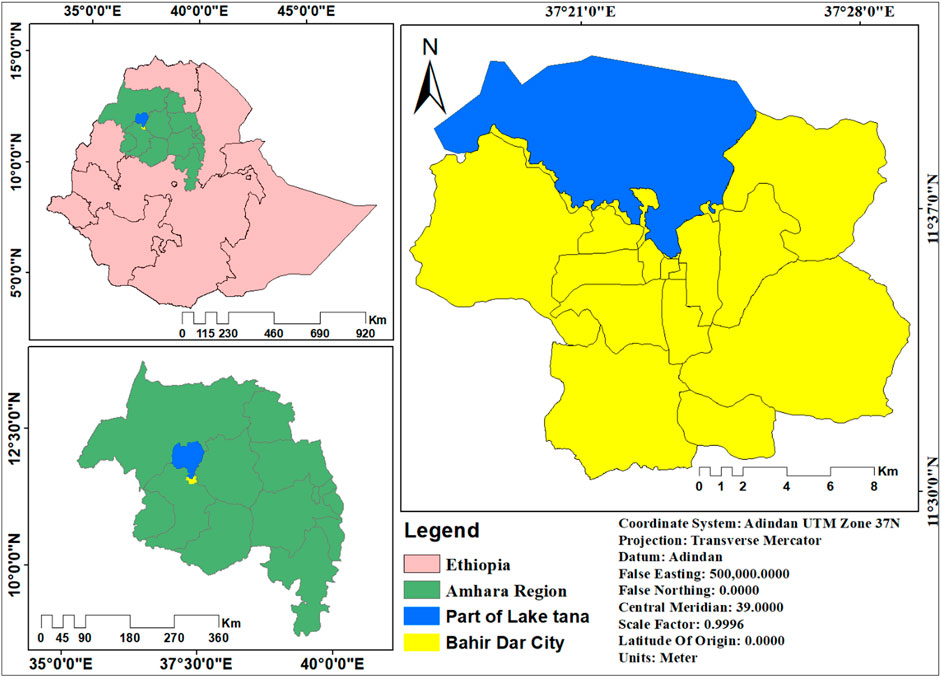
Figure 1. Study area map.
The climate of Bahir Dar features remarkable variability, with daytime temperatures varying from very cold months in January (18.48°C) and February (20.44°C) to very hot months in March (21.83°C) and April (22.06°C) while peaking at 28.55°C. Rainfall is more seasonal and peaks from around June to August with more than 400 mm of rainfall per month, while the rest of the year is frequently dry and proves detrimental to agriculture. The economic activities of horticulture, agro-industrial processing, and tourism, under the aegis of attractions like Lake Tana and the Blue Nile, promote the development of the city (Seyoum, 2014; UNESCO, 2015).
For the span of 40 years between 1984 and 2024, Landsat images obtained from the USGS Earth Explorer database were used to track the changes in land use/land cover (LULC) and the consequent Land Surface Temperature (LST) effects. Landsat images were chosen in consideration of their wide spatial coverage, a resolution of 30 m, and ease of accessibility (Khun et al., 2021; Nayak, 2021). Landsat 5 TM, Landsat 7 ETM+, and Landsat 8 OLI/TIRS images of 1984, 1994, 2004, 2014, and 2024 were selected for their quality and consistency (Table 1), with 10-year intervals based on established LULC analysis practices (Debebe and Miteku, 2023; Gazi et al., 2021; Moisa et al., 2022).
Table 1. Satellite data and bands for LULC and LST analysis.
Preprocessing steps included layer stacking, subsetting, geometric/radiometric correction, and projection onto UTM Zone 37 N (WGS84) were done and images (path 170, row 052) were acquired during the dry season to minimize seasonal variations (Alemayehu et al., 2023; Nega and Balew, 2022). Key indices of NDVI, NDBI, and MNDWI quantified urban expansion and LULC impacts on LST. Demographic data were obtained from CSA, Bahir Dar Revenue Office, and Structural Plan Preparation Project Office, providing context on urbanization pressures. Topographic maps, aerial photos, and GPS-enhanced high-resolution images supported LULC classifications and spatial accuracy. This integrated dataset captures Bahir Dar’s transformation from 1984 to 2024, addressing research gaps through advanced indices and offering insights for sustainable urban planning and climate adaptation.
This study employed a supervised image classification approach using the maximum likelihood classifier (MLC) to accurately identify and map land cover classes over time. The MLC method was chosen due to its statistical robustness in minimizing classification errors by considering class covariance matrices and mean vectors (Teshome et al., 2022; Yesuph and Dagnew, 2019). Five major LULC categories were identified: water bodies, wetlands, vegetation, agricultural land, and built-up areas (Table 2).
Table 2. LULC change categories and their descriptions.
To ensure high classification accuracy, training samples for each land cover class were selected based on prior knowledge, visual interpretation of satellite images, and reference data where available. The classification process was further refined through post-classification corrections, including manual editing and the use of ancillary data such as Google Earth imagery. The accuracy of the classification results was assessed using confusion matrices, overall accuracy, producer’s accuracy, and user’s accuracy, along with kappa statistics to evaluate classification reliability.
To detect and quantify LULC changes, change detection analysis was performed by comparing classified images from different years. This enabled the identification of spatial and temporal trends in land cover transformation. The impact of urban expansion on LST was examined using correlation analysis with the NDVI, NDBI, and MNDWI to assess relationships between LULC changes and surface temperature variations (Figure 2).
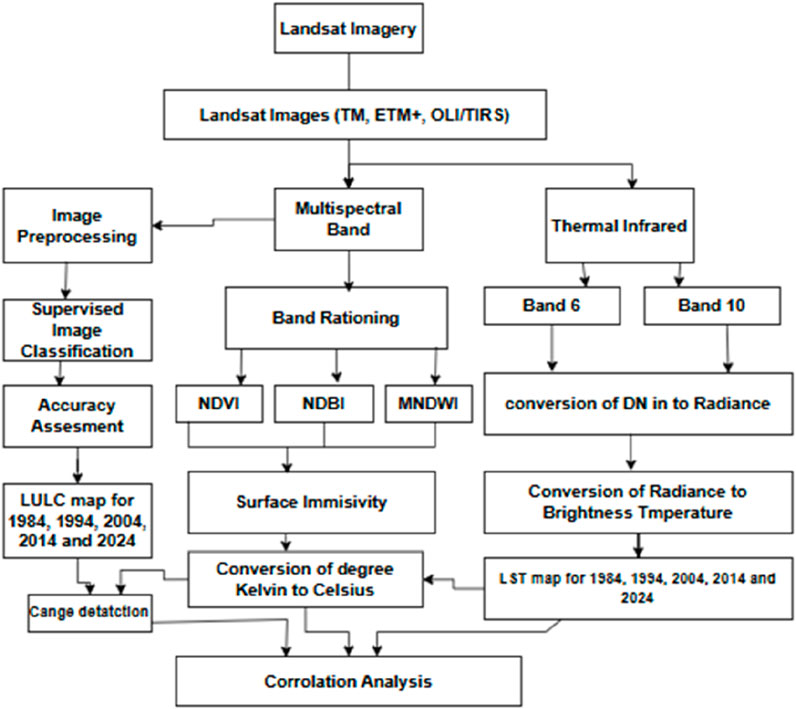
Figure 2. Methodological flow chart of the study.
The spatial and image analyses, including classification and change detection, were conducted using ArcGIS 10.8 and ERDAS Imagine 2015, while statistical analysis and data visualization were performed using SPSS 20 and Microsoft Excel. These tools facilitated the interpretation of land cover transitions and their effects on the thermal landscape of Bahir Dar City.
LST data were extracted from Landsat thermal bands by converting digital numbers into temperature values. Thermal band 10 (Landsat 8) and band 6 (Landsat five and 7) were used (Table 1). LST calculation followed methods by Dibaba (2023), Hassan et al. (2021), Alemayehu et al. (2023), and Debebe and Miteku (2023).
Step I. Conversion of Digital Numbers into Radiance
The first step in LST determination converts digital numbers into at-sensor radiance to calculate brightness temperature for Landsat five and seven images via Equation 1. The digital numbers for TM and ETM + images typically range from 0–255.
where:
For Landsat 8, to calculate the ratio of the digital number to radiance, the TIRS of band 10 was converted to spectral radiance via Equation 2.
where.
Step II. Convert to brightness temperature
The mono-window algorithm calculated LST using land surface emissivity, atmospheric transmissivity, brightness temperature, and average atmospheric temperature (Qin et al., 2001). Band 6 TM and ETM + values were adjusted from spectral radiance to temperature using the Planck function (Chander et al., 2009), Equation 3.
where.
T is the effective satellite temperature in Kelvin, K2 is the calibration constant 2, K1 is the calibration constant 1, Lλ is the spectral radiance in watts/(meter squared
ln: the natural logarithm
It uses the brightness temperatures of band 10 of Landsat eight to compute the mean land surface emissivity and then estimates the LST. The mean value of the land surface emissivity (LSE) of the thermal infrared (TIR) bands is given by Equation 4.
where.
BT is the effective at-sensor brightness temperature (K), K2 is the calibration constant 2 (K), K1 is the calibration constant 1 (W/(m2
Lλ is the spectral radiance at the sensor aperture (W/(m2
ln: the natural logarithm.
Step III. land surface emissivity estimation
The emissivity is calculated via Equation 5.
where
The computed LST is corrected for emissivity via Equation 7.
where.
LST = the land surface temperature (in Kelvin), TB = the radiant surface temperature (in Kelvin), and.
Finally, 273.15 was subtracted from the Landsat TM, ETM+, and OLI/TIRS LST measurements for conversion to degrees Celsius Equation 8.
where °C is the LST in degrees Celsius and K is the LST in Kelvin.
The NDVI was calculated using red and near-infrared bands from Landsat 5, 7, and 8 (Levin, 2000). Specifically, bands three and four for Landsat five and 7, and bands four and five for Landsat 8. Low red reflectance indicates stressed vegetation, while high NIR reflectance shows healthy vegetation (Nega and Balew, 2022; Pandey et al., 2024a). NDVI reduces LST and mitigates UHIs (Mekonnen et al., 2023), calculated using via Equation 9.
Gazi et al. (2021) suggested that Landsat five and seven multispectral bands be computed from bands four and five and that Landsat eight multispectral bands from bands 5 and 6 be computed to calculate the NDBI. Isioye et al. (2020) described this method as achieving 92% accuracy in mapping densely populated areas. The NDBI is calculated via Equation 10.
where NDBI is the normalized difference built-up index, MIR is the middle infrared, and NIR is the near-infrared.
In addition, the MNDWI is calculated to more accurately identify and monitor water bodies and wetlands, which are key in moderating local temperatures and influencing LST (Xu, 2008). The MNDWI uses the green and shortwave infrared (SWIR) bands of Landsat imagery, specifically bands two and five for Landsat five and seven and bands three and six for Landsat 8. The MNDWI is calculated via Equation 11.
where MNDWI is the modified normalized difference water index, Green represents the green band, and SWIR is the shortwave infrared band. These indices (NDVI, NDBI and MNDWI) provide a more refined analysis of vegetation, urban and wetland/water body features, which are essential for accurately assessing LST variations.
Correlation analysis quantified the relationships between LST and NDVI, NDBI, and MNDWI using Equation 12.
Here, LST represents land surface temperature (dependent variable), while NDVI, NDBI, and MNDWI (independent variables) denote vegetation cover, built-up areas, and water bodies/wetlands, respectively. β0 is the intercept, β1, β2, and β3 are the coefficients, and ϵ is the error term. This model highlights how NDVI, NDBI, and MNDWI variations influence LST, offering insights into the environmental effects of urban expansion and changes in vegetation and water bodies.
An accuracy assessment was conducted to evaluate the precision of the classified land cover maps and LST retrievals. This assessment involved comparing the classified images with ground truth data or higher-resolution imagery to determine classification accuracy and error rates. The ground truth data were obtained through Google Earth, field visits, and historical records. High-resolution Google Earth images, Bahir Dar city master plans, and aerial photos served as reference data for land-use classification during the accuracy assessment of the supervised classification. To quantify classification accuracy, statistical metrics including user accuracy, producer accuracy, overall accuracy, and kappa statistics were employed. These metrics provide a comprehensive evaluation of classification reliability and agreement with reference data.
LULC maps for Bahir Dar city were created for 1984, 1994, 2004, 2014, and 2024. Map accuracy was assessed using user accuracy, producer accuracy, overall accuracy, and kappa statistics, reflecting classification reliability. Overall accuracies were 88.32%, 89.67%, 91.15%, 92.58%, and 93.76%, with kappa values of 0.87, 0.89, 0.91, 0.92, and 0.94, indicating strong reliability (Foody, 2020). The 40-year analysis revealed substantial LULC changes, especially after Bahir Dar became the ANRS capital in 1994 (Figure 3). Urbanization, economic growth, and population increases replaced natural and agricultural areas with built-up surfaces, consistent with global urbanization trends in developing regions (Nato et al., 2023).
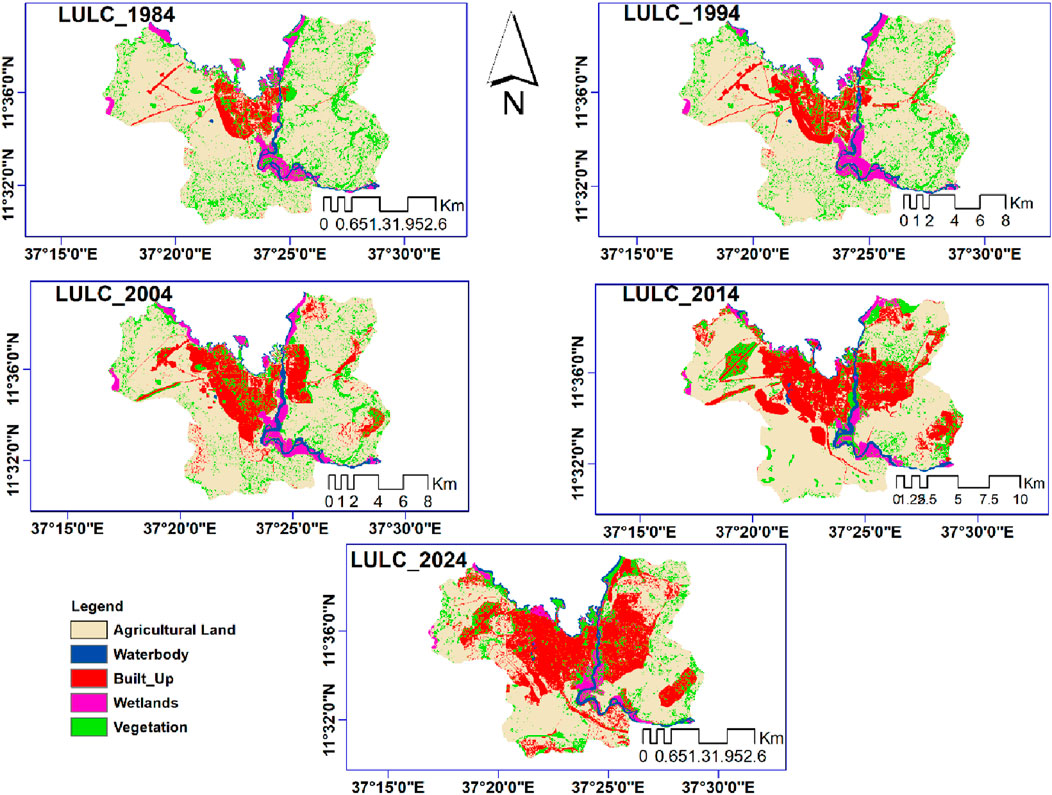
Figure 3. LULC maps for the years 1984, 1994, 2004, 2014, and 2024 of Bahir Dar city.
The area of water bodies in Bahir Dar showed a declining trend over the study period. In 1984, water bodies covered 2.71%, decreasing to 2.70% in 1994, 2.66% in 2004, 2.63% in 2014, and 2.29% in 2024 (Table 3). These changes reflect urban encroachment, sedimentation, and partial drying due to land use changes and urban pressures linked to Bahir Dar’s growth as the regional capital. Similar trends are observed in cities like Addis Ababa and Kampala, where informal settlements and urban sprawl have reduced water body coverage (Birhanu et al., 2023; Richmond et al., 2018).
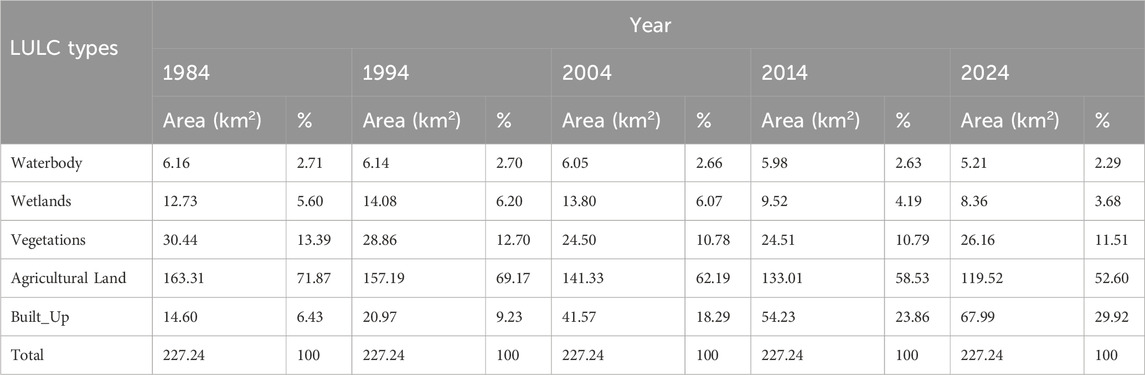
Table 3. LULC distributions and corresponding areas.
Wetland areas expanded from 5.60% in 1984 to 6.20% in 1994, likely due to improved management or natural hydrological changes. However, they declined to 6.07% in 2004, 4.19% in 2014, and 3.68% in 2024, reflecting urban development pressures, especially after 1994, as wetlands were converted into residential, agricultural, or industrial zones. This degradation, consistent with findings in Nairobi (Guto, 2021), compromises critical ecosystem services like flood regulation, biodiversity, and water filtration, raising concerns about urban resilience. Wetlands, often termed “nature’s kidneys,” play a vital role in maintaining ecological balance.
Vegetation declined from 13.39% in 1984 to 11.51% in 2024, with a decrease to 10.78% by 2004, slight recovery to 10.79% in 2014, and modest growth by 2024, possibly due to localized conservation efforts. The long-term decline reflects urban expansion pressures, similar to patterns in Lagos and Kigali, where urban growth led to deforestation and shrinking green spaces (Adegun, 2017; Xueqin et al., 2022). Alves and Lopes (2017) noted that vegetation loss exacerbates the UHI effect by reducing shade and evapotranspiration, intensifying urban temperature increases.
Agricultural land, the dominant land use, declined from 71.87% in 1984 to 52.60% in 2024, reflecting urban sprawl and shifting land use priorities. The conversion of farmland into residential and commercial areas impacts food security, rural livelihoods, and hydrological cycles, similar to trends observed in Lagos, Nigeria, and Harar, Ethiopia (Dekolo et al., 2015; Worseme, 2004). Built-up areas expanded significantly from 6.43% in 1984 to 29.92% in 2024, a 366% increase, driven by Bahir Dar’s urban growth and regional capital status post-1994. Similar trends are seen in cities like Hawassa, where administrative importance accelerates urbanization (Molla et al., 2024). This growth impacts the environment, increasing runoff, reducing groundwater recharge, and intensifying UHI effects.
During the precapital period (1984–1994), LULC patterns were relatively stable due to slower urbanization and modest population growth, with population increasing from 54,766 in 1984 to 96,140 in 1994 (CSA, 1984; 1995). Wetlands increased from 5.60% to 6.20%, built-up areas grew from 6.43% to 9.23%, and agricultural land slightly decreased from 71.87% to 69.17%. Water bodies and vegetation showed minimal declines, from 2.71% to 2.70% and 13.39%–12.70%, respectively, reflecting limited land conversion. In the postcapital period (1994–2024), rapid urbanization and population growth, i.e., from 96,140 in 1994 to ∼500,000 by 2020 (Bahir Dar City Structural Plan Preparation Project Office, 2020) drove significant LULC changes. Built-up areas surged from 9.23% to 29.92% (+224%), while agricultural land declined from 69.17% to 52.60%. Wetlands shrank from 6.20% to 3.68%, water bodies from 2.70% to 2.29%, and vegetation from 12.70% to 11.51%, reflecting the loss of natural landscapes to urban expansion (Figure 3).
The rapid urbanization during the postcapital period mirrors trends in other administrative capitals, like Dodoma, Tanzania, where urban growth reshaped land use (Miringay et al., 2024). This underscores the need for sustainable urban planning in Bahir Dar. Strategies like wetland protection, green space restoration, and climate-sensitive urban design are vital to mitigate UHI effects and preserve ecological functions. Cities like Curitiba, Brazil, demonstrate how integrated planning can balance development with conservation (Corbella et al., 2011; Rabinovitch, 1992). Proactive policies prioritizing resilience, inclusiveness, and sustainability are essential for Bahir Dar’s ecological and urban future.
Over 4 decades, Bahir Dar’s LST showed a significant rise in mean and maximum temperatures, driven by urbanization and land use changes. In 1984, the mean LST was 28.22°C, with a maximum of 35.25°C (Table 4), reflecting moderate thermal conditions due to dominant vegetated and agricultural land. By 1994, the mean LST rose to 28.81°C, with a maximum of 36.44°C, coinciding with Bahir Dar’s designation as the regional capital. This marked the start of infrastructure development, including roads, government offices, and housing (Figure 4). Similar trends are seen globally, such as in Kali, Rwanda, where early urbanization phases led to a 2°C rise in surface temperatures due to infrastructure expansion (Safari et al., 2024).
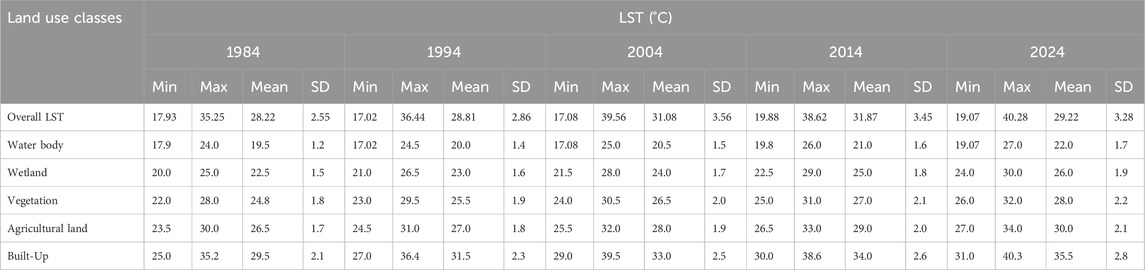
Table 4. Statistical summary of overall LST & LST across land use classes in Bahir Dar city (1984–2024).
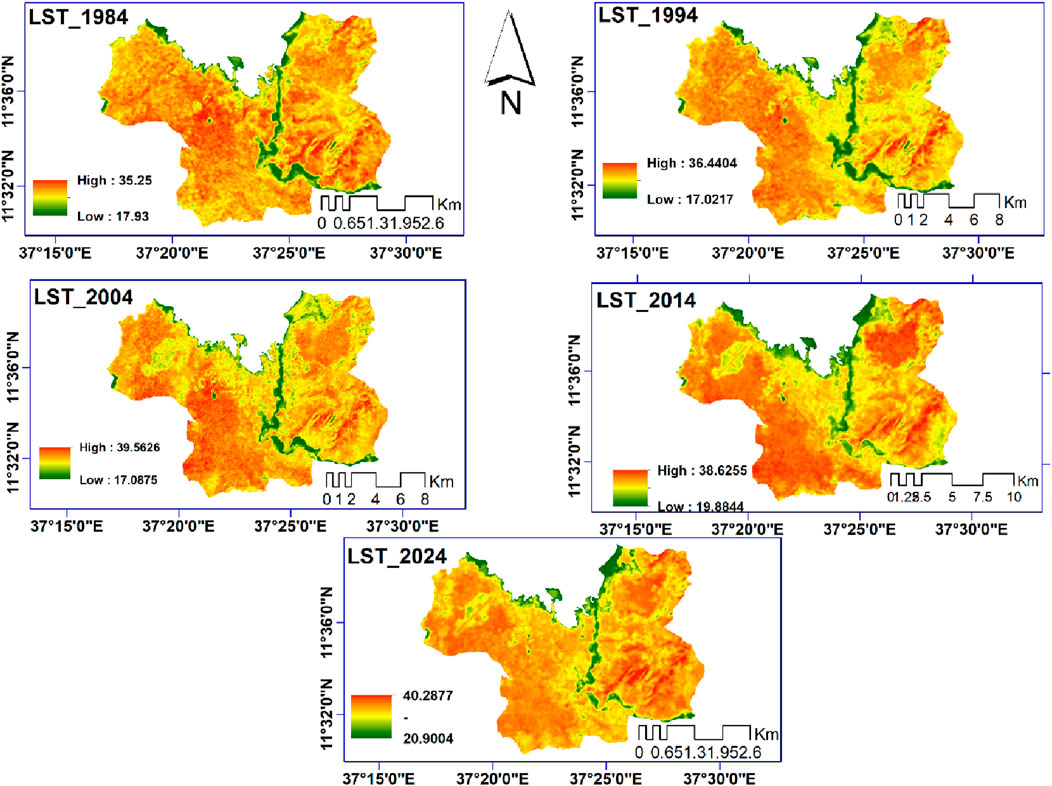
Figure 4. LST maps for the years 1984, 1994, 2004, 2014 and 2024 of Bahir Dar city.
Between 1994 and 2004, the mean LST rose sharply to 31.08°C, with a maximum of 39.56°C, marking a 2.27°C increase. Similar trends occurred in Accra, Ghana, where rapid urbanization replaced vegetation with impervious surfaces, driving temperature rises (Addae and Oppelt, 2019). These patterns highlight urbanization’s universal impact on surface temperatures, especially in Sub-Saharan Africa, where urban planning often lags behind development. Sustainable planning and green space integration are crucial to mitigate temperature increases from land-use changes.
By 2014, the mean LST increased slightly to 31.87°C, with the maximum temperature decreasing marginally to 38.62°C, likely due to small-scale greening efforts. However, these were insufficient to counteract urban heat effects, as seen in Addis Ababa (Terfa et al., 2020). By 2024, the mean LST decreased to 29.22°C, suggesting urban planning or green space improvements, but the maximum temperature reached 40.28°C, highlighting persistent extreme heat. This mirrors trends in cities like Lagos, where greening alleviated some heat but could not reduce peak temperatures due to impervious surfaces (Adelekan, 2020). These findings suggest that while greening can mitigate average temperatures, the broader challenge of managing extreme urban heat remains.
The thermal environment of Bahir Dar city changed significantly over 40 years, influenced by urbanization and LST dynamics. During the precapital period (1984–1994), the mean LST rose modestly from 28.22°C to 28.81°C (+0.59°C), reflecting the cooling effects of dominant natural landscapes like agriculture, vegetation, and wetlands. The minimum temperature slightly decreased from 17.93°C to 17.02°C, while the maximum LST increased moderately from 35.25°C to 36.44°C, indicating localized heat intensification. The LST standard deviation grew from 2.55°C to 2.86°C, suggesting increasing thermal variability as urban expansion began affecting land cover.
During the postcapital period (1994–2024), the mean LST rose significantly from 28.81°C to 31.87°C in 2014, before dropping slightly to 29.22°C in 2024, averaging a 0.41°C rise per decade. This increase aligns with built-up areas expanding from 20.97 km2 (9.23%) in 1994 to 67.99 km2 (29.92%) in 2024. The maximum LST surged to 40.28°C in 2024, driven by impervious surfaces, while the minimum LST fluctuated, peaking at 19.88°C in 2014 and declining to 19.07°C in 2024. Thermal variability (SD) peaked at 3.56°C in 2004 due to rapid land use changes but declined to 3.28°C by 2024, reflecting reduced variability as urbanization homogenized the thermal landscape. The postcapital LST surge aligns with studies in rapidly urbanizing cities like Mekelle, Ethiopia, and Hyderabad, India, where urban growth has driven surface temperature increases due to impervious surfaces and vegetation loss (Suthar et al., 2024; Tesfamariam et al., 2023). This highlights urbanization’s role in amplifying the UHI effect, affecting liveability, energy demand, and ecosystems.
The findings highlight the urgent need for climate-sensitive urban planning in Bahir Dar. Strategies such as green infrastructure, wetland restoration, increased vegetation, and energy-efficient building designs can mitigate the UHI effect. As Zhao et al. (2014) suggested, prioritizing green corridors and adaptive measures enhances urban resilience. The slight mean LST decrease from 2014 to 2024 suggests potential for effective mitigation strategies. These results contribute to understanding urban climate dynamics in Sub-Saharan Africa, where rapid, unplanned urbanization is common (Saghir and Santoro, 2018). Lessons from Bahir Dar stress the importance of balancing urban growth with environmental sustainability, offering insights for other emerging cities.
The LST analysis for Bahir Dar (1984–2024) reveals significant warming, driven by urbanization and land conversion. The UHI effect has intensified as built-up areas expand, degrading natural covers like vegetation, wetlands, and water bodies. Water bodies, typically cooling features, saw LST rise from 19.5°C in 1984°C to 22.0°C in 2024 (Table 4). This modest but concerning increase reflects urbanization’s impact on their microclimate-regulating role. Wetlands in Bahir Dar experienced a 3.5°C LST rise, highlighting their vulnerability to urban pressures. Similar trends globally and in Ethiopian cities like Addis Ababa, Adama, and Hawassa show wetland loss exacerbates the UHI effect, diminishing ecosystem services such as carbon sequestration, water filtration, and biodiversity support (Guto, 2021; Terfa et al., 2019). The warming of wetlands and water bodies underscores the need for urban planning to prioritize their conservation and restoration to mitigate temperature increases.
The mean LST in vegetated areas rose by 3.2°C from 1984 to 2024, with the sharpest increase after 1994 (Figure 5) due to accelerated urbanization and vegetation loss, which reduced cooling from evapotranspiration and shading. Temporary stabilization between 2004 and 2014 likely resulted from localized greening efforts, though insufficient to offset urban sprawl. Agricultural lands also saw a 3.5°C LST rise, driven by peri-urban farmland conversion to built-up areas, intensifying the UHI effect and threatening food security by reducing arable land (Belete, 2022). Built-up areas showed the highest LST values, with a 6°C increase from 1984 to 2024, reaching a maximum of 40.3°C by 2024, highlighting the UHI effect in Bahir Dar (Figure 5). Similar global studies link urbanization to rising temperatures due to impervious surfaces like roads and buildings (Chapman et al., 2017; Kowe et al., 2022). The rapid LST rise underscores the need for sustainable urban planning, including green infrastructure, to mitigate the UHI effect and enhance urban livability.
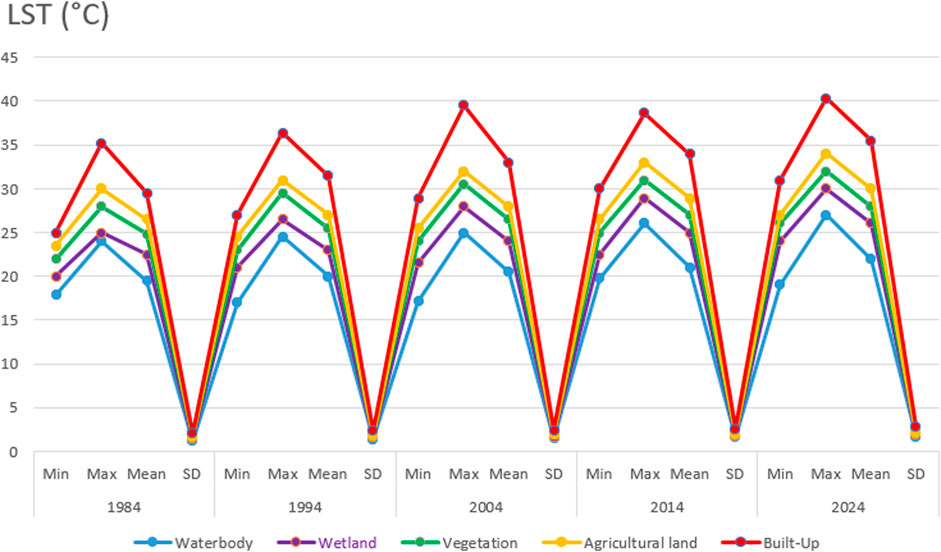
Figure 5. LST across land use classes in Bahir Dar city (1984–2024).
The findings from Bahir Dar align with studies in Shanghai, Beijing, and Addis Ababa, where urbanization has significantly increased LST and exacerbated the UHI effect (Terfa et al., 2019; Wang and Xu, 2021). These trends highlight the need for effective urban governance, with Xueqin et al. (2022) recommending strategies such as integrating green spaces, protecting water bodies, and restoring wetlands to mitigate the UHI effect and enhance climate resilience.
LST in Bahir Dar city rose significantly between 1984 and 2024, driven by urban expansion following its 1994 designation as a regional capital. From 1994 to 2024, built-up areas saw a 4.0°C increase in mean LST, exceeding the 2.0°C rise from 1984 to 1994 (Table 5). This warming, linked to impervious surfaces like asphalt and concrete, intensified the UHI effect. Similar trends in cities like New Delhi and Nairobi (Scott et al., 2017; Srivastava and Satyaprakash, 2020) highlight urbanization’s role in rising temperatures, emphasizing the impact of urban growth and infrastructure on LST.
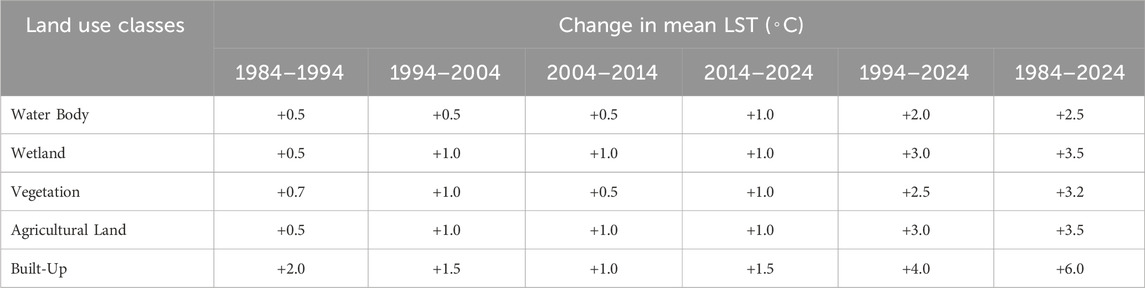
Table 5. Mean land surface temperature changes before and after 1994 (°C).
Water bodies saw a modest LST rise of +2.5°C (1984–2024), with a notable +1.0°C increase in the last decade (2014–2024) due to encroachment and reduced vegetative buffers (Table5). Similar urbanization impacts were observed in the Yangtze River Delta (Sun et al., 2024). Wetlands experienced a +3.5°C rise, increasing steadily by +1.0°C per decade after 1994, driven by drainage and urban development, reducing their cooling via evapotranspiration. This mirrors trends in cities like Beijing, where wetland loss intensifies the UHI effect (Tian et al., 2021). Agricultural land showed a +3.5°C rise, with significant warming post-1994, reflecting its conversion to heat-retaining urban areas.
Vegetation areas in Bahir Dar city saw a +3.2°C LST rise (1984–2024), with the sharpest increase between 1994 and 2024, driven by deforestation and urbanization following its 1994 regional capital designation. The loss of vegetation in urban areas has significantly elevated temperatures, a trend also observed in Addis Ababa. Rapid urban growth, particularly at urban fringes, has intensified the UHI effect by reducing vegetation, as noted by Deribew and Dalacho (2019). nLST changes before and after Bahir Dar’s 1994 capital designation reveal urbanization’s impact on its thermal environment. Pre-1994, LST increases were modest, with natural land covers like wetlands and vegetation dominating. Post-1994, rapid urban expansion caused significant LST rises across all land-use categories, especially in built-up areas (see Figure 5).
Bahir Dar’s LST changes reveal urban expansion as a key driver of rising temperatures, with built-up areas warming and natural land covers degrading. Similar trends are seen globally and in Ethiopian cities like Addis Ababa and Mekelle, where urban growth has intensified the UHI effect (Duan et al., 2021; Hagos, 2023; Hailu et al., 2024b). Sustainable strategies, such as urban greenery, green roofs, permeable surfaces, and wetland restoration, as in Singapore (Wong et al., 2021), are essential to mitigate warming. Integrating climate adaptation into urban planning is crucial for Bahir Dar’s environmental sustainability and climate resilience.
The NDVI analysis shows a sharp decline in Bahir Dar’s vegetation, particularly after 1994. In 1984, the mean NDVI was 0.16, indicating moderate vegetation (Table 6). By 1994, it dropped to 0.14, signaling early urbanization. Between 1994 and 2004, urbanization led to a steep decline to −0.19, with minimal recovery by 2024 (0.19) despite some greening efforts (Figure 6). This trend mirrors other cities like Dhaka (Rahman et al., 2022) and Addis Ababa (Moisa and Gemeda, 2021), where urbanization has caused significant vegetation loss, intensifying the UHI effect and threatening climate stability and biodiversity. Pandey et al. (2024b) also indicated LST and its influential factors are dynamically changing within Imphal which sterengthens the current results.
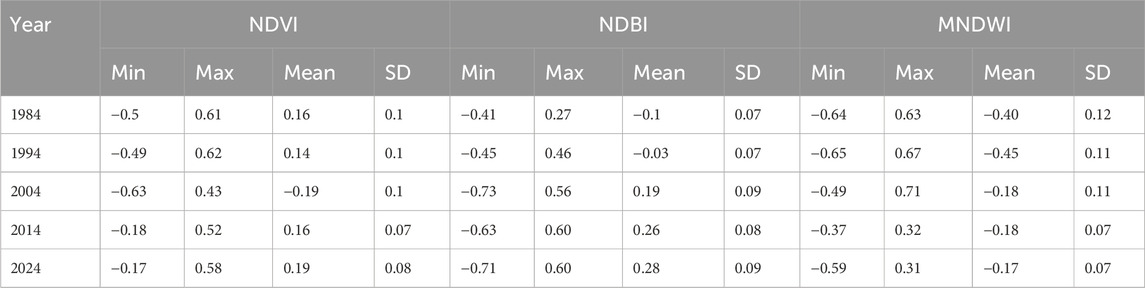
Table 6. Summary of land use indices in Bahir Dar city for the years 1984, 1994, 2004, 2014 and 2024.
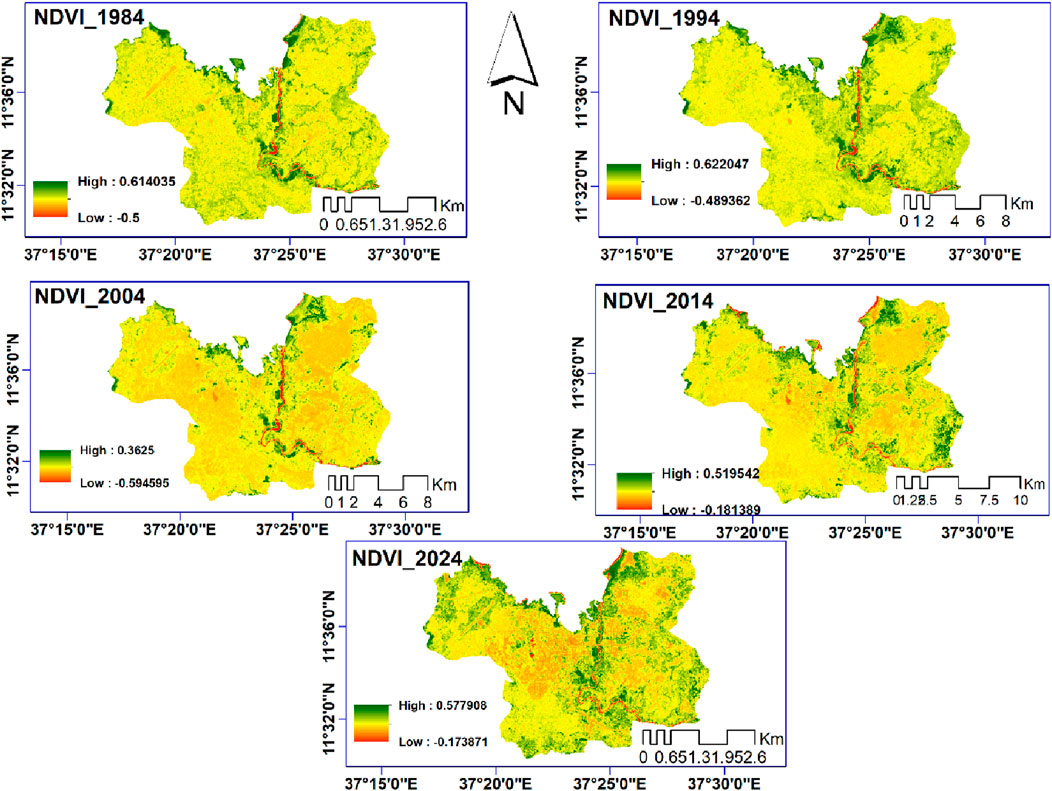
Figure 6. NDVI maps of Bahir Dar city for 1984, 1994, 2004, 2014 and 2024.
The minimal increase in the NDVI values in 2014 and 2024 suggests the potential for urban greening initiatives to mitigate some environmental damage. However, the results highlight the need for comprehensive vegetation conservation strategies to preserve the ecological benefits of green spaces in continued urban growth.
NDBI values show consistent growth in Bahir Dar’s built-up areas, especially after 1994. In 1984, the mean NDBI was −0.10, rising to −0.03 in 1994 (Table 6) as urbanization began. By 2004, the mean reached 0.19, signaling rapid expansion, and by 2024, it stabilized at 0.28, indicating that built-up areas were nearing capacity (Figure 7). This pattern mirrors global trends like in Cairo (Salem and Tsurusaki, 2024), where urbanization converted agricultural land, increasing NDBI values. The growth of impervious surfaces in Bahir Dar has worsened the UHI effect and reduced groundwater recharge (Youssef et al., 2020). The 2024 NDBI stabilization suggests a potential limit to urban development, reflecting challenges in managing population growth and infrastructure.
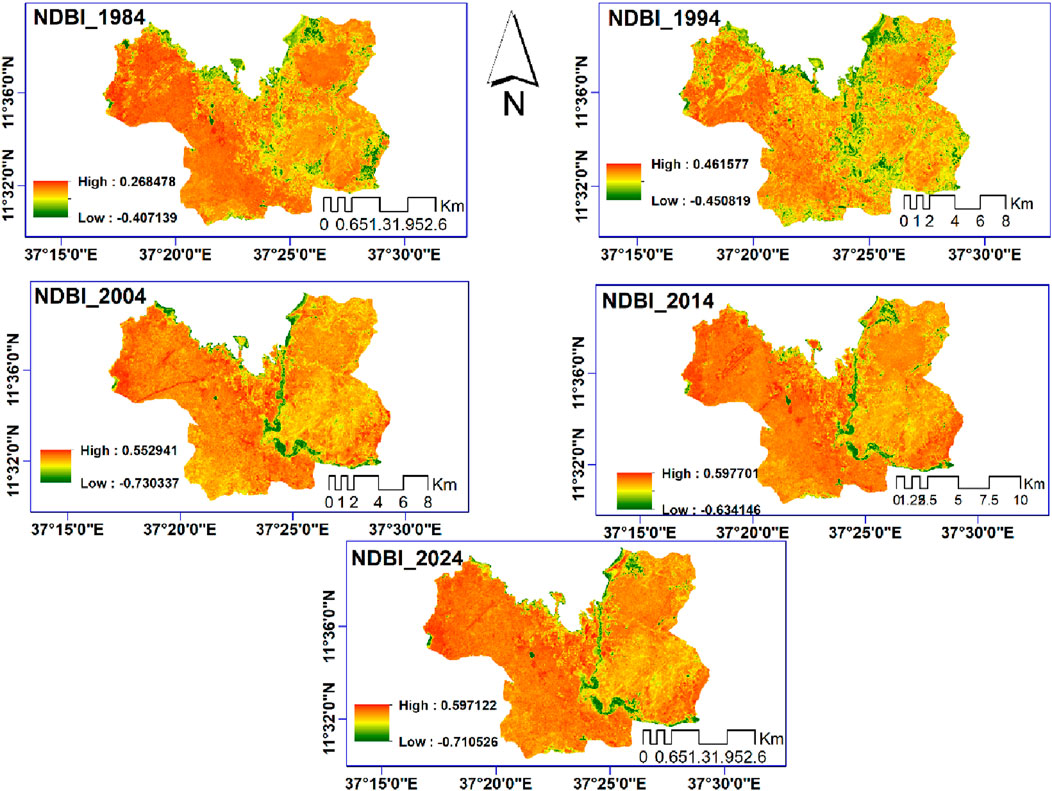
Figure 7. NDBI maps of Bahir Dar city for 1984, 1994, 2004, 2014 and 2024.
MNDWI values reveal the shrinking visibility of water and wetlands due to urbanization. In 1984, the mean MNDWI was −0.40, indicating well-preserved water resources. By 1994, it declined to −0.45 as urban encroachment began (Figure 8). A temporary rise between 2004 and 2014 may reflect seasonal factors or improved water management. By 2024, the MNDWI slightly improved to −0.17, showing ongoing reductions in water and wetland areas as urbanization progressed. The decline in MNDWI mirrors global trends, where urbanization depletes water resources. In cities like Mumbai and Beijing, urban growth has reduced water bodies’ size and quality (Shiva Shankar et al., 2021; Zhang et al., 2017). Similarly, in Addis Ababa, urbanization has degraded wetlands and water bodies (Hailu et al., 2024a). In Bahir Dar, this decline threatens biodiversity and exacerbates the UHI effect.
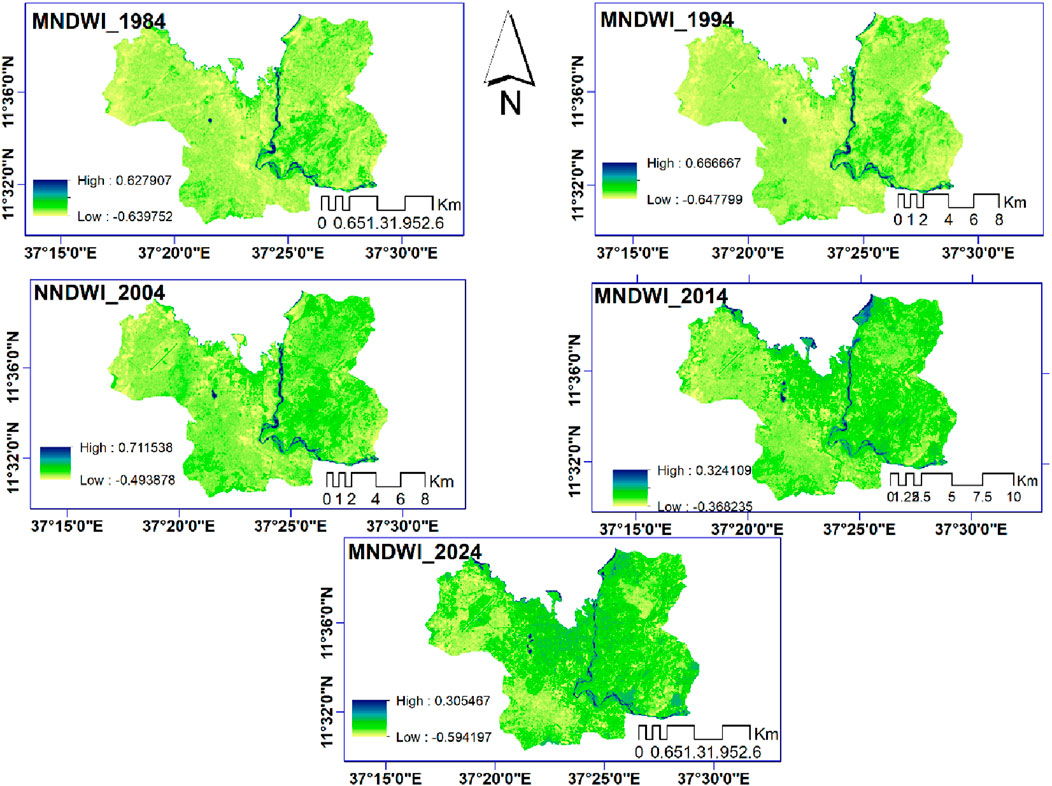
Figure 8. MNDWI maps of Bahir Dar city for 1984, 1994, 2004, 2014 and 2024.
Bahir Dar’s designation as the regional capital in 1994 accelerated urbanization, causing significant declines in vegetation, wetlands, and water resources, as shown by NDVI, NDBI, and MNDWI trends (Figures 6–8). This pattern aligns with global examples where capital city status drives urban growth and environmental degradation (Wayne et al., 2020). However, cities like Curitiba, Brazil, demonstrate that robust urban planning with green spaces and water management can ensure sustainable growth (Zingoni de Baro, 2022). Bahir Dar could adopt similar strategies to balance development and environmental preservation.
The analysis of LST and land use indices (NDVI, NDBI, MNDWI) reveals urbanization’s thermal impacts on Bahir Dar. The strong negative correlation between LST and NDVI in 1984 (slope = −0.069, R2 = 0.9902) (Figure 9), highlights vegetation’s cooling role. As urbanization intensified, this effect weakened, with slopes of −0.0448 (2014) and −0.0549 (2024), reflecting green space loss. Similar trends were observed in Beijing (Wang and Xu, 2021) and Addis Ababa (Deribew and Dalacho, 2019). These findings stress the need for urban planning that prioritizes green infrastructure to counteract the UHI effect.
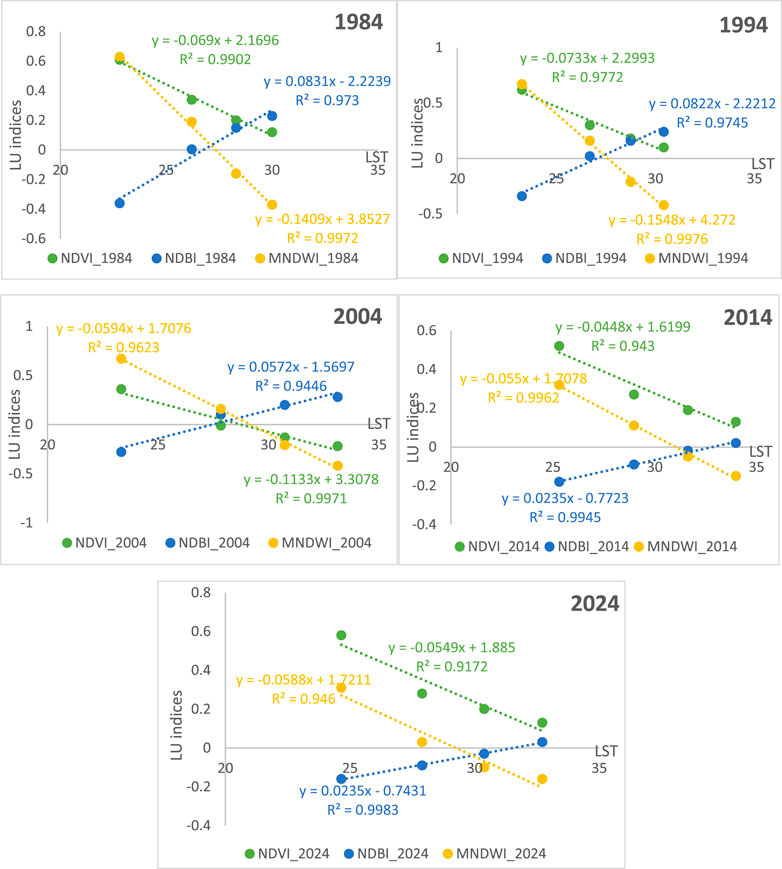
Figure 9. Correlations between LST and land use indices.
The positive correlation between LST and NDBI highlights built-up areas’ role in intensifying urban heat. In 1984, the correlation (slope = 0.0831, R2 = 0.973) reflected the early impact of impervious surfaces, which grew significantly by 2024 (slope = 0.0235, R2 = 0.9983) due to rapid urbanization after Bahir Dar became a regional capital in 1994. Similar trends are observed in Bangalore, India (Sussman et al., 2019). This underscores the need for climate-responsive urban planning, including green roofs, urban parks, and reduced impervious surfaces to mitigate the UHI effect.
The analysis revealed a negative correlation between LST and MNDWI, highlighting the cooling effects of water bodies and wetlands. In 1984, the strong correlation (slope = −0.1409, R2 = 0.9972) emphasized water resources’ role in temperature regulation, but by 2024, this had weakened (slope = −0.0588, R2 = 0.946) due to urban encroachment. Similar trends in Cairo (Abutaleb et al., 2019), and Jimma (Berkessa et al., 2023) show wetland loss exacerbating the UHI effect.
This study underscores how urbanization has weakened the cooling effects of vegetation, wetlands, and water bodies while increasing LST through built-up areas. Similar global trends in Delhi (Srivastava and Satyaprakash, 2020) and Lagos (Jiang et al., 2021) highlight the need for green spaces, water conservation, and sustainable infrastructure in urban planning. For Bahir Dar, policy actions like reforestation, wetland conservation, and climate-sensitive designs are essential to address thermal challenges from rapid urban growth.
This study analyzed the impacts of LULC changes on LST in Bahir Dar over 40 years focusing on its designation as a regional capital in 1994. Rapid urbanization and population growth have driven significant LULC changes, resulting in environmental and thermal impacts. Built-up areas expanded by 366%, from 14.60 km2 to 67.99 km2, at the cost of agricultural land (−43.79 km2), vegetation (−4.28 km2), and wetlands (−4.37 km2). This land conversion intensified the UHI effect, with built-up areas experiencing a 6.0°C increase in mean LST, while the loss of vegetation, wetlands, and water bodies reduced their cooling capacity.
Before 1994, Bahir Dar’s stable thermal conditions were supported by natural land cover. Post-1994, rapid urbanization led to significant LST increases and the expansion of high-LST zones, underscoring the thermal consequences of urban growth. Negative correlations between LST and NDVI/MNDWI reaffirm the cooling effects of vegetation and water, while the positive correlation with NDBI highlights built-up areas as key contributors to surface warming.
The study underscores the urgent need for sustainable urban planning. Strategies such as reforestation, wetland conservation, urban greening (e.g., tree planting, green roofs), and the use of permeable surfaces can mitigate urban heat while supporting biodiversity. Policies to protect agricultural land and balance development with ecological sustainability are also crucial. Generally, Bahir Dar’s urbanization has drastically altered its LULC and thermal landscape. Policymakers must prioritize sustainable, climate-resilient planning to mitigate urban heat, enhance liveability, and build a sustainable future. Future studies should incorporate socioeconomic and policy variables to provide a comprehensive understanding of urban thermal dynamics.
This study provides valuable insights into the long-term impacts of LULC changes on LST in Bahir Dar City. However, some limitations should be acknowledged. The study does not fully account for socio-economic factors, such as population density and energy consumption, which can influence urban heat dynamics. Future research should incorporate climate modeling and socio-economic data to provide a more comprehensive understanding of the drivers of urban heat. Comparative studies across multiple cities can also help generalize the findings and offer broader policy recommendations for climate-resilient urban planning.
The raw data supporting the conclusions of this article will be made available by the authors, without undue reservation.
MM: Conceptualization, Formal Analysis, Methodology, Writing–original draft. MA: Supervision, Writing – review and editing. SB: Supervision, Writing – review and editing.
The author(s) declare that no financial support was received for the research and/or publication of this article.
The authors declare that the research was conducted in the absence of any commercial or financial relationships that could be construed as a potential conflict of interest.
The author(s) declare that no Generative AI was used in the creation of this manuscript.
All claims expressed in this article are solely those of the authors and do not necessarily represent those of their affiliated organizations, or those of the publisher, the editors and the reviewers. Any product that may be evaluated in this article, or claim that may be made by its manufacturer, is not guaranteed or endorsed by the publisher.
Abutaleb, K., Ngie, A., Darwish, A., Ahmed, M., Arafat, S., Ahmed, F., et al. (2019). Assessment of urban heat island using remotely sensed imagery over greater Cairo, Egypt. Adv. Remote Sens. 4 (1), 35–47. doi:10.4236/ARS.2015.41004
Addae, B., and Oppelt, N. (2019). Land-use/land-cover change analysis and urban growth modelling in the greater Accra metropolitan area (GAMA), Ghana. Urban Sci. 3 (1), 26. doi:10.3390/urbansci3010026
Adegun, O. B. (2017). Green infrastructure in relation to informal urban settlements. J. Archit. Urbanism 41 (1), 22–33. doi:10.3846/20297955.2017.1296791
Adelekan, I. O. (2020). Vulnerability of poor urban coastal communities to flooding in Lagos, Nigeria. Environ. Urbanization 22 (2), 433–450. doi:10.1177/0956247810380141
Alemayehu, Z. Y., Minale, A. S., and Legesse, S. A. (2023). Land-use and land-cover dynamics nexus to local climate variability in Suha watershed, upper Blue Nile basin, Northwest Ethiopia. Sustain. Environ. 9 (1). doi:10.1080/27658511.2023.2278828
Alves, E. D. L., and Lopes, A. (2017). The urban heat island effect and the role of vegetation to address the negative impacts of local climate changes in a small Brazilian city. Atmosphere, 8(2), 18. doi:10.3390/ATMOS8020018
Appelhans, N. (2017). Urban planning and everyday urbanisation A case study on Bahir dar, Ethiopia. Dissertation. doi:10.1515/9783839437155
Arulbalaji, P., and Gurugnanam, B. (2014). Evaluating the normalized difference vegetation index using landsat data by ENVI in salem district, Tamilnadu, India. Int. J. Dev. Res. 4 (9), 1844–1846. Available online at: https://www.journalijdr.com/sites/default/files/issue-pdf/2067.pdf.
Assefa, W. W., Eneyew, B. G., and Wondie, A. (2022). The driving forces of wetland degradation in bure and wonberma woredas, upper Blue nile basin, Ethiopia. Environ. Monit. Assess. 194 (11), 1–26. doi:10.1007/S10661-022-10516-8/TABLES/3
Balew, A., and Korme, T. (2020). Monitoring land surface temperature in Bahir Dar city and its surrounding using Landsat images. Egypt. J. Remote Sens. Space Sci. 23 (3), 371–386. doi:10.1016/j.ejrs.2020.02.001
Balew, A., and Semaw, F. (2022). Impacts of land-use and land-cover changes on surface urban heat islands in Addis Ababa city and its surrounding. Environ. Dev. Sustain. 24 (1), 832–866. doi:10.1007/s10668-021-01472-3
Belete, B. (2022). Urbanization and its effect on Farmer‟s livelihoods: an assessment of Adama city peri- urban areas, Ethiopia [Ethiopian civil service university school]. Dissertation. Available online at: http://link.springer.com/10.1007/s00232-014-9701-9%0A.
Berkessa, Y. W., Bulto, T. W., Moisa, M. B., Gurmessa, M. M., Werku, B. C., Juta, G. Y., et al. (2023). Impacts of urban land use and land cover change on wetland dynamics in Jimma city, southwestern Ethiopia. J. Water Clim. Change 14 (7), 2397–2415. doi:10.2166/wcc.2023.102
Birhanu, B., Kebede, S., Zeleke, G., and Charles, K. (2023). Addis Ababa’s water crisis: challenges and opportunities. doi:10.5287/ORA-2RKEZ0NME
Brenner, N. (2013). Theses on urbanization. Public Cult. 25 (69), 85–114. doi:10.1215/08992363-1890477
Chander, G., Markham, B. L., and Helder, D. L. (2009). Summary of current radiometric calibration coefficients for Landsat MSS, TM, ETM+, and EO-1 ALI sensors. Remote Sens. Environ. 113 (5), 893–903. doi:10.1016/j.rse.2009.01.007
Chapman, S., Watson, J. E. M., Salazar, A., Thatcher, M., and McAlpine, C. A. (2017). The impact of urbanization and climate change on urban temperatures: a systematic review. Landsc. Ecol. 32 (10), 1921–1935. doi:10.1007/s10980-017-0561-4
Corbella, O. D., Silva Barbosa, G., and Drach, P. R. C. (2011). Sustainable parameters for Latin American cities. Proc. World Renew. Energy Congr. – Swed. 8–13 May, 2011, Linköping, Swed. 57 (January), 3058–3065. doi:10.3384/ecp110573058
CSA (1984). “The 1984 population and housing census of Ethiopia,” in Central statistical authority. Available online at: http://www.csa.gov.et/surveys/PopulationandHousingcensus/ETH-pop-2007/survey0/data/Doc/Reports/National_Statistical.pdf.
CSA (1995). Transitional government of Ethiopia office of the population and housing census commission the 1994 population and housing census of Ethiopia analytical report at Addis Ababa level. Central Statistical Authority. Volume 1 Statistical Report.
CSA (2018). “Statistical report on the 2018 urban Employment Unemployment survey,”, 301. Addis Ababa, Ethiopia: Central Statistical Agency (CSA)
Debebe, F. A., and Miteku, M. N. (2023). Effects of land use/land cover changes on land surface temperature and agricultural lands in Bahir dar zuria woreda. J. Urban Dev. Stud. 3 (1).
Dekolo, S., Oduwaye, L., and Nwokoro, I. (2015). Urban sprawl and loss of agricultural land in peri-urban areas of Lagos. Reg. Stat. 5 (2), 20–33. doi:10.15196/RS05202
Deribew, K. T., and Dalacho, D. W. (2019). Land use and forest cover dynamics in the North-eastern Addis Ababa, central highlands of Ethiopia. Environ. Syst. Res. 8 (1), 1–18. doi:10.1186/S40068-019-0137-1/FIGURES/8
Dibaba, W. T. (2023). Urbanization-induced land use/land cover change and its impact on surface temperature and heat fluxes over two major cities in Western Ethiopia. Environ. Monit. Assess. 195 (9), 1083. doi:10.1007/s10661-023-11698-5
Din, S. U., and Mak, H. W. L. (2021). Retrieval of land-use/land cover change (Lucc) maps and urban expansion dynamics of hyderabad, Pakistan via landsat datasets and support vector machine framework. Remote Sens. 13 (16), 1–25. doi:10.3390/rs13163337
Dodman, D., Hayward, B., Pelling, M., Broto, V. C., and Chow, W. T. L. (2022). Cities, settlements and key infrastructure, 907–1040.
Duan, Y., Tang, J., Li, Z., Yang, B., Yan, Y., and Yang, Y. (2021). Vegetated buffer zone restoration planning in small urban watersheds. WaterSwitzerl. 13 (21), 3000. doi:10.3390/w13213000
Eshetie, S. M. (2024). Exploring urban land surface temperature using spatial modelling techniques: a case study of Addis Ababa city, Ethiopia. Sci. Rep. 14, 1–16. doi:10.1038/s41598-024-55121-6
Ethiopia Peace Observatory (2024). Central Ethiopia/Regional profile. Available online at: https://epo.acleddata.com/central-ethiopia/.
Fan, C., and Wang, Z. (2020). Spatiotemporal characterization of land cover impacts on urban warming: a spatial autocorrelation approach. Remote Sens. 12 (10), 1631. doi:10.3390/rs12101631
Fitawok, M. B., Derudder, B., Minale, A. S., Passel, S. V., Adgo, E., and Nyssen, J. (2020). Modeling the impact of urbanization on land-use change in Bahir Dar City, Ethiopia: an integrated cellular automata-Markov chain approach. Land 9 (4), 115–117. doi:10.3390/land9040115
Foley, J. A., DeFries, R., Asner, G. P., Barford, C., Bonan, G., Carpenter, S. R., et al. (2005). Global consequences of land use. Science 309 (5734), 570–574. doi:10.1126/science.1111772
Foody, G. M. (2020). Explaining the unsuitability of the kappa coefficient in the assessment and comparison of the accuracy of thematic maps obtained by image classification. Remote Sens. Environ. 239, 111630. doi:10.1016/J.RSE.2019.111630
Gazi, M. Y., Rahman, M. Z., Uddin, M. M., and Rahman, F. M. A. (2021). Spatio-temporal dynamic land cover changes and their impacts on the urban thermal environment in the Chittagong metropolitan area, Bangladesh. GeoJournal 86 (5), 2119–2134. doi:10.1007/s10708-020-10178-4
Getu, K., and Bhat, H. G. (2024). Quantifying Spatio-temporal dynamics of land surface temperature for the rapidly growing city of Bahir Dar, Northwest Ethiopia using multidated Landsat data. Phys. Chem. Earth 134 (August 2022), 103543. doi:10.1016/j.pce.2024.103543
Guto, N. S. (2021). Impact of residential development on urban wetlands: the case of watiti wetland, kangemi estate, Nairobi county. Lekki, Lagos Afribary [KENYATTA UNIVERSITY]. Available online at: https://afribary.com/works/impact-of-residential-development-on-urban-wetlands-the-case-of-watiti-wetland-kangemi-estate-nairobi-county.
Hagos, F. (2023). Spatio- temporal Technology analysis for urban land use growth in the case of Mekelle city, tigray, northern Ethiopia. Int. J. Geo Sci. Remote Sens. 2 (1). doi:10.36266/IJGRS/108
Hailu, T., Assefa, E., and Zeleke, T. (2024a). Land use transformation by urban informal settlements and ecosystem impact. Environ. Syst. Res. 13 (1), 1–24. doi:10.1186/S40068-024-00359-2/TABLES/11
Hailu, T., Assefa, E., and Zeleke, T. (2024b). Urban expansion induced land use changes and its effect on ecosystem services in Addis Ababa, Ethiopia. Front. Environ. Sci. 12, 1454556. doi:10.3389/FENVS.2024.1454556
Haregeweyn, N., Fikadu, G., Tsunekawa, A., Tsubo, M., and Meshesha, D. T. (2012). The dynamics of urban expansion and its impacts on land use/land cover change and small-scale farmers living near the urban fringe: a case study of Bahir Dar, Ethiopia. Landsc. Urban Plan. 106 (2), 149–157. doi:10.1016/j.landurbplan.2012.02.016
Hassan, T., Zhang, J., Prodhan, F. A., Pangali Sharma, T. P., and Bashir, B. (2021). Surface urban heat islands dynamics in response to LULC and vegetation across south asia (2000–2019). Remote Sens. MDPI 13 (16), 3177. doi:10.3390/RS13163177
Ibrahim, H., Salama, A., Wiedmann, F., Aboukalloub, B., and Awwaad, R. (2020). Investigating land use dynamics in emerging cities: the case of downtown neighbourhood in Doha. J. Urban Des. 25 (3), 387–411. doi:10.1080/13574809.2019.1632179
Isioye, O. A., Ikwueze, H. U., and Akomolafe, E. A. (2020). Urban heat island effects and thermal comfort in abuja municipal area council of Nigeria. FUTY J. Environ. 14 (2), 19–34. Available online at: https://www.ajol.info/index.php/fje/article/view/201398.
Jiang, S., Zhang, Z., Ren, H., Wei, G., Xu, M., and Liu, B. (2021). Spatiotemporal characteristics of urban land expansion and population growth in Africa from 2001 to 2019: evidence from population density data. ISPRS Int. J. Geo-Information, 10(9), 584. doi:10.3390/IJGI10090584
Kindu, M., Angelova, D., Schneider, T., Döllerer, M., Teketay, D., and Knoke, T. (2020). Monitoring of urban growth patterns in rapidly growing Bahir dar city of northwest Ethiopia with 30 year landsat imagery record. ISPRS Int. J. Geo-Information 9 (9), 548. doi:10.3390/IJGI9090548
Kowe, P., Dube, T., Mushore, T. D., Ncube, A., Nyenda, T., Mutowo, G., et al. (2022). Impacts of the spatial configuration of built-up areas and urban vegetation on land surface temperature using spectral and local spatial autocorrelation indices. Remote Sens. Lett. 13 (12), 1222–1235. doi:10.1080/2150704X.2022.2142073
Levin, N. (2000). “Fundamentals of remote sensing,” in 1st hydrographic data Management course, IMO - international maritime academy (issue november). doi:10.1007/978-3-642-34085-7_7
Mekonnen, G. T., Berlie, A. B., Legesse, S. A., and Wubie, M. A. (2023). The implication of climate change in causing urban heat island in Gondar City, Ethiopia: an analysis made using Mann–Kendall’s trend test and homogeneity test. Arabian J. Geosciences 16 (12), 638. doi:10.1007/s12517-023-11739-w
Meng, Q., Liu, W., Zhang, L., Allam, M., Bi, Y., Hu, X., et al. (2022). Relationships between land surface temperatures and neighboring environment in highly urbanized areas: seasonal and scale effects analyses of Beijing, China. Remote Sens., 14(17), 4340. doi:10.3390/RS14174340
Miringay, J., Burra, M. M., and Babere, N. J. (2024). Urban territorial regionalisation and the emergence of urban villagization localities of Dodoma, the National Capital City of Tanzania. J. Geogr. Regional Plan. 17 (December), 78–95. doi:10.5897/JGRP2024.0871
Mohiuddin, G., and Mund, J.-P. (2024). Spatiotemporal analysis of land surface temperature in response to land use and land cover changes: a remote sensing approach. Remote Sens. Artic. 16, 1286. doi:10.3390/rs16071286
Moisa, M. B., Dejene, I. N., and Gemeda, D. O. (2022). Integration of geospatial technologies with multiple regression model for urban land use land cover change analysis and its impact on land surface temperature in Jimma City, southwestern Ethiopia. Appl. Geomatics 14 (4), 653–667. doi:10.1007/s12518-022-00463-x
Moisa, M. B., and Gemeda, D. O. (2021). Analysis of urban expansion and land use/land cover changes using geospatial techniques: a case of Addis Ababa City, Ethiopia. Appl. Geomatics 13 (4), 853–861. doi:10.1007/S12518-021-00397-W/FIGURES/5
Molla, M. B., Gelebo, G., and Girma, G. (2024). Urban expansion and agricultural land loss: a GIS-Based analysis and policy implications in Hawassa city, Ethiopia. Front. Environ. Sci. 12 (November), 1499804. doi:10.3389/FENVS.2024.1499804
Nato, J., Njogu, H., Ngugi, R., Ordu, A. U., and Ijjasz-Vasquez, E. (2023). Urban economic development in Africa: a case study of Nairobi city. Washington, DC. Brookings. Available online at: https://www.brookings.edu/articles/urban-economic-development-in-africa-a-case-study-of-nairobi-city/.
Nega, W., and Balew, A. (2022). The relationship between land use land cover and land surface temperature using remote sensing: systematic reviews of studies globally over the past 5 years. Environ. Sci. Pollut. Res. 29 (28), 42493–42508. doi:10.1007/s11356-022-19997-z
Pandey, A., Mondal, A., and Guha, S. (2024a). Assess the relationship of land surface temperature with nine land surface indices in a northeast Indian city using summer and winter Landsat 8 data. Cogent Eng. 11 (1). doi:10.1080/23311916.2024.2382885
Pandey, A., Mondal, A., Guha, S., Upadhyay, P. K., Rashmi, , and Kundu, S. (2024b). Comparing the seasonal relationship of land surface temperature with vegetation indices and other land surface indices. Geol. Ecol. Landscapes 00 (00), 1–17. doi:10.1080/24749508.2024.2392391
Qin, Z., Karnieli, A., and Berliner, P. (2001). A mono-window algorithm for retrieving land surface temperature from Landsat TM data and its application to the Israel-Egypt border region. Int. J. Remote Sens. 22 (18), 3719–3746. doi:10.1080/01431160010006971
Rabinovitch, J. (1992). Curitiba: towards sustainable urban development. Environmrnt Urbanization 4 (2), 62–73. doi:10.1177/095624789200400206
Rahman, M. N., Rony, M. R. H., Jannat, F. A., Pal, S. C., Islam, M. S., Alam, E., et al. (2022). Impact of urbanization on urban heat island intensity in major districts of Bangladesh using remote sensing and geo-spatial tools. Climate 10 (1), 3. doi:10.3390/cli10010003
Richmond, A., Myers, I., and Namuli, H. (2018). Urban informality and vulnerability: a case study in Kampala, Uganda. Urban Sci. 2 (22), 22. doi:10.3390/urbansci2010022
Safari, A., Safari, B., Gasore, J., Kipkoech, B., and Ndakize, J. (2024). Assessing the impact of Land Use Land Cover changes on land surface temperature over Kali, Rwanda in the past three decades. Environ. Sustain. Indic. J. 23, 100452. doi:10.1016/j.indic.2024.100452
Saghir, J., and Santoro, J. (2018). Urbanization in sub-saharan Africa meeting challenges by bridging stakeholders. April: Center For Strategic and International Studies.
Saleem, H., Ahmed, R., Mushtaq, S., Saleem, S., and Rajesh, M. (2024). Remote sensing-based analysis of land use, land cover, and land surface temperature changes in Jammu District, India. Int. J. River Basin Manag., 1–16. doi:10.1080/15715124.2024.2327493
Salem, M., and Tsurusaki, N. (2024). Impacts of rapid urban expansion on peri-urban landscapes in the global south: insights from landscape metrics in greater Cairo. Sustain. 2024, 16(6), 2316. doi:10.3390/SU16062316
Scott, A. A., Misiani, H., Okoth, J., Jordan, A., Gohlke, J., Ouma, G., et al. (2017). Temperature and heat in informal settlements in Nairobi. PLOS ONE 12 (11), e0187300. doi:10.1371/JOURNAL.PONE.0187300
Seto, K. C., Güneralp, B., and Hutyra, L. R. (2012). Global forecasts of urban expansion to 2030 and direct impacts on biodiversity and carbon pools. Proc. Natl. Acad. Sci. U. S. A. 109 (40), 16083–16088. doi:10.1073/pnas.1211658109
Seyoum, S. (2014). The growth of Bahir dar: 1941-1974. Ethiop. J. Dev. Res. 36 (2), 83–109. Available online at: https://ejol.aau.edu.et/index.php/EJDR/article/view/3589.
Shiva Shankar, Y., Kumar, A., and Mohan, D. (2021). Climate change and water resources: emerging challenges, vulnerability and adaptation in Indian scenario. Clim. Change Impacts Water Resour., 365–376. doi:10.1007/978-3-030-64202-0_32
Shreevastava, A., Bhalachandran, S., McGrath, G. S., Huber, M., and Rao, P. S. C. (2019). Paradoxical impact of sprawling intra-Urban Heat Islets: reducing mean surface temperatures while enhancing local extremes. Sci. Rep. 2019 9:(1), 1–10. doi:10.1038/s41598-019-56091-w
Simwanda, M., Ranagalage, M., Estoque, R. C., and Murayama, Y. (2019). Spatial analysis of surface urban heat Islands in four rapidly growing african cities. Remote Sens. 11 (14), 1645. doi:10.3390/RS11141645
Srivastava, M. R., and Satyaprakash, N. A. (2020). Urban heat island effect over Delhi NCR using LANDSATTM data. Int. J. Glob. Warming 22 (3), 272. doi:10.1504/IJGW.2020.110865
K. Stave, G. Goshu, and S. Aynalem (2017). Social and ecological system dynamics characteristics, trends, and integration. Characteristics, trends, and integration in the Lake Tana basin, Ethiopia Springer Nature, Switzerland (AESS Interdisciplinary Environmental Studies and Sciences Series, December). doi:10.1007/978-3-319-45755-0
Sun, J., Li, H., Xiao, R., Yao, G., and Zou, F. (2024). Dynamics of heat island intensity in a rapidly urbanizing area and the cooling effect of ecological land: a case study in suzhou, Yangtze River Delta. Sustainability, 16(11), 4422. doi:10.3390/SU16114422
Sussman, H. S., Raghavendra, A., and Zhou, L. (2019). Impacts of increased urbanization on surface temperature, vegetation, and aerosols over Bengaluru, India. Remote Sens. Appl. Soc. Environ. 16, 100261. doi:10.1016/J.RSASE.2019.100261
Suthar, G., Singh, S., Kaul, N., and Khandelwal, S. (2024). Prediction of land surface temperature using spectral indices, air pollutants, and urbanization parameters for Hyderabad city of India using six machine learning approaches. Remote Sens. Appl. Soc. Environ. 35, 101265. doi:10.1016/J.RSASE.2024.101265
Terfa, B. K., Chen, N., Liu, D., Zhang, X., and Niyogi, D. (2019). Urban expansion in Ethiopia from 1987 to 2017: characteristics, spatial patterns, and driving forces. Sustainability, 11(10), 2973. doi:10.3390/SU11102973
Terfa, B. K., Chen, N., Zhang, X., and Niyogi, D. (2020). Spatial configuration and extent explains the urban heat mitigation potential due to green spaces: analysis over Addis Ababa, Ethiopia. Remote Sens. 12 (18), 1–24. doi:10.3390/RS12182876
Tesfamariam, S., Govindu, V., and Uncha, A. (2023). Spatio-temporal analysis of urban heat island (UHI) and its effect on urban ecology: the case of Mekelle city, Northern Ethiopia. Heliyon, 9, e13098(2). doi:10.1016/j.heliyon.2023.e13098
Teshome, Z. T., Ayele, Z. T., and Abib, M. I. (2022). Assessment of solid waste management practices in Kebridehar city Somali regional state, Ethiopia. Heliyon 8 (9), e10451. doi:10.1016/j.heliyon.2022.e10451
Tessema, M. W. (2017). Impact of urban expansion on surrounding peasant land the case of boloso sore woreda, areka town, SNNPR, Ethiopia. Glob. J. Human-Social Sci. 17 (2), 1–15.
Tian, L., Li, Y., Lu, J., and Wang, J. (2021). Review on urban heat island in China: methods, its impact on buildings energy demand and mitigation strategies. Sustainability 762, 13(2). doi:10.3390/SU13020762
UNECA (2018). World urbanization prospects 2018 highlights. United Nations, New York Department of Economic and Social Affairs.
UNESCO (2015). “Unlocking the potential of urban communities. Case studies of twelve learning cities,” in National Institute for lifelong. Available online at: https://files.eric.ed.gov/fulltext/ED564060.pdf.
United Nations Economic Commission for Africa (UNECA) (2022). SDG indicators. New York Department of Economic and Social Affairs. Available online at: https://unstats.un.org/sdgs/report/2022/goal-11/.
Wang, M., and Xu, H. (2021). The impact of building height on urban thermal environment in summer: a case study of Chinese megacities. PLOS ONE 16 (4), e0247786. doi:10.1371/JOURNAL.PONE.0247786
Wayne, Z., Northrop, R., and Andreu, M. (2020). “Enhanced urban development and environmental DegradationReader,”. Oxford University Press Sustainability and Solutions. doi:10.1093/acrefore/9780199389414.013.97
Wong, N. H., Tan, C. L., Kolokotsa, D. D., and Takebayashi, H. (2021). Greenery as a mitigation and adaptation strategy to urban heat. Nat. Rev. Earth and Environ. 2:(3), 166–181. doi:10.1038/s43017-020-00129-5
World Bank (2015). Ethiopia urbanization review: urbanization institutions for aMiddle-income etiopia. Washington, DC The World Bank Group.
World Data Atlas (2022). Ethiopia Urban population, 1960-2022. Knoema. Available online at: https://knoema.com/atlas/Ethiopia/Urban-population.
Worseme, H. I. (2004). Economic analysis of land use: the case of East Hararghe administrative zone in Ethiopia. Available online at: http://hdl.handle.net/11660/6316.
Wubie, A. M., de Vries, W. T., and Alemie, B. K. (2020). A socio-spatial analysis of land use dynamics and process of land intervention in the peri-urban areas of Bahir dar city. Land 9 (11), 445. doi:10.3390/LAND9110445
Xu, H. (2008). A new index for delineating built-up land features in satellite imagery. Int. J. Remote Sens. 29 (14), 4269–4276. doi:10.1080/01431160802039957
Xueqin, L., Stringer, L. C., and Dallimer, M. (2022). The impacts of urbanisation and climate change on the urban thermal environment in Africa. Climate, 10 (11), 164. doi:10.3390/CLI10110164
Yesuph, A. Y., and Dagnew, A. B. (2019). Land use/cover spatiotemporal dynamics, driving forces and implications at the Beshillo catchment of the Blue Nile Basin, North Eastern Highlands of Ethiopia. Environ. Syst. Res. 8 (1), 21–30. doi:10.1186/S40068-019-0148-Y
Youssef, A., Sewilam, H., and Khadr, Z. (2020). Impact of urban sprawl on agriculture lands in greater Cairo. J. Urban Plan. Dev. 146 (4), 05020027. doi:10.1061/(ASCE)UP.1943-5444.0000623
Zhang, Y., Liu, S., Cheng, F., and Shen, Z. (2017). WetSpass-based study of the effects of urbanization on the water balance components at regional and quadrat scales in Beijing, China. Environ. Syst. Res. 10 (1), 5. doi:10.3390/W10010005
Zhao, L., Lee, X., Smith, R. B., and Oleson, K. (2014). Strong contributions of local background climate to urban heat islands. Nat. 2014 511:(7508), 216–219. doi:10.1038/nature13462
Keywords: Bahir Dar city, capital designation, land surface temperature, urban expansion, urban heat island
Citation: Melese M, Anteneh M and Bantigegn S (2025) Urbanization and land surface temperature dynamics in Bahir Dar, Ethiopia: a comparative analysis of pre- and post-capital status. Front. Environ. Sci. 13:1569636. doi: 10.3389/fenvs.2025.1569636
Received: 01 February 2025; Accepted: 24 March 2025;
Published: 09 April 2025.
Edited by:
Hugo Wai Leung Mak, Hong Kong University of Science and Technology, Hong Kong SAR, ChinaReviewed by:
Subhanil Guha, National Institute of Technology Raipur, IndiaCopyright © 2025 Melese, Anteneh and Bantigegn. This is an open-access article distributed under the terms of the Creative Commons Attribution License (CC BY). The use, distribution or reproduction in other forums is permitted, provided the original author(s) and the copyright owner(s) are credited and that the original publication in this journal is cited, in accordance with accepted academic practice. No use, distribution or reproduction is permitted which does not comply with these terms.
*Correspondence: Mastawal Melese, bW1tYXN0YXdhbEBnbWFpbC5jb20=, bWFzdGV3YWwubWVsZXNlQGJkdS5lZHUuZXQ=
Disclaimer: All claims expressed in this article are solely those of the authors and do not necessarily represent those of their affiliated organizations, or those of the publisher, the editors and the reviewers. Any product that may be evaluated in this article or claim that may be made by its manufacturer is not guaranteed or endorsed by the publisher.
Research integrity at Frontiers
Learn more about the work of our research integrity team to safeguard the quality of each article we publish.