 Yaxiang Pan
 Jingling Bao
 Yuxuan Ji1,3
 Weiyu Lin
94% of researchers rate our articles as excellent or good
Learn more about the work of our research integrity team to safeguard the quality of each article we publish.
Find out more
ORIGINAL RESEARCH article
Front. Environ. Sci., 05 March 2025
Sec. Land Use Dynamics
Volume 13 - 2025 | https://doi.org/10.3389/fenvs.2025.1561698
This article is part of the Research TopicEnvironmental Resilience and Sustainable Agri-food System ManagementView all 15 articles
Tea plantation ecosystems have an important function as carbon pools. It is of great significance to clarify the spatial and temporal patterns of carbon sinks in tea plantations, and to analyse the driving factors of carbon sinks in tea plantations, in order to understand the characteristics of carbon sinks in tea plantations, and to expand the ways of increasing carbon sinks in tea plantations. In this study, we selected the data of nine prefecture-level cities in Fujian Province, a major province of tea industry, from 2010 to 2022, and borrowed the standard deviation ellipse and trend surface analysis methods to clarify the spatial and temporal evolution of the carbon sinks in tea plantations, and combined with the geodetic detector model to explore the driving factors of spatial differentiation. The results show that: (1) During the period of 2010–2022, the total carbon sink of tea plantations in Fujian Province increased by 133.12 × 10⁵Mg, showing a continuous growth trend; in terms of spatial distribution, the intensity of tea plantation carbon sinks in the study area showed a gradual and present trend of migration and concentration from the southwest to the northeast. (2) Construct the evaluation index system of carbon sinks in tea plantations, divided into social, living, industrial and population factors and other four categories of eight indicators. (3)The single-factor driver of tea plantation carbon sinks shows that it is mainly affected by industrial scale, population density and industrial structure, with q-values exceeding 0.5. (4)The interaction of the drivers shows that the urban-rural disparity and industrial scale have the highest interaction effect, with q-values reaching 0.9698. The study provides decision-making assistance for expanding the ways of increasing the amount of carbon sinks in tea plantations from the perspectives of clarifying the influence on spatial and temporal heterogeneity of tea plantations’ carbon sinks and revealing the driving factors.
Global climate change poses a serious challenge to ecosystems and human societies, and carbon emission reduction and sink management have become a focus of global attention (Stocker, 2014; Nazir et al., 2024; Kamyab et al., 2024). Studies have shown that terrestrial ecosystems can offset more than 30 per cent of anthropogenic carbon emissions annually (Kabir et al., 2023; Friedlingstein et al., 2023), and that tea plantations, as important carbon reservoirs in terrestrial ecosystems, have significant potential for carbon sequestration and fixation (Raihan, 2023; Wang et al., 2023). Fujian Province is a typical tea province, ranking first in China for 32 consecutive years in terms of tea plantation area, production and output value. Fujian Province has 78 per cent of hilly and mountainous terrain, forming a natural three-dimensional agricultural gradient, and under the influence of the subtropical monsoon climate, with up to 66.8 per cent of forest cover, Fujian Province has formed a unique ‘forest-tea composite ecosystem’, which has a carbon sink capacity per unit of area that is 2.3 times that of ordinary farmland (Sun, 2018). Therefore, analysing the trend of spatial and temporal variability and driving factors of tea plantation carbon sinks in Fujian Province is conducive to understanding the characteristics of tea plantation carbon sinks, expanding the pathway of tea plantation carbon sinks, and facilitating the management of tea plantation ecosystems’ carbon sinks and the response to global warming, so as to achieve the sustainable development of the regional tea industry and the socio-economy (Chettri and Ghosh, 2023; Pramanik and Phukan, 2020). However, how to measure the carbon sinks in tea plantations, what factors are affected by them, and how to reveal the spatial heterogeneity of the carbon sinks in tea plantations from the mechanism of multi-factor interactions are still a difficult task.
Currently, relevant scholars have carried out relevant research on the quantification of carbon sinks, spatial and temporal changes, and driving factors of tea plantations. In the quantification of carbon sinks in tea plantations, relevant scholars usually start from the perspective of carbon footprint, and analyse the carbon emissions and carbon sinks formed by different tea varieties, tea planting in different regions, processing and sales (Xue et al., 2013; Xu et al., 2019; Liu et al., 2024). For example, by analysing the characteristics of CO2 fluxes between tea trees of different tea ages and the atmosphere (Phukan et al., 2018). Or the eco-efficiency of regional tea gardens has been assessed to explore how the external environment affects and influences the carbon cycle in tea garden ecosystems (Li et al., 2011; Psistaki et al., 2024; Di et al., 2020a). For example, by assessing how external environments such as topography, fertiliser application and soil pH act on the carbon cycle in tea gardens, recommendations are made for tea gardens to enhance their carbon sink capacity (Ul Haq et al., 2020). However, these studies are more based on the micro perspective, using sample data or experimental data from specific regions to assess the carbon effect of tea plantations at small scales and in small samples, but did not carry out an in-depth exploration of its regional spatial distribution characteristics. In terms of spatial and temporal changes of carbon sinks in tea gardens, the study mainly analyses the accumulation of biomass and the fixation of soil organic carbon during the growth process of tea trees from a long time series to reveal the characteristics of temporal changes of carbon stocks in tea gardens (Shao et al., 2024); and reveals the spatial heterogeneity of the carbon sinks of tea gardens from the aspect of the soil and gas layers of tea gardens (Liu et al., 2024). For example, the biomass model of tea tree growth cycle and the soil carbon content model reveal the time-series change of carbon sink level in tea plantation (Aditya et al., 2023; Zhang et al., 2017); the net exchange level of tea plantation ecosystem reveals the spatial distribution of tea plantation net carbon sinks in the gas layer (Pang et al., 2019); or the level of tea plantation soil, humidity, and temperature reveal the spatial heterogeneity of the soil layer of tea plantation carbon sinks (He et al., 2023; Raza et al., 2024). However, these studies are still analysing the spatial and temporal changes of carbon sinks in tea plantations from a micro perspective. In terms of the drivers of carbon sinks in tea plantations, it is generally recognised that natural factors and management practices have an inextricable influence on the carbon sinks in tea plantations, and that they work together to bring about changes in the level of carbon sinks (Pang et al., 2019). For example, it was concluded that climatic conditions and soil properties play an important role in determining soil organic carbon concentration in tea plantations (He et al., 2022; Wang et al., 2023); and that the age structure of tea trees is important in enhancing organic carbon content (Sun et al., 2014; Wang M. et al., 2024). Carbon sinks in tea plantations are affected by different soil environments and seasonal variations (Li et al., 2024; Di et al., 2020b). The study also concluded that some types of tea plantation management measures, such as tea tree pruning, tea garden water and fertiliser management, pest and disease control, tea picking, and tea plantation foundation setting, have a greater impact on the carbon storage capacity of tea plantations (Kalita et al., 2019; Rebello et al., 2022; Alom et al., 2021; Kalita et al., 2020). However, studies on driving factors usually focus on the analysis of a single factor, lacking in-depth exploration under the synergistic effect of multiple factors, and less from social, economic, demographic and other factors to consider the impact on carbon sinks in tea plantations.
Therefore, this study aims to identify the level of carbon sinks in tea plantations in the main tea producing areas from a regional perspective, reveal the spatial and temporal characteristics of tea plantation carbon sinks, analyse the driving mechanism of multi-factor interactions on tea plantation carbon sinks, and suggest countermeasures for the management of tea plantation carbon sinks, so as to achieve synergistic development of the tea industry and the goal of ‘dual-carbon’. To this end, the study selected Fujian Province, a large tea-growing region, as the research object, and based on the carbon sinks of tea plantations in each prefecture-level city from 2010 to 2022, applied standard elliptic difference and trend surface analyses to reveal the characteristics of spatial and temporal changes in the carbon sinks of tea plantations, and applied geo-probes to explore the driving mechanism of the carbon sinks of tea plantations. The main contents of this study are: (1) Measurement of carbon sinks in tea plantations; (2) Clarification of spatial and temporal characteristics of carbon sinks in tea plantations; (3) Identification of the driving mechanisms of carbon sinks in tea plantations. From the perspective of revealing the multi-factor interactive driving mechanism of tea plantation carbon sinks, the study provides a reference for the expansion of tea plantation carbon sink incremental pathways in tea producing areas.
Fujian Province is located on the southeast coast of China (23°33′–28°20′N, 115°50′–120°40′E) (Figure 1), with nine prefectural-level administrative units including Fuzhou, Xiamen, Quanzhou, Zhangzhou, Putian, Ningde, Nanping, Sanming and Longyan. The region is dominated by low hills, belonging to the subtropical monsoon climate zone, with an average annual temperature between 17°C and 21°C, an annual cumulative temperature of ≥10°C of 5,000°C–7,600°C, and an average annual precipitation of 1,400–2,100 mm. The superior geographical and climatic conditions have given birth to four major tea categories, namely, ‘White Tea, Green Tea, Black Tea, Oolong Tea’ and ‘Oolong Tea’. ‘In 2022, the tea plantation area in Fujian Province will reach 3.61 million mu, with a total tea output of 520,000 tonnes, a total output value of the tea industry chain of more than 150 billion yuan, and an export value of 531 million U.S. dollars, ranking first in the country in terms of tea indicators. Tea indicators all rank first in the country. At the same time, Fujian Province is the first in the country to carry out the pilot project of ‘eco-tea garden’, the first in the country to carry out carbon emission monitoring and statistics of tea gardens, and pilot carbon trading in Anxi County, etc., with the leading technology and policy support for tea plantation management in the country (Qin and Wang, 2014). Therefore, the study on the spatial and temporal changes and driving factors of carbon sinks in tea plantations in Fujian Province has a certain representative value.
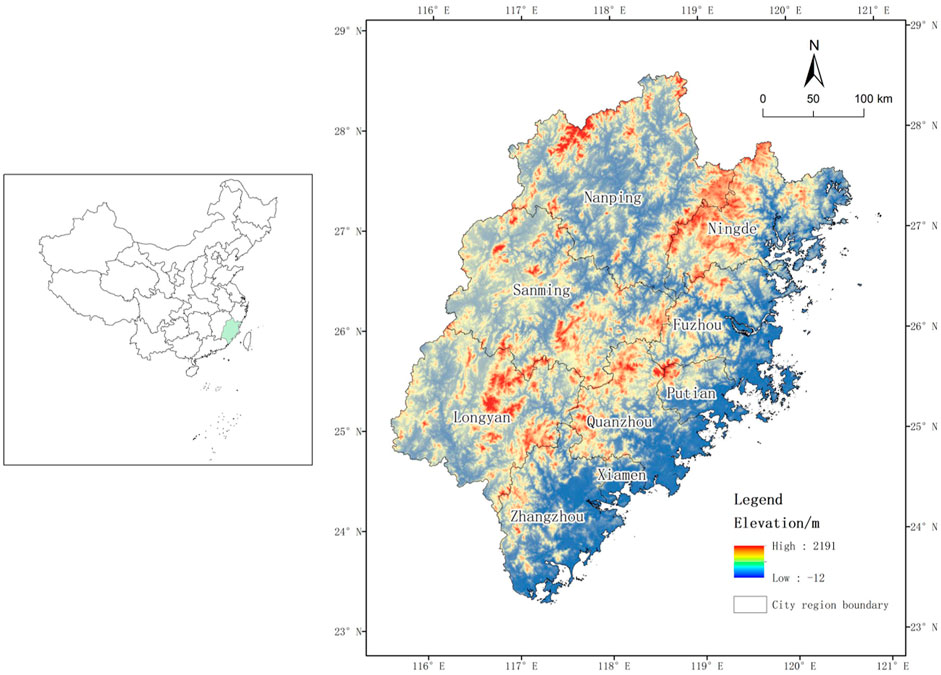
Figure 1. Location map of the study area.
The data for the study in this paper come from the Statistical Yearbook of Fujian Province, Statistical Yearbook and Statistical Bulletin of Prefectural Municipalities in Fujian Province from 2011 to 2023. For the shortage values, if the data of the previous and subsequent years are complete, the average value method is used to make up for them; while for the missing value years at the end of the period, they are made up for by the linear interpolation method.
Concerning the study of Liang Li (Liang et al., 2021), this paper considers three carbon sinks in the calculation of carbon sinks in tea plantations: soil, biomass, and carbon storage in tea produced in the tea garden ecosystem. The carbon sink of soil is calculated according to Equation 1, while the carbon storage in biomass and tea is estimated by Equations 2, 3, respectively. The total carbon stock is calculated according to Equation 4.
Where, A and Q are the tea garden area and tea output of the region respectively.
Standard ellipse difference is a method used to analyse the characteristics of the spatial distribution of geographic elements. It can quantitatively explain the information of centrality, directionality, expansion direction and deviation of the spatial distribution of geographic elements from a global perspective (Li et al., 2023). In this study, the standard elliptic deviation was used to reveal the spatial distribution characteristics of tea plantation carbon sinks and their trends in different prefecture-level cities in Fujian Province. By calculating the spatial distribution centre (centre of gravity), expansion direction (major and minor axes) and deviation (corner
The expression for the corner is: θ
In Formula 5 and Formula 6,
In Equation 7, is an extensive range of trend surface fitting values;
In Formula 8, X and y are the geographical coordinates of the observation points;
Geoprobe is a spatial analysis method for detecting spatial differentiation and revealing intrinsic driving forces (Wang and Yang, 2024). It is based on the explanatory power of the independent variable on the spatial distribution of the dependent variable, and identifies the main factors affecting the spatial distribution of the dependent variable and their interaction mechanisms through modules such as factor detection and interaction detection (Wei et al., 2020). In this study, the geo-detector was used to analyse the main drivers and their interactions affecting the spatial distribution of carbon sinks in tea plantations in Fujian Province, and the ‘GD’ package in the R language of the geo-detector for optimal parameters was applied to screen out the discretization method with the best classification effect, automatically optimize the parameter selection process, reduce the error of human intervention, and improve the accuracy and efficiency of the analysis. The accuracy and efficiency of the analyses are reduced, and the foundation is laid for the subsequent exploration and analysis (Cai and Xu, 2023). Factor detection, ecological detection, and interaction detection are the main methods used in this paper.
(1) Factor Detection: By calculating the explanatory power (
The value range of
(2) The ecological probability statistic is used to compare whether there are significant differences in the effects of different factors on the spatial heterogeneity of carbon sinks in tea plantations. Their formula is shown below (Equations 10, 11).
where
(3) Interaction detection: By analysing the explanatory power of the interactions between different drivers on the spatial differentiation of the carbon sinks in tea plantations, we can identify the multifactorial synergistic mechanisms affecting the carbon sinks in tea plantations. The interaction detection includes five types: nonlinear attenuation, one-factor nonlinear attenuation, two-factor enhancement, nonlinear enhancement, and independence, and the basis of discrimination is shown in Table 1.
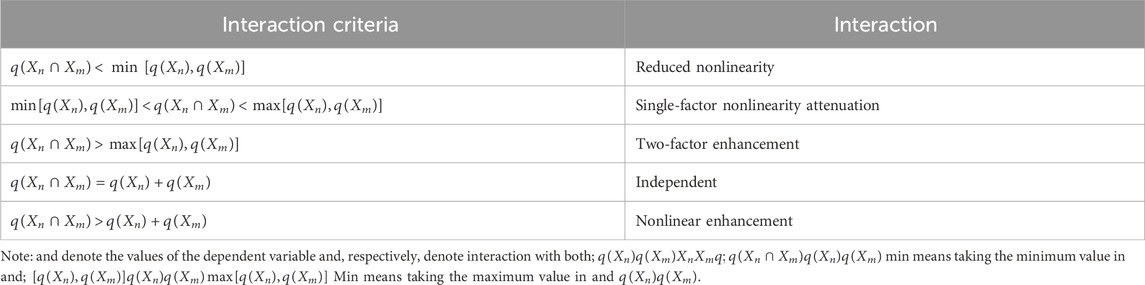
Table 1. Discrimination table of factor interaction types in geographical detectors.
In this paper, the carbon sink of tea plantations in Fujian Province from 2010 to 2022 was selected as the dependent variable. The driving factors were divided into four categories: social, life, industry, and population factors considering the availability of data and the rationality of independent variables (Liu et al., 2024; Tang et al., 2024; Zhou et al., 2024), finally choosing social factors: economic level, financial support; Life factors: rural-urban gap, consumption structure; Industrial factors: industrial structure, industrial scale; Population factor: A total of 8 indicators, population density and urbanization rate, are used as independent variables to build the influencing factor system, and the specific index data are shown in Table 2.
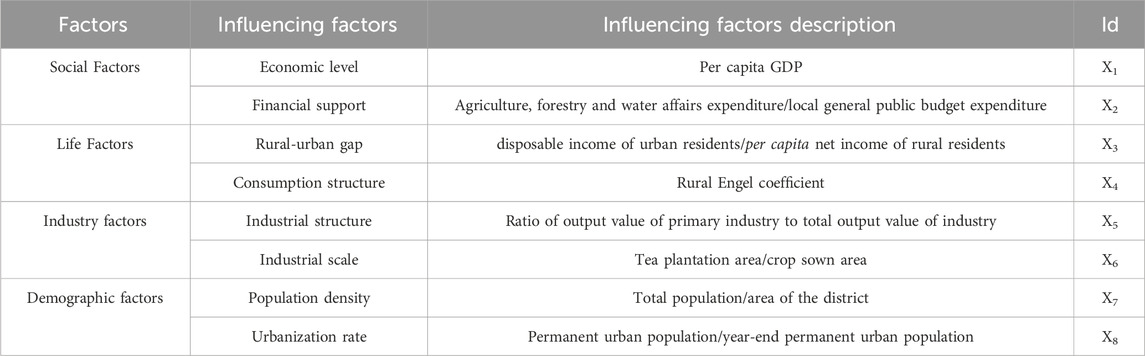
Table 2. Description of the index system of influencing factors of carbon sink in tea plantations in Fujian Province.
The study shows that during the period from 2010 to 2022, the carbon sink of tea plantations in Fujian Province shows a continuous growth trend, increasing from 140.35 × 10⁵ Mg in 2010 to 273.47 × 10⁵ Mg in 2022, with a growth rate of 94.8%, showing the changing characteristics of ‘stable growth followed by fluctuating increase’. The change characteristics of the tea plantation carbon sink capacity significantly increased (Figure 2). Specifically, between 2010 and 2016, the carbon sink of tea plantations in the study area showed a stable growth trend, with an average annual growth rate of about 8.7%. Due to the expansion of tea plantation planting area and the improvement of tea plantation management measures, the soil carbon stock of tea plantation increased; in 2017, the carbon sink of tea plantation declined to 207.63 × 10⁵Mg, which was mainly affected by the policy of ‘returning tea to forests and ploughs’; the carbon sink of tea plantation continued to increase and reached the highest value of 273.47 × 10⁵Mg in 2018–2022 (Figure 2); the carbon sink of tea plantation reached a maximum value of 273.47 × 10⁵Mg. 273.47 × 10⁵Mg, which is mainly affected by the policy of ‘promoting green planting technology and soil improvement’ and other ecological management policies for tea plantations. Overall, the rapid growth of tea plantation carbon sinks in the study area reflects the positive contribution of tea plantation ecosystems to the carbon cycle.
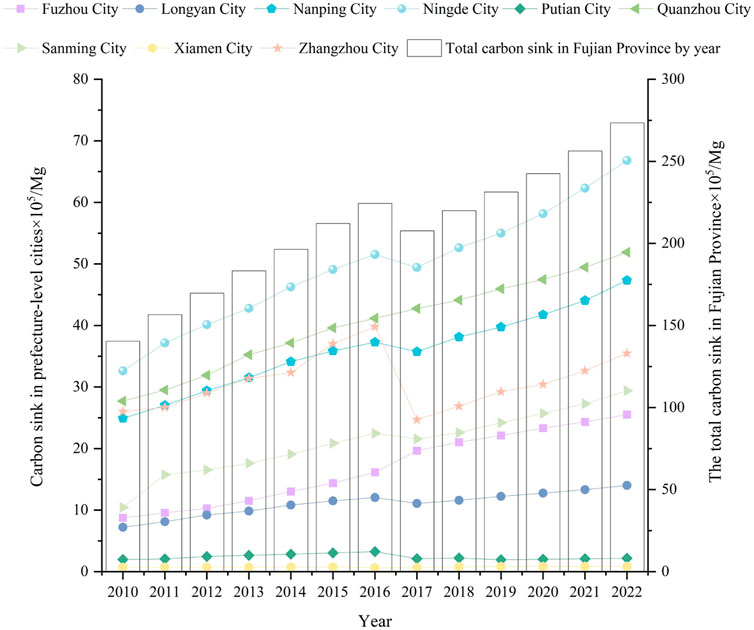
Figure 2. Time change of carbon sink in tea plantations in Fujian Province from 2010 to 2022.
In order to reveal the changing characteristics of spatial patterns of carbon sinks in tea plantations in the study area, four-time nodes (2010, 2015, 2020 and 2022) were selected for barycentric analysis, and the standard deviation ellipse was used for description (Figure 3). During the study period, the centre of gravity was distributed in 118° 17′21 E∼118° 21′27”E, 25° 58′39”∼26° 05′58″N, and concentrated in Sanming City. The overall migration direction was northeast, and the total migration distance of the centre of gravity was 14.5143 km. Although there was a displacement trend to the northeast, the migration amplitude was relatively small, indicates that the geographical distribution of the centre of gravity of the tea plantation carbon sink in the study area has stabilised over the study period.
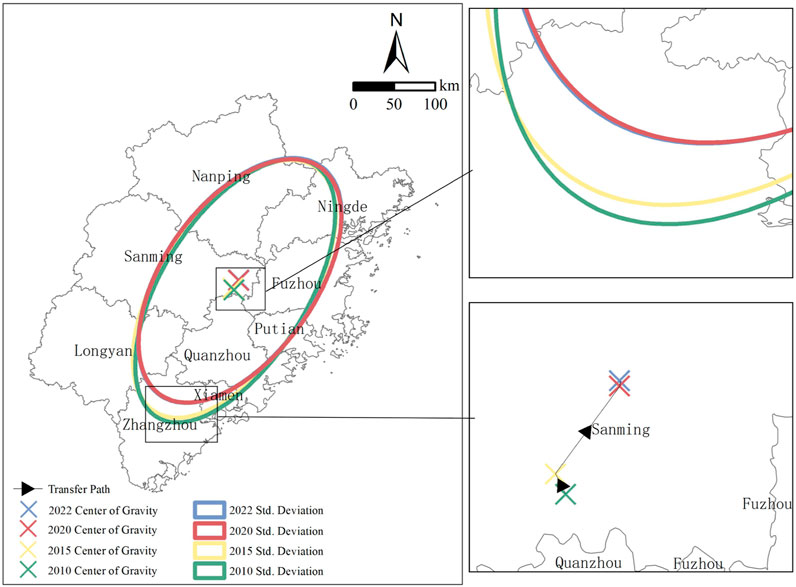
Figure 3. Migration trajectory of carbon sink center of tea plantations in Fujian Province.
The azimuth of the standard deviation ellipse reflects the spatial evolution trend of the tea plantation carbon sink. During the study period, the azimuth angle gradually increased, and the carbon sink of the tea plantation showed the characteristic of expanding in the direction of ‘south-east - north-west’ (Table 3). The azimuth angle increased the most from 2015 to 2020, from 21.21° to 22.43°, while the change from 2020 to 2022 was small, with an increase of 0.04° only. This trend is closely related to the construction of eco-tea gardens in Wuyishan City and Anxi County in the study area during this period, reflecting the regional clustering of carbon sinks in tea gardens in the study area.
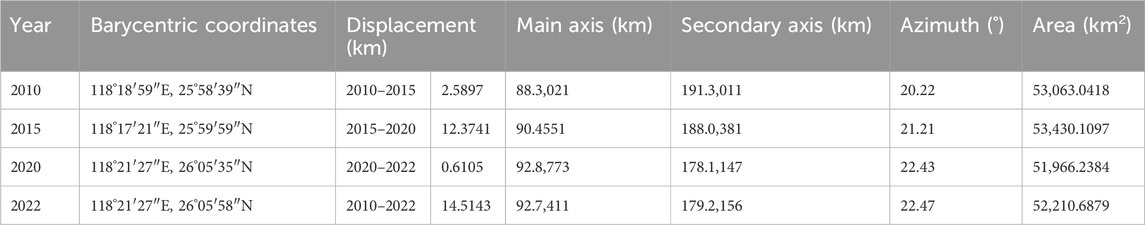
Table 3. Variation of standard deviation ellipse of carbon sink in tea plantations in Fujian Province.
Changes in the major and minor axes of the standard deviation ellipse revealed the concentration trend of the spatial distribution of carbon sinks in tea plantations. The study showed that (Table 3), the major axis extended by 4.4391 km during 2010–2022, showing an expansion trend in the direction of ‘northeast-southwest’; while the minor axis decreased by 12.0855 km, showing a contraction trend in the direction of ‘northwest-southeast’; and the area of the standard deviation ellipse decreased by 852.3539 km. This trend indicates that the spatial distribution of tea plantation carbon sinks in the study area is gradually concentrated.
The distribution of the average annual amount of carbon sinks in tea plantations in the study area showed that (Figure 4), the top 3 average annual carbon sinks during the period of 2010–2022 were Ningde City, Quanzhou City and Nanping City, with 643.9139 × 10⁵ Mg, 523.9588 × 10⁵ Mg, and 466.8379 × 10⁵ Mg, respectively, which accounted for 23.73%, 19.31%, and 17.20%. The lowest tea plantation carbon sink was in Xiamen City, with only 9.6940 × 10⁵ Mg, indicating that there was obvious regional heterogeneity of tea plantation carbon sinks in the study area, which was also consistent with the results of the standard deviation ellipse study, reflecting the spatial distribution of tea plantation carbon stocks and the expansion of the agglomeration of tea plantation carbon stocks.
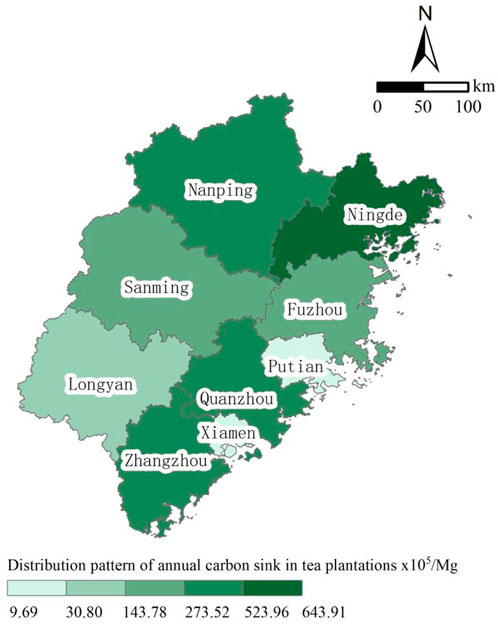
Figure 4. Spatial distribution of average carbon sink of tea plantations in Fujian Province.
In order to further verify the spatial distribution characteristics of the tea plantation carbon sinks in the study area, this study further used the trend surface method to fit the ‘east-west-north-south’ direction of the tea plantation carbon sinks in the study area during the period of 2010–2022. The results show that (Figure 5), the curve of tea plantation carbon sinks in the east-west and north-south directions during the study period is characterised by ‘low in the middle and high at both ends’, and this characteristic is more prominent in the east-west direction. Specifically, the fitted curve of tea plantation carbon sinks did not change much between 2010 and 2015; the value of the eastern section of the fitted curve of tea plantation carbon sinks decreased significantly between 2015 and 2020; and the fitted curve of tea plantation carbon sinks did not change significantly between 2020 and 2022. Overall, the spatial distribution pattern of tea plantation carbon sinks in the study area is always ‘east-west high-central low-north-south high’. This spatial distribution pattern is consistent with the results of the standard deviation ellipse study, indicating that the spatial distribution of tea plantation carbon sinks in the study area is concentrated in the northwest and southeast.
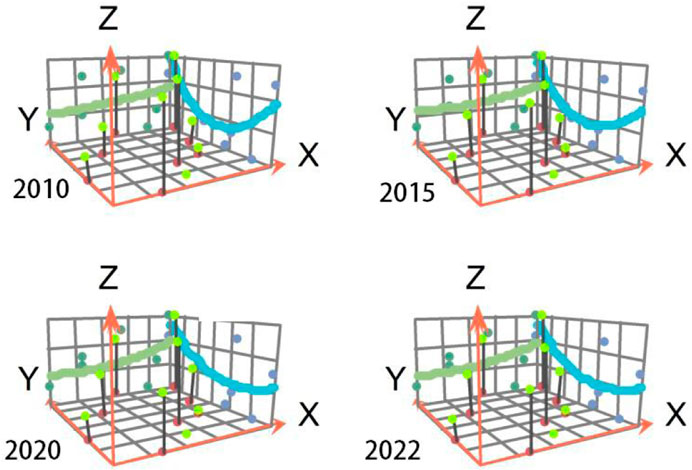
Figure 5. Global spatial trend surface fit of tea plantation carbon sinks for selected years in the study area.
In order to further reveal the driving mechanisms affecting carbon sinks in tea plantations, this study identifies the significant factors affecting carbon in tea plantations by calculating the explanatory power (q-value) of each driving factor on the spatial variation of carbon sinks in tea plantations. q-value is larger, which indicates that the explanatory power of the factor on the spatial variation of carbon sinks in tea plantations is stronger. The results of one-way test of geo-detector showed (Table 4) that four driving factors, namely, industrial scale, population density, industrial structure and financial support, had 99% significant effect on the carbon sink of tea plantation in the study area, with q-values of 0.9080, 0.7310, 0.5723 and 0.3458, respectively. The average internal q value of the four types of influencing factors was in order of industry factor (0.7402) > population factor (0.4978) > economic factor (0.1928) > life factor (0.1539). The high explanatory power of industrial scale indicates that the proportion of tea plantation area in the sown area of crops has the most significant effect on the carbon sink of tea plantations; the explanatory power of population density follows, mainly due to the rapid urbanisation of the study area, the reduction of agricultural land and the shrinkage of tea plantation area, which weakens the carbon sink capacity; the industrial structure indicates that the tea industry in the study area with a high proportion of agricultural output value is well developed, which contributes to the carbon sequestration; and the low explanatory power of financial support indicates that the financial expenditure on agriculture, forestry and water affairs is low in the proportion of general public budget expenditure, which is not conducive to the green development of tea plantations, and its direct contribution to the carbon sink is limited. Support has a lower explanatory power, indicating that fiscal expenditure on agriculture, forestry and water affairs accounts for a lower proportion of general public budget expenditure, which is not conducive to the green development of tea gardens and has a more limited direct contribution to the carbon sink of tea gardens. The urban-rural gap and rural Engel’s coefficient have the smallest influence, indirectly reflecting that the rural consumption structure and agricultural investment mode play a role in the insufficient carbon sink of tea plantations.

Table 4. Single factor detection results of spatial pattern of carbon sink in tea plantations in Fujian Province.
To further identify the effects of single-factor combinations on the spatial differentiation of carbon sinks in tea gardens, this study applied the ecological detection model of geodetector. The results showed (Table 5) that the percentage of two-factor combinations that were significantly different was 92.86%, implying that the vast majority of two-factor combinations had different modes of action and degrees of influence in affecting the spatial distribution of carbon sinks in tea plantations. Therefore, these factors may influence the spatial distribution of carbon sinks in tea plantations through different mechanisms or pathways. However, the explanatory power of only two pairs of two-factor combinations, i.e., ‘urban-rural income ratio and rural Engel’s coefficient’ and ‘industry scale and population density’, was not significantly different, accounting for 7.14%, which indicates that the interaction of these two groups of factors does not have a significantly different effect on the spatial distribution of carbon sinks in the tea gardens. This indicates that the interaction of these two groups of factors does not have significantly different effects on the spatial distribution of carbon sinks in tea plantations, which may be due to the fact that the spatial change characteristics of these factors are relatively consistent or their mechanisms are similar.
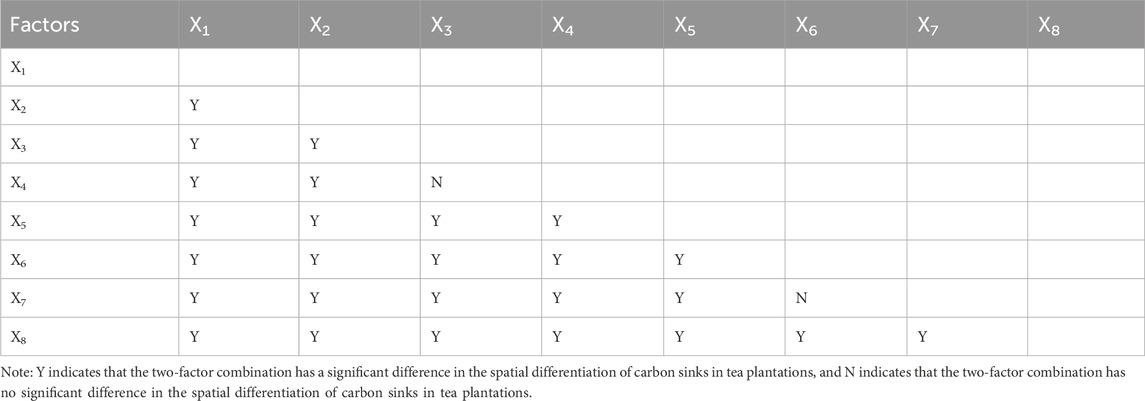
Table 5. Ecological detection results of impact factors.
On the basis of ecological exploration, interaction exploration was applied to reveal the mechanism of the two-way interaction of different drivers on the carbon sink of tea plantations in the study area. The results of the ecological probes (Figure 6) showed that 15 of the interactions were two-way enhancement, and the remaining 13 were non-linear enhancement. Among them, the interaction effect between urban-rural disparity (X3) and industrial scale (X6) was the highest and showed a two-way enhancement (q value of 0.9698), indicating that the urban-rural disparity and the distribution of tea plantation area in the study area are closely related. This two-way enhancement effect indicated that regions with large urban-rural income disparity may expand the tea scale through the development of the tea industry, thus further amplifying the carbon sink potential of tea plantations, which is consistent with the fact that large-scale tea plantations in the study area are distributed in regions with large urban-rural income disparity such as Ningde City, Nanping City, and so on. In addition, ‘industrial structure and economic level’, ‘industrial structure and urban-rural gap’, ‘industrial structure and rural Engel’s coefficient’, ‘industry scale and population density’ and so on. The two-factor combinations of ‘industrial structure and economic level’, ‘industrial structure and rural-urban gap’, ‘industrial structure and rural Engel’s coefficient’, and ‘industrial scale and population density’ all have q-values above 0.9600. The results show that the adjustment of industrial structure plays a greater role in the improvement of economic level, which in turn promotes the economic and ecological planting pattern of tea plantations, and thus enhances the carbon sink capacity. However, although the explanatory power of urban-rural disparity (X3) and urbanisation rate (X8) was weak in the one-way analysis, the explanatory power was significantly enhanced after interacting with industry scale or industry structure, and the results indicated that multiple factors such as society, life and industry jointly drove the growth of carbon sinks of tea gardens in Fujian in the cross-type transmission and interaction. This result highlights that in the process of multidimensional synergistic development, optimising the structure of agricultural industry, regulating the urban-rural gap and increasing the urbanisation rate can help promote the sustainable enhancement of the carbon sink in tea plantations through policy guidance and regional economic support.
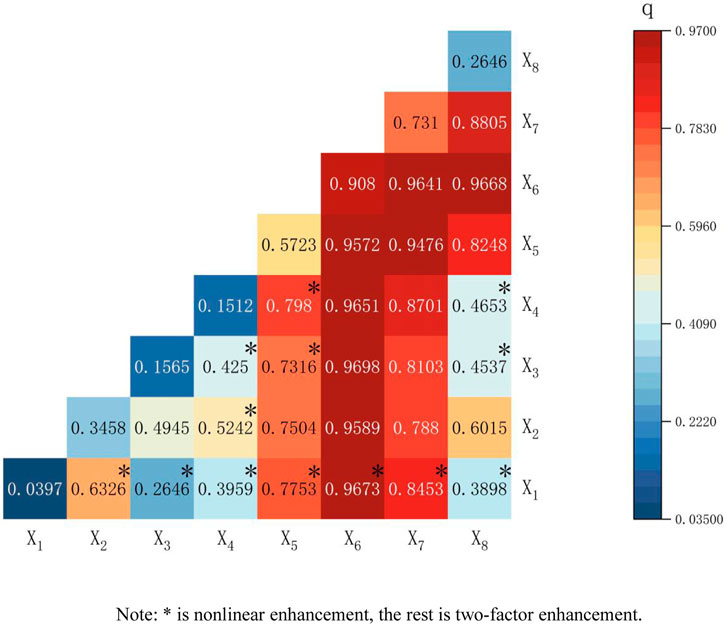
Figure 6. Interaction detection results of influencing factors on spatial pattern of carbon sink in tea plantations in Fujian Province. Note: * is nonlinear enhancement, the rest is two-factor enhancement.
Clarifying the spatial and temporal characteristics of tea plantation carbon sinks is a prerequisite for revealing their driving mechanisms. In this study, the spatial and temporal evolution of the tea plantation carbon sinks in Fujian Province from 2010 to 2022 was systematically revealed through the use of time series analysis, standard deviation ellipse analysis and trend surface analysis. On the temporal scale, with reference to the relevant methods in Wang M’s study, the data related to tea plantations were standardised on an annual basis, and the interpolation and averaging methods were used to supplement the missing data to ensure the completeness and consistency of the data (Wang S. et al., 2024). At the spatial scale, the spatial distribution characteristics of the carbon sinks in tea gardens in different regions and their evolution patterns were revealed through standard deviation ellipse analysis and trend surface analysis. In terms of reconciling spatial heterogeneity and temporal dynamics, this study analysed the effects of single-factor and multi-factor interactions on the carbon sinks in tea plantations through a geodetector model, revealing the synergistic mechanisms of different factors at different temporal and spatial scales, which is in line with the methodology used by Yuan L and Zhang C for exploring the spatial distribution of carbon sinks (Yuan et al., 2024; Zhang Y. et al., 2022). The study shows that the carbon sink of tea plantations in the study area has increased by 133.12 × 10⁵ Mg over the period of 2010–2022, which is 94.8%, and the carbon sink capacity of tea plantations has increased significantly. This result is in line with the conclusion of Chettri V that ‘the tea industry has made a significant contribution to the carbon sink in recent years’ (Chettri and Ghosh, 2023). In terms of spatial distribution, the intensity of carbon sinks in tea plantations is gradually concentrated at the northeast-southwest ends of the study area, showing the characteristics of the ‘smiling curve’, indicating that the distribution characteristics of carbon sinks in tea plantations in the study area are consistent with the changes in the industrial pattern. This result is consistent with the conclusion of Yuan L that ‘the distribution of carbon sinks in tea plantations is similar to the pattern of tea industry’ (Yuan et al., 2024). The study identifies the spatial and temporal distribution characteristics of tea plantation carbon sinks from a regional spatial and temporal perspective, which can provide a macroscopic perspective and methodological reference for subsequent comparative studies of tea plantation carbon sinks in different regions.
Uncovering the driving mechanisms that influence the spatial and temporal variability of carbon sinks in tea plantations is the basis for realising the incremental carbon sinks in tea plantations. Current research mainly focuses on the changes in carbon sink levels from both natural factors and management measures. However, with the rapid development of the tea industry, the industrial structure, industrial scale, industrial policy, and population engaged in tea in tea-growing areas have changed, thus affecting the carbon sinks in tea plantations. The one-way analysis in this study showed that industry scale was the most important driver affecting the carbon sink of tea plantations in Fujian Province, indicating that as the scale of the tea industry expands, the planted area of tea plantations increases, and the tea trees contribute significantly to the fixation of soil carbon and the increase of aboveground biomass carbon. At the same time, the expansion of industry scale led to further enhancement of ecological management techniques in tea plantations, which together contributed to the enhancement of the carbon sink capacity of tea plantations, a finding similar to that of the Rebello R study (Rebello et al., 2022). Secondly, the influence of population density reflects the competitive pressure of urbanisation on land use, suggesting that tea plantation carbon sinks in Fujian Province are somewhat inhibited in urban areas with tight land resources, such as Xiamen. In addition, the higher explanatory power of industrial structure reflects the positive correlation between the degree of development of the tea industry and the effect of carbon sinks, and this factor also shows a significant role in the national study of the drivers of tea plantation carbon sinks, suggesting that spatial variations in tea plantation carbon sinks are influenced by both economic and social factors (Yuan et al., 2024). In this study, the carbon sinks in tea plantations were affected by the interaction of multiple factors, in addition to the single-factor-driven effects of industrial scale, population density and industrial structure (Rebello et al., 2022; Kalita et al., 2020). The results of the multifactor interaction probes revealed that the spatial differentiation of the carbon sinks in tea plantations was driven by several factors, especially the interaction between urban-rural disparity and industry scale. In particular, the interaction between urban-rural income disparity and industry scale was significant, as urban-rural income disparity significantly increased the carbon sink efficiency of tea plantations by influencing the input levels and management practices of rural tea farmers. In addition, the combination of factors such as industrial structure and population density showed non-linear enhancement characteristics to a certain extent, indicating that during the process of economic upgrading, industrial policies and resource inputs jointly promoted the concentration and optimisation of the spatial distribution of carbon sinks through different paths, which is consistent with the current study (Yuan et al., 2024; Cui et al., 2022). The study analysed the multi-factor interaction driving mechanism, providing new ideas for the study of carbon sink changes and driving factors. The study shows that the enhancement of the carbon sink capacity of tea plantations should be tailored to the local conditions, taking into account the natural endowment and socio-economic development conditions of the region.
(1) Implement regional grading and differentiated management of tea areas. The area of organic tea plantations should be further expanded in areas with high carbon sinks, and planting and management methods should be optimised in order to stabilise and improve the carbon sink capacity of tea plantations. For example, Nanping City Government has incorporated the enhancement of tea plantation carbon sinks into its eco-city construction strategy, and the area of organic tea plantations has increased by 30 per cent in the past five years, which has significantly improved the carbon sink capacity of tea plantations. In the low value area of tea plantation carbon sinks should set a practical target for the growth of tea plantation carbon sinks. For example, Xiamen City and Putian City should introduce high carbon sink tea tree varieties suitable for local growth, promote green pest control technology, reduce energy consumption, and gradually improve the level of carbon sinks. (2) Establish a dynamic monitoring and assessment system for carbon sinks in tea plantations. Satellite remote sensing and big data technologies are used to capture the impact of land use changes, climate and other factors on the carbon sinks of tea gardens, in order to quickly identify the areas and trends of carbon sink changes, and to achieve precise management and regulation. For example, Anxi County in Quanzhou City has established a perfect dynamic monitoring and assessment system for tea plantation carbon sinks, and through real-time monitoring and data analysis, the problem of declining carbon sinks due to over-fertilisation of some tea gardens was discovered in a timely manner. The local government quickly adjusted its policy to guide tea farmers to apply fertiliser reasonably, so that the carbon sinks of tea gardens gradually recovered and steadily increased. (3) Focus on the synergistic drive and development of multiple factors. For areas with high population density, it is necessary to add incentives for intensive land use in the carbon sink enhancement policy; in areas where the industrial structure has a greater impact on carbon sinks, the tea plantations should be transformed into ecological and modernised ones, so as to enhance the spatial agglomeration of the carbon sinks of the tea plantations and realise the incremental amount of the tea plantations’ carbon sinks. For example, in Zhangping County, Longyan City, in the process of promoting the enhancement of carbon sinks in tea gardens, factors such as industrial structure, ecological resources and population are fully taken into account, and through the development of the mode of integration of ecotourism and the tea industry, the impact on the environment is reduced and the capacity of carbon sinks in tea gardens is enhanced while improving the efficiency of land use.
Taking Fujian Province, a large tea growing area, as an example, this study analyses the spatio-temporal changes and distribution characteristics of tea plantation carbon sinks in each city during the period of 2010–2022, explores the driving mechanism of spatio-temporal heterogeneity that affects the tea plantation carbon sinks, and proposes a pathway for the increment of tea plantation carbon sinks. However, there are still deficiencies. Firstly, due to the due to the availability of data, the calculation of tea garden carbon sinks in this study did not take into account the impact of micro-natural factors such as the growing environment, age structure and varietal differences of tea trees on carbon sinks. Secondly, economic factors such as market price were not fully considered due to the changes in the tea market, which may limit a comprehensive understanding of the drivers of carbon sinks. In future studies, detailed data from ground observations should be combined to further improve the accuracy of carbon sink measurement in tea plantations. In addition, the inclusion of economic factors such as market prices in the analysis and the combination of mechanism-based models (e.g., system dynamics models) may provide a more comprehensive exploration of the complex relationship between carbon sinks in tea gardens and multifactorial drivers, thus providing a scientific basis for the development of more accurate carbon sink enhancement strategies.
This study identifies the driving mechanism of the spatial and temporal evolution of the tea plantation carbon sink and discusses the strategy of increasing the tea plantation carbon sink, and systematically reveals the characteristics of the spatial and temporal variability of the tea plantation carbon sink and its driving mechanism by comprehensively applying the standard deviation ellipse, the trend surface analysis, and the Geodetector (GD) model. The main research results are as follows: (1) During the period of 2010–2022, the carbon sink of tea plantation showed the stage characteristics of ‘stable growth and fluctuating rise’, and the increase rate was as high as 94.8%; in terms of the spatial pattern, the intensity of the carbon sink showed the heterogeneous distribution of ‘high in the east and west, low in the middle, and high in the north and south’, and the spatial centre of gravity continued to migrate to the north-east direction. (2) A carbon sink evaluation system for tea plantations was constructed, covering eight indicators in four dimensions: socio-economic, industrial development, population concentration, and residents’ life. (3) The analysis of the driving mechanism shows that the industrial scale, population density and industrial structure are the dominant factors affecting the carbon sinks in tea plantations, and the two-factor combination of urban-rural income disparity and industrial scale has a significant effect on the spatial and temporal variations of the carbon sinks in tea plantations. (4) The study proposes a three-pronged strategy to enhance the carbon sinks in tea plantations, namely, ‘differentiated management in hierarchical zones’, ‘construction of a dynamic monitoring system for carbon sinks’ and ‘optimisation of multi-factor synergistic driving mechanism’. The research results not only deepen the theoretical knowledge of tea plantation ecosystem carbon sink process, but also provide scientific basis and decision-making support for the precise management of regional tea plantation carbon sinks.
The original contributions presented in the study are included in the article/supplementary material, further inquiries can be directed to the corresponding authors.
YP: Conceptualization, Data curation, Formal Analysis, Methodology, Software, Validation, Writing–original draft, Writing–review and editing. JB: Conceptualization, Investigation, Methodology, Validation, Writing–original draft, Writing–review and editing. YJ: Visualization, Writing–review and editing. WnL: Data curation, Writing–review and editing. WiL: Writing–review and editing. SF: Conceptualization, Funding acquisition, Project administration, Resources, Supervision, Validation, Writing–review and editing. LM: Conceptualization, Funding acquisition, Project administration, Resources, Supervision, Validation, Writing–review and editing.
The author(s) declare that financial support was received for the research, authorship, and/or publication of this article. This research was funded by the Fujian Provincial Innovation Strategy Research Joint Project (2023R0147), the Science and Technology Integration and Mechanism Research of Characteristic Modern Agricultural “Industry Courtyard” (K8120K01a), and the Tea Industry Economic and Cultural Creativity Research (K152005A08).
The authors declare that the research was conducted in the absence of any commercial or financial relationships that could be construed as a potential conflict of interest.
The author(s) declare that no Generative AI was used in the creation of this manuscript.
All claims expressed in this article are solely those of the authors and do not necessarily represent those of their affiliated organizations, or those of the publisher, the editors and the reviewers. Any product that may be evaluated in this article, or claim that may be made by its manufacturer, is not guaranteed or endorsed by the publisher.
Aditya, K., Kumar, R., and Sanyal, S. (2023). Environmental impact of green house gas emissions from the tea industries of northeastern states of India. Front. Sustain. Food Syst. 7, 1220775. doi:10.3389/fsufs.2023.1220775
Alom, S., Das, R., Baruah, U., Das, S., and Bhuyan, R. P. (2021). Carbon sequestration potential under tea based cropping system. J. Environ. Biol. 42 (3), 687–693. doi:10.22438/jeb/42/3/mrn-1498
Cai, X., and Xu, Y. (2023). Spatiotemporal evolution and influencing factors of tourism economic resilience under the impact of COVID-19—a case study of coastal cities in China. Sustainability 15 (24), 16668. doi:10.3390/su152416668
Chettri, V., and Ghosh, C. (2023). Tea gardens, A potential carbon-sink for climate change mitigation. Curr. Agric. Res. J. 11 (3), 695–704. doi:10.12944/carj.11.3.01
Cui, Y., Khan, S. U., Sauer, J., and Zhao, M. (2022). Exploring the spatiotemporal heterogeneity and influencing factors of agricultural carbon footprint and carbon footprint intensity: embodying carbon sink effect. Sci. Total Environ. 846, 157507. doi:10.1016/j.scitotenv.2022.157507
Di, S., Zong, M., Li, S., Li, H., Duan, C., Peng, C., et al. (2020a). The effects of the soil environment on soil organic carbon in tea plantations in Xishuangbanna, southwestern China. Agric. Ecosyst. and Environ. 297, 106951. doi:10.1016/j.agee.2020.106951
Di, S., Zong, M., Li, S., Li, H., Duan, C., Peng, C., et al. (2020b). The effects of the soil environment on soil organic carbon in tea plantations in Xishuangbanna, southwestern China. Agric. Ecosyst. and Environ. 297, 106951. doi:10.1016/j.agee.2020.106951
Friedlingstein, P., O'sullivan, M., Jones, M. W., Andrew, R. M., Bakker, D. C., Hauck, J., et al. (2023). Global carbon budget 2023. Earth Syst. Sci. Data 15 (12), 5301–5369. doi:10.5194/essd-15-5301-2023
He, M., Li, Y., Zong, S., Li, K., Han, X., and Zhao, M. (2023). Life cycle assessment of carbon footprint of green tea produced by smallholder farmers in Shaanxi province of China. Agronomy 13 (2), 364. doi:10.3390/agronomy13020364
He, M. B., Zong, S. X., Li, Y. C., Ma, M. M., Ma, X., Li, K., et al. (2022). Carbon footprint and carbon neutrality pathway of green tea in China. Adv. Clim. Change Res. 13 (3), 443–453. doi:10.1016/j.accre.2022.04.001
Kabir, M., Habiba, U. E., Khan, W., Shah, A., Rahim, S., Patricio, R., et al. (2023). Climate change due to increasing concentration of carbon dioxide and its impacts on environment in 21st century; a mini review. J. King Saud University-Science 35 (5), 102693. doi:10.1016/j.jksus.2023.102693
Kalita, R. M., Das, A. K., and Nath, A. J. (2019). Role of smallholder tea growers in carbon sink management. Curr. Sci. 116 (9), 1560–1566. doi:10.18520/cs/v116/i9/1560-1566
Kalita, R. M., Das, A. K., Sileshi, G. W., and Nath, A. J. (2020). Ecosystem carbon stocks in different aged tea agroforestry systems: implications for regional ecosystem management. Trop. Ecol. 61, 203–214. doi:10.1007/s42965-020-00084-8
Kamyab, H., SaberiKamarposhti, M., Hashim, H., and Yusuf, M. (2024). Carbon dynamics in agricultural greenhouse gas emissions and removals: a comprehensive review. Carbon Lett. 34 (1), 265–289. doi:10.1007/s42823-023-00647-4
Li, F., Zhou, J., Wei, W., and Yin, L. (2023). Spatial distribution pattern and evolution characteristics of elderly population in Wuhan based on census data. Land 12 (7), 1350. doi:10.3390/land12071350
Li, Q., Zhang, J., Ye, J., Liu, Y., Lin, Y., Yi, Z., et al. (2024). Biochar affects organic carbon composition and stability in highly acidic tea plantation soil. J. Environ. Manag. 370, 122803. doi:10.1016/j.jenvman.2024.122803
Li, S., Wu, X., Xue, H., Gu, B., Cheng, H., Zeng, J., et al. (2011). Quantifying carbon storage for tea plantations in China. Agric. Ecosyst. and Environ. 141 (3-4), 390–398. doi:10.1016/j.agee.2011.04.003
Liang, L., Ridoutt, B. G., Wang, L., Xie, B., Li, M., and Li, Z. (2021). China’s tea industry: net greenhouse gas emissions and mitigation potential. Agriculture 11 (4), 363. doi:10.3390/agriculture11040363
Liu, Y., Liu, H., Xu, W., Wang, L., Wang, Q., Ou, G., et al. (2024). Advances and challenges of carbon storage estimation in tea plantation. Ecol. Inf. 81, 102616. doi:10.1016/j.ecoinf.2024.102616
Maestre, F. T., and Cortina, J. (2002). Spatial patterns of surface soil properties and vegetation in a Mediterranean semi-arid steppe. Plant soil 241, 279–291. doi:10.1023/a:1016172308462
Nazir, M. J., Li, G., Nazir, M. M., Zulfiqar, F., Siddique, K. H., Iqbal, B., et al. (2024). Harnessing soil carbon sequestration to address climate change challenges in agriculture. Soil Tillage Res. 237, 105959. doi:10.1016/j.still.2023.105959
Pang, J., Li, H., Tang, X., and Geng, J. (2019). Carbon dynamics and environmental controls of a hilly tea plantation in Southeast China. Ecol. Evol. 9 (17), 9723–9735. doi:10.1002/ece3.5504
Phukan, M., Savapondit, D., Hazra, A., Das, S., and Pramanik, P. (2018). Algorithmic derivation of CO2 assimilation based on some physiological parameters of tea bushes in North-East India. Ecol. Indic. 91, 77–83. doi:10.1016/j.ecolind.2018.03.091
Pramanik, P., and Phukan, M. (2020). Assimilating atmospheric carbon dioxide in tea gardens of northeast India. J. Environ. Manag. 256, 109912. doi:10.1016/j.jenvman.2019.109912
Psistaki, K., Tsantopoulos, G., and Paschalidou, A. K. (2024). An Overview of the role of forests in climate change mitigation. Sustainability 16 (14), 6089. doi:10.3390/su16146089
Qin, M., and Wang, Z. G. (2014). Development of tea industry in fujian province and its prospect. Agric. Outlook 10 (09), 48–53. doi:10.3969/j.issn.1673-3908.2014.09.009
Raihan, A. (2023). A review of climate change mitigation and agriculture sustainability through soil carbon sequestration. J. Agric. Sustain. Environ. ISSN 2997, 23–56. doi:10.56556/jase.v2i2.783
Raza, A., Hu, Y., and Lu, Y. (2024). Improving carbon flux estimation in tea plantation ecosystems: a machine learning ensemble approach. Eur. J. Agron. 160, 127297. doi:10.1016/j.eja.2024.127297
Rebello, R., Burgess, P. J., and Girkin, N. T. (2022). Identifying sustainable nitrogen management practices for tea plantations. Nitrogen 3 (1), 43–57. doi:10.3390/nitrogen3010003
Shao, S., Li, Y., Li, Z., Ma, X., Zhu, Y., Luo, Y., et al. (2024). Impact of tea tree cultivation on soil microbiota, soil organic matter, and nitrogen cycling in mountainous plantations. Agronomy 14 (3), 638. doi:10.3390/agronomy14030638
Stocker, T. (2014). Climate change 2013: the physical science basis: working group I contribution to the fifth assessment report of the intergovernmental panel on climate change. Cambridge: Cambridge University Press.
Sun, X., Yang, G., and Xu, X. (2014). Carbon flux characteristics of tea garden ecosystem in hilly area of western Taihu Basin. J. Ecol. 33, 2072. doi:10.13292/j.1000-4890.2014.0188
Sun, Z. (2018). Innovation mechanism and propelling direction of forest carbon sink in fujian province. Agric. Outlook 14 (08), 92–96. doi:10.3969/j.issn.1673-3908.2018.08.019
Tang, L., Li, J., Chen, H., Chen, M., Zeng, X., and Zhang, Z. (2024). Spatiotemporal pattern and driving factors of net carbon sink in planting industry in the Western Development region. Environ. Sci., 1–19. doi:10.13227/j.hjkx.202407194
Ul Haq, S., Boz, I., Shahbaz, P., and Yıldırım, Ç. (2020). Evaluating eco-efficiency and optimal levels of fertilizer use based on the social cost and social benefits in tea production. Environ. Sci. Pollut. Res. 27, 33008–33019. doi:10.1007/s11356-020-09533-2
Wang, D., Wu, B. S., Li, F., Li, X., Wang, Z., Hou, J., et al. (2023). Soil organic carbon stock in China’s tea plantations and their great potential of carbon sequestration. J. Clean. Prod. 421, 138485. doi:10.1016/j.jclepro.2023.138485
Wang, M., Zhao, J., Chen, J., Zhang, X., and Zhu, S. (2024). Soil organic carbon content and its relationship with the stand age in tea plantations (camellia sinensis L.) in fujian province, China. Land 13 (6), 834. doi:10.3390/land13060834
Wang, S., Liu, X., Cui, H., Liu, Q., Hu, C., and Zhang, J. (2024). Spatiotemporal evolution of carbon source/sink in farmland ecosystem: a case study in Heilongjiang Province. China Land Resour. Econ. 37, 4–13+88. doi:10.19676/j.cnki.1672-6995.000958
Wang, W., and Yang, Y. (2024). Spatial-temporal differentiation characteristics and driving factors of China's energy eco-efficiency based on geographical detector model. J. Clean. Prod. 434, 140153. doi:10.1016/j.jclepro.2023.140153
Wei, W., Guo, Z., Zhou, L., Xie, B., and Zhou, J. (2020). Assessing environmental interference in northern China using a spatial distance model: from the perspective of geographic detection. Sci. Total Environ. 709, 136170. doi:10.1016/j.scitotenv.2019.136170
Xu, Q., Hu, K., Wang, X., Wang, D., and Knudsen, M. T. (2019). Carbon footprint and primary energy demand of organic tea in China using a life cycle assessment approach. J. Clean. Prod. 233, 782–792. doi:10.1016/j.jclepro.2019.06.136
Xue, H., Ren, X., Li, S., Wu, X., Cheng, H., Xu, B., et al. (2013). Assessment of private economic benefits and positive environmental externalities of tea plantation in China. Environ. Monit. Assess. 185, 8501–8516. doi:10.1007/s10661-013-3191-6
Yuan, L., Zhang, J., and Qin, J. (2024). Study on spatiotemporal evolution and spatial differentiation pattern of carbon sink in tea industry in China. J. Tea Sci. 44. doi:10.13305/j.cnki.jts.2024.01.011
Zhang C Y, C. Y., Zhao, L., Zhang, H., Chen, M. N., Fang, R. Y., Yao, Y., et al. (2022). Spatial-temporal characteristics of carbon emissions from land use change in Yellow River Delta region, China. Ecol. Indic. 136, 108623. doi:10.1016/j.ecolind.2022.108623
Zhang, M., Yonggen, C. H. E. N., Dongmei, F. A. N., Qing, Z. H. U., Zhiqiang, P. A. N., Kai, F. A. N., et al. (2017). Temporal evolution of carbon storage in Chinese tea plantations from 1950 to 2010. Pedosphere 27 (1), 121–128. doi:10.1016/s1002-0160(15)60098-4
Zhang, Y., Jiang, P., Cui, L., Yang, Y., Ma, Z., Wang, Y., et al. (2022). Study on the spatial variation of China’s territorial ecological space based on the standard deviation ellipse. Front. Environ. Sci. 10, 982734. doi:10.3389/fenvs.2022.982734
Keywords: tea garden carbon Sinks, spatial and temporal variation, Geoprobes, driving factors, incremental carbon sinks
Citation: Pan Y, Bao J, Ji Y, Li W, Lin W, Fan S and Mao L (2025) Study on the incremental carbon sink of tea plantations under spatio-temporal variation characteristics. Front. Environ. Sci. 13:1561698. doi: 10.3389/fenvs.2025.1561698
Received: 16 January 2025; Accepted: 20 February 2025;
Published: 05 March 2025.
Edited by:
Jason Grant, Virginia Tech, United StatesReviewed by:
Jianhong Fan, Guangdong University of Technology, ChinaCopyright © 2025 Pan, Bao, Ji, Li, Lin, Fan and Mao. This is an open-access article distributed under the terms of the Creative Commons Attribution License (CC BY). The use, distribution or reproduction in other forums is permitted, provided the original author(s) and the copyright owner(s) are credited and that the original publication in this journal is cited, in accordance with accepted academic practice. No use, distribution or reproduction is permitted which does not comply with these terms.
*Correspondence: Wen Li, bGl3ZW5AZmFhcy5jbg==; Shuisheng Fan, c2h1aXNoZW5nQGZhZnUuZWR1LmNu; Liyu Mao, bXk2ODZAZmFmdS5lZHUuY24=
†These authors have contributed equally to this work
Disclaimer: All claims expressed in this article are solely those of the authors and do not necessarily represent those of their affiliated organizations, or those of the publisher, the editors and the reviewers. Any product that may be evaluated in this article or claim that may be made by its manufacturer is not guaranteed or endorsed by the publisher.
Research integrity at Frontiers
Learn more about the work of our research integrity team to safeguard the quality of each article we publish.