
94% of researchers rate our articles as excellent or good
Learn more about the work of our research integrity team to safeguard the quality of each article we publish.
Find out more
ORIGINAL RESEARCH article
Front. Environ. Sci., 07 March 2025
Sec. Freshwater Science
Volume 13 - 2025 | https://doi.org/10.3389/fenvs.2025.1557004
This article is part of the Research TopicNitrate from Field to Stream: Characterization and MitigationView all 13 articles
 Kang Liang1,2*
 Yefang Jiang3
 Keith Fuller4Marcos Cordeiro5Xuesong Zhang2
 Junyu Qi6Xiaoyuan Geng7
 Tao Liu8
 Qian Zhang9Mohammad Amir Azimi10
 Fan-Rui Meng10
Nitrogen pollution in aquatic ecosystems, primarily from agricultural sources, presents significant environmental challenges. At the land management decision level, reducing nitrate leaching requires knowledge of nitrate loading over time and location, the complexity of which is amplified by limited data availability, especially in poorly gauged watersheds. This issue is particularly pronounced in cold and humid regions where water quality data are often collected during the growing season only. Large data gaps result in systematic errors when estimating nitrogen load based on traditional regression methods. In this study, we explore the feasibility of using process-based hydrologic model to estimate nitrate loads from sparse temporal water quality data in a coastal agricultural watershed in Atlantic Canada and compared its performance with three regression methods. We found that the absence of the available 16% non-growing season data during the 10-year study period can lead to significant biases (as high as 21%) in load estimation by regression methods. In contrast, nitrate load estimates obtained with the Soil and Water Assessment Tool (SWAT) were less sensitive to systematic data gaps. The results suggest that process-based models like SWAT can be a viable alternative for nitrate load estimation when limited data is available. As agri-environmental water quality issues become more pressing, it is crucial to use appropriate methods based on data quality and availability to avoid misleading results.
Nitrogen (N) is one of the major pollutants in aquatic ecosystems. Agroecosystems receive approximately 75% of the reactive N generated by human activities to support agricultural productivity (Galloway et al., 2003). A significant proportion of this N (mainly in the form of nitrate) is lost to the environment, adversely affecting the health of aquatic ecosystems due to the limited utilization rate of N fertilizer by crops (Galloway et al., 2008; Odgaard et al., 2019). Reducing nitrate load in aquatic ecosystems has become a critical environmental challenge in many regions, especially those with intensive agricultural production (Milovanovic, 2007; Ongley et al., 2010; Hou et al., 2019).
Decision making at the land management level to reduce nitrogen losses requires detailed knowledge of nitrate loading over time and location. This accuracy is crucial for several reasons: (i) understanding the water quality of downstream environments, (ii) calibrating and validating watershed models, (ii) guiding policy-making for cost-effective pollution control programs, (iii) evaluating the effectiveness of these programs, (iv) assessing long-term N load trends, and (v) estimating riverine fluxes and identifying specific upstream sources (Stenback et al., 2011; Lee et al., 2016; Nguyen et al., 2017). One approach for quantifying nitrate load involves frequent water sampling or taking representative samples that capture the seasonality or major hydrological events at multiple locations. However, nitrate concentrations in such samples are known to be variable and dependent on the flow regime. In addition, the selection of representative samples can be subjective and sampling is often constrained by accessibility and safety concerns, potentially introducing significant uncertainties (Fu et al., 2017).
Nitrate load at the watershed scale results from complex surface and sub-surface biophysiochemical transport processes and can be estimated by integrating measured concentration and discharge data (Zamyadi et al., 2007). The dynamic nature of stream discharge adds to the challenge of accurately quantifying temporal nitrate loads. However, the availability of water quality and stream discharge data is a significant concern, as most watersheds worldwide are poorly gauged or ungauged (Hrachowitz et al., 2013). Estimating nitrate load is subject to various sources of error such as different sampling frequencies and estimation methods.
Significant efforts have been made to explore the optimal sampling frequencies for load estimation (Robertson and Roerish, 1999; Toor et al., 2008; Jiang et al., 2019; Zhang and Hirsch, 2019). It is widely agreed that high-frequency data significantly reduces the uncertainty in estimating constituent loads (Pellerin et al., 2014; Rode et al., 2016). For example, Birgand et al. (2010) suggested that the uncertainty of estimating nitrate flux using averaging or interpolation methods increases with longer sampling intervals, and considerable uncertainty arises when continuous flow data is not used. Zhang and Hirsch (2019) applied a modified version of the weighted regression method, WRTDS_K, to estimate constituent flux under five different sampling regimes, concluding that WRTDS_K performance improves with more available samples. Ideally, continuous measurement of discharge and constituent concentration data is required for accurate flux estimates (Verma et al., 2012). However, continuous measurement is rarely available due to the complexity of water quality measurement, the high cost of monitoring equipment, and the challenges in maintaining continuous monitoring equipment. The deployment and maintenance of continuous monitoring infrastructure/equipment requires ongoing funding and human resources and can be particularly challenging in remote areas or regions with extreme weather. Although daily or more frequent discharge measurements on streams and rivers are often available from environmental protection agencies or specific projects (Ullrich and Volk, 2010; Yang et al., 2019), commonly used sampling frequencies are monthly, bimonthly, event-based, or even less frequent (Zamyadi et al., 2007). Moatar and Meybeck (2005) pointed out that monthly sampling frequency has been the primary strategy of 80% of water quality surveys conducted in France since 1971. In an agricultural basin located in upstream of the Huaihe River, one of China’s largest rivers, total N concentration and discharge data were collected monthly and bimonthly from 2006 to 2011 by the Bureau of Environmental Protection of Zhumadian City (Yang et al., 2016). In Thailand, water quality data was captured three to four times annually by Pollution Control of Thailand (Yadav et al., 2019). These studies indicated that discrete sampling regimes are still widely used. Globally, an accurate estimate of nitrate flux remains challenging due to limited data availability. Discrete sampling does not fully capture the concentration-discharge range, particularly during extreme wet or dry periods, when the concentration-discharge relationship varies significantly (Pellerin et al., 2014). Hirsch (2014) suggested that using a single method across a wide range of cases can result in a mixture of unbiased and severely biased results. Using the appropriate method, therefore, becomes a critical step in accurate load estimation.
Numerous approaches have been developed and applied for constituent load estimation (Verhoff et al., 1980; Ferguson, 1986; Preston et al., 1989; Mattikalli and Richards, 1996; Arnold et al., 1998; Runkel et al., 2004; Hirsch et al., 2010; Li et al., 2020). These approaches can be broadly classified into statistical methods, process-based models, and remote sensing/GIS methods. Statistical approaches explore certain statistical relationships between flow and constituent concentration and can be further categorized (Guo et al., 2002; Moatar and Meybeck, 2005; Verma et al., 2012) into averaging methods and interpolation/extrapolation methods, ratio estimators, regression-based methods, and data mining methods. Averaging methods calculate flux using mean concentration and mean flow. This approach is simple and straightforward but the calculated results can be substantially biased when insufficient data are used (Zamyadi et al., 2007). Interpolation/extrapolation approaches assumes that instantaneous concentration or flow data are representative of much longer periods (Moatar and Meybeck, 2005). Linear interpolation (LI) is a simple and straightforward approach that assumes the change of concentration between two adjacent data points follows a linear pattern. However, the accuracy of LI can be highly sensitive to the number and timing of samples. Ratio estimators use flow data as the independent variable and load as the dependent variable (Guo et al., 2002). Regression-based techniques utilize expected patterns of covariance between concentrations and flow and/or time (Lee et al., 2016), while data mining methods are relatively user-friendly, given that they are not constrained by data assumptions or the number of parameters used (Li et al., 2020). LOADEST (Load Estimator) (Cohn et al., 1992; Runkel et al., 2004) and the WRTDS (Hirsch et al., 2010) are widely used regression methods for constituent load estimation. LOADEST applies multiple regression techniques that accounts for changes in streamflow, season, and time (Cohn et al., 1992). WRTDS uses weighted regressions that give more relevance to closer and more relevant data points, making it better at adapting to changing environmental conditions (Hirsch et al., 2010). Both methods are easy to apply and can handle larger datasets and incorporate effects like seasonality and flow conditions, which are critical for accurate load estimation. However, their accuracy is also dependent on high-frequency data. Process-based models incorporate the underlying biophysicochemical processes (e.g., plant growth, leaching, runoff, nitrification/denitrification, etc.), using mathematical equations to represent the movement of water and the transport and transformation of chemicals at the field or watershed scale (Brilli et al., 2017). A relatively complete suite of biogeochemical processes is generally embedded in these models. Additionally, many of these models incorporate watershed characteristics such as soil, topography, climate, land cover/land use, and/or management operations into models (Ator and Garcia, 2016; Molina-Navarro et al., 2018; Sorando et al., 2019; Liang et al., 2020; Cordeiro et al., 2022). The Soil and Water Assessment Tool (SWAT) is one of the most widely applied process-based watershed models for water quality and water quality estimation (Gassman et al., 2014; Fu et al., 2019) due to its relatively complete representation of biogeochemical processes of watershed (Neitsch et al., 2011; Gassman et al., 2014). While the model offers a detailed simulation of watershed processes, SWAT requires extensive data input and high computational resources, especially when applied over large watersheds.
Many studies have been conducted to evaluate commonly-used process-based models (Borah and Bera, 2003; Brilli et al., 2017; Fu et al., 2019), or the relative performance of different statistical methods in predicting constituent load (Preston et al., 1989; Cohn, 1995; Guo et al., 2002; Moatar and Meybeck, 2005; Lee et al., 2016; Lee et al., 2019; Li et al., 2020; Saha et al., 2024). No method appears to offer a consistent advantage over others under all circumstances, especially when dealing with sparsely collected data. Markus et al. (2014) pointed out that it is difficult to estimate load with regression methods for extreme dry or wet periods given that these periods typically are not well represented by historical records. Using linear interpolation to calculate nitrate loads from discrete samples can be particularly sensitive to the timing and number of discrete samples (Aulenbach and Hooper, 2006).
In this study, we applied the physically-based SWAT model and three statistical models—linear interpolation (LI), LOADEST, and WRTDS_K—to estimate nitrate loads in a typical agricultural region in Prince Edward Island (PEI), Canada. The primary goal is to examine the variability of different methods in nitrate load estimation when only sparse measurements are available and identify the most suitable load estimation method, which has broad relevance to nitrate load estimation in regions with a similar setting.
In cold and humid regions such as Atlantic Canada, water samples are primarily collected during the growing season when the water is not frozen, and sites are more accessible. According to the public data from the Department of Environment of Prince Edward Island (PEI) (https://www.princeedwardisland.ca/en/service/view-surface-water-quality), 11 stations across the province consistently recorded water quality data from 2011 to 2020. On average, each station collected 7.3 nitrate concentration samples annually, with 6.1 (83.5%) of these samples taken during the growing season (May to October). Estimating nitrate load during the cold/wet seasons using data from the warm/dry seasons poses significant challenges, as historical studies indicate strong seasonality in stream discharge and nitrate loss in this region (Bugden et al., 2014; Liang et al., 2019a; Oliver et al., 2024). Previous research has shown that nitrate loss from croplands mainly occurs during the non-growing season (late fall, winter, and early spring) in PEI, when evapotranspiration is low and crop uptake is reduced, resulting in more water and nitrogen being lost to groundwater and surface water bodies (Bugden et al., 2014; Liang et al., 2019a). Therefore, identifying an appropriate method for estimating nitrogen load in regions such as PEI becomes critically important.
This study was conducted in the Dunk River Watershed (DRW) in the Atlantic Canada province Prince Edward Island (Figure 1). The drainage area of the watershed is approximately 143 km2, 80% of which is under agricultural production with a long history of fertilizer application (Figure 1). Agricultural land use is dominated by potatoes in rotation with forages and grains. The climate in this region is characterized as humid with a cool to mild temperature regime (Köppen-Geiger Dfb, data from WorldClim.org). The annual (1999–2020) precipitation ranged from 951 mm (2001) to 1,488 mm (2009) with an average of 1,281 mm, approximately 24% of which was in the form of snow in the dormant season (Dec - Mar) based on data from the New Glasgow weather station (46.41N, 63.35W). Discharge and water quality data have been monitored by Environment and Climate Change Canada (ECCC) and the provincial Department of Environment through the DUNK RIVER AT WALL ROAD station (Station ID: 01CB002 and SSH 51; location: 46.35N, 63.63W) near the outlet of the watershed. Long-term daily streamflow data has been monitored, and water samples have been collected for water quality analysis at monthly or biweekly intervals mainly in the non-frozen season, which is generally between April and November. The analysis was carried out using data from the period of 2011–2020, during which about 6∼10 water samples were collected for water chemistry analysis annually. Such a sampling strategy is a common approach in Canada (Quilbé et al., 2006) due to the challenge of sampling in the long and cold winter season. However, as illustrated in Figure 1, the discharge of Dunk River and other rivers in the region is variable, especially during the winter months because of the combined effects of low evapotranspiration, snow precipitation, and freeze-thaw events. This lack of water quality data and the large variation in discharge in the non-growing season make the estimation of nitrate load in the region challenging.
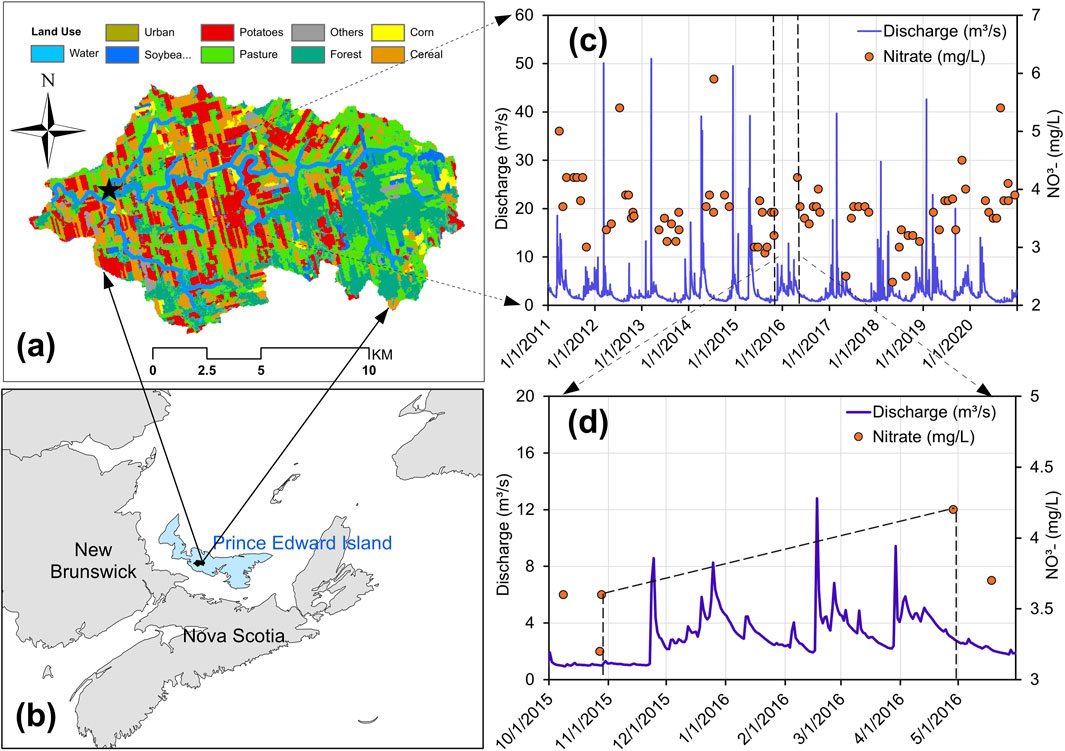
Figure 1. Discharge and nitrate concentration of the Dunk River Watershed (A) in central west Prince Edward Island (B), Canada. Daily discharge data were available (C), but water quality data were missing during the late fall–winter–early spring seasons (i.e., in 2015/2016) (D).
The process-based watershed model SWAT2012 (Arnold et al., 1998), and three statistical methods including linear interpolation (LI), LOADEST (Runkel et al., 2004) and WRTDS_K (Hirsch et al., 2010; Zhang and Hirsch, 2019) were used to estimate the nitrate load of the Dunk River Watershed between 2011 and 2020.
The SWAT model is a widely recognized watershed hydrological model developed to predict the impact of climate, land use, and management practices on water, sediment, and chemical yields in complex watersheds with varying soils, land use, landscape, and management conditions over long periods (Arnold et al., 1998; Gassman et al., 2014; Fu et al., 2019). Being a physically based model, SWAT requires detailed spatial data, including the Digital Elevation Model (DEM), soil properties, land use, and weather as model input. By dividing a watershed into multiple sub-basins and further into Hydrologic Response Units (HRUs), SWAT simulates the water cycle and associated nutrient flows. Due to its capacity and flexibility, SWAT has been broadly used for (1) evaluation of water resources or/and water quality status (Awotwi et al., 2019; Bauwe et al., 2019); (2) contaminant source analysis (Risal and Parajuli, 2019; Liang et al., 2020); (3) scenario analysis such as land use, management practices, climate variability, etc. (Yang and Best, 2015; Wagena et al., 2018; Chen et al., 2019; Wang et al., 2020); (4) evaluation of existing or inform future management practices (Moriasi et al., 2013; El-Khoury et al., 2015; Qi et al., 2018; Liang et al., 2019b; Liang et al., 2023); (5) and tracing drivers of water pollution (Li et al., 2009; Ouyang et al., 2018).
The SWAT model was setup using the ArcSWAT 2012 interface under ArcGIS 10.5.1. with detailed annual land use from 2011 to 2020 and calibrated and validated against daily streamflow, baseflow, and nitrate load for the study period using the SUFI-2 algorithm within the SWAT Calibration and Uncertainty Procedure (SWAT-CUP 2019) (Abbaspour et al., 2015). Soil data was derived from the National Soil DataBase (NSDB) of Canada. Annual land use data was obtained from the Annual Crop Inventory maps published by Agriculture and Agri-Food Canada from 2011 to 2020 (available at http://www.agr.gc.ca/atlas/aci/). Weather data including precipitation, maximum and minimum daily temperature, wind speed, solar radiation, and relative humidity were obtained from the New Glasgow station (46.41, −63.35) of ECCC. Gupta et al. (1999) proposed that logarithmic transformation enhances the sensitivity to changes in low-flow conditions by amplifying low flows and dampening high flows. Therefore, log-transformed discharge and baseflow data were used for calibration. The model was calibrated for daily discharge and nitrate from 2011 to 2016 and validated from 2017 to 2020.
The goodness-of-fit of the SWAT simulations on streamflow and nitrate load was evaluated using the Nash-Sutcliffe Efficiency (NSE), percent bias (PBIAS) and the coefficient of determination (R2). NSE is a widely used statistical parameter for assessing the goodness of fit of hydrologic models (Moriasi et al., 2007). The NSE ranges from -∞ to 1, where 1 indicates a perfect match between simulation and observation. PBIAS measures the average tendency of the simulated values to be larger or smaller than observations. Low magnitude PBIAS indicate better simulation with zero as the optimum value. Positive PBIAS values indicate model overestimation and negative PBIAS values indicate model underestimation (Gupta et al., 1999). The R2 provides a measure of how well the observed data is explained by the model, with R2 ranging from 0 to 1.
Linear interpolation uses concentration data to estimate the missing data, and it assumes a linear relationship between two adjacent concentration data points (Equation 1). Among flux estimation methods, the LI method is one of the simplest methods and has been broadly used to estimate constituent concentration/load in many studies, and there have been very few comparable evaluations of interpolation methods (Hirsch, 2014). However, the uncertainty of this method is that it ignores the influence of discharge and the fact that two adjacent data points may have been collected under vastly different hydrologic conditions.
where
The LOADEST is a regression-based model specifically designed for estimating constituent loads in rivers and streams by the US Geological Survey (USGS) (Cohn et al., 1992; Runkel et al., 2004). LOADEST has various levels of complexity depending on the use of fewer, or more, explanatory variables (Runkel et al., 2004). A complex form of LOADEST, the 7-parameter model was used in this study as it has been shown to perform well in relatively large watersheds (Cohn et al., 1992). The model uses multiple linear regression to fit the variables, including streamflow, streamflow squared, season (first-order Fourier series represented by sine and cosine terms), time, and time squared (Equation 2).
where
The LOADEST model requires nitrate concentration and stream discharge data as input to predict load. There are three statistical methods for estimating LOADEST regression model coefficients during calibration: Adjusted Maximum Likelihood Estimation (AMLE), Maximum Likelihood Estimation (MLE), and Least Absolute Deviation (LAD). The AMLE and MLE methods are used when the calibration model errors or residuals follow a normal distribution, while LAD is typically used when the errors are randomly distributed. LOADEST has been widely applied in the U.S. and beyond to estimate daily constituent load for a variety of water quality parameters under different sample sizes and sampling strategies (Park and Engel, 2015; Chen et al., 2022; Saha et al., 2024).
Similar to LOADEST, the WRTDS model was also developed by the USGS and is one of the commonly used regression methods for estimating constituent load (Hirsch et al., 2010). The WRTDS is an advanced regression-based approach, incorporating time, discharge, and season to predict constituent concentrations (Equation 3).
where
WRTDS uses weighted regression to estimate the coefficients of Equation 3. Unlike LOADEST, the equation for WRTDS is estimated many times for a given dataset allowing the regression coefficients to vary across the time and discharge domain. The weight of each observation is based on the relevance of that observation to the estimation point. The relevance of each observation is defined by distances between the observation point and estimation point with respect to time, discharge, and season. And the weighted distance is measured through three dimensions, which are the time distance, seasonal distance and discharge distance (Hirsch et al., 2010). In this study, we applied the modified version of WRTDS, known as the WRTDS_Kalman Filter (WRTDS_K), which has shown improved performance over WRTDS due to the incorporation of autocorrelation information in model residuals on sampled days (Lee et al., 2019; Zhang and Hirsch, 2019). Hirsch et al. (2010) suggested using at least 100 observations with nonzero weight. To meet this data requirement, the nitrate and discharge datasets from 1999 to 2020 were used for nitrate load estimation by WRTDS_K.
Statistical analysis was carried out by using R 4.2.2. The WRTDS_K was implemented through an R package EGRET (Exploration and Graphics for RivEr Trends); a detailed description of the package is provided in Hirsch and De Cicco (2015). LOADEST was executed using the FORTRAN program available on the USGS website: https://water.usgs.gov/software/loadest/download/. Linear interpolation was performed using the approx function in R. The mean, median, and standard deviation of daily nitrate load estimated by different methods was analyzed. Analysis of Variation (ANOVA) and correlation analysis was performed to explore the relationship between daily nitrate load estimated by different models, with p < 0.05 considered to be statistically significant.
We calibrated the SWAT model using measurements of streamflow, baseflow, and nitrate load from 2011 to 2017, and subsequently validated the model with data from 2018 to 2020. Moriasi et al. (2007) recommended that model performance can be considered satisfactory if R2 > 0.50, PBIAS ≤ ±25%, and NS > 0. 50 for monthly simulation. The model’s performance in predicting flow and nitrate load met the recommended standard. During the calibration phase, the NSE, PBIAS, and R2 values were 0.6, 17.4%, and 0.65 for streamflow, respectively. Comparable results were seen during the validation phase, with NSE, PBIAS, and R2 values of 0.59, 11%, and 0.61. The baseflow predictions during calibration, the NSE, PBIAS, and R2 values were 0.43, 8.6%, and 0.6. During the validation phase, with NSE, PBIAS, and R2 values of 0.62, −5.6%, and 0.68, respectively. For nitrate load predictions, the calibration period saw NSE, PBIAS, and R2 values of 0.71, 6.5%, and 0.70. During the validation period, similar values were recorded: NSE of 0.67, PBIAS of −5.5%, and R2 of 0.68.
Large differences in nitrate load estimation were found between the four methods during the 10-year study period (Figure 2). The variations in nitrate load were correlated with changes in discharge, with high flow often corresponding to high nitrate flux, and vice versa. Although nitrate concentration decreased due to the dilution effect of high flow, total nitrate exported from the watershed still increased as a result of the high flow. Overall, high flow was primarily observed from late autumn to spring. This finding is consistent with other studies conducted in similar climates (Devito et al., 1996; Devito et al., 2005; Tan and Zhang, 2011; Qi et al., 2016). Peak flows are mostly observed during late autumn to spring in response to diminished evapotranspiration, rainfall, and snowmelt. The variation in timing and magnitude of precipitation, evapotranspiration, and runoff are therefore important drivers of the seasonal variation in streamflow. Summer precipitation (June to August) accounted for only 20.4% of annual precipitation. Evapotranspiration tends to be in excess of precipitation only in the summer under cold and humid climates (Devito et al., 1996).
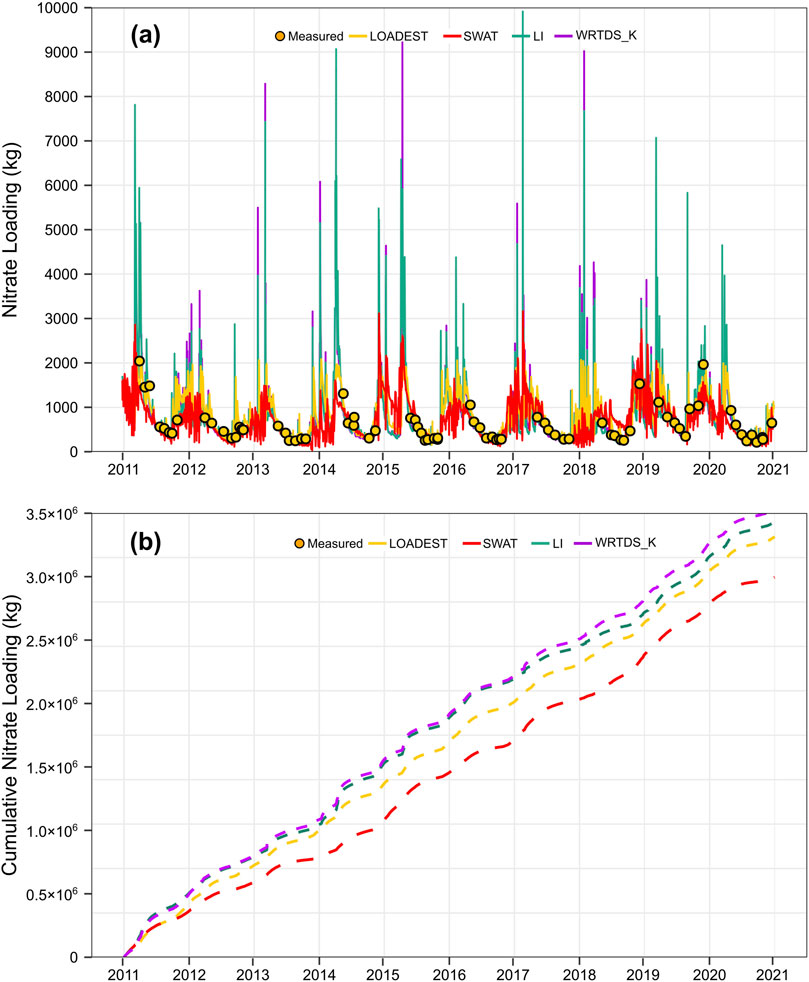
Figure 2. Daily (A) and accumulated nitrate load (B) of the Dunk River watershed estimated by LI (linear interpolation), LOADEST, WRTDS_K, and SWAT from 2011 to 2020.
During the growing/low flow season, nitrate load estimates from the four methods provided reasonable approximations, compared with observed loads, which were calculated from the measured nitrate concentration and discharge data on specific days. The range of daily nitrate load for SWAT and LOADEST was 17–3,149 and 148–2,083 kg day−1, respectively, compared with 163–15,383 and 178–14,702 kg day−1 for LI and WRTDS_K. The major differences among the four methods occurred primarily during high flow seasons when no observed nitrate concentration data were available. SWAT and LOADEST demonstrated relatively similar patterns in the range of estimated load and were substantially lower and narrower than those of LI and WRTDS_K. The average estimated daily nitrate loads during the 10 years are 703 ± 443, 778 ± 424, 806 ± 910, and 829 ± 892 kg day−1 for SWAT, LOADEST, LI, and WRTDS_K, respectively (Table 1). The lowest loads typically occurred in August or September, while the highest loads usually occurred in March or April. As also indicated in Figure 2, the accumulated nitrate load estimated by WRTDS_K and SWAT are consistently the highest and the lowest among the four methods. The discrepancies between different methods increases over time especially during high flow periods. For the entire 10-year period, accumulated nitrate flux estimated by LOADEST, LI, and WRTDS_K was 10.7%, 14.7%, and 18.0% higher than the SWAT model.
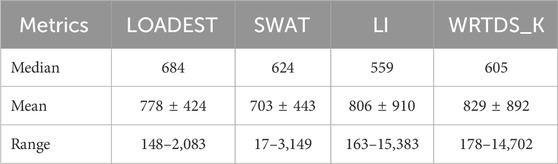
Table 1. Daily nitrate load (kg/day) estimated by LOADEST, SWAT, LI, and WRTDS_K between 2011 and 2020.
Nitrate loads varied significantly between growing and non-growing season months across all methods (Figure 3). The daily nitrate load peaks in April, were 1,293, 1,024, 1,697, and 1,683 kg day⁻1 for LOADEST, SWAT, LI, and WRTDS_K, respectively. By contrast, during August and September, daily nitrate loads decrease to below 400 kg day⁻1 across all methods. Generally, the estimates from the four methods are similar during the growing season, when measured nitrate data are available. However, there are substantial differences among models for the non-growing season months (Figures 3, 4).
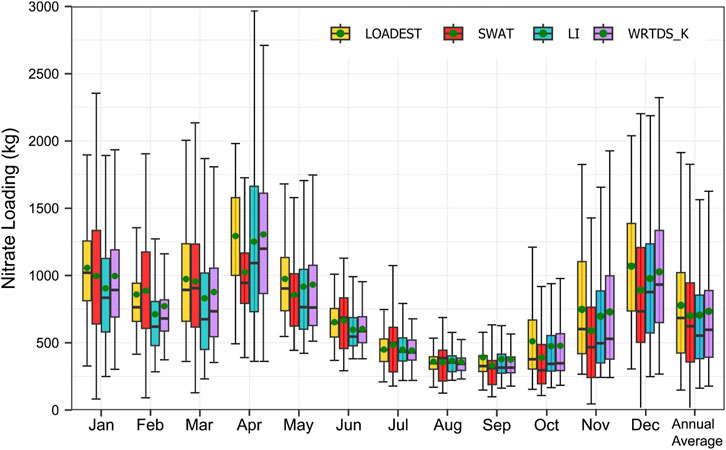
Figure 3. Boxplot of mean daily nitrate load by month, estimated for the study period by LOADEST, SWAT, LI, and WRTDS_K. The horizontal line inside boxes represents the median value of nitrate load. Red dots indicate the mean nitrate load estimated by each model.
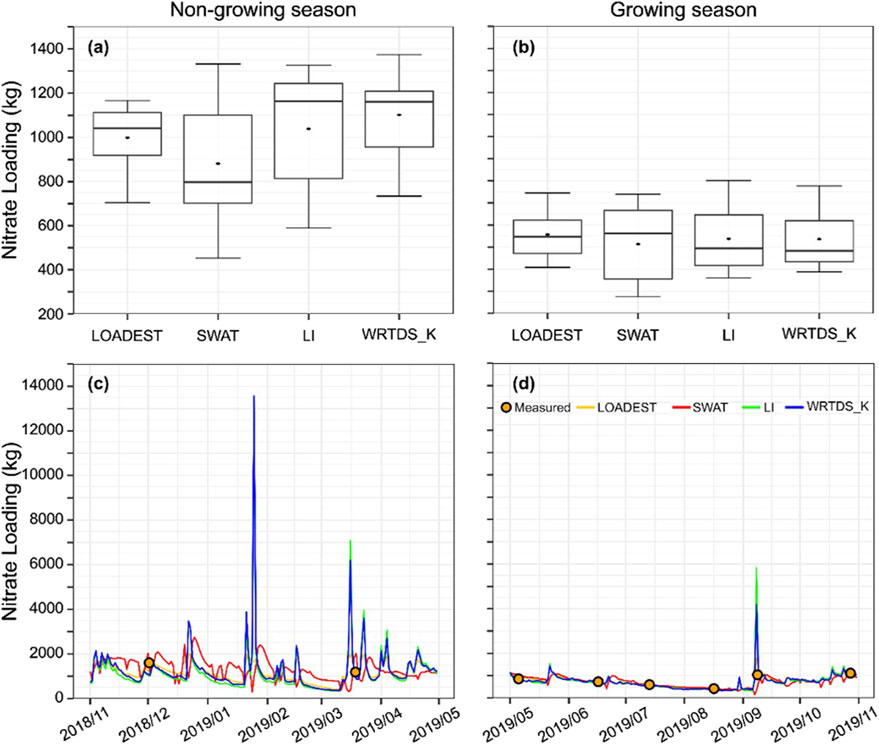
Figure 4. Non-growing season (A) and growing season (B) nitrate loads estimated by different methods. (C, D) show the in-season variation of daily nitrate load estimated by different methods.
Results of ANOVA test indicate that daily nitrate load estimated by WRTDS_K and LI are significantly higher than that by SWAT (p < 0.01), while LI and LOADEST do not show a significant difference. Notably, the largest discrepancies between the regression methods and SWAT were found in 2014. Nitrate flux estimated by LI and WRTDS_K was higher than that estimated by SWAT by as much as 65.6% and 62.3%, respectively. Even though the difference of the average daily nitrate load for 2010–2020 was not obvious between SWAT and LOADEST, in some years the load estimated by LOADEST can be substantially higher than SWAT.
Mean growing season nitrate loads were lower and very similar, with values of 514 ± 288, 557 ± 293, 538 ± 365, and 537 ± 341 kg day−1 for SWAT, WRTDS_K, LI, and LOADEST, respectively (Figure 4; Table 2). In contrast, there were major differences in load estimation during the non-growing season. Mean nitrate loads in the non-growing season estimated by SWAT, LOADEST, LI, and WRTDS_K were 894 ± 488, 1,002 ± 419, 1,077 ± 1,178, and 1,126 ± 1,146 kg day−1, respectively (Table 2).
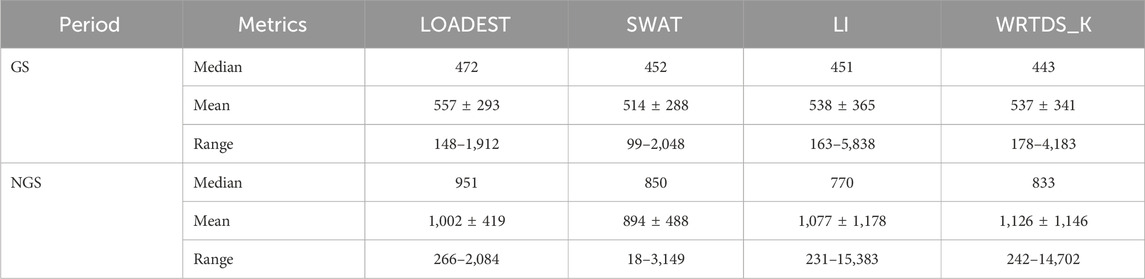
Table 2. Growing season (GS) and non-growing season (NGS) daily nitrate load (kg/day) predicted by LOADEST, SWAT, LI, and WRTDS_K between 2011 and 2020.
Since nitrate loads were estimated primarily based on growing season data, the correlations between nitrate load estimates by different methods are stronger during the growing season than in the non-growing season. At a seasonal level, correlation analysis reveals that LOADEST, LI, and WRTDS_K exhibit a very strong correlation in both the growing and non-growing seasons (Figure 5), with correlation indices above 0.9. The strongest correlation is between LI and WRTDS_K, with indices exceeding 0.97 in both seasons. Although the nitrate load estimated by SWAT showed a weaker correlation with the regression methods, its strongest correlation was with LOADEST, with correlation indices of 0.77 in the growing season and 0.63 in the non-growing season.
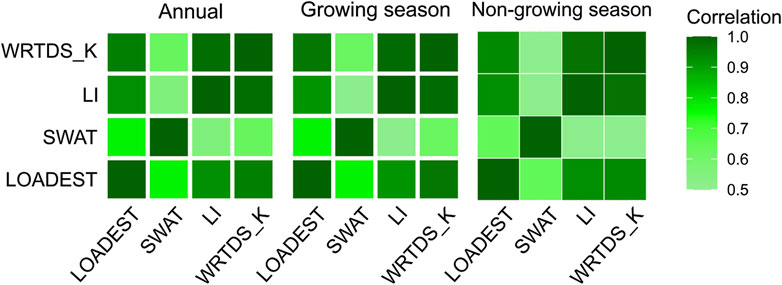
Figure 5. Correlation heatmap of nitrate load estimated by different methods.
Over the 10-year period, there were 76 water quality data points, with 64 (or 84%) of them falling within the growing season. To assess the variability of nitrate load estimations by these four methods when non-growing season data are completely missing, we removed the 12 non-growing season data points. The removal of non-growing season data conversely led to significant variation in estimated nitrate load for the non-growing season by the regression methods. For instance, the average daily non-growing season nitrate load estimated by LOADEST decreased by 21%, from 1,002 kg day−1–831 kg day−1. Similarly, the average daily non-growing season nitrate load estimated by WRTDS_K decreased by 18%, from 1,126 kg day−1 –957 kg day−1. A slight decrease was observed for LI, with the average daily nitrate load decreasing by 1.8%, from 1,076 kg day−1–1,057 kg day−1. The removal of non-growing season data had little to no impact on the estimation of growing season nitrate load by regression methods. With LOADEST and WRTDS_K, the average daily nitrate load decreased by 6.5% and 0.4%, respectively. However, the removal of non-growing season data for calibration had minimal impact on SWAT, for both the growing and non-growing seasons.
Discrete sampling has been a common strategy worldwide, particularly in cold and humid regions such as Atlantic Canada. In these areas, water samples are primarily collected during the warm seasons when the water is not frozen, and sites are more accessible. The highly dynamic nature and strong seasonal trends of water flow make estimating nitrate loads using sparsely measured water quality data a challenging task. Missing non-growing season data can lead to severe biases in load estimation by regression methods. These methods rely on existing data to establish the relationship between flow and constituent concentration and thus estimate load. Conversely, the process-based model SWAT, which is calibrated for flow and nitrogen, simulates the water and nitrogen cycling processes, and thus, can effectively represent the dilution effect of increased stream flow on nitrate mass in the wet seasons.
Nitrate concentrations were higher during the growing season and decreased during the non-growing season. Low nitrate concentrations often occur at times of high flow due to the dilution effect (Sith et al., 2019; Stutter et al., 2008). This observation is also consistent with the historical nitrate data from several watersheds in PEI, where low nitrate concentrations were frequently observed during wet seasons (Jiang et al., 2015). Regression methods generally overestimate nitrate loads during high-flow periods (Duan et al., 2014), which aligns with the results of our current study. This overestimation likely occurs because regression methods use concentration data from low flow periods to interpolate concentrations during high flow periods and cannot effectively account for the dilution effect, leading to an overestimation of both concentration and load. This bias can be amplified during years with significantly higher wet-season precipitation, resulting in high stream discharge during late winter or early spring when the snow melts. Out of the total 1,420 mm of precipitation, 267 mm was attributed to snowfall. Consequently, the nitrate load estimated by LOADEST was 28.2% higher than that estimated by SWAT.
The USGS estimated nitrate-N exported from the Mississippi River during 2004–2006 and found that LOADEST and a composite method estimated loads that were 9% and 16% higher than loads calculated using continuous in situ data (every 2–3 h) (Duan et al., 2014). Additionally, nitrate concentrations below the root zone are often highly variable during warmer months due to fertilizer application. As previously discussed, nitrate concentrations in rivers during the wet season can be significantly lower compared to the growing season. Accordingly, in our study, regression methods using concentration data from dry seasons to estimate concentrations during wet seasons, resulted in overestimation of nitrate loads for wet seasons. Markus et al. (2014) pointed out that modeling loads with regression methods for extreme dry or wet periods is challenging because these periods are typically underrepresented in historical records. It is generally believed that LI has significant uncertainties because it ignores the influence of discharge and the possibility that two adjacent data points may have been collected under vastly different hydrologic conditions (Niedzielski and Halicki, 2023). Using LI to calculate nitrate loads from discrete samples can be particularly sensitive to the timing and number of discrete samples (Aulenbach and Hooper, 2006). Although LOADEST and WRTDS_K models account for seasonality and time, these methods still subject to substantial uncertainty in the non-growing season when there is no measured concentration data available. For example, the strong correlations between LI, LOADEST, and WRTDS_K in load estimations during the non-growing season likely suggest that the LOADEST and WRTDS_K might have also a problem to reliably establish discharge-concentration relationship during this period.
The SWAT model offers a detailed representation of N cycles and incorporates critical watershed input information such as land use, climate, soil properties, and topography data to simulate the hydrologic, chemical, or sediment cycles. In addition, N cycling, being one of the most common SWAT applications, is well represented in terms of processes in the model (Fu et al., 2019). The calibration of daily streamflow, baseflow, and nitrate load together with the detailed watershed information input, makes SWAT likely to provide more reliable nitrate load estimates under conditions of sparse water quality data, compared to other regression methods. However, the model also requires an extensive amount of data for model input and evaluation compared to regression methods, which require only time, discharge, and season of the collected samples.
Surface runoff and baseflow are the two primary processes driving nitrogen loads in PEI. Baseflow/groundwater flow has been reported as a major process that drives nitrogen to rivers, particularly during dry seasons, while runoff plays a more significant role during wet seasons (Jiang et al., 2004; Liang et al., 2020). For example, Liang et al. (2020) reported that in the Wilmot River watershed, which is adjacent to the Dunk River watershed, groundwater contributed 82.3%–99.0% nitrate load under different land uses during the growing season, whereas surface runoff contributed about 11.3%–43.3% of the total nitrate load during the non-growing season. Nitrate loads during the non-growing season were enhanced by runoff resulting from snowmelt events. The calibration of daily streamflow, baseflow, and nitrate load ensures a reasonable estimation of nitrogen transport through groundwater and runoff during both the growing and non-growing seasons. This likely explains the relatively small variation in SWAT’s estimation of nitrogen load compared to regression models after the removal of 20% of the non-growing season data. The large bias of nitrate load estimation by regression models, especially during the non-growing season, results from a lack of fit between concentration and discharge data, coupled with substantial seasonal variability in their relationship. However, numerous studies have demonstrated the advantages of regression models such as LOADEST and WRTDS, especially when a reasonable amount of representative water quality data is available. They are favored for their ease of application and the relatively small effort required for model setup (Chanat et al., 2016; Lee et al., 2016). Our study suggests that caution is needed when applying regression models for constituent load estimation when there is insufficient water quality data to build a representative discharge-constituent concentration relationship. Process-based models such as SWAT could be a better alternative under such circumstances. While there is no universally agreed-upon method for calculating nitrate flux, the use of a more robust tool such as SWAT can help limit these errors. Without leveraging information from SWAT, regression methods may fail to provide reasonable estimates, particularly when the monitoring data are too limited to establish a reliable concentration-discharge relationship., This issue is especially prevalent in regions with high and variable precipitation weather patterns, such as Atlantic Canada.
Nitrate load estimation has been a challenge, particularly in cold and humid regions like Atlantic Canada where data availability is limited and seasonal variations in nitrate loss are pronounced. Our study examined different methods for estimating nitrate loads in the Dunk River watershed in PEI, aiming to identify the most suitable approach for load estimation when the available water quality data is predominantly (>84%) from the growing season. Our study highlights the complexities of nitrate load estimation with limited data availability and confirmed that the absence of the 16% available non-growing season data during the 10-year study period can lead to significant biases in load estimation by regression methods, with biases potentially reaching as high as 21%, while nitrate load estimates obtained with SWAT were found to be less sensitive to systematic data gaps. In such cases, process-based models like SWAT may offer more accurate estimates by incorporating detailed mathematical representations of flow and nitrogen cycles and watershed information calibrated for flow and nitrogen cycles under conditions of limited data availability. Additionally, process-based models also hold the benefits of scenario analysis (e.g., management/land use etc.), source identification, tracing of the drivers of water pollutants, etc. Policymakers and researchers should consider employing hydrological models for nitrate load estimation in situations with limited water quality measurement, despite their requirement for more expertise. However, the choice of estimation method should be dynamic and case-specific, considering the unique characteristics of each watershed and the available data. With agri-environmental water quality issues become increasingly pressing, it is crucial to employ data collection strategies that capture seasonal variations in streamflow and nitrate concentration effectively, especially in regions like Atlantic Canada. By doing so, we can improve our understanding of nitrate load dynamics and develop more effective strategies for mitigating N pollution in aquatic ecosystems.
The raw data supporting the conclusions of this article will be made available by the authors, without undue reservation.
KL: Conceptualization, Data curation, Formal Analysis, Investigation, Methodology, Software, Visualization, Writing–original draft, Writing–review and editing. YJ: Conceptualization, Funding acquisition, Investigation, Methodology, Resources, Supervision, Writing–review and editing. KF: Investigation, Validation, Writing–review and editing. MC: Investigation, Validation, Writing–review and editing. XZ: Investigation, Resources, Writing–review and editing. JQ: Validation, Writing–review and editing. XG: Validation, Writing–review and editing. TL: Validation, Writing–review and editing. QZ: Methodology, Validation, Writing–review and editing. MA: Methodology, Software, Writing–review and editing. F-RM: Conceptualization, Investigation, Methodology, Supervision, Writing–review and editing.
The author(s) declare that financial support was received for the research, authorship, and/or publication of this article. This study was funded by the projects “Using Living Laboratory approach to develop and transfer innovative soil and water quality BMPs in Prince Edward Island” (Grant No. J-002269) and “Reducing sediment, N and P load from arable cropping systems to receiving waters in eastern Canada” (Grant No. J-001270) from Agriculture and Agri-Food Canada.
The authors would like to thank the Environment and Climate Change Canada, Agriculture and Agri-Food Canada, and the provincial government of Prince Edward Island for providing the data used in this study. U.S. Department of Agriculture (USDA) is an equal opportunity provider and employer. Mention of trade names or commercial products in this publication is solely for the purpose of providing specific information and does not imply recommendation or endorsement by the USDA.
The authors declare that the research was conducted in the absence of any commercial or financial relationships that could be construed as a potential conflict of interest.
The author(s) declared that they were an editorial board member of Frontiers, at the time of submission. This had no impact on the peer review process and the final decision.
The author(s) declare that no Generative AI was used in the creation of this manuscript.
All claims expressed in this article are solely those of the authors and do not necessarily represent those of their affiliated organizations, or those of the publisher, the editors and the reviewers. Any product that may be evaluated in this article, or claim that may be made by its manufacturer, is not guaranteed or endorsed by the publisher.
Abbaspour, K. C., Rouholahnejad, E., Vaghefi, S., Srinivasan, R., Yang, H., and Kløve, B. (2015). A continental-scale hydrology and water quality model for Europe: calibration and uncertainty of a high-resolution large-scale SWAT model. J. Hydrology 524, 733–752. doi:10.1016/j.jhydrol.2015.03.027
Arnold, J. G., Srinivasan, R., Muttiah, R. S., and Williams, J. R. (1998). Large area hydrologic modeling and assessment part I: model development 1. J. Am. Water Resour. Assoc. 34 (1), 73–89. doi:10.1111/j.1752-1688.1998.tb05961.x
Ator, S. W., and Garcia, A. M. (2016). Application of SPARROW modeling to understanding contaminant fate and transport from uplands to streams. JAWRA J. Am. Water Resour. Assoc. 52 (3), 685–704. doi:10.1111/1752-1688.12419
Aulenbach, B. T., and Hooper, R. P. (2006). The composite method: an improved method for stream-water solute load estimation. Hydrological Process. An Int. J. 20 (14), 3029–3047. doi:10.1002/hyp.6147
Awotwi, A., Anornu, G. K., Quaye-Ballard, J. A., Annor, T., Forkuo, E. K., Harris, E., et al. (2019). Water balance responses to land-use/land-cover changes in the Pra River Basin of Ghana, 1986–2025. Catena 182, 104129. doi:10.1016/j.catena.2019.104129
Bauwe, A., Kahle, P., and Lennartz, B. (2019). Evaluating the SWAT model to predict streamflow, nitrate loadings and crop yields in a small agricultural catchment. Adv. Geosciences 48, 1–9. doi:10.5194/adgeo-48-1-2019
Birgand, F., Faucheux, C., Gruau, G., Augeard, B., Moatar, F., and Bordenave, P. (2010). Uncertainties in assessing annual nitrate loads and concentration indicators: Part 1. Impact of sampling frequency and load estimation algorithms. Trans. ASABE 53 (2), 437–446. doi:10.13031/2013.29584
Borah, D., and Bera, M. (2003). Watershed-scale hydrologic and nonpoint-source pollution models: review of mathematical bases. Trans. ASAE 46 (6), 1553–1566. doi:10.13031/2013.15644
Brilli, L., Bechini, L., Bindi, M., Carozzi, M., Cavalli, D., Conant, R., et al. (2017). Review and analysis of strengths and weaknesses of agro-ecosystem models for simulating C and N fluxes. Sci. Total Environ. 598, 445–470. doi:10.1016/j.scitotenv.2017.03.208
Bugden, G., Jiang, Y., van den Heuvel, M., Vandermeulen, H., MacQuarrie, K., Crane, C., et al. (2014). Nitrogen loading criteria for estuaries in Prince edward Island. Prince Edward Island, Canada: Government of Prince Edward Island.
Chanat, J. G., Moyer, D. L., Blomquist, J. D., Hyer, K. E., and Langland, M. J. (2016). Application of a weighted regression model for reporting nutrient and sediment concentrations, fluxes, and trends in concentration and flux for the Chesapeake Bay Nontidal Water-Quality Monitoring Network, results through water year 2012. Richmond, VA: United States Geological Survey.
Chen, J., Shi, W., and Jin, X. (2022). Pollutant flux estimation of the Lijiang River based on an improved prediction-correction method. Front. Environ. Sci. 10, 868404. doi:10.3389/fenvs.2022.868404
Chen, Y., Marek, G. W., Marek, T. H., Moorhead, J. E., Heflin, K. R., Brauer, D. K., et al. (2019). Simulating the impacts of climate change on hydrology and crop production in the Northern High Plains of Texas using an improved SWAT model. Agric. Water Manag. 221, 13–24. doi:10.1016/j.agwat.2019.04.021
Cohn, T. (1995). Recent advances in statistical methods for the estimation of sediment and nutrient transport in rivers. Rev. Geophys. 33 (S2), 1117–1123. doi:10.1029/95rg00292
Cohn, T., Cauldes, D., Gilroy, E., Zynjuk, L., and Summers, R. (1992). The validity of a simple longlinear model for estimating fluvial constituent loads entering Chesapeake Bay. Water Resour. Res. 28 (9), 2353–2363.
Cordeiro, M. R. C., Liang, K., Wilson, H. F., Vanrobaeys, J., Lobb, D. A., Fang, X., et al. (2022). Simulating the hydrological impacts of land use conversion from annual crop to perennial forage in the Canadian Prairies using the Cold Regions Hydrological Modelling platform. Hydrology Earth Syst. Sci. 26 (22), 5917–5931. doi:10.5194/hess-26-5917-2022
Devito, K. J., Creed, I. F., and Fraser, C. J. D. (2005). Controls on runoff from a partially harvested aspen-forested headwater catchment, Boreal Plain, Canada. Hydrol. Process. 19 (1), 3–25. doi:10.1002/hyp.5776
Devito, K. J., Hill, A., and Roulet, N. (1996). Groundwater-surface water interactions in headwater forested wetlands of the Canadian Shield. J. Hydrology 181 (1-4), 127–147. doi:10.1016/0022-1694(95)02912-5
Duan, S., Powell, R. T., and Bianchi, T. S. (2014). High frequency measurement of nitrate concentration in the Lower Mississippi River, USA. J. Hydrology 519 (Part A), 376–386. doi:10.1016/j.jhydrol.2014.07.030
El-Khoury, A., Seidou, O., Lapen, D. R., Que, Z., Mohammadian, M., Sunohara, M., et al. (2015). Combined impacts of future climate and land use changes on discharge, nitrogen and phosphorus loads for a Canadian river basin. J. Environ. Manage 151, 76–86. doi:10.1016/j.jenvman.2014.12.012
Ferguson, R. (1986). River loads underestimated by rating curves. Water Resour. Res. 22 (1), 74–76. doi:10.1029/wr022i001p00074
Fu, B., Li, Y., Wang, Y., Campbell, A., Zhang, B., Yin, S., et al. (2017). Evaluation of riparian condition of Songhua River by integration of remote sensing and field measurements. Sci. Rep. 7 (1), 2565–2616. doi:10.1038/s41598-017-02772-3
Fu, B., Merritt, W. S., Croke, B. F. W., Weber, T. R., and Jakeman, A. J. (2019). A review of catchment-scale water quality and erosion models and a synthesis of future prospects. Environ. Model. and Softw. 114, 75–97. doi:10.1016/j.envsoft.2018.12.008
Galloway, J. N., Aber, J. D., Erisman, J. W., Seitzinger, S. P., Howarth, R. W., Cowling, E. B., et al. (2003). The nitrogen cascade. Bioscience 53 (4), 341–356. doi:10.1641/0006-3568(2003)053[0341:tnc]2.0.co;2
Galloway, J. N., Townsend, A. R., Erisman, J. W., Bekunda, M., Cai, Z., Freney, J. R., et al. (2008). Transformation of the nitrogen cycle: recent trends, questions, and potential solutions. Science 320 (5878), 889–892. doi:10.1126/science.1136674
Gassman, P. W., Sadeghi, A. M., and Srinivasan, R. (2014). Applications of the SWAT model special section: overview and insights. J. Environ. Qual. 43 (1), 1–8. doi:10.2134/jeq2013.11.0466
Guo, Y., Markus, M., and Demissie, M. (2002). Uncertainty of nitrate-N load computations for agricultural watersheds. Water Resour. Res. 38 (10), 3-1-3–12. doi:10.1029/2001wr001149
Gupta, H. V., Sorooshian, S., and Yapo, P. O. (1999). Status of automatic calibration for hydrologic models: comparison with multilevel expert calibration. J. Hydrologic Eng. 4 (2), 135–143. doi:10.1061/(asce)1084-0699(1999)4:2(135)
Hirsch, R. M. (2014). Large biases in regression-based constituent flux estimates: causes and diagnostic tools. JAWRA J. Am. Water Resour. Assoc. 50 (6), 1401–1424. doi:10.1111/jawr.12195
Hirsch, R. M., and De Cicco, L. A. (2015). User guide to Exploration and Graphics for RivEr Trends (EGRET) and dataRetrieval: R packages for hydrologic data. Reston, VA: United States Geological Survey.
Hirsch, R. M., Moyer, D. L., and Archfield, S. A. (2010). Weighted regressions on time, discharge, and season (WRTDS), with an application to chesapeake bay river inputs. J. Am. Water Resour. Assoc. 46 (5), 857–880. doi:10.1111/j.1752-1688.2010.00482.x
Hou, C., Chu, M. L., Guzman, J. A., Triana, J. S. A., Moriasi, D. N., and Steiner, J. L. (2019). Field scale nitrogen load in surface runoff: impacts of management practices and changing climate. J. Environ. Manag. 249, 109327. doi:10.1016/j.jenvman.2019.109327
Hrachowitz, M., Savenije, H., Blöschl, G., McDonnell, J., Sivapalan, M., Pomeroy, J., et al. (2013). A decade of predictions in ungauged basins (PUB)—a review. Hydrological Sci. J. 58 (6), 1198–1255. doi:10.1080/02626667.2013.803183
Jiang, S. Y., Zhang, Q., Werner, A. D., Wellen, C., Jomaa, S., Zhu, Q. D., et al. (2019). Effects of stream nitrate data frequency on watershed model performance and prediction uncertainty. J. Hydrology 569, 22–36. doi:10.1016/j.jhydrol.2018.11.049
Jiang, Y., Nishimura, P., van den Heuvel, M. R., MacQuarrie, K. T. B., Crane, C. S., Xing, Z., et al. (2015). Modeling land-based nitrogen loads from groundwater-dominated agricultural watersheds to estuaries to inform nutrient reduction planning. J. Hydrology 529, 213–230. doi:10.1016/j.jhydrol.2015.07.033
Jiang, Y., Woodbury, A. D., and Painter, S. (2004). Full-Bayesian inversion of the Edwards aquifer. Groundwater 42 (5), 724–733.
Lee, C. J., Hirsch, R. M., and Crawford, C. G. (2019). An evaluation of methods for computing annual water-quality loads. U. S. Geol. Surv. doi:10.3133/sir20195084
Lee, C. J., Hirsch, R. M., Schwarz, G. E., Holtschlag, D. J., Preston, S. D., Crawford, C. G., et al. (2016). An evaluation of methods for estimating decadal stream loads. J. Hydrology 542, 185–203. doi:10.1016/j.jhydrol.2016.08.059
Li, S., Bhattarai, R., Cooke, R. A., Verma, S., Huang, X., Markus, M., et al. (2020). Relative performance of different data mining techniques for nitrate concentration and load estimation in different type of watersheds. Environ. Pollut. 263, 114618. doi:10.1016/j.envpol.2020.114618
Li, Z., Liu, W.-z., Zhang, X.-c., and Zheng, F.-l. (2009). Impacts of land use change and climate variability on hydrology in an agricultural catchment on the Loess Plateau of China. J. Hydrology 377 (1-2), 35–42. doi:10.1016/j.jhydrol.2009.08.007
Liang, K., Jiang, Y., Nyiraneza, J., Fuller, K., Murnaghan, D., and Meng, F.-R. (2019a). Nitrogen dynamics and leaching potential under conventional and alternative potato rotations in Atlantic Canada. Field Crops Res. 242, 107603. doi:10.1016/j.fcr.2019.107603
Liang, K., Jiang, Y., Qi, J., Fuller, K., Nyiraneza, J., and Meng, F.-R. (2020). Characterizing the impacts of land use on nitrate load and water yield in an agricultural watershed in Atlantic Canada. Sci. Total Environ. 729, 138793. doi:10.1016/j.scitotenv.2020.138793
Liang, K., Qi, J., Liu, E., Jiang, Y., Li, S., and Meng, F.-R. (2019b). Estimated potential impacts of soil and water conservation terraces on potato yields under different climate conditions. J. Soil Water Conservation 74 (3), 225–234. doi:10.2489/jswc.74.3.225
Liang, K., Zhang, X., Liang, X.-Z., Jin, V. L., Birru, G., Schmer, M. R., et al. (2023). Simulating agroecosystem soil inorganic nitrogen dynamics under long-term management with an improved SWAT-C model. Sci. Total Environ. 879, 162906. doi:10.1016/j.scitotenv.2023.162906
Markus, M., Demissie, M., Short, M. B., Verma, S., and Cooke, R. A. (2014). Sensitivity analysis of annual nitrate loads and the corresponding trends in the lower Illinois River. J. Hydrologic Eng. 19 (3), 533–543. doi:10.1061/(asce)he.1943-5584.0000831
Mattikalli, N. M., and Richards, K. S. (1996). Estimation of surface water quality changes in response to land use change: application of the export coefficient model using remote sensing and geographical information system. J. Environ. Manag. 48 (3), 263–282. doi:10.1006/jema.1996.0077
Milovanovic, M. (2007). Water quality assessment and determination of pollution sources along the Axios/Vardar River, Southeastern Europe. Desalination 213 (1-3), 159–173. doi:10.1016/j.desal.2006.06.022
Moatar, F., and Meybeck, M. (2005). Compared performances of different algorithms for estimating annual nutrient loads discharged by the eutrophic River Loire. Hydrol. Process. 19 (2), 429–444. doi:10.1002/hyp.5541
Molina-Navarro, E., Andersen, H. E., Nielsen, A., Thodsen, H., and Trolle, D. (2018). Quantifying the combined effects of land use and climate changes on stream flow and nutrient loads: a modelling approach in the Odense Fjord catchment (Denmark). Sci. Total Environ. 621, 253–264. doi:10.1016/j.scitotenv.2017.11.251
Moriasi, D. N., Arnold, J. G., Van Liew, M. W., Bingner, R. L., Harmel, R. D., and Veith, T. L. (2007). Model evaluation guidelines for systematic quantification of accuracy in watershed simulations. Trans. ASABE 50 (3), 885–900. doi:10.13031/2013.23153
Moriasi, D. N., Gowda, P. H., Arnold, J. G., Mulla, D. J., Ale, S., and Steiner, J. L. (2013). Modeling the impact of nitrogen fertilizer application and tile drain configuration on nitrate leaching using SWAT. Agric. Water Manag. 130, 36–43. doi:10.1016/j.agwat.2013.08.003
Neitsch, S. L., Arnold, J. G., Kiniry, J. R., and Williams, J. R. (2011). Soil and water assessment tool theoretical documentation version 2009. Temple, TX: U.S. Department of Agriculture - Agricultural Research Service.
Nguyen, H. H., Recknagel, F., Meyer, W., Frizenschaf, J., and Shrestha, M. K. (2017). Modelling the impacts of altered management practices, land use and climate changes on the water quality of the Millbrook catchment reservoir system in South Australia. J. Environ. Manag. 202 (Part 1), 1–11. doi:10.1016/j.jenvman.2017.07.014
Niedzielski, T., and Halicki, M. (2023). Improving linear interpolation of missing hydrological data by applying integrated autoregressive models. Water Resour. Manag. 37 (14), 5707–5724. doi:10.1007/s11269-023-03625-7
Odgaard, M. V., Olesen, J. E., Graversgaard, M., Borgesen, C. D., Svenning, J.-C., and Dalgaard, T. (2019). Targeted set-aside: benefits from reduced nitrogen loading in Danish aquatic environments. J. Environ. Manag. 247, 633–643. doi:10.1016/j.jenvman.2019.06.107
Oliver, A. C., Kurylyk, B. L., Johnston, L. H., LeRoux, N. K., Somers, L. D., and Jamieson, R. C. (2024). Impacts of climate change and best management practices on nitrate loading to a eutrophic coastal lagoon. Front. Environ. Sci. 12. doi:10.3389/fenvs.2024.1468869
Ongley, E. D., Xiaolan, Z., and Tao, Y. (2010). Current status of agricultural and rural non-point source Pollution assessment in China. Environ. Pollut. 158 (5), 1159–1168. doi:10.1016/j.envpol.2009.10.047
Ouyang, W., Yang, W., Tysklind, M., Xu, Y., Lin, C., Gao, X., et al. (2018). Using river sediments to analyze the driving force difference for non-point source pollution dynamics between two scales of watersheds. Water Res. 139, 311–320. doi:10.1016/j.watres.2018.04.020
Park, Y. S., and Engel, B. A. (2015). Analysis for regression model behavior by sampling strategy for annual pollutant load estimation. J. Environ. Qual. 44 (6), 1843–1851. doi:10.2134/jeq2015.03.0137
Pellerin, B. A., Bergamaschi, B. A., Gilliom, R. J., Crawford, C. G., Saraceno, J., Frederick, C. P., et al. (2014). Mississippi River nitrate loads from high frequency sensor measurements and regression-based load estimation. Environ. Sci. and Technol. 48 (21), 12612–12619. doi:10.1021/es504029c
Preston, S. D., Bierman Jr, V. J., and Silliman, S. E. (1989). An evaluation of methods for the estimation of tributary mass loads. Water Resour. Res. 25 (6), 1379–1389. doi:10.1029/wr025i006p01379
Qi, J., Li, S., Bourque, C. P. A., Xing, Z., and Meng, F.-R. (2018). Developing a decision support tool for assessing land use change and BMPs in ungauged watersheds based on decision rules provided by SWAT simulation. Hydrology Earth Syst. Sci. 22 (7), 3789–3806. doi:10.5194/hess-22-3789-2018
Qi, J., Li, S., Li, Q., Xing, Z., Bourque, C. P. A., and Meng, F.-R. (2016). Assessing an enhanced version of SWAT on water quantity and quality simulation in regions with seasonal snow cover. Water Resour. Manag. 30 (14), 5021–5037. doi:10.1007/s11269-016-1466-8
Quilbé, R., Rousseau, A. N., Duchemin, M., Poulin, A., Gangbazo, G., and Villeneuve, J.-P. (2006). Selecting a calculation method to estimate sediment and nutrient loads in streams: application to the Beaurivage River (Québec, Canada). J. Hydrology 326 (1-4), 295–310. doi:10.1016/j.jhydrol.2005.11.008
Risal, A., and Parajuli, P. B. (2019). Quantification and simulation of nutrient sources at watershed scale in Mississippi. Sci. Total Environ. 670, 633–643. doi:10.1016/j.scitotenv.2019.03.233
Robertson, D. M., and Roerish, E. D. (1999). Influence of various water quality sampling strategies on load estimates for small streams. Water Resour. Res. 35 (12), 3747–3759. doi:10.1029/1999wr900277
Rode, M., Wade, A. J., Cohen, M. J., Hensley, R. T., Bowes, M. J., Kirchner, J. W., et al. (2016). Sensors in the stream: the high-frequency wave of the present. Environ. Sci. Technol. 50 (19), 10297–10307. doi:10.1021/acs.est.6b02155
Runkel, R. L., Crawford, C. G., and Cohn, T. A. (2004). “Load Estimator (LOADEST): a FORTRAN program for estimating constituent loads in streams and rivers”.
Saha, G., Shen, C., Duncan, J., and Cibin, R. (2024). Performance evaluation of deep learning based stream nitrate concentration prediction model to fill stream nitrate data gaps at low-frequency nitrate monitoring basins. J. Environ. Manage 357, 120721. doi:10.1016/j.jenvman.2024.120721
Sith, R., Watanabe, A., Nakamura, T., Yamamoto, T., and Nadaoka, K. (2019). Assessment of water quality and evaluation of best management practices in a small agricultural watershed adjacent to Coral Reef area in Japan. Agric. Water Manag. 213, 659–673. doi:10.1016/j.agwat.2018.11.014
Sorando, R., Comin, F. A., Jimenez, J. J., Sanchez-Perez, J. M., and Sauvage, S. (2019). Water resources and nitrate discharges in relation to agricultural land uses in an intensively irrigated watershed. Sci. Total Environ. 659, 1293–1306. doi:10.1016/j.scitotenv.2018.12.023
Stenback, G. A., Crumpton, W. G., Schilling, K. E., and Helmers, M. J. (2011). Rating curve estimation of nutrient loads in Iowa rivers. J. Hydrology 396 (1-2), 158–169. doi:10.1016/j.jhydrol.2010.11.006
Stutter, M. I., Langan, S. J., and Cooper, R. J. (2008). Spatial contributions of diffuse inputs and within-channel processes to the form of stream water phosphorus over storm events. J. Hydrol. 350, 203–214. doi:10.1016/j.jhydrol.2007.10.045
Tan, C. S., and Zhang, T. Q. (2011). Surface runoff and sub-surface drainage phosphorus losses under regular free drainage and controlled drainage with sub-irrigation systems in southern Ontario. Can. J. Soil Sci. 91 (3), 349–359. doi:10.4141/cjss09086
Toor, G. S., Harmel, R. D., Haggard, B. E., and Schmidt, G. (2008). Evaluation of regression methodology with low-frequency water quality sampling to estimate constituent loads for ephemeral watersheds in Texas. J. Environ. Qual. 37 (5), 1847–1854. doi:10.2134/jeq2007.0232
Ullrich, A., and Volk, M. (2010). Influence of different nitrate-N monitoring strategies on load estimation as a base for model calibration and evaluation. Environ. Monit. Assess. 171 (1-4), 513–527. doi:10.1007/s10661-009-1296-8
Verhoff, F. H., Melfi, D. A., and Yaksich, S. M. (1980). River nutrient and chemical transport estimation. J. Environ. Eng. Div. 106 (3), 591–608. doi:10.1061/jeegav.0001047
Verma, S., Markus, M., and Cooke, R. A. (2012). Development of error correction techniques for nitrate-N load estimation methods. J. Hydrology 432-433, 12–25. doi:10.1016/j.jhydrol.2012.02.011
Wagena, M. B., Collick, A. S., Ross, A. C., Najjar, R. G., Rau, B., Sommerlot, A. R., et al. (2018). Impact of climate change and climate anomalies on hydrologic and biogeochemical processes in an agricultural catchment of the Chesapeake Bay watershed, USA. Sci. Total Environ. 637-638, 1443–1454. doi:10.1016/j.scitotenv.2018.05.116
Wang, Q., Qi, J., Li, J., Cole, J., Waldhoff, S. T., and Zhang, X. J. W. r. (2020). Nitrate loading projection is sensitive to freeze-thaw cycle representation. Water Res. 186, 116355. doi:10.1016/j.watres.2020.116355
Yadav, S., Babel, M. S., Shrestha, S., and Deb, P. (2019). Land use impact on the water quality of large tropical river: mun River Basin, Thailand. Environ. Monit. Assess. 191 (10), 614. doi:10.1007/s10661-019-7779-3
Yang, G., and Best, E. P. H. (2015). Spatial optimization of watershed management practices for nitrogen load reduction using a modeling-optimization framework. J. Environ. Manag. 161, 252–260. doi:10.1016/j.jenvman.2015.06.052
Yang, X., Jomaa, S., Buttner, O., and Rode, M. (2019). Autotrophic nitrate uptake in river networks: a modeling approach using continuous high-frequency data. Water Res. 157, 258–268. doi:10.1016/j.watres.2019.02.059
Yang, X., Liu, Q., Fu, G., He, Y., Luo, X., and Zheng, Z. (2016). Spatiotemporal patterns and source attribution of nitrogen load in a river basin with complex pollution sources. Water Res. 94, 187–199. doi:10.1016/j.watres.2016.02.040
Zamyadi, A., Gallichand, J., and Duchemin, M. (2007). Comparison of methods for estimating sediment and nitrogen loads from a small agricultural watershed. Can. Biosyst. Eng. 49, 1.
Keywords: nitrate load, sparse data, water quality, regression model, physical-based model
Citation: Liang K, Jiang Y, Fuller K, Cordeiro M, Zhang X, Qi J, Geng X, Liu T, Zhang Q, Azimi MA and Meng F-R (2025) Large variability of nitrate load estimated from sparse measurements by typical methods in Atlantic Canada. Front. Environ. Sci. 13:1557004. doi: 10.3389/fenvs.2025.1557004
Received: 07 January 2025; Accepted: 13 February 2025;
Published: 07 March 2025.
Edited by:
Paweł Tomczyk, Wroclaw University of Environmental and Life Sciences, PolandReviewed by:
Thomas Shahady, University of Lynchburg, United StatesCopyright © 2025 Liang, Jiang, Fuller, Cordeiro, Zhang, Qi, Geng, Liu, Zhang, Azimi and Meng. This is an open-access article distributed under the terms of the Creative Commons Attribution License (CC BY). The use, distribution or reproduction in other forums is permitted, provided the original author(s) and the copyright owner(s) are credited and that the original publication in this journal is cited, in accordance with accepted academic practice. No use, distribution or reproduction is permitted which does not comply with these terms.
*Correspondence: Kang Liang, a2xpYW5nODAwQGdtYWlsLmNvbQ==
Disclaimer: All claims expressed in this article are solely those of the authors and do not necessarily represent those of their affiliated organizations, or those of the publisher, the editors and the reviewers. Any product that may be evaluated in this article or claim that may be made by its manufacturer is not guaranteed or endorsed by the publisher.
Research integrity at Frontiers
Learn more about the work of our research integrity team to safeguard the quality of each article we publish.