 Hao Zhang
 Qingping Zhou1
94% of researchers rate our articles as excellent or good
Learn more about the work of our research integrity team to safeguard the quality of each article we publish.
Find out more
ORIGINAL RESEARCH article
Front. Environ. Sci., 07 March 2025
Sec. Land Use Dynamics
Volume 13 - 2025 | https://doi.org/10.3389/fenvs.2025.1551156
This article is part of the Research TopicMoving Towards Sustainable Development: Exploring the Impact of Land-Use Policies on Land Green Utilization EfficiencyView all 9 articles
Introduction: The shortage and irrational utilization of water-land resources (WLR) are the main obstacles to the sustainable development of karst regions.
Methods: In accordance with the principles of Sustainable Development Goals (SDGs), an evaluation system for WLR utilization was established. As a representative karst region in China, Guizhou Province was selected to analyze the spatio-temporal variation characteristics of the sustainable development level of WLR from 2000 to 2020, and then revealed the driving factors by using factor detector.
Results: The key findings are as follows: 1) There was a slight intensification in the bearing pressure of cultivated land and water resources, whereas the stress on construction land underwent a notable reduction, from 9.71 in 2000 to 2.02 in 2020, and the pressure on ecological land experienced a modest alleviation. 2) The matching degree of WLR increased significantly at the provincial and prefecture-level city scales, but the effectiveness of improvement at the county scale was limited. 3) The sustainable development level exhibited an upward trajectory, but the sustainable development potential index remained relatively low, consistently below 0.3. 4) Factors urbanization rate and NDVI exerted a pronounced influence on the spatial differentiation of sustainable development level, with the synergistic driving effect of factors sharing the same attribute significantly heightened.
Discussion: Recommendations include urbanization construction, strengthening the control of rocky desertification, improving water conservancy infrastructure, and establishing cross-regional cooperation mechanisms for cultivated land and ecological land protection to boost the overall sustainable resources utilization in karst regions.
• The evaluation indicator system of sustainable development level of water-land resources is innovatively proposed;
• From 2000 to 2020, the variation trend of the bearing pressure index of resources in the study area was different, but their spatial equilibrium had been improved;
• The sustainable development level index of water-land resources showed an overall upward trend, but the matching degree had not been effectively improved at the county scale;
• Reducing the area of rocky desertification through ecological restoration can improve the level of sustainable development in karst areas more effectively.
Karst presents a global ecological and environmental challenge, posing a significant obstacle to regional sustainable development (Huang et al., 2022). As a distinct form of land desertification, karst landforms are characterized by their rugged terrain, widespread exposure of bedrock, and a pronounced decrease in soil fertility (Yu and Chi, 2020), thereby exhibiting landscape features akin to desertification (Pei et al., 2018). China’s southwestern region lies at the core of the karst terrain in East Asia, characterized predominantly by mountainous and hilly landscapes (Han and Song, 2019). While rocky desertification has been observed in other karst regions worldwide, the karst in the mountainous area of southwest China stands out for its comprehensive types and vast scale (Zhang et al., 2023). The issue of rocky desertification is exacerbated by the combined pressures of population growth, a delicate ecological environment, and unsustainable economic activities (Gao et al., 2021). Nestled in the heart of the karst region in southwest China, Guizhou Province boasts 73% of its territory underlain by soluble carbonate rocks, with 95% of its counties displaying karst landforms (Peng et al., 2022a). The development of karst landforms, resulting in the shortage of available water resources and land resources, has surfaced as the foremost ecological challenge, hindering the region’s path towards sustainable development (Meng et al., 2023).
As one of the most emblematic regions for karst landform evolution globally, Guizhou Province faces a scarcity of viable land resources (Liu Y., 2021), along with an uneven temporal and spatial distribution of water resources, and severe soil erosion, collectively contributing to a fragile ecological environment (Wang et al., 2020). Due to the strong geological tectonic movement, Guizhou Province has formed a special double-layer karst hydrogeological structure (Zhang et al., 2023). The water resources are mainly groundwater, which poses challenges in exploitation, leading to issues of engineering water scarcity (Liu L. Y., 2021). The rugged topography and slow soil formation in Guizhou Province result in impoverished soil, shallow soil layers, dispersed cultivated land resources, and notably, 61% of the total cultivated area being slope-cultivated land (Peng et al., 2022b; Chen et al., 2021). Irrational human activities, including planting crops on steep inclines, excessive grazing, and deforestation, exacerbate the risk of soil erosion even further (Peng et al., 2022a). In recent years, the issue of water resources and land resources misallocation has been alleviated to some degree via ecological initiatives such as converting farmland back to forests, controlling rocky desertification and building water conservancy facilities (Qiao et al., 2021). However, there is still a lack of long-term and multi-scale quantitative assessment of the comprehensive utilization of water resources and land resources in karst regions, and the impact mechanism of water resources and land resources utilization on regional development has not been clarified.
Water resources and land resources serve as the cornerstone for guaranteeing food security and fostering economic and social development (Qin et al., 2023). The way in which water resources are used determines the productivity of land resources (Duc et al., 2023), and conversely, the distribution of land resources imposes limitations on the exploitation and utilization of water resources as well (Liu et al., 2022). Especially for karst regions, water resources have emerged as the main limiting factor of land resource utilization (Field, 2021). In this context, scholars commenced focusing on the interplay between water resources and land resources, examining them collectively as an integrated system of natural resources, which in turn formed the basic definition of water-land resources (WLR) (Geris et al., 2022; Gedefaw et al., 2023). Additionally, research has delved into the coordinated relationship between water resources and land resources during the urbanization process, proposing corresponding strategies for optimal allocation and regulation of WLR (Zhou et al., 2020). The foundation for sustainable development within a region lies in its resource carrying capacity (Lane, 2010). Recent studies focusing on the bearing capacity of WLR has primarily concentrated on static evaluations (Swiader et al., 2020). This includes perspectives such as supply and demand (Ibarrola-Rivas et al., 2017), carbon footprint (Li et al., 2023), ecosystem services (Lilburne et al., 2020), and resources matching (Ying et al., 2023). However, these studies tend to prioritize the productivity of agricultural land, neglecting the bearing capacity of both ecological and construction land. There is also a notable gap in analyzing the impact of WLR utilization on regional sustainable development.
Human activities play a pivotal role in altering the evolution process of rocky desertification (Zhang et al., 2010), and reciprocally, rocky desertification influences regional development, with the two unfolding concurrently and interacting (Zhao et al., 2022). Excessive resources exploitation can lead to a detrimental cycle of poverty and rocky desertification (Gao et al., 2021). Conversely, the advancement of ecological industries proves effective in controlling rocky desertification and fostering regional sustainable development (Tian et al., 2017). To address the sustainable utilization of WLR in karst regions, researchers have proposed a restoration and reconstruction plan for the karst ecosystem to mitigate the issue of resources mismatch (Zhang et al., 2016). The structure of WLR is an important driving force for the change of ecosystem service value (Pacetti et al., 2020). Consequently, researchers have suggested strategies for the optimal allocation of WLR based on sustainable ecosystems (Shiferaw et al., 2019). The 2030 Agenda for Sustainable Development, introduced by the United Nations, encompasses 17 Sustainable Development Goals (SDGs), offering a new perspective for the evaluation of WLR (Lee et al., 2016; Safaei et al., 2023). Among the 17 SDGs, those directly related to WLR include End Hunger (SDG2), Clean Water and Sanitation (SDG6), Sustainable Cities and Communities (SDG11) and Terrestrial Ecosystems (SDG15). In recent years, researchers have developed indicator systems centered around the SDGs framework, employing them to conduct sustainable development evaluations across diverse regions and sectors (Leal Filho et al., 2023; De Francesco et al., 2023). Therefore, based on the challenges faced by karst regions such as ecological fragility, rocky desertification threat and backward production mode, the introduction of SDGs analysis framework can provide a new perspective for explaining the impact of WLR utilization on regional sustainable development.
To sum up, the research framework and steps of this paper are as follows: Firstly, from the spatial scale of province, prefecture-level city and county, the resources bearing pressure of water resources and land resources in Guizhou Province from 2000 to 2020 were evaluated, and the changes of matching degree of WLR were further analyzed. On this basis, the WLR evaluation indicator system was established according to the SDGs analysis framework, and the sustainable development level index was used to measure the contribution of WLR in karst regions to the realization of SDGs, and analyzed the sustainable utilization potential of WLR. Finally, the driving factors of sustainable development level of WLR were analyzed by factor detector (Figure 1). By analyzing the relationship between the WLR utilization and regional sustainable development, this study revealed the potential of WLR utilization to promote regional sustainable development, and provided a scientific basis for improving the sustainable utilization level of WLR in karst regions, thus promoting regional sustainable development.
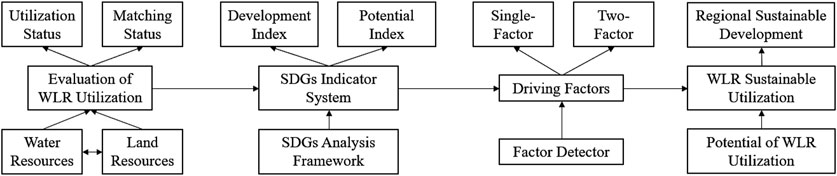
Figure 1. Research framework and steps.
Guizhou Province is located in the southwest of China, with 9 prefecture-level cities (88 counties) covering an area of 176,000 km2 and an average annual precipitation of 1100 mm. The area of karst landform is about 109,000 km2, accounting for 61.9% of the province’s total area, and rocky desertification is mainly distributed in the western part of the study area (Figure 2). In 2020, the per capita cultivated land area in the study area was about 0.089 hm2, lower than the national average (0.097 hm2). The per capita water resource was about 2,800 m3, higher than the national average (2,240 m3). However, due to the irregular distribution of rainfall across time and space, coupled with inadequate supporting water conservancy infrastructure, the utilization efficiency of water resources in the study area fell below half of the national average, leading to challenges like regional water scarcity, engineering water shortages, and a delicate water ecological environment (Liu Y., 2021).
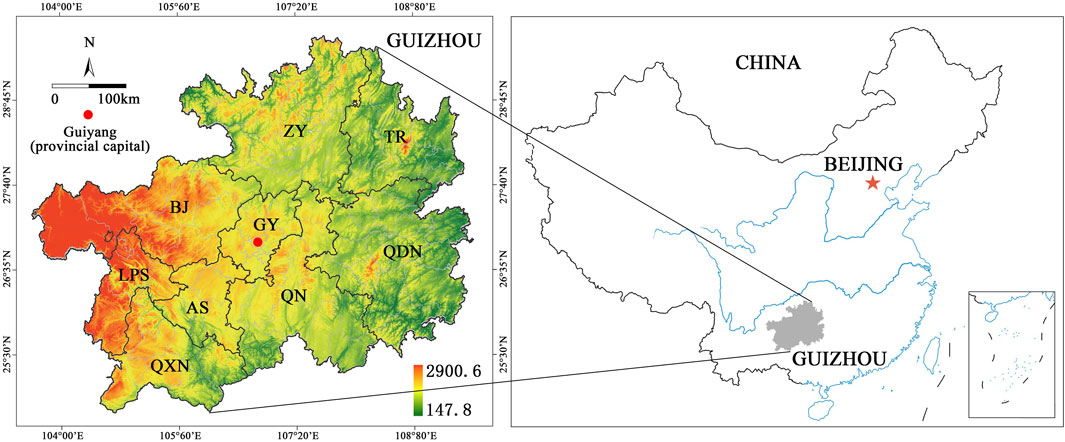
Figure 2. Location of the study area. (GY: Guiyang, LPS: Liupanshui, ZY: Zunyi, AS: Anshun, BJ: Bijie, TR: Tongren, QXN: Qianxinan, QDN: Qiandongnan, QN: Qiannan).
In this study, we have utilized various types of data: land resources, water resources, and socio-economic data. The land resources and NDVI data were obtained from the Chinese Academy of Sciences Resource and Environmental Science Data Center (https://www.resdc.cn), which was based on Landsat TM imagery and generated by manual visual interpretation, with a resolution of 30 m and included 7 land use types. The water resources data were retrieved from the Department of Water Resources (http://mwr.guizhou.gov.cn/), while the socio-economic data came from the Guizhou Macro Economic Database (http://hgk.guizhou.gov.cn/index.vhtml). The dataset encompassed various indicators such as urban per capita water supply, per capita residential land area, per capita investment in fixed assets and rocky desertification area. The study spanned three distinct time periods: 2000, 2010, and 2020.
The emphasis of this paper is to evaluate the utilization of WLR and its sustainable development level in karst regions. To accomplish this, an evaluation indicator system was established and divided into two parts. The first part is the evaluation of the utilization status and matching status of WLR, including the bearing pressure of land resources, the bearing pressure of water resources, the matching degree and Gini coefficient of WLR (Table 1). Referring to relevant researches (Tan et al., 2021), this paper categorized land resources into three distinct categories: cultivated land, construction land and ecological land (Liu et al., 2021).
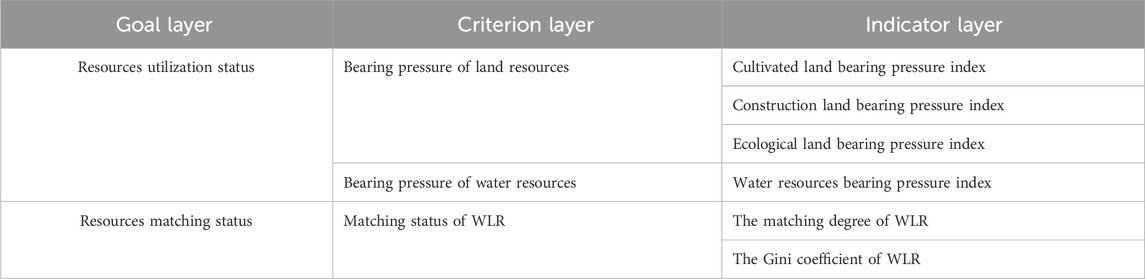
Table 1. Evaluation indicator system of WLR utilization.
The second part focused on the evaluation of the contribution degree of WLR utilization to the realization of the SDGs, that is, the sustainable development level index of WLR (Singh, 2022). Based on the SDGs proposed by the United Nations, goals directly related to WLR were selected and an evaluation indicator system was established (Lee et al., 2016; Dickens et al., 2020). Criterion layer included SDG2, SDG6, SDG11 and SDG15 (Table 2).
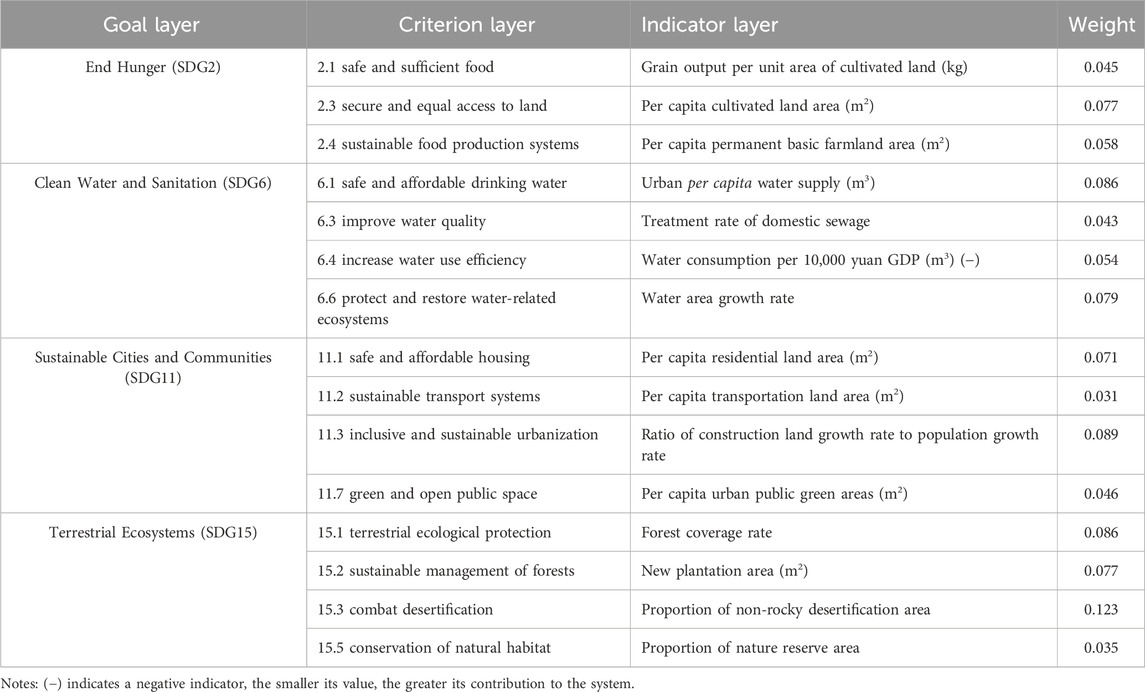
Table 2. Evaluation indicator system of sustainable development level.
Specifically, the contribution of WLR to SDG2 comes primarily from food production, so this paper used “grain output, cultivated land area, permanent basic farmland area” to measure the contributions to goals 2.1, 2.3, and 2.4 respectively. The contribution of WLR to SDG6 is related to the total amount, utilization efficiency and quality of water resources. “Water supply, sewage treatment rate, water consumption and water area growth rate” were used to measure the contributions to goals 6.1, 6.3, 6.4, and 6.6 respectively in this paper. The contribution of WLR to SDG11 comes from the supply of living space. This paper used “residential land area, transportation land area, construction land growth rate and public green areas” to measure the contribution to goals 11.1, 11.2, 11.3, and 11.7 respectively. It is important to mention that, pertaining to SDG11, the absence of statistical data pertaining to rural communities necessitates the paper’s focus solely on the calculation of urban statistical data. The contribution of WLR to SDG15 is related to the quality of terrestrial ecosystem, so this paper used “forest coverage rate, plantation area, non-rocky desertification area and nature reserve area” to measure the contribution to goals 15.1, 15.2, 15.3, and 11.5 respectively.
According to the definition of environment carrying capacity (Borja et al., 2022), the bearing pressure index of WLR is calculated, that is, the ratio of the current population to the population that resources can support. If the ratio is less than 1, it indicates that the existing resources have less pressure to support the current population, and vice versa. The potential index of WLR is the ratio of the difference between resource carrying capacity and current population to resource carrying capacity, and the greater the bearing pressure index, the smaller the potential index. The mathematical formula is as follows:
In the formula:
The demand for cultivated land area per person is equivalent to dividing the annual food requirement per individual by the yield of grain per unit area of cultivated land. According to the Food and Agriculture Organization standards, each person needs 400 kg of food per year. According to China’s urban planning standards, the per capita demand of construction land area is 150 m2. There is no uniform standard for the per capita demand of water resources and ecological land resources, this paper used the national per capita resource occupancy in the study year instead (Liu et al., 2023).
The matching degree of WLR is used to represent the matching status of available water resources and cultivated land resources (Zhang et al., 2020), that is, the available water resources per unit area of cultivated land (10,000 m3/hm2). The mathematical formula is:
In the formula:
The SDG Index and Dashboards Report provided a Decision Tree Approach for setting the upper and lower boundaries (Lee et al., 2016). To calculate the sustainable development level index of WLR in karst regions, two scenarios should be considered. The first scenario involves a distinct threshold, where the indicator’s upper limit is set at 100%, and the lower limit is at 0%. In the second scenario, there is no clear threshold, meaning the indicator lacks a defined upper or lower limit. For indicators without a clear threshold, the upper limit was determined by averaging the top 3 rankings. To mitigate the impact of extreme values, the lower limit was established using the data in the bottom 10% position.
In the pertinent studies of sustainable development evaluation, there exists no standardized regulation regarding the weights assigned to the 17 goals. In this study, the choice was made to employ the entropy weight method for calculating these weights, a process that involves determining the weightage according to the information entropy associated with each indicator. A lower value of information entropy signifies that the indicator conveys a larger quantity of information, leading to an increased weight assigned to it, and vice versa. The entropy weight method is chosen to address the subjectivity issues of Analytic Hierarchy Process (AHP) and the challenges posed by repeated attributes due to an excessive number of indicators. To eliminate the impact of dimension, data was standardized, and the sustainable development level index was derived by calculating the information entropy, difference coefficient, and weight of the indicators.
Within the carrying capacity of WLR, more rational utilization of resources can improve the ability of sustainable development (Bobba et al., 1997; Mohammed et al., 2014). Assuming that rational utilization of WLR contributes equally to sustainable development. The sustainable development level index and resources potential index can be used to estimate the sustainable development potential of WLR, that is, the potential of WLR utilization to support regional sustainable development. The mathematical formula is:
In the formula:
The factor detector, a specific category within geographic detectors, serves to scrutinize the capacity of factor X in elucidating the spatial heterogeneity of attribute Y, while effectively circumventing the issue of collinearity among multiple factors. Its mathematical principle is to divide a space into several partitions according to the value of factor X, and analyze the spatial heterogeneity by comparing the relationship between the aggregate variance within these partitions and the overall spatial variance (Wang et al., 2016). The mathematical formula is:
In the formula:
Interaction detection can further analyze whether the synergic driving effect of the two factors is enhanced or weakened, and the criteria for determining the interaction type are as follows: If the q (X1∩X2) is greater than the sum of q (X1) and q (X2), the type is nonlinear enhancement. When q (X1∩X2) equals the sum of q (X1) and q (X2), the type is independent. If q (X1∩X2) is less than the sum of q (X1) and q (X2), but greater than Max [q (X1), q (X2)], the type is two-factor enhancement. If q (X1∩X2) is less than Max [q (X1), q (X2)], but greater than Min [q (X1), q (X2)], the type is single-factor nonlinear weakening. If Min [q (X1), q (X2)] is less than q (X1∩X2), the type is nonlinear weakening. The website http://www.geodetector.cn/ offers a downloadable software for performing factor detector analysis.
With reference to relevant studies, 6 factors were selected from the dimensions of economic society and natural environment to analyze the driving factors of the spatial differentiation of sustainable development level of WLR. Including socio-economic factors: population density (X1), per capita GDP (X2), urbanization rate (X3). And natural environmental factors: annual precipitation (X4), river density (X5), NDVI (X6). Among them, river density refers to rivers above grade 4.
Taking 9 prefecture-level cities as the research object, the variation trend of bearing pressure of WLR was analyzed (Table 3). The bearing pressure index in the table was based on the mean value of the whole province (GZ), where a positive value indicated it exceeded the mean, and vice versa.
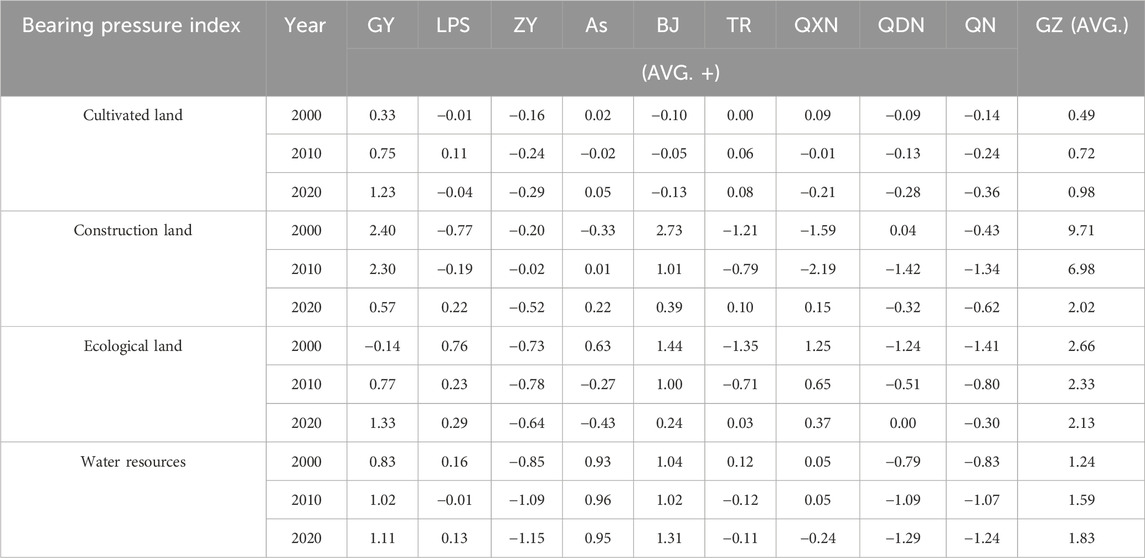
Table 3. Bearing pressure index of WLR from 2000 to 2020.
Cultivated land resources: The bearing pressure index for provincial cultivated land resources rose from 0.49 in 2000 to 0.98 in 2020, nearing the critical value of 1. GY, where the provincial capital is located, exhibited the highest index, surging from 0.82 in 2000 to 2.21 in 2020. The pressure index of TR with less cultivated land resources was also higher than the provincial average. ZY and QN with more cultivated land resources had lower pressure index.
Construction land resources: The bearing pressure index for provincial construction land resources significantly decreased from 9.71 in 2000 to 2.02 in 2020. The pressure index of GY was significantly higher than the provincial average, and significantly decreased from 9.28 in 2010 to 2.59 in 2020. The pressure index of BJ and AS was also higher than the provincial average, and the pressure index in other regions was lower than the provincial average.
Ecological land resources: The bearing pressure index for provincial ecological land resources slightly decreased from 2000 to 2020. LPS, BJ and QXN, located in the west of the study area, served as focal points for the distribution of karst landforms, consistently exceeding the provincial average in pressure index. However, there has been a notable decline observed in their pressure index over time. Although the pressure index of TR, QDN and QN were lower than the provincial average, they showed an increasing trend. The pressure index of GY rose from 2.52 in 2000 to 3.46 in 2020, and the pressure index in 2010 and 2020 was higher than the provincial average.
Water resources: The bearing pressure index for provincial water resources slightly increased from 2000 to 2020. The pressure index of GY and AS in the central region and LPS, BJ and QXN in the western region were generally higher than the provincial average. The northern and eastern regions with relatively abundant water resources, including ZY, QDN and QN, had lower pressure index than the provincial average.
The spatial distribution of the WLR bearing pressure index was further examined at the county scale (Figure 3). Here are the key findings:
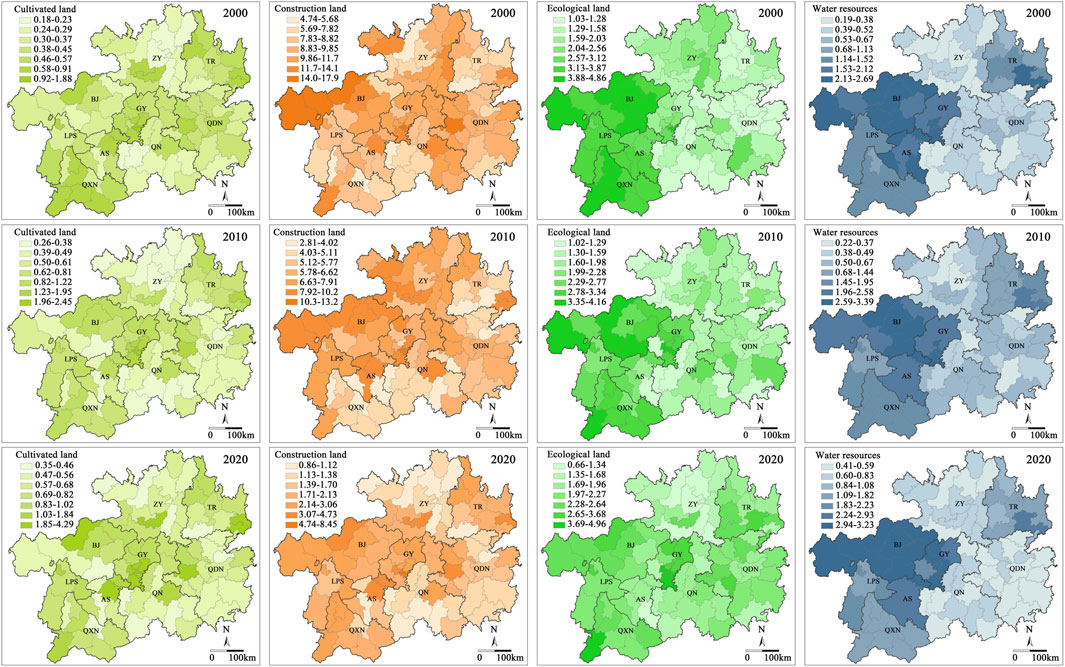
Figure 3. Bearing pressure of WLR from 2000–2020.
Cultivated land resources: From 2000 to 2020, the bearing pressure index for cultivated land resources was low in the north and south, while the central region exhibited relatively high pressure. Other high-value units were dispersed in space, showing a pattern of “high in the middle and low at the edge.”
Construction land resources: In 2000 and 2010, the northwest region had a relatively high pressure index for construction land resources, while the southern region had a low index. By 2020, the pressure index in the north, south, and southeast had decreased, and the spatial pattern of high-value units became less apparent, showing a pattern of “high in the middle and low in the north and south” on the whole.
Ecological land resources: It can be clearly seen that in 2000 and 2010, the bearing pressure index showed a pattern of “high in the west and low in the east”. In 2020, the spatial equilibrium of the bearing pressure index was significantly improved, and the high-value units were dispersed in space.
Water resources: The spatial regularity of bearing pressure index was also obvious, from 2000 to 2020, it presented a pattern of “high in the west and low in the east.” In addition, the pressure index was also relatively high in the central region and the northeastern fringe.
In summary, the spatial equilibrium of the bearing pressure index for the four resource types improved from 2000 to 2020. The predominant landform types in the study area are mountains and hills, lacking plains to support large population concentrations. As a result, the spatial patterns of the resource bearing pressure index were not pronounced for cultivated land and construction land closely associated with human activities. Conversely, ecological land and water resources, closely tied to natural conditions, displayed distinct spatial heterogeneity, particularly influenced by the karst landform in the western region, where the resource bearing pressure index was higher.
The study employed the matching degree and Gini coefficient to analyze the spatial-temporal matching characteristics of water resources and cultivated land resources in the study area (Figure 4). Here are the main observations:
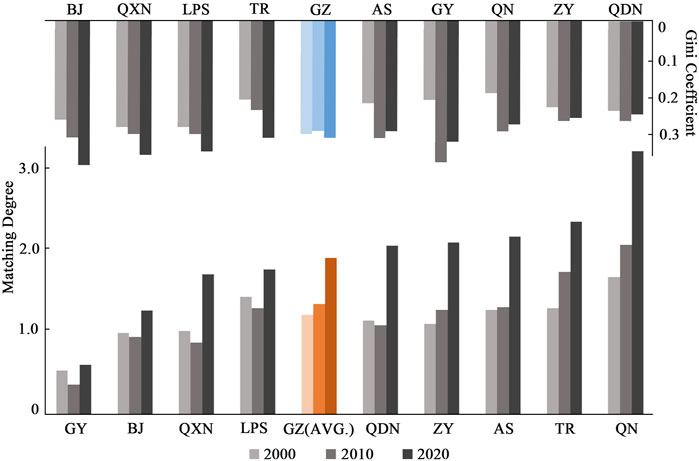
Figure 4. The matching degree and Gini coefficient of WLR.
From 2000 to 2010, the average matching degree of WLR for the entire province (GZ) slightly increased. At the prefecture-level city scale, GY, BJ, QXN, LPS, and QDN experienced a slight decrease in matching degree, while ZY, AS, TR, and QN showed a slight increase. From 2010 to 2020, the matching degree increased significantly, reaching an average of 1.91 for the province. GY had the lowest matching degree, reaching only 0.61 in 2020, while QN had the highest matching degree, reaching 3.21 in 2020. It showed that the matching degree of WLR in the study area had been improved significantly from the provincial scale and the prefecture-level city scale.
However, the Gini coefficient told a different story. Taking counties as the research unit, the Gini coefficient of matching WLR of the whole province (GZ) did not change significantly from 2000 to 2010, and the Gini coefficient of 9 prefecture-level cities increased to different degrees. GY, in particular, saw its Gini coefficient rise from 0.23 in 2000 to 0.41 in 2010. From 2010 to 2020, the Gini coefficients of AS, GY, QN, ZY, and QDN began to decline, but the Gini coefficients of BJ, QXN, LPS, and TR continued to rise. This suggests that, at the county scale, the matching status of WLR in the study area did not see effective improvement during this period. In summary, while the matching degree of WLR improved significantly at both the provincial and prefecture-level city scales, the Gini coefficient revealed that the matching status at the county scale did not see substantial improvement during the study period.
From the perspective of spatial pattern (Figure 5), the matching degree of WLR in the study area displayed the following trends over time. Year 2000: The matching degree showed a “high in the east and low in the west” pattern. Particularly in the northwest, several counties belonging to BJ had a matching degree lower than 0.53, and the western fringe areas also exhibited relatively low matching degrees. Year 2010: The spatial pattern of WLR matching degree did not undergo significant changes. Although the overall matching degree increased, noticeable low-value accumulation areas persisted in the northwest region. Year 2000: The matching degree exhibited a pattern of “high in the east and south, low in the middle and west”. In the central region where Guiyang, the provincial capital city with the highest urbanization rate, is located, the matching degree was less than 0.8, significantly lower than other regions.
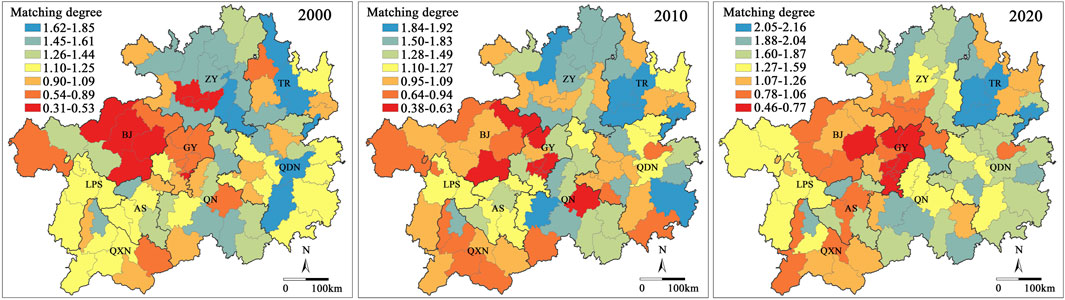
Figure 5. Spatial pattern of matching degree of WLR.
The sustainable development level index can be used to measure the contribution of WLR utilization to the realization of SDGs (Figure 6). From the perspective of variation trend, the sustainable development level index of WLR of the whole province (GZ) was 0.39 in 2000, and rose to 0.53 in 2020. Similarly, prefecture-level cities also demonstrated an upward trend. For instance, GY rose from 0.48 in 2000 to 0.57 in 2020, and QXN increased from 0.31 in 2000 to 0.38 in 2020. This indicated that the contribution of WLR utilization to the realization of SDGs in the study area was constantly increasing.
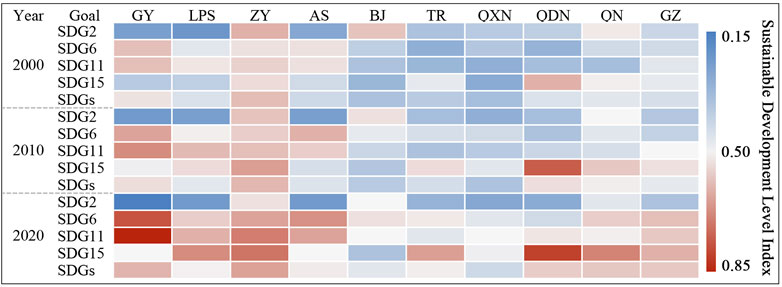
Figure 6. Thermal map of sustainable development level index of WLR.
Further analysis of the evaluation results of individual goals. The contribution of WLR utilization to the realization of SDG2 in the study area has been low, because the cultivated land resources in karst regions were limited. In contrast, when comparing the periods of 2000–2010 and 2010–2020, a more significant increase in the contribution of water and land resource utilization to the realization of SDG6/11/15 occurred during the latter period. Furthermore, disparities among prefecture-level cities were observed, with ZY exhibiting a higher sustainable development level index, while QXN displayed a lower index. Notably, for cities like GY, LPS, ZY, and AS, characterized by higher urbanization rates, the contribution of water and land resource utilization to the realization of SDG6/11 was higher. Conversely, the contribution of WLR utilization of QDN, TR and QN to the realization of SDG15 was higher, reflecting that their sustainable terrestrial ecosystems placed them at a lower risk of rocky desertification compared to the western part of the study area.
Considering the trend variation, the sustainable development potential index of WLR exhibited no significant change from 2000 to 2020. The overall province’s average potential index experienced a slight decrease from 0.44 in 2000 to 0.42 in 2010, followed by a marginal increase to 0.43 in 2020. Over the past 2 decades, the utilization intensity of WLR in the study area was relatively high, and the sustainable development potential has been at a low level. Consequently, there was a deficiency in the capacity to further support regional sustainable development.
From the perspective of spatial pattern (Figure 7), in 2000, the sustainable development potential index of WLR in the south was the lowest, lower than 0.35, forming a low-value accumulation area. Conversely, the northern region displayed a higher potential index, exceeding 0.45. By 2010, the potential index in the northern region had surpassed 0.5, creating an accumulation area with high values, while other regions maintained relatively low potential indices. Moving to 2020, the south and southeast evolved into a high-value accumulation area, surpassing 0.55, while the central and western regions exhibited lower potential indices. Particularly, the central region, housing the provincial capital, recorded a potential index below 0.3. It's worth noting that a lower potential index corresponds to a higher utilization degree of WLR. Since 2000, the central region has gradually become a focal point for the exploitation and utilization of WLR. This highlights a discernible shift in emphasis towards the central region over the years.
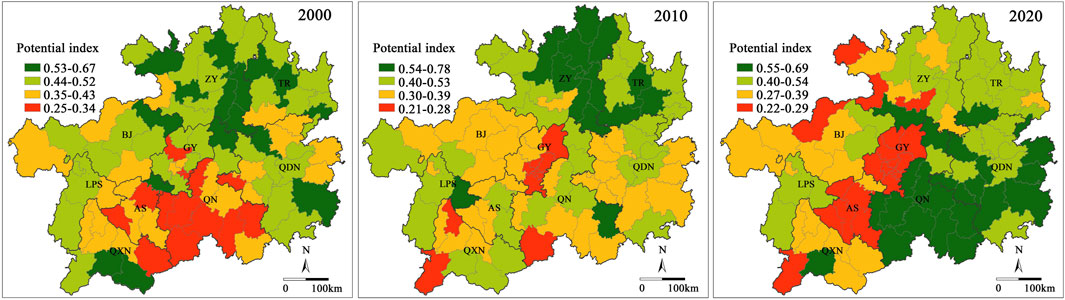
Figure 7. Sustainable development potential index of WLR.
The factor detector was used to analyze the driving factors of spatial differentiation of sustainable development level of WLR (Table 4). Firstly, the Variance Inflation Factor (VIF) test was conducted using the SPSS tool. The VIF values for all six factors were found to be below 5, with an average VIF value of 3.47, indicating the absence of intolerable collinearity issues. Secondly, the single-factor detection was carried out, and the P-value was less than 0.05 as the standard, and the 6 factors showed significant driving effect in 2000,2010 and 2020. The single-factor detection results showed that X3 (urbanization rate) and X6 (NDVI) had the strongest driving effects, which showed that the sustainable development level of WLR can be effectively improved by increasing urbanization rate and improving vegetation status in karst regions. In addition, during 2000–2020, the driving effect of socio-economic factors had gradually increased, while that of natural environmental factors had gradually decreased, indicating that the influence of artificial intervention on the sustainable development level of WLR had been increasing.
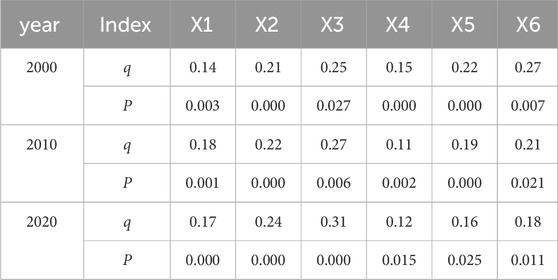
Table 4. Single-factor detection results of sustainable development level.
On the basis of single-factor detection results, two-factor interaction detection was carried out (Table 5). The results showed that the interaction types within the socio-economic factors were nonlinear enhanced, as did the interaction types within natural environmental factors. For example, the interaction type of X2∩X3 was nonlinear enhancement, indicating that while improving the urbanization rate, the growth of economic strength can more effectively enhance the sustainable development level of WLR. Additionally, the interaction types between socio-economic factors and natural environmental factors were two-factor enhancement, as exemplified by factor combination X2∩X6. It showed that the simultaneous improvement of vegetation status and economic development can more effectively enhance the sustainable development level of WLR. Furthermore, the results indicated that for the spatial differentiation of sustainable development level of WLR, the explanatory power of two-factor interaction was more robust than that of the single factor, and the driving effect of the combination of the same attribute factors would be significantly enhanced.
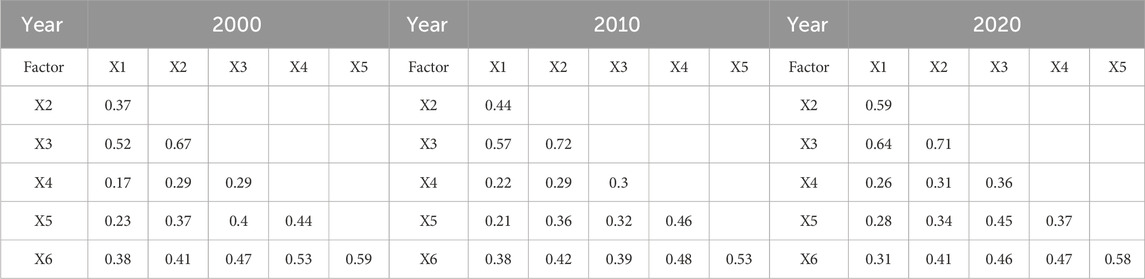
Table 5. Results of two-factor interactive detection of sustainable development level.
The utilization of WLR in karst regions is related to the evolution of rocky desertification. Influenced by meteorological factors such as temperature and precipitation, as well as topographic factors like elevation and slope (Yu et al., 2022), the available WLR in karst regions are insufficient, leading to an imbalanced spatial distribution (Liu L. Y., 2021). This paper selected typical karst regions to evaluate the bearing pressure and matching degree of WLR. Results revealed that, in comparison to regions in western China without extensive karst distribution, the study area experienced higher bearing pressure on cultivated land resources (Lang and Song, 2019). For example, in Chongqing, a neighboring province to the north of the study area, the bearing pressure index of cultivated land resources was about 0.6 from 2010 to 2020 (Zhou et al., 2022). Guizhou, being the only province in China devoid of a plain landform, exhibited significantly higher bearing pressure on construction land resources compared to other provinces. In 2010, for instance, the average bearing pressure index of construction land resources in 12 provinces across western China was close to 1 (Zhou et al., 2022). Karst landforms also exert a notable influence on ecological land resources and water resources. The study found that in the western part of the study area where karst landform was concentrated, the bearing pressure of ecological land resources and water resources was greater. In addition, the matching degree of WLR in the study area also presented a pattern of “high in the east and low in the west.”
The utilization of WLR is closely intertwined with the economic and social development (Xu et al., 2018). Apart from the constraints posed by natural conditions, regional development strategy adjustments also exert a significant impact on the utilization of WLR (Gao et al., 2022). At the beginning of the 21st century, Guizhou Province consistently ranked last in China in terms of per capita GDP, exhibiting a relatively backward economic development level and a lack of capacity to enhance the efficiency of water and land resource utilization (Feng et al., 2022). Since 2000, China has implemented the strategy of “the grand western development”, providing policy and financial support to the western region in terms of the approval of construction land and eco-environmental protection (Sun et al., 2020). From 2000 to 2010, the bearing pressure of construction land resources in the study area decreased, and the sustainable development level increased. However, the persistent issue of unbalanced distribution of ecological land resources and water resources remained unresolved (Feng et al., 2022). In 2012, the central government issued targeted policies to support the development of Guizhou. Through poverty alleviation projects, infrastructure construction and rock desertification control, the spatial imbalance of resources bearing pressure has been effectively alleviated (Lv et al., 2023). The central region has become the focus of urbanization construction, which was corroborated by the findings of this study (Ren et al., 2021). In addition, this paper also found that the matching degree of WLR increased at the provincial and prefecture-level city scales, but the matching status of at the county scale was still not effectively improved.
Reflection and prospect of this research. In the design of sustainable development evaluation system, this study has made notable advancements by eliminating certain indicators which were difficult to obtain. For example, terrestrial ecological evaluation did not take into account the value of biodiversity or the impact of climate change on WLR (Fernandes et al., 2016; Sandström et al., 2017). The evaluation results highlight an inconsistency between the bearing pressure of WLR and their contribution to the realization of SDGs. Notably, the central region exhibited high bearing pressure on construction land, yet the contribution of resource utilization to realizing SDG11 was substantial. This underscores that while basic resource conditions determine sustainable development potential, the level of sustainable development is also influenced by human activities. In addition, the analysis of driving factors can elucidate the relationship between water and land resource utilization and regional development. This study revealed that, whether through single-factor detection or two-factor interaction detection, factors X3 (urbanization rate) and X6 (NDVI) wielded strong explanatory power over the spatial heterogeneity of sustainable development level. Consequently, enhancing the sustainable development level of WLR in karst regions is of paramount significance. This can be achieved by improving resource utilization efficiency through urbanization and enhancing vegetation status through the control of rocky desertification.
Based on the SDGs framework, this paper proposed an indicator system and method for evaluating the utilization of WLR in karst regions and their contribution to the realization of SDGs. Guizhou Province in China was chosen to analyze the variation characteristics of the bearing pressure and matching degree of WLR, as well as the driving factors of sustainable development level. The main conclusions are as follows.
1) The bearing pressure index for the four resource types exhibited diverse variation trends. Between 2000 and 2020, the bearing pressure increased slightly for cultivated land and water resources, with the bearing pressure for cultivated land nearing the critical value of 1. In contrast, the bearing pressure for ecological land decreased slightly, and the bearing pressure for construction land witnessed a significant decrease from 9.71 in 2000 to 2.02 in 2020. Spatial equilibrium in the bearing pressure index for the four resource types improved from 2000 to 2020. Cultivated land displayed a “high in the middle and low at the edge” pattern, while construction land formed a spatial pattern of “high in the middle and low in the north and south” by 2020. Ecological land and water resources exhibited a clear spatial pattern of “high in the west and low in the east.”
2) The results of matching degree analysis of WLR at different scales were different. From the provincial scale and the prefecture-level city scale, the matching degree increased significantly from 2000 to 2020. The spatial pattern had evolved from “high in the east and low in the west” in 2000 to “high in the east and south, low in the middle and west” in 2020. Taking counties as the basic unit, Gini coefficients of 9 prefecture-level cities increased to varying degrees from 2000 to 2010. Subsequently, in some regions, the Gini coefficient showed a decline. In general, it showed that the matching status of WLR in the study area had not been effectively improved at the county scale.
3) The sustainable development level index of WLR showed an overall upward trend, indicating that the contribution of resources utilization to the realization of SDGs continued to rise. The contribution of resources utilization to the realization of SDG2 was always low, which was related to the limited cultivated land resources in karst regions. Regions with higher urbanization rates exhibited a higher contribution of resources utilization to the realization of SDG6/11, and regions with less distribution of karst landforms had a higher contribution of resources utilization to the realization of SDG15. Additionally, the sustainable development potential had been at a low level, indicating a deficiency in the ability to further support regional sustainable development. Since 2000, the focus of WLR exploitation and utilization has gradually shifted from the southern region to the central region.
4) Regarding the spatial heterogeneity of the sustainable development level of WLR, the single-factor detection results showed that X3 (urbanization rate) and X6 (NDVI) had the strongest driving effect, and the driving effect of socio-economic factors had gradually increased during 2000–2020, indicating that the influence of artificial intervention on the sustainable development level of WLR had been increasing. Additionally, the explanatory power of two-factor interactions surpassed that of single factors, and the driving effect of combinations of factors with the same attribute was significantly strengthened.
There is still a certain gap between the WLR utilization and the realization of SDGs in karst regions. Despite a continuous improvement in the sustainable development level of resources utilization in the study area from 2000 to 2020, the sustainable development potential had remained at a low level. According to the results of the study, it is suggested that the sustainable management of the terrestrial ecosystem should be strengthened in the process of rocky desertification control, so as to reduce the bearing pressure on resources and enhance the potential of sustainable development. In addition, efforts should be made to enhance the matching degree of WLR at county level by improving small water conservancy infrastructure. There are also different development strategies for the WLR utilization in different regions. It is suggested that the western region should improve the utilization efficiency of construction land through concentrated urbanization. For the eastern and northern regions with relatively abundant water resources, it is suggested to appropriately increase the tasks of cultivated land protection. The central region is the core of urbanization construction and economic development. It is suggested to establish a cross-regional cooperation mechanism for cultivated land protection and ecological land protection while developing efficient agriculture. These measures collectively contribute to improving the sustainable utilization level of WLR in karst regions.
The raw data supporting the conclusions of this article will be made available by the authors, without undue reservation.
HZ: Conceptualization, Formal Analysis, Methodology, Software, Writing–original draft, Writing–review and editing. QZ: Data curation, Formal Analysis, Supervision, Writing–review and editing. JY: Funding acquisition, Project administration, Resources, Visualization, Writing–review and editing. HX: Investigation, Project administration, Visualization, Writing–review and editing.
The author(s) declare that financial support was received for the research, authorship, and/or publication of this article. This work was supported by the National Key R&D Program of China, Grant No. 2019YFD1100802 and the Project of Power China Guiyang Engineering Corporation Limited, Grant No. YJ2023-11.
Authors HZ, QZ, JY, and HX were employed by Power China Guiyang Engineering Corporation Limited.
The author(s) declare that no Generative AI was used in the creation of this manuscript.
All claims expressed in this article are solely those of the authors and do not necessarily represent those of their affiliated organizations, or those of the publisher, the editors and the reviewers. Any product that may be evaluated in this article, or claim that may be made by its manufacturer, is not guaranteed or endorsed by the publisher.
Bobba, A. G., Singh, V. P., and Bengtsson, L. (1997). Sustainable development of water resources in India. Environ. Manage. 21, 367–393. doi:10.1007/s002679900036
Borja, A., Pouso, S., Galparsoro, I., Manca, E., Vasquez, M., Lu, W., et al. (2022). Applying the China's marine resource-environment carrying capacity and spatial development suitability approach to the Bay of Biscay (North-East Atlantic). Front. Mar. Sci. 9, 972448. doi:10.3389/fmars.2022.972448
Chen, Q. W., Lu, S. X., Xiong, K. N., and Zhao, R. (2021). Coupling analysis on ecological environment fragility and poverty in South China Karst. Environ. Res. 201, 111650. doi:10.1016/j.envres.2021.111650
De Francesco, F., Pattyn, V., and Salamon, H. (2023). The monitoring and evaluation challenges of the sustainable development goals: an assessment in three European countries. Sustain. Dev. 2759, 1913–1924. doi:10.1002/sd.2759
Dickens, C., McCartney, M., Tickner, D., Harrison, I. J., Pacheco, P., and Ndhlovu, B. (2020). Evaluating the global state of ecosystems and natural resources: within and beyond the SDGs. Sustainability 12 (18), 7381. doi:10.3390/su12187381
Duc, N. H., Kumar, P., Lan, P. P., Kurniawan, T. A., Khedher, K. M., Kharrazi, A., et al. (2023). Hydrochemical indices as a proxy for assessing land-use impacts on water resources: a sustainable management perspective and case study of Can Tho City, Vietnam. Nat. Hazards 117, 2573–2615. doi:10.1007/s11069-023-05957-4
Feng, Q., Zhou, Z., Zhu, C., Luo, W., and Zhang, L. (2022). Quantifying the ecological effectiveness of poverty alleviation relocation in karst areas. Remote Sens. 14, 5920. doi:10.3390/rs14235920
Fernandes, M. R., Segurado, P., Jauch, E., and Ferreira, M. T. (2016). Riparian responses to extreme climate and land-use change scenarios. Sci. Total Environ. 569, 145–158. doi:10.1016/j.scitotenv.2016.06.099
Field, M. S. (2021). Groundwater sampling in karst terranes: passive sampling in comparison to event-driven sampling strategy. Hydrogeol. J. 29, 53–65. doi:10.1007/s10040-020-02240-9
Gao, J. B., Du, F. J., Zuo, L. Y., and Jiang, Y. (2021). Integrating ecosystem services and rocky desertification into identification of karst ecological security pattern. Landsc. Ecol. 36, 2113–2133. doi:10.1007/s10980-020-01100-x
Gao, M. W., Hu, Y. C., and Bai, Y. P. (2022). Construction of ecological security pattern in national land space from the perspective of the community of life in mountain, water, forest, field, lake and grass: a case study in Guangxi Hechi, China. Ecol. Indic. 139, 108867. doi:10.1016/j.ecolind.2022.108867
Gedefaw, M., Denghua, Y., and Girma, A. (2023). Assessing the impacts of land use/land cover changes on water resources of the Nile River Basin, Ethiopia. Atmosphere 14, 749. doi:10.3390/atmos14040749
Geris, J., Comte, J. C., Franchi, F., Petros, A. K., Tirivarombo, S., Selepeng, A. T., et al. (2022). Surface water-groundwater interactions and local land use control water quality impacts of extreme rainfall and flooding in a vulnerable semi-arid region of Sub-Saharan Africa. J. Hydrol. 609, 127834. doi:10.1016/j.jhydrol.2022.127834
Han, Z., and Song, W. (2019). Spatiotemporal variations in cropland abandonment in the Guizhou-Guangxi karst mountain area, China. J. Clean. Prod. 238, 117888. doi:10.1016/j.jclepro.2019.117888
Huang, J., Ge, Z., Huang, Y. Q., Tang, X. G., Shi, Z., Lai, P. Y., et al. (2022). Climate change and ecological engineering jointly induced vegetation greening in global karst regions from 2001 to 2020. Plant Soil 475, 193–212. doi:10.1007/s11104-021-05054-0
Ibarrola-Rivas, M. J., Granados-Ramirez, R., and Nonhebel, S. (2017). Is the available cropland and water enough for food demand? A global perspective of the Land-Water-Food nexus. Adv. Water Resour. 110, 476–483. doi:10.1016/j.advwatres.2017.09.018
Lane, M. (2010). The carrying capacity imperative: assessing regional carrying capacity methodologies for sustainable land-use planning. Land Use Policy 27, 1038–1045. doi:10.1016/j.landusepol.2010.01.006
Lang, Y. Q., and Song, W. (2019). Quantifying and mapping the responses of selected ecosystem services to projected land use changes. Ecol. Indic. 102, 186–198. doi:10.1016/j.ecolind.2019.02.019
Leal Filho, W., Dibbern, T., Viera Trevisan, L., Coggo Cristofoletti, E., Dinis, M. A. P., Matandirotya, N., et al. (2023). Mapping universities-communities partnerships in the delivery of the sustainable development goals. Front. Environ. Sci. 11, 1246875. doi:10.3389/fenvs.2023.1246875
Lee, B. X., Kjaerulf, F., Turner, S., Cohen, L., Donnelly, P. D., Muggah, R., et al. (2016). Transforming our world: implementing the 2030 Agenda through sustainable development goal indicators. J. Public Health Policy 37, 13–31. doi:10.1057/s41271-016-0002-7
Li, B., Zhang, W. J., Long, J., Chen, M. Y., Nie, J. L., and Pu Liu, P. (2023). Regional water resources security assessment and optimization path analysis in karst areas based on emergy ecological footprint. Appl. Water Sci. 13, 142. doi:10.1007/s13201-023-01951-0
Lilburne, L., Eger, A., Mudge, P., Ausseil, A. G., Stevenson, B., Herzig, A., et al. (2020). The land resource circle: supporting land-use decision making with an ecosystem-service-based framework of soil functions. Geoderma 363, 114134. doi:10.1016/j.geoderma.2019.114134
Liu, L. Y. (2021a). Assessment of water resource security in karst area of Guizhou Province, China. Sci. Rep. 11, 7641. doi:10.1038/s41598-021-87066-5
Liu, W. H., Wang, Y. Z., Huang, J. K., and Zhu, W. B. (2023). Assessment on the sustainability of water resources utilization in Central Asia based on water resources carrying capacity. J. Geogr. Scie. 33, 1967–1988. doi:10.1007/s11442-023-2161-3
Liu, X., Cai, Z. Y., Xu, Y., Zheng, H. H., Wang, K. G., and Zhang, F. R. (2022). Suitability evaluation of cultivated land reserved resources in Arid Areas based on regional water balance. Water Resour. Manag. 36 (4), 1463–1479. doi:10.1007/s11269-022-03093-5
Liu, Y. (2021b). Household livelihood choices under the different eco-environment in the karst area: a case study of Anshun City, southwest of China. Environ. Res. 197, 111171. doi:10.1016/j.envres.2021.111171
Liu, Y. L., Zhuo, L., Varis, O., Fang, K., Liu, G., and Wu, P. (2021). Enhancing water and land efficiency in agricultural production and trade between Central Asia and China. Sci. Total Environ. 780, 146584. doi:10.1016/j.scitotenv.2021.146584
Lv, Y., Zhang, L., Li, P., He, H., Ren, X., and Zhang, M. (2023). Ecological restoration projects enhanced terrestrial carbon sequestration in the karst region of Southwest China. Front. Ecol. Evol. 11, 1179608. doi:10.3389/fevo.2023.1179608
Meng, G., Wang, K. Y., Wang, F. Y., and Dong, Y. J. (2023). Analysis of the tourism-economy-ecology coupling coordination and high-quality development path in karst Guizhou Province, China. Ecol. Indic. 154, 110858. doi:10.1016/j.ecolind.2023.110858
Mohammed, Y. S., Mustafa, M. W., Bashir, N., Ogundola, M. A., and Umar, U. (2014). Sustainable potential of bioenergy resources for distributed power generation development in Nigeria. Renew. Sust. Energ. Rev. 34, 361–370. doi:10.1016/j.rser.2014.03.018
Pacetti, T., Castelli, G., Bresci, E., and Caporali, E. (2020). Water values: participatory water ecosystem services assessment in the Arno River Basin, Italy. Water Resour. Manage 34, 4527–4544. doi:10.1007/s11269-020-02684-4
Pei, J., Wang, L., Huang, N., Geng, J., Cao, J., and Niu, Z. (2018). Analysis of Landsat-8 OLI Imagery for estimating exposed bedrock fractions in typical karst regions of Southwest China using a karst bare-rock index. Remote Sens. 10, 1321. doi:10.3390/rs10091321
Peng, L., Chen, T. T., Deng, W., and Liu, Y. (2022a). Exploring ecosystem services trade-offs using the Bayesian belief network model for ecological restoration decision-making: a case study in Guizhou Province, China. Ecol. Indic. 135, 108569. doi:10.1016/j.ecolind.2022.108569
Peng, L., Zhou, S., and Chen, T. T. (2022b). Mapping forest restoration probability and driving archetypes using a Bayesian belief network and SOM: towards karst ecological restoration in Guizhou, China. Remote Sens. 14, 780. doi:10.3390/rs14030780
Qiao, Y. N., Jiang, Y. J., and Zhang, C. Y. (2021). Contribution of karst ecological restoration engineering to vegetation greening in southwest China during recent decade. Ecol. Indic. 121, 107081. doi:10.1016/j.ecolind.2020.107081
Qin, T. L., Feng, J. M., Li, C. H., Zhang, X., Yan, D. H., Liu, S. S., et al. (2023). Risk assessment and configuration of water and land resources system network in the Huang-Huai-Hai watershed. Ecol. Indic. 154, 110712. doi:10.1016/j.ecolind.2023.110712
Ren, L., Gao, J., Song, S., Li, Z., and Ni, J. (2021). Evaluation of water resources carrying capacity in Guiyang City. Water 13, 2155. doi:10.3390/w13162155
Safaei, M., Bashari, H., Kleinebecker, T., Fakheran, S., Jafari, R., and Große-Stoltenberg, A. (2023). Mapping terrestrial ecosystem health in drylands: comparison of field-based information with remotely sensed data at watershed level. Landsc. Ecol. 38, 705–724. doi:10.1007/s10980-022-01454-4
Sandström, V., Kauppi, P. E., Scherer, L., and Kastner, T. (2017). Linking country level food supply to global land and water use and biodiversity impacts: the case of Finland. Sci. Total Environ. 575, 33–40. doi:10.1016/j.scitotenv.2016.10.002
Shiferaw, H., Bewket, W., Alamirew, T., Zeleke, G., Teketay, D., Bekele, K., et al. (2019). Implications of land use/land cover dynamics and Prosopis invasion on ecosystem service values in Afar Region, Ethiopia. Sci. Total Environ. 675, 354–366. doi:10.1016/j.scitotenv.2019.04.220
Singh, A. (2022). Better water and land allocation for long-term agricultural sustainability. Water Resour. manage. 36, 3505–3522. doi:10.1007/s11269-022-03208-y
Sun, M. Y., Li, X. H., Yang, R. J., Zhang, Y., Zhang, L., Song, Z. W., et al. (2020). Comprehensive partitions and different strategies based on ecological security and economic development in Guizhou Province, China. J. Clean. Prod. 274, 122794. doi:10.1016/j.jclepro.2020.122794
Swiader, M., Lin, D., Szewranski, S., Kazak, J. K., Iha, K., van Hoof, J., et al. (2020). The application of ecological footprint and biocapacity for environmental carrying capacity assessment: a new approach for European cities. Environ. Sci. Policy 105, 56–74. doi:10.1016/j.envsci.2019.12.010
Tan, K., Zhao, X. Q., Pu, J. W., Li, S. N., Li, Y. H., Miao, P. P., et al. (2021). Zoning regulation and development model for water and land resources in the karst mountainous region of Southwest China. Land Use Policy 109, 105683. doi:10.1016/j.landusepol.2021.105683
Tian, Y. C., Bai, X. Y., Wang, S. J., Qin, L., and Li, Y. (2017). Spatial-temporal changes of vegetation cover in Guizhou province, southern China. Chin. Geogr. Sci. 27, 25–38. doi:10.1007/s11769-017-0844-3
Wang, J. F., Zhang, T. L., and Fu, B. J. (2016). A measure of spatial stratified heterogeneity. Ecol. Indic. 67, 250–256. doi:10.1016/j.ecolind.2016.02.052
Wang, Q., Li, Y. B., and Luo, G. J. (2020). Spatiotemporal change characteristics and driving mechanism of slope cultivated land transition in karst trough valley area of Guizhou Province, China. Environ. Earth Sci. 79 (12), 284. doi:10.1007/s12665-020-09035-x
Xu, Y., Wang, S. J., Bai, X. Y., Shu, D. C., and Tian, Y. C. (2018). Runoff response to climate change and human activities in a typical karst watershed, SW China. Plos One 13, e0193073. doi:10.1371/journal.pone.0193073
Ying, B., Liu, T., Ke, L., Xiong, K., Li, S., Sun, R., et al. (2023). Identifying the landscape security pattern in karst rocky desertification area based on ecosystem services and ecological sensitivity: a case study of Guanling County, Guizhou Province. Forests 14, 613. doi:10.3390/f14030613
Yu, M., Song, S., He, G., and Shi, Y. (2022). Vegetation landscape changes and driving factors of typical karst region in the Anthropocene. Remote Sens. 14, 5391. doi:10.3390/rs14215391
Yu, Y. H., and Chi, Y. K. (2020). Ecological stoichiometric characteristics of soil at different depths in a karst plateau mountain area of China. Pol. J. Environ. Stud. 29, 969–978. doi:10.15244/pjoes/102781
Zhang, J. Y., Dai, M. H., Wang, L. C., Zeng, C. F., and Su, W. C. (2016). The challenge and future of rocky desertification control in karst areas in southwest China. Solid earth. 7, 83–91. doi:10.5194/se-7-83-2016
Zhang, P. P., Hu, Y. M., Xiao, D. N., Li, X. Z., Yin, J., and He, H. S. (2010). Rocky desertification risk zone delineation in karst plateau area: a case study in Puding County, Guizhou Province. Chin. Geogr. Sci. 20, 84–90. doi:10.1007/s11769-010-0084-2
Zhang, T., Zuo, S. Y., Yu, B., Zheng, K. X., Chen, S. W., and Huang, L. (2023). Spatial patterns and controlling factors of the evolution process of karst depressions in Guizhou province, China. J. Geogr. Sci. 33, 2052–2076. doi:10.1007/s11442-023-2165-z
Zhang, Y., Yan, Z. X., Song, J. X., Wei, A. L., Sun, H. T., and Cheng, D. D. (2020). Analysis for spatial-temporal matching pattern between water and land resources in Central Asia. Hydrol. Res. 51, 994–1008. doi:10.2166/nh.2020.177
Zhao, Y. L., Shi, Y., Feng, C. C., and Guo, L. (2022). Exploring coordinated development between urbanization and ecosystem services value of sustainable demonstration area in China-take Guizhou Province as an example. Ecol. Indic. 144, 109444. doi:10.1016/j.ecolind.2022.109444
Zhou, C., Gong, H., Chen, B., Gao, M., Cao, Q., Cao, J., et al. (2020). Land subsidence response to different land use types and water resource utilization in Beijing-Tianjin-Hebei, China. Remote Sens. 12, 457. doi:10.3390/rs12030457
Keywords: water-land resources, karst, SDGs, evaluation, Guizhou Province
Citation: Zhang H, Zhou Q, Yang J and Xiang H (2025) Evaluation of water-land resources in karst regions within the framework of sustainable development goals. Front. Environ. Sci. 13:1551156. doi: 10.3389/fenvs.2025.1551156
Received: 24 December 2024; Accepted: 14 February 2025;
Published: 07 March 2025.
Edited by:
Lingli Qing, Guangzhou College of Commerce, ChinaReviewed by:
Tao Peng, Guizhou Communication Polytechic University, ChinaCopyright © 2025 Zhang, Zhou, Yang and Xiang. This is an open-access article distributed under the terms of the Creative Commons Attribution License (CC BY). The use, distribution or reproduction in other forums is permitted, provided the original author(s) and the copyright owner(s) are credited and that the original publication in this journal is cited, in accordance with accepted academic practice. No use, distribution or reproduction is permitted which does not comply with these terms.
*Correspondence: Jianzan Yang, eWFuZ2p6Z3l5QHBvd2VyY2hpbmEuY24=
Disclaimer: All claims expressed in this article are solely those of the authors and do not necessarily represent those of their affiliated organizations, or those of the publisher, the editors and the reviewers. Any product that may be evaluated in this article or claim that may be made by its manufacturer is not guaranteed or endorsed by the publisher.
Research integrity at Frontiers
Learn more about the work of our research integrity team to safeguard the quality of each article we publish.