 Heng Zhou
 Mingdong Tang
 Jun Huang3
94% of researchers rate our articles as excellent or good
Learn more about the work of our research integrity team to safeguard the quality of each article we publish.
Find out more
ORIGINAL RESEARCH article
Front. Environ. Sci., 20 February 2025
Sec. Land Use Dynamics
Volume 13 - 2025 | https://doi.org/10.3389/fenvs.2025.1551050
Introduction: Karst regions are integral to the global carbon cycle. However, land use changes of karst regions driven by urbanization and desertification contribute to the instability of carbon storage, leading to uncertainties in the future. Understanding these instabilities and uncertainties is crucial for formulating carbon sequestration and land management strategies.
Methods: This study employed Patch-generating Land Use Simulation (PLUS) and Integrated Valuation of Ecosystem Services and Trade-offs (InVEST) to estimate carbon storage, and introduced the Coefficient of Variation (CV) to assess the instability and uncertainty. Multiscale Geographically Weighted Regression (MGWR) was applied to explore the mechanisms, while Polynomial Regression (PR) identified the stable intervals of factors, informing land-use policies.
Results and Discussion: (1) From 2000 to 2020, Guiyang’s carbon storage rose from 136.62 Tg to 142.13 Tg. By 2035, projections under natural development, urban expansion, and ecological protection scenarios estimate increases to 147.50 Tg, 147.40 Tg, and 147.82 Tg, respectively. (2) Carbon storage instability increased from 2000 to 2020, while uncertainty is expected to decrease by 2035. Instability was primarily due to transitions of Cropland-Forest, Forest-Cropland, Cropland-Grassland, and Cropland-Impervious, while uncertainties mainly arise from Cropland-Forest, Cropland-Impervious, and Grassland-Impervious transitions. (3) DEM, AI, Distance from national highways, SHDI, and Mean annual precipitation affected instability significantly. (4) Encouraging Shrub-Forest, Shrub-Cropland and Cropland-Forest conversions, and controlling Forest-Cropland, Forest-Shrub, and Cropland-Impervious conversions within the stable intervals of factors, can enhance carbon storage and reduce uncertainty. This study establishes a methodology for evaluating carbon storage instability and uncertainty in karst regions, which is an extension of carbon storage research.
As global carbon emissions continue to rise and climate threats intensify, carbon neutrality strategies have become imperative, with enhancing carbon storage as a crucial element in achieving this goal. Terrestrial ecosystems, one of the three major carbon pools on Earth, significantly influence the global carbon cycle and carbon balance (Wang K. et al., 2022). However, these ecosystems are inherently unpredictable, complex, and subject to uncertainty, leading to instability in their carbon storage capacity (Hou et al., 2013). Instability refers to variations in current and historical carbon storage capacity, while uncertainty pertains to fluctuations in future carbon storage capacity. Greater instability indicates more pronounced differentiation in current carbon storage; higher uncertainty suggests an increased risk of future carbon storage. These factors can profoundly impact policy-making. Land use change have been identified as key components of human interference in the global carbon cycle (Wang et al., 2023) and major contributors to the instability and uncertainty of carbon storage in terrestrial ecosystems (Chang et al., 2022). Assessing carbon storage capacity instability and uncertainty in the context of land use change and analyzing the underlying mechanisms are critical for understanding ecosystem services. This understanding is essential for formulating land-use policies and advancing carbon neutrality (Grêt-Regamey et al., 2013; Hamel and Benjamin, 2017).
In recent years, scholars have conducted extensive research on the instability and uncertainty and carbon storage. Regarding the research content, studies on instability/uncertainty are mostly conducted from the perspective of ecosystem services (Grêt-Regamey et al., 2013; Yang Y. et al., 2024; Hou et al., 2013; Hamel and Benjamin, 2017). These include assessments of ecosystem service uncertainty (Ma et al., 2024), methods for reducing uncertainty in ecosystem service valuation (Xing et al., 2020; Ma and Wen, 2021; Wang B. et al., 2022; Gao et al., 2021), analyses of the impacts of this uncertainty (Wang B. et al., 2022; Ma and Wen, 2021), and investigations into its sources (Hou et al., 2013). Research on carbon storage has predominantly focused on the spatial and temporal evolution of carbon storage, modeling predictions (Wang et al., 2023; Xu C. et al., 2023; Fan et al., 2023; Li X. et al., 2022), and impact mechanisms (Li and Geng, 2023). However, there has been limited research on carbon storage from the perspective of instability and uncertainty. Among the few studies that address carbon storage uncertainty, most have examined it from the perspectives of geological formations (Nordbotten et al., 2024; Sun et al., 2023; Xiao et al., 2024; Mahjour and Faroughi, 2023), risk management (Watson et al., 2014; Zhang et al., 2019), and ecological economics (Narita and Klepper, 2016; Chen et al., 2016). A significant gap exists in the literature regarding the assessment of carbon storage instability and uncertainty in the context of land use change and the analysis of their underlying mechanisms.
As for methodology, carbon storage estimation is primarily conducted using several approaches, including the sample land inventory method (Zhu et al., 2021), the IPCC inventory method (Sun and Shi, 2020), model simulation (Huang et al., 2022), and the InVEST model (Lahiji et al., 2020; Shao et al., 2023). Among these, the InVEST model is favored for its simplicity, flexible parameters, and high precision, making it widely used in recent carbon storage studies (Zhu et al., 2022; Islam et al., 2022). Methods for assessing instability and uncertainty include comparative analysis, optimization of parameters, global sensitivity analysis, mapping comparative statistics (MCS), scenario analysis, and Bayesian networks (Ma et al., 2024; Grêt-Regamey et al., 2013; Harmáčková and Vačkář, 2018; Alshehri et al., 2024; Refsgaard et al., 2007). However, these methods face challenges when applied to multi-scenario or multi-temporal studies of ecosystem services, particularly in addressing differences in data units and spatial visualization capabilities. The methods used to detect the influence mechanism include Geographical Detector, GWR and other models (Liu et al., 2019; Niu and Pan, 2021; Li et al., 2023a), but the exploration scale is difficult to penetrate into the patch scale. The MGWR model, which incorporates all spatial patterns by constructing the bandwidth of drivers (Oshan et al., 2019), enhances the scientific rigor of research outcomes.
Additionally, the majority of studies focus on countries (Chang et al., 2022; Li et al., 2023a; Li et al., 2004), provinces (Yang Y. et al., 2024; Wang X. et al., 2022; Xing et al., 2020; Zhu et al., 2024), major river basins (Xu W. et al., 2023; Liu et al., 2019; Xu C. et al., 2023), and first-tier cities (Wang et al., 2023; Yao et al., 2023; Xu D. et al., 2022; Wang X. et al., 2022; Zou et al., 2023). In contrast, karst geological units remain underexplored (Du et al., 2023; Li et al., 2024; Li and Geng, 2023).
Karst regions comprise approximately 15% of the Earth’s land area and play a critical role in influencing global terrestrial carbon stocks (Fleury et al., 2013). Firstly, these regions are key areas contributing to the decline in global carbon storage. Due to their thin soil layers, fragmented distribution, susceptibility to erosion, and pronounced rocky desertification, karst regions experience reduced vegetation cover, leading to a significant decrease in carbon storage (Luo et al., 2024). Secondly, karst regions also serve as important carbon sinks. Much of the land in these areas consists of bare rocky gravel and forested land, with vegetation largely composed of shrubs and broad-leaved forests. This presents opportunities for afforestation and the conversion of shrubland to forest (Liu et al., 2016).
Moreover, compared to other ecosystems, the karst region is particularly sensitive to the instability and uncertainty of carbon storage. First, the prevalence of rocky desertification in karst areas contributes to more frequent fluctuations in carbon storage. The widespread occurrence of rocky desertification leads to frequent changes in vegetation cover, which in turn drives frequent variations in carbon storage (Li and Zhang, 2024). Second, the per-unit-area carbon storage capacity in karst regions is significantly lower. The ecosystem organic carbon storage for shrub grasslands, thorn shrubbery, forest-shrub transitions, and secondary forests in karst regions is 3.81, 4.72, 5.68, and 15.1 kg/m2, substantially lower than that of other ecosystems in non-karst regions (Bertilsson et al., 2013). Consequently, carbon storage in these areas exhibits more pronounced fluctuations. Third, vegetation in karst regions is particularly vulnerable to external factors. Due to shallow soils and limitations in ecological water availability, vegetation in these regions is highly susceptible to environmental changes, resulting in greater carbon storage instability (Ao et al., 2025). Fourth, land use changes in karst areas are unusually frequent. Natural and anthropogenic factors, such as rocky desertification, urbanization, and afforestation, have significantly intensified the frequency of land use changes in karst regions. This has led to marked spatial differentiation and volatility in carbon storage, resulting in pronounced instability and uncertainty in the region’s carbon storage capacity (Kinsey-Henderson and Wilkinson, 2013). Therefore, understanding the dynamics of this instability and uncertainty is essential for devising land management strategies aimed at enhancing global terrestrial carbon storage.
As shown in Figure 1, Southwest China is situated at the heart of one of the world’s three largest contiguous karst regions (Sun et al., 2020), where deforestation and desertification have contributed to a decline in carbon storage (Wang et al., 2019). Since 2000, the Chinese government has implemented projects aimed at converting farmland to forest and comprehensively addressing rocky desertification in the southwestern karst region. These efforts have enhanced the diversity and complexity of forest ecosystems (Shao et al., 2023). Newly established forests account for approximately 32% of the region’s forest carbon sinks (Tong et al., 2020). Carbon storage in the region has been subject to both natural degradation and artificial enhancement, resulting in significant instability and uncertainty. This study focuses on Guiyang, a representative karst city in Southwest China. Using land use change data from 2000 to 2020, the Patch-Generating Land Use Simulation model (PLUS) was employed to project land use patterns for 2035 under multiple scenarios. The InVEST model was utilized to estimate carbon storage, while the coefficient of variation (CV) was introduced to assess the instability and uncertainty of carbon storage and to reveal its spatio-temporal evolution characteristics. The Vector Land-parcel-based Landscape Index (VecLI) and the MGWR models were used to investigate the factors influencing carbon storage instability and uncertainty. Polynomial regression (PR) was applied to identify the stable interval of influencing factors. Finally, policy recommendations are proposed for land use planning in Guiyang to enhance the stability and sustainability of carbon storage and contribute to achieving carbon neutrality.
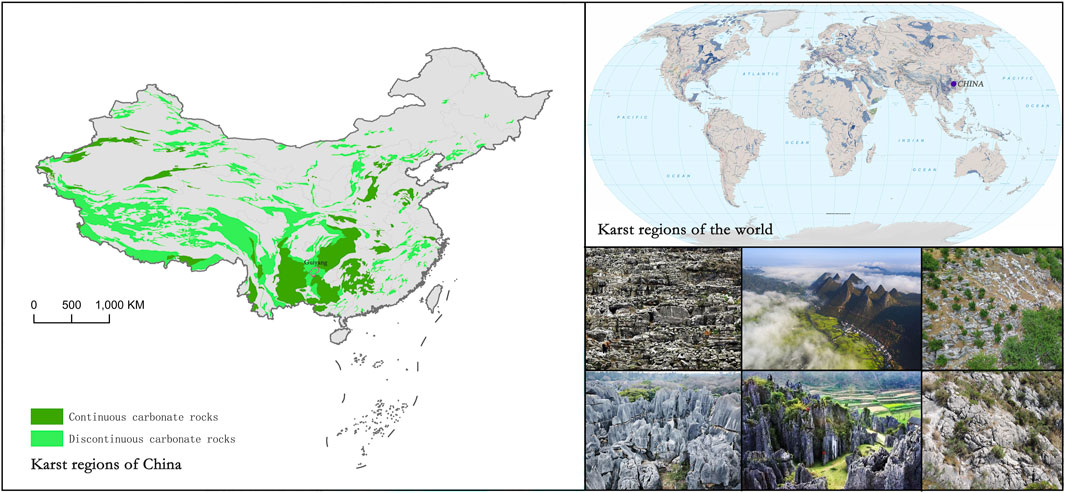
Figure 1. Distribution of karst regions and rock desertification phenomenon.
This paper integrates the PLUS, InVEST, and CV models, and introduces the ACV and SCV indices, establishing a methodology for evaluating carbon storage instability and uncertainty, which is an important extension of existing carbon storage research. Simultaneously, this study tackles the underexplored topic of carbon storage dynamics in karst regions, which are ecologically critical yet highly susceptible to human-induced changes. Furthermore, the findings of this study offer a practical and actionable land management strategy to enhance carbon sequestration and mitigate uncertainties in karst regions, thereby contributing to global carbon cycling and balance.
Guiyang (26°11′N–27°22′N, 106°07′E−107°17′E) is situated in the heart of the karst region in southwest China (Figure 2). It covers a total area of 8,034 km2, with karst landforms comprising 85.03% of this area. These distinctive karst features contribute to a unique mountainous urban landscape but also result in a barren and fragile ecological environment (Lin and Wang, 2023). Guiyang has a subtropical plateau monsoon humid climate, characterized by an annual average temperature of 15.3°C and total annual precipitation of 1,129.5 mm. The dominant vegetation is subtropical humid evergreen broad-leaved forest, with representative plant species including Lauraceae, Fagaceae, and Theaceae, while the primary soil type is acidic yellow soil. Guiyang serves as the political, cultural, and economic center of Guizhou Province. The city is administratively divided into six districts (Yunyan, Nanming, Guanshanhu, Huaxi, Baiyun, and Wugang), three counties (Xiuwen, Xifeng, and Kaiyang), and one county-level city (Qingzhen). In 2023, the GDP reached 515.475 billion Yuan, and the permanent population was 6.4029 million.
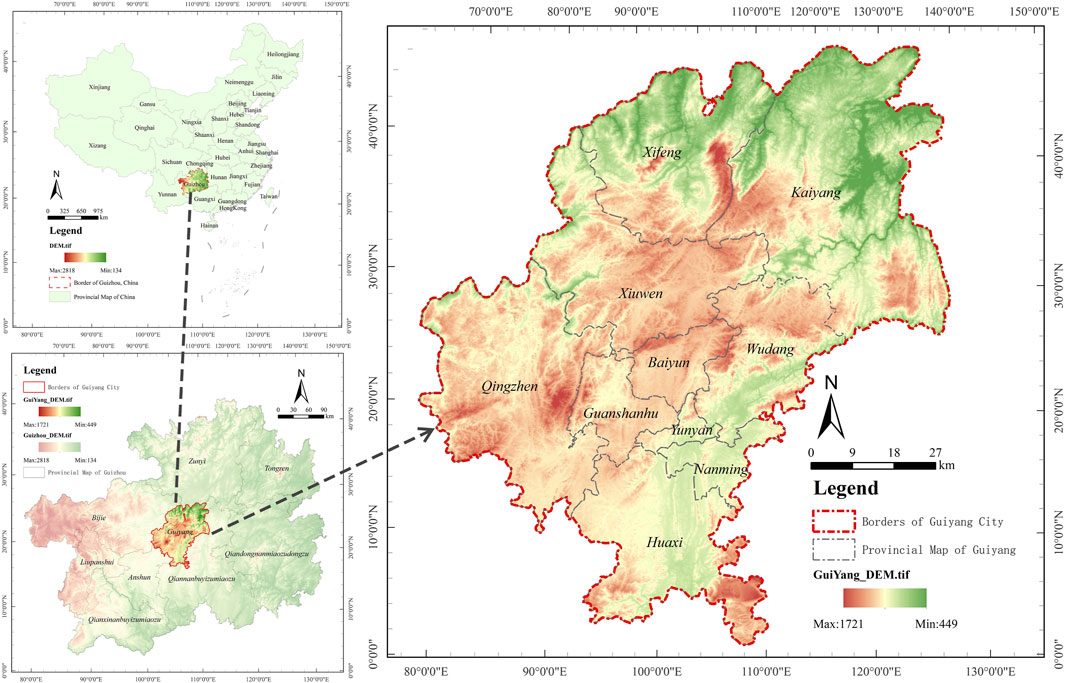
Figure 2. Location of study area.
The data sources and processing methods used in this study are summarized in Table 1. The land use data were obtained from the CLCD land use dataset (https://zenodo.org/record/8176941), which offers a higher temporal resolution compared to datasets such as GLC_FCS30, Global30, AGLC 2000_2015, FROM-GLC10, ESA10, and ESRI10 (Yang and Huang, 2021). The land was classified into nine categories: Cropland, Forest, Shrub, Grassland, Water, Snow/Ice, Barren, Impervious, and Wetland. The selection of influencing factors was informed by existing studies (Xu C. et al., 2023; Zhang et al., 2022; Gao L. et al., 2022) and encompasses three domains: natural environment, socio-economic conditions, and spatial distance. First, natural conditions such as climate, topography, and hydrology fundamentally determine variations in land use and, consequently, the spatial distribution of carbon storage (Zhou et al., 2024; Yang Y. et al., 2024). Second, the level of economic development and the intensity of human activities significantly influence land-use transitions, thereby contributing to carbon storage instability and uncertainty (Yang Y. et al., 2024, Yang, Lu, et al., 2024). Third, spatial distance plays a critical role in facility siting, as spatial accessibility exerts a considerable impact on land-use changes (Li et al., 2024; Zou et al., 2023). Finally, based on principles of data accessibility, relevance, quantifiability, spatial variability, and consistency, a total of 19 influencing factors were selected for analysis. The data for these factors were sourced from the Resource and Environment Science Data Center of the Chinese Academy of Sciences (https://www.resdc.cn/).
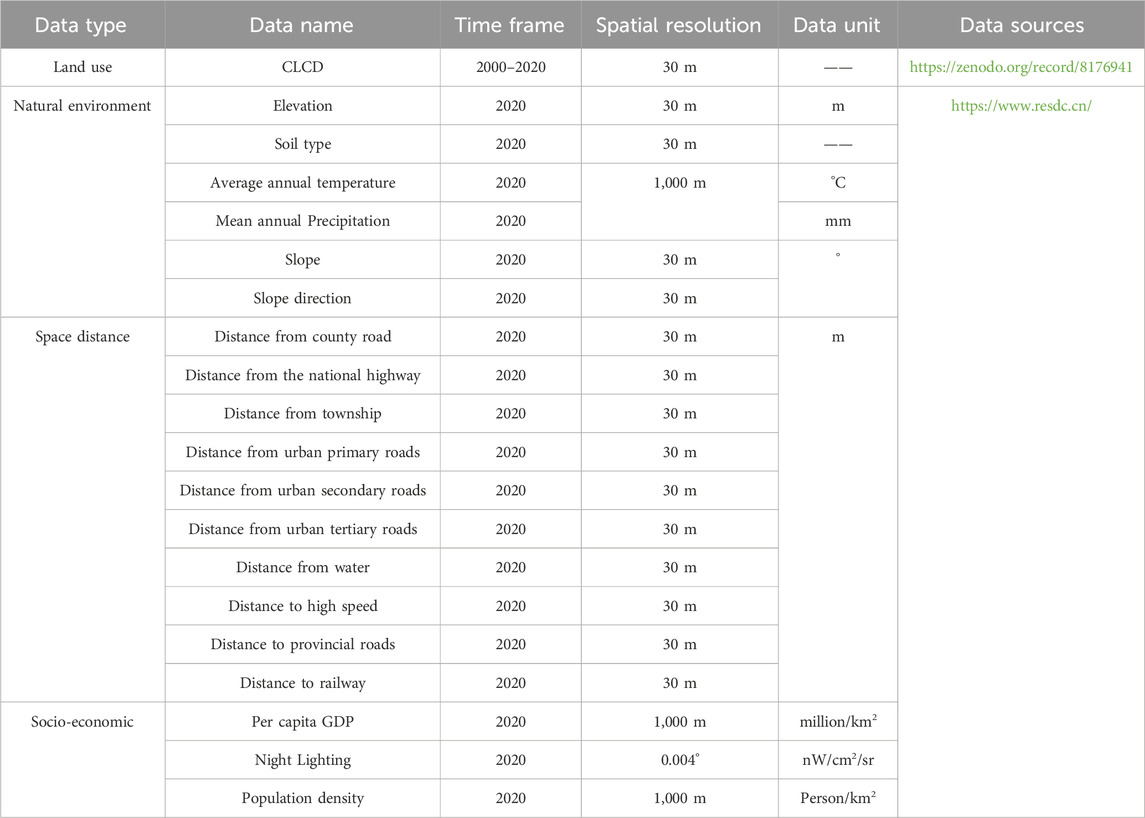
Table 1. Study data information.
The research framework consists of four integrated components that combine the PLUS, InVEST, CV, VecLI, MGWR, and PR models (Figure 3). (1) The spatial and temporal evolution of land use from 2000 to 2020 was analyzed, and land use in multiple scenarios for 2035 was simulated by using the PLUS. (2) The spatial and temporal evolution of carbon storage from 2000 to 2035, based on eight periods of land use data, was examined by using the InVEST. (3) Carbon storage instability and uncertainty were assessed by introducing the CV metric, and the MWGR and VecLI were employed to explore the underlying mechanisms. The stable interval of each factor was identified by using PR. The types of high-risk land conversion that cause carbon storage instability and uncertainty were identified by the Average of CV(ACV). (4) Finally, policy recommendations for land use planning were proposed.
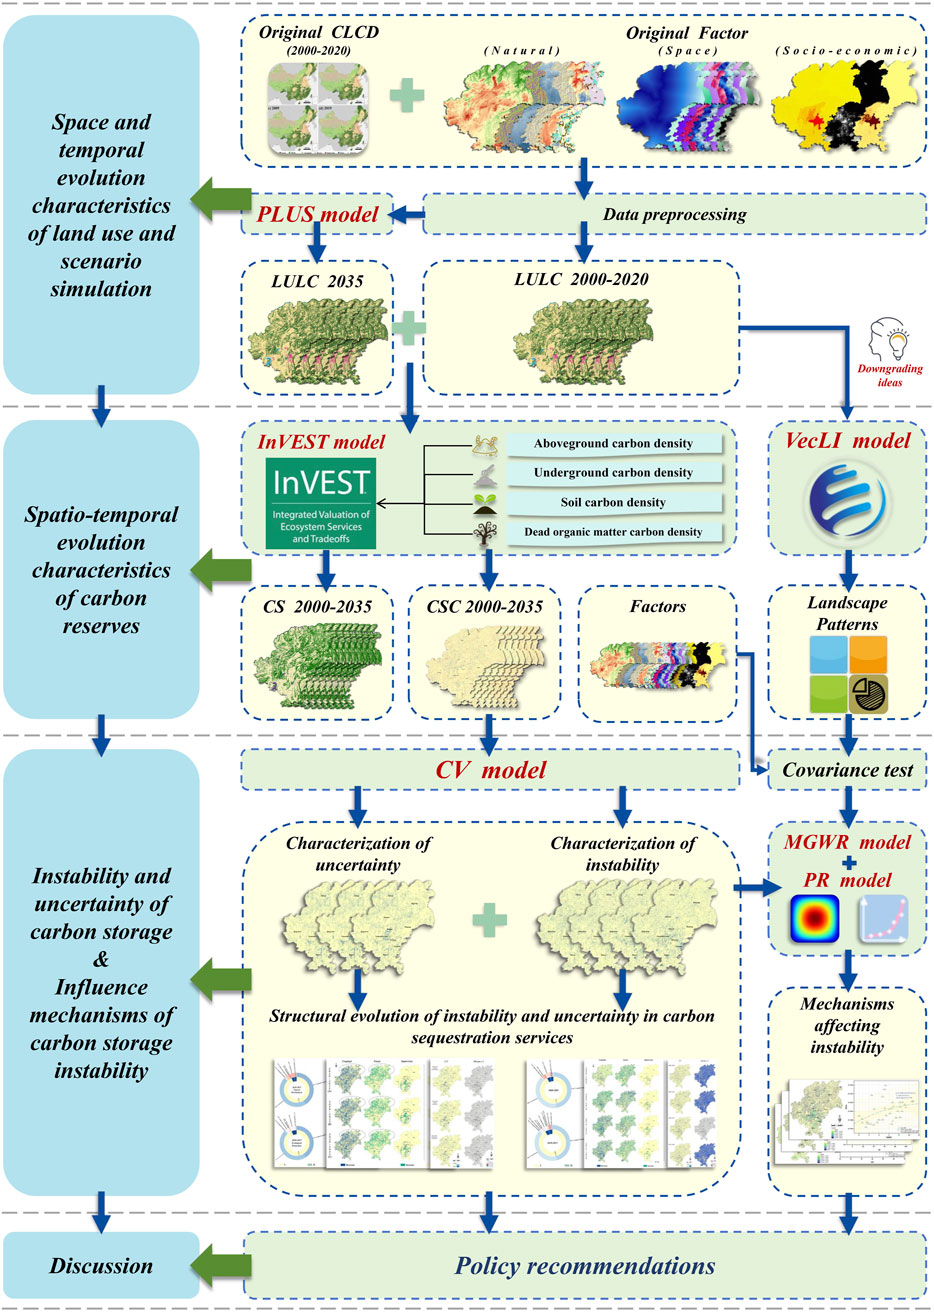
Figure 3. Research framework.
The land use transfer matrix is used to reveal the mutual transformation of different land use types. The calculation formula is shown in Equation 1.
where
Existing multi-scenario land use simulation models primarily include CA, CLUE-S, FLUS, and PLUS models. The CA model, however, struggles to simulate patch-level changes across multiple land use types, resulting in limited predictive accuracy (Wu et al., 2022). The CLUE-S model (Li et al., 2023b; Ning et al., 2018) and the FLUS model (Lv et al., 2021; Wen et al., 2023; Zhang et al., 2023) enable high-precision land use change simulations but are constrained to utilizing land use data from a single time point. Consequently, they lack a temporal dimension, resulting in predictions with low coupling to actual changes, and they fail to uncover the driving mechanisms of land use change. In contrast, the PLUS model excels in extracting probabilities of land use change over a given time period, enabling multi-scenario, multi-scale, and high-precision simulations. Furthermore, it has the capability to reveal the driving mechanisms behind land use changes. Its flexible handling of diverse land use patch dynamics also provides robust support for subsequent carbon storage predictions (Liang et al., 2021). The PLUS model was selected to simulate land use change which consists of the following four parts.
The Random Forest Classification (RFC) is used to explore the probability of various land use expansion. The calculation formula is shown in Equation 2.
where
The Markov model is used to estimate the demand of various land types. The calculation formula is shown in Equation 3.
where
CARS integrates land type demand, the land use transition cost matrix, and neighborhood weights to obtain the spatial distribution results of land use. The calculation formula is shown in Equation 4.
where the term
The PLUS model employs three coefficientsto validate simulation accuracy, including Kappa, Figure of Merit (FoM), and Overall Accuracy (OA). Among them, the Kappa coefficient assesses the overall accuracy of simulated maps by measuring the consistency between mapping precision and user accuracy. The algorithm is shown in Equation 5.
where
The FoM coefficient is a statistical measure used to evaluate the alignment between simulation results and actual conditions. It is calculated based on the actual and simulated land use areas for each category. The algorithm is shown in Equation 6.
where A represents the error area where actual changes were predicted as no change; B denotes the correct area where both actual and predicted changes align; M refers to the error area where actual changes differ from predicted changes; and N indicates the error area where actual no-change regions were predicted as changes. The FoM value ranges from 0 to 1, with higher values reflecting greater simulation accuracy. However, there is no universally fixed threshold for this metric, and in many cases, the FoM value does not exceed 0.5 (Liang et al., 2021; Liang et al., 2021).
The OA measures the percentage of correctly predicted samples. The algorithm is shown in Equation 7.
where TP represents the number of positive samples correctly identified; TN denotes the number of negative samples correctly identified; FP refers to the number of negative samples incorrectly identified as positive; FN indicates the number of positive samples incorrectly identified as negative.
In this study, the InVEST model’s carbon module was utilized to estimate carbon storage across different land classes by assessing four fundamental carbon pools: above-ground biomass, below-ground biomass, soil, and dead organic matter. The algorithm is shown in Equations 8, 9.
where
The carbon density data used in this study were based on the results of previous research (Stocker, 2014; Li et al., 2004) and were further revised according to additional studies (Giardina and Ryan, 2000; Alamet al., 2013). Additionally, temperature and precipitation are significant factors influencing regional carbon density levels (Raich and Nadelhoffer, 1989). This study employed the carbon density correction approach and coefficients used in the research on carbon storage in the Nanming River Basin of Guiyang (Li and Geng, 2023). Building upon this foundation, regional temperature (mean annual temperature of 16°C) and precipitation (mean annual precipitation of 1449.7 mm) were incorporated to supplement the estimation of carbon densities for Shrub and Barren. The resulting carbon density indices for each land class are in close agreement with Nanming River Basin (Li and Geng, 2023) and Guizhou Province (Lin et al., 2022), thus providing reliable support for future calculations of carbon storage instability/uncertainty (Table 2). The relevant data were obtained from the China Meteorological Network (www.cma.gov.cn) and the Water Resources Bulletin. The algorithm is presented in Equations 10–14.
where
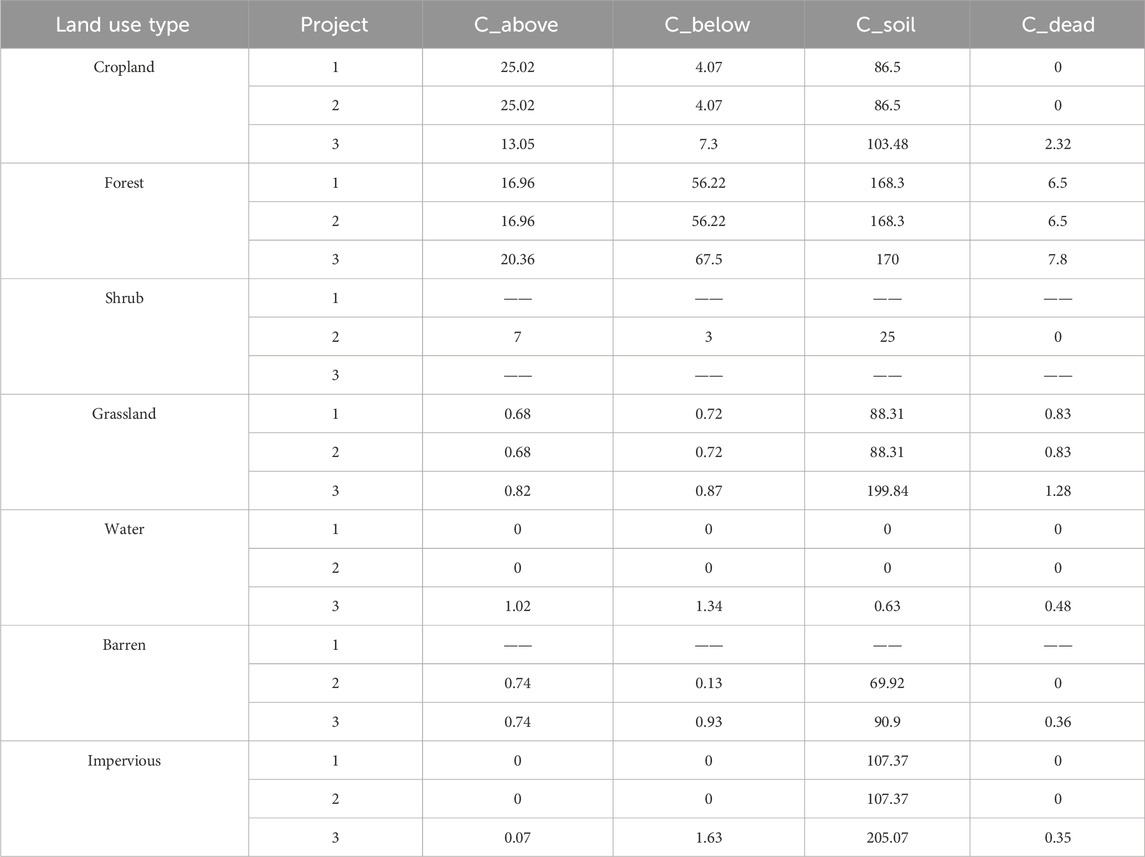
Table 2. Carbon density of each land use type in the study area [unit: Mg/hm2; Project 1: Nanming River valley (Li and Geng, 2023); Project 2: Guiyang city (this research); Project 3: Guizhou Province (Lin et al., 2022)].
The standard deviation of ecosystem service values can indicate system stability (Grêt-Regamey et al., 2013). To eliminate the influence of varying data units, the CV was employed to assess the instability (or uncertainty) of ecosystem carbon storage, calculated as the ratio of the standard deviation to the mean value (Huang et al., 2014). Following existing studies (Yang Y. et al., 2024), instability (or uncertainty) was categorized into four levels: weak (I, 0%–15%), moderate (II, 15%–36%), strong (III, 36%–100%), and very strong (IV, >100%). The algorithm is shown in Equation 15.
where σ and μ are the standard deviation and mean of the value, respectively.
To further investigate the impact of land use changes on the instability and uncertainty of carbon storage, two indicators were introduced (Yang Y. et al., 2024): the average carbon storage instability/uncertainty caused by a specific type of land use change across different periods (ACV), and the total carbon storage instability/uncertainty caused by all types of land use change within the same period (SCV). First, regional statistics on carbon storage fluctuations were derived using superimposed land use data for each period. Then, the mean and standard deviation of carbon storage fluctuations resulting from land use changes were calculated for each period, and the coefficient of variation (CV) for each period under the same type of land use change was determined. Finally, ACV and SCV were calculated. The algorithm is shown in Equations 16, 17.
where
The shorter the distance, the more significant the correlation (Tobler, 1970). Spatial autocorrelation measures the potential similarity and heterogeneity between spatial variables with similar locations. In this study, both Global Moran’s I and Local Moran’s I were employed to assess the clustering patterns of carbon storage instability and uncertainty (Anselin, 1995). The algorithm is shown in Equations 18, 19.
where
The accuracy of landscape pattern indices calculated from raster data (e.g., Fragstats) is often limited. Consequently, this study employed the VecLi model to compute landscape pattern indices using vector data (Yao et al., 2022). Notably, this research introduces an innovative approach by applying the concept of downgrading, which enables landscape-level indices to be adapted for land class-level patches. This was achieved by individually extracting patches with fluctuating carbon storage resulting from land class changes and performing calculations for each type. Ultimately, four landscape pattern indices were selected for analysis, including SHDI, IJI, LSI, and AI (Supplementary Table S1).
Multiscale geographically weighted regression (MGWR) is an advanced variant of geographically weighted regression (GWR) that addresses the limitation of assuming uniform spatial scales for all modeled processes (Oshan et al., 2019). MGWR permits the use of varying bandwidths for each study variable, allowing it to capture the differing scales of influence that variables exert on the dependent variable. This results in enhanced explanatory power and robustness. The algorithm is shown in Equation 20.
where
The Polynomial Regression model can approximate data points by incorporating higher-order terms of x (Kragten, 1990). Through iterative processes, the model’s optimal fit can be identified based on goodness-of-fit metrics, such as the r-square value and mean square error (Motulsky and Ransnas, 1987). The algorithm is shown in Equation 21.
where
This section analyzed the structural evolution and land use conversion characteristics of Guiyang City from 2000 to 2020, based on land use data. The LEAS module in the PLUS model was then employed to identify the development probabilities of various land categories. Subsequently, the DP module was utilized to predict land use demands for three scenarios in 2035, including natural development, planned guidance, and ecological protection. Finally, the CARS module simulates the spatial distribution of land use under these three scenarios, providing the foundational raster layers for the calculation of carbon storage in 2035.
Through the analysis of land use data for Guiyang (Figure 4), the areas of different land use types were ranked as follows: Cropland > Forest > Impervious > Shrub > Grassland > Water > Barren. Cropland, covering 47%–53% of the land area, showed a decreasing trend and was primarily concentrated in the central, southern, and western parts. Forests accounted for 43.24%–46.69% and exhibited an increasing trend, mainly located in the northeastern and Guanshanhu areas. Impervious were concentrated in the central and southern regions, showing a year-by-year increase. Shrub initially increased and then decreased, ranging from 2.91% to 0.74%. Grassland, primarily situated in the northwest and central, accounted for 0.63%–1.53% and showed an upward trend. Water bodies were concentrated in the northwest and remained stable in area. Barren land, the smallest category, accounted for approximately 0.01% of the total area.
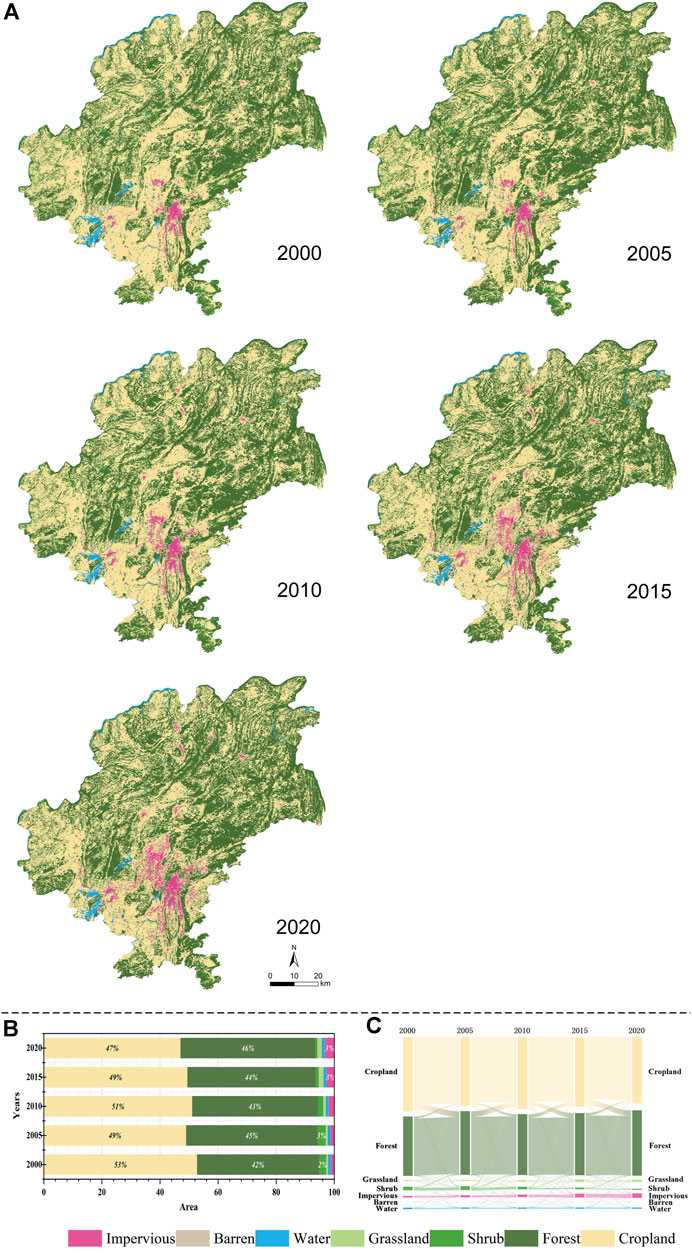
Figure 4. Spatial and temporal evolution of land use from 2000 to 2020. (A) Land use spatial evolution; (B) Land use structure evolution; (C) Land use transfer.
From the perspective of land transfer (Table 3), Cropland, Forest, and Impervious were the three primary land categories undergoing significant changes in Guiyang from 2000 to 2020. Cropland experienced an outflow of 90777.42 ha and an inflow of 44237.43 ha, resulting in a decrease in land area. The primary source of outflow and inflow was Forest, with the least amount transferred to Barren and the most to Forest. Forest showed an inflow of 72889.29 ha and an outflow of 37293.03 ha, indicating an expansion, with Cropland as the main source and destination. Impervious surfaces exhibited an outflow of 46.71 ha and an inflow of 17175.15 ha, showing a trend of expansion, with Cropland contributing the largest inflow.
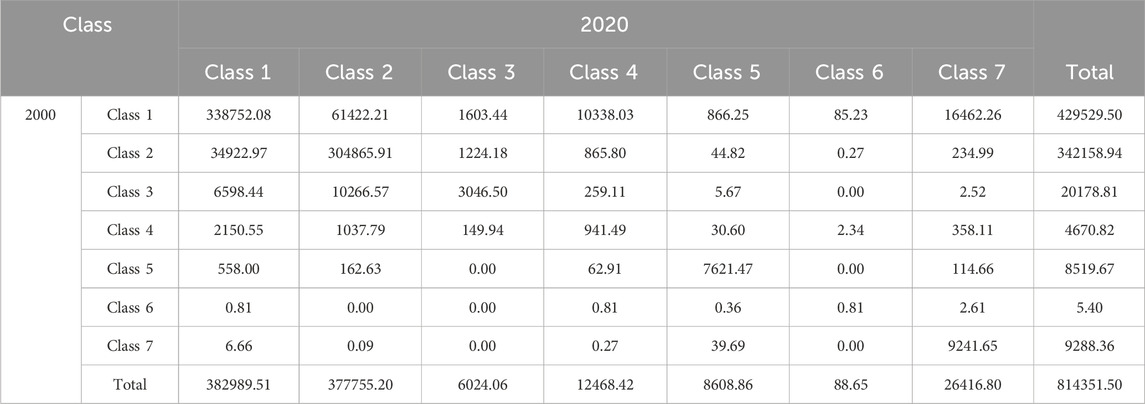
Table 3. Transfer matrix of land use types from 2000 to 2020 (unit: hm2). The Class 1–7: Cropland, Forest, Shrub, Grassland, Water, Barren, Impervious.
From the perspective of flow history (Figure 4C), the transformation between Cropland and Forest persisted throughout the study period. The largest conversion of Cropland to Forest occurred between 2000 and 2005, while the smallest took place between 2005 and 2010. Conversely, the smallest conversion of Forest to Cropland was observed from 2000 to 2005, with the largest occurring between 2005 and 2010. Overall, the total area of Forest converted to Cropland was smaller than that of Cropland to Forest. The area of Shrub consistently decreased, primarily transitioning to Forest. Initially, Grassland occupied a very small area and maintained a low proportion over time. However, due to the annual inflow from Cropland, Barren, and Water, its area gradually expanded. Impervious and Barren followed similar trends to Grassland. The area of Water remained relatively stable with minimal fluctuations.
To ensure the accuracy of the simulation, a validation experiment was conducted prior to the formal simulation. Land use change data from five different time spans were selected, and the PLUS model was employed to simulate the 2020 land use data. Simulation accuracy was then assessed, and the optimal time span and parameters were determined. Ultimately, the period from 2010 to 2015 proved to be the most effective, outperforming the other four time intervals, with a Kappa coefficient of 0.870742, an overall accuracy of 0.91853, and a FoM coefficient of 0.208221, exceeding the simulation accuracy reported in relevant studies (Table 4). Therefore, the period from 2010 to 2015 was selected as the reference period for land category development probabilities. Based on the 2020 land use data, the spatial pattern of land use for 2035 was then simulated.
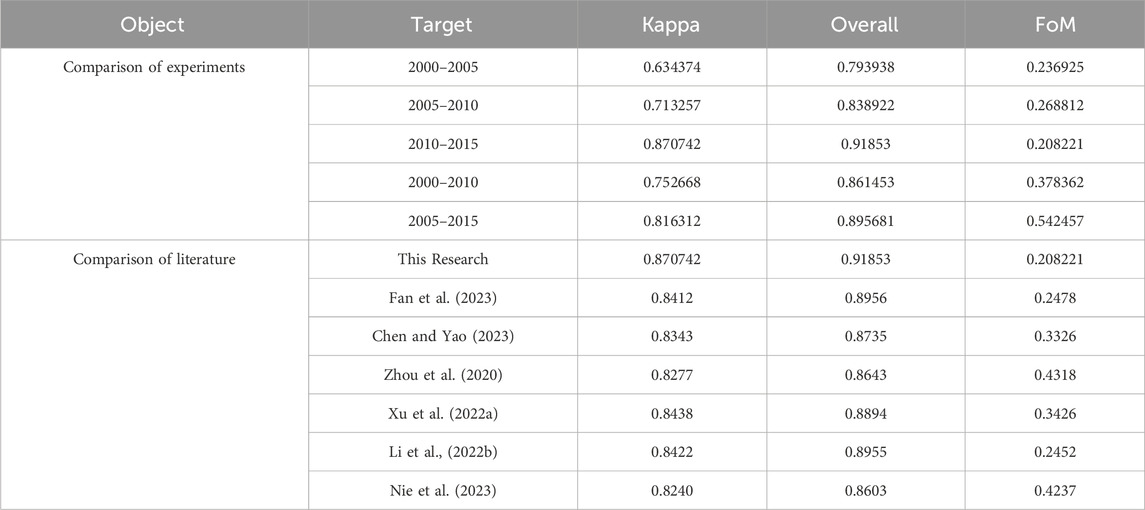
Table 4. Comparison of prediction accuracy.
Land use change is influenced by numerous factors and presents various possible trajectories. Therefore, building on previous studies (Gao L. et al., 2022; Liang et al., 2021), future land use changes in Guiyang were modeled under three scenarios: natural development, urban expansion, and ecological protection. In the natural development scenario, land use changes from 2020 to 2035 were assumed to follow the patterns observed in previous years. In the urban expansion scenario, the Gui’an New Area and other urban regions were designated as development zones according to the “Guiyang Territorial Space Master Plan (2021–2035).” In the ecological protection scenario, Forest, Grassland, and Water were strictly protected. Using the DP module within the PLUS model, this multi-scenario simulation first projected land use demand under various scenarios (Supplementary Table S2). Next, development probabilities for each land type were determined based on LEAS. Finally, land use spatial distribution in the three scenarios was simulated using CARS.
From the spatial pattern perspective (Figure 5), the land use structure in 2035 will remain stable across the three scenarios, dominated by Cropland, Impervious, and Forest, while Water will maintain a relatively consistent spatial distribution. In the natural development scenario, Impervious will expand further, particularly in Baiyun District, Guanshanhu District, and southern Huaxi. This expansion will compress Cropland and Grassland. Forest will expand in the eastern and northern parts of the city, and Shrub will transition from a scattered to an aggregated form. In the urban expansion scenario, urbanization will be more pronounced, especially in central and southwestern urban areas, leading to further compression of other land types. Grassland and Cropland will be particularly affected in Nanming District, Huaxi District, Qingzhen City, and Guanshanhu District, while Barren will be impacted in the central area. Shrub and Forest will be less affected by urbanization. In the ecological protection scenario, while Impervious will expand from 2020 levels, their growth will be controlled. Notably, the expansion in Baiyun District and Guanshanhu District, which will be most significant in the natural scenario, will show a decrease. Forest will continue to expand in the east and north, while the declines in Cropland and Grassland will also be mitigated. Shrub will transition from scattered to aggregated. Barren will see slight expansion in the central and southern parts of the city compared to the natural development scenario.
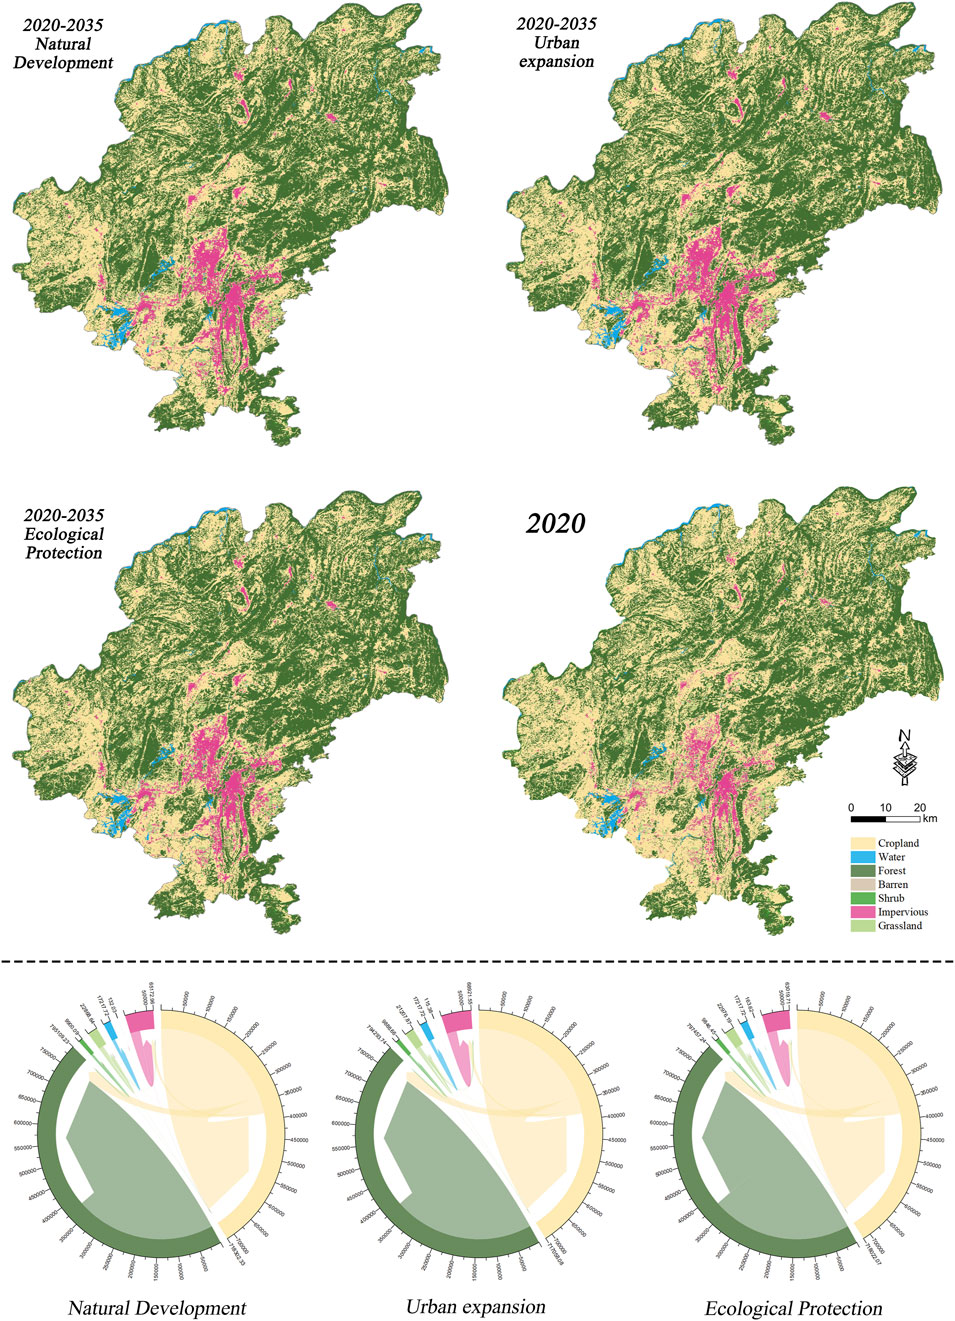
Figure 5. Multi-scenario land use simulations in 2035 and land use transfer from 2020 to 2035.
Regarding land flows, the natural development scenario will primarily involve changes in Cropland, Forest, and Impervious, with minor changes in Shrub and Grassland, and minimal alterations in Water and Barren. Cropland will predominantly flow into Forest and Impervious, while Forest and Impervious will experience inflows from Cropland. Although Shrub and Grassland will be minor in extent, they will have more outflows than inflows. Water will remain stable, and Barren will experience some outflows with negligible overall change. Compared to the natural development scenario, the urban expansion scenario will exhibit similar flow patterns, but with increased outflows and decreased inflows for Cropland, increased inflows for Forest, and no outflows but increased inflows for Impervious, primarily from Cropland. Shrub and Grassland will continue to see more outflows than inflows, though both inflows and outflows will be higher. Water will remain stable, while Barren will experience only outflows with no inflows. Under the ecological protection scenario, Cropland outflows will slightly increase, while inflows will decrease. Forest will see a significant rise in inflows. Impervious will experience a reduction in both inflows and outflows, but overall inflows will remain higher than outflows. Shrub and Grassland will continue to have more outflows than inflows, but the total volume of flows will decrease. Barren will experience both inflows and outflows.
In summary, the natural development scenario will perpetuate the current trend of rapid urbanization, characterized by accelerated growth of construction land and the encroachment on agricultural and some ecological lands. In the urban expansion scenario, urban growth will be concentrated in specific areas, leading to more pronounced encroachment on Grassland and Cropland, particularly in the city’s central regions. Conversely, under the ecological protection scenario, the expansion of impervious surfaces will be significantly curtailed, effectively safeguarding ecological lands such as Forest, Shrub, and Grassland, thereby mitigating the large-scale encroachment of construction land into these areas.
This section utilized the existing land use raster data from 2000 to 2020, as well as the multi-scenario land use raster data for 2035 simulated in the previous section. The InVEST model’s carbon module was employed to estimate carbon storage within various land categories by considering the carbon densities of four components: aboveground biomass, underground biomass, soil, and dead organic matter. This approach enabled the analysis of the spatiotemporal changes in carbon storage between the periods of 2000–2020 and 2020–2035.
Based on spatial distribution (Figure 6), the areas with high carbon storage were primarily located in the northeastern, western, and southern mountainous regions. Conversely, low carbon storage areas were concentrated in the south-central part of the city, with a noticeable expansion trend, particularly in Baiyun District, Guanshanhu District, Yunyan District, Nanming District, and Huaxi District. Additionally, both the central urban areas and the lower urban areas experienced a significant decline in carbon storage.

Figure 6. Spatial evolution of carbon storage from 2000 to 2020.
Over the past 20 years, Guiyang’s carbon storage increased by 5.51 Tg (Figure 7A). From 2000 to 2005, carbon storage increased by 3.13 Tg, with the growth concentrated in the central part of the city, while decreases were observed in Xiuwen County, Qingzhen City, Guanshanhu District, and Baiyun District. Between 2005 and 2010, carbon storage decreased by 1.52 Tg, primarily in the northeastern and central parts of the city. From 2010 to 2015, carbon storage increased by 1.12 Tg, with gains in Xifeng County and Kaiyang County, and losses in the central urban area and Xiuwen County. Finally, from 2015 to 2020, carbon storage further increased by 2.77 Tg, with declines in Xifeng County, Huaxi District, and Nanming District, and increases in Xiuwen County and the central area of the city.
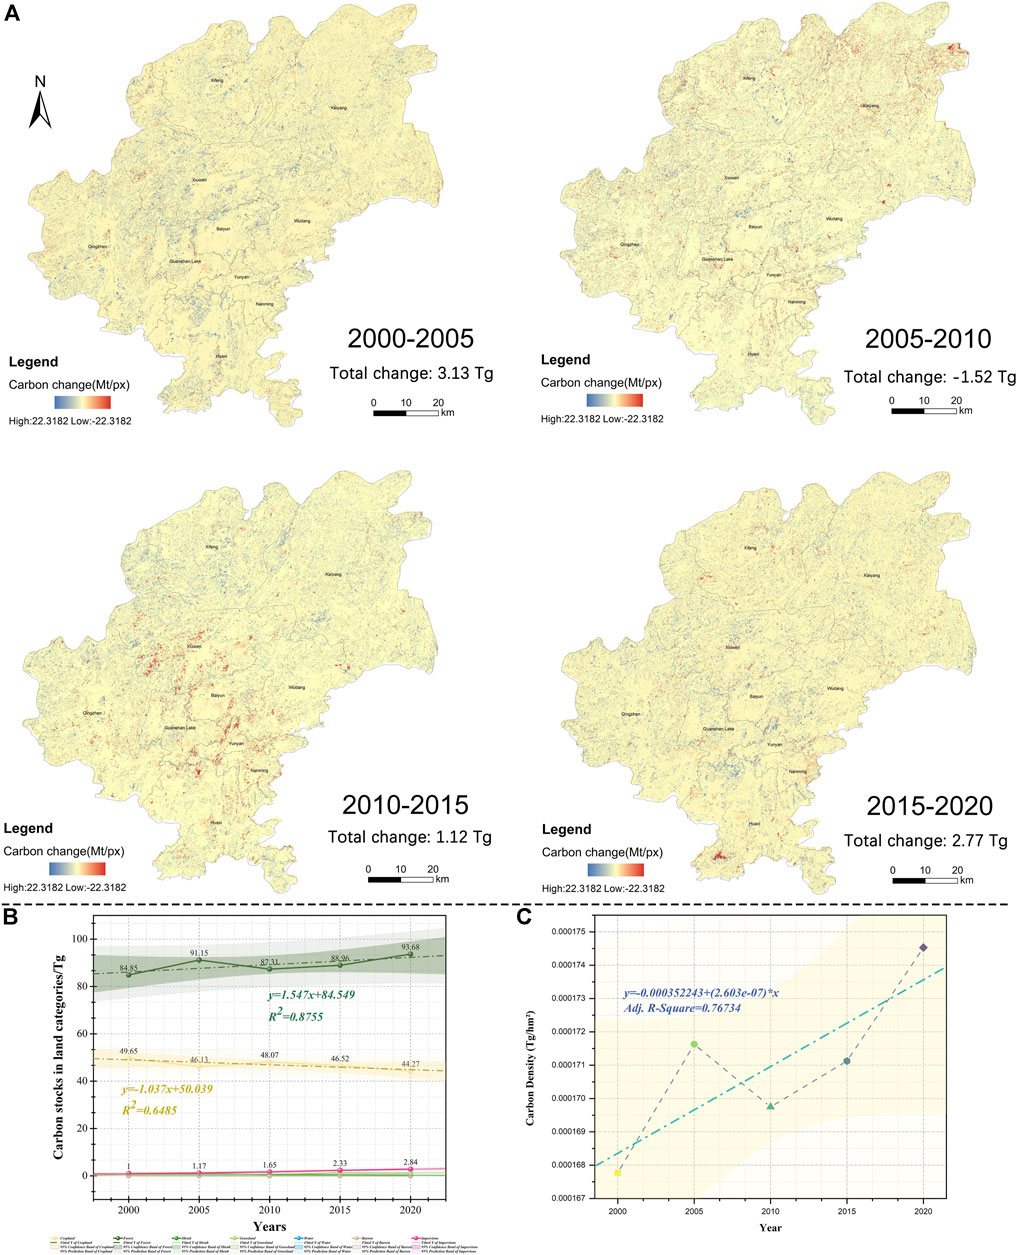
Figure 7. Carbon storage changes from 2000 to 2020. (A) Spatial distribution of carbon storage changes; (B) Changes in carbon storage of various land; (C) Changes of carbon density.
From the perspective of land contributions (Table 5), carbon storage was predominantly concentrated in Forest (approximately 63%) and Cropland (around 36.34%), with minimal contributions from other land types. Additionally, the carbon storage per unit area from 2000 to 2020 was 0.0001678 Tg/hm2, 0.0001716 Tg/hm2, 0.0001697 Tg/hm2, 0.0001711 Tg/hm2, and 0.0001745 Tg/hm2, respectively. Both total carbon storage and carbon density exhibited a trend of initially increasing, followed by a decrease, and then a subsequent increase (Figures 7B, C).
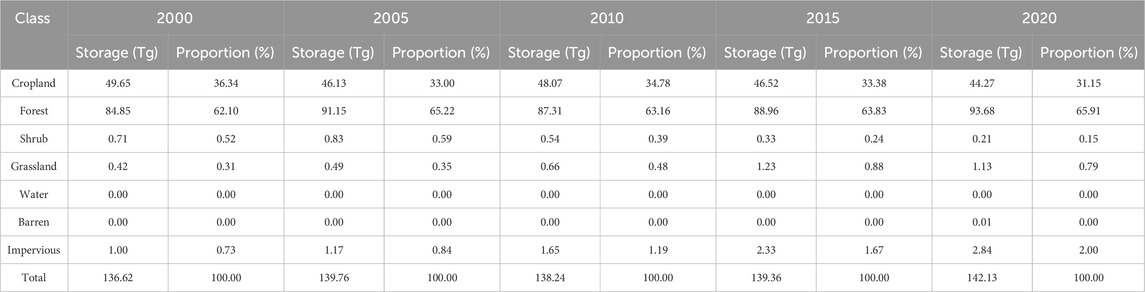
Table 5. Carbon storage in different land types from 2000 to 2020.
Regarding spatial distribution (Figure 8A), Guiyang’s future land use will continue to exhibit a pattern of “high carbon storage in the northeast and low in the central and southern regions.” High carbon reserves will be predominantly found in the northeastern, western, and southern mountainous areas, while low carbon reserves will be concentrated mainly in the Baiyun, Guanshanhu, Yunyan, Nanming, and Huaxi districts.

Figure 8. Carbon storage in 2035 under different scenarios. (A) Spatial distribution of carbon storage; (B) Carbon storage changes from 2020 to 2035.
In 2035, the total carbon storage under the three scenarios—natural development, urban expansion, and ecological protection will be 147.50 Tg, 147.40 Tg, and 147.82 Tg, respectively. Carbon storage will increase by 5.37 Tg, 5.27 Tg, and 5.70 Tg, respectively (Table 6). Most regions with increasing carbon storage across all scenarios will be located in the northern parts of Guiyang City, including Kaiyang County, Xifeng County, and Xiuwen County, as well as the central Wudang District. Smaller increases will be observed in the southern part of Huaxi District and the northeastern part of Qingzhen City. Areas with decreasing carbon storage will be concentrated in the central city, particularly in Nanming District, Yunyan District, Guanshanhu District, and Baiyun District. Compared to the natural development scenario, the urban expansion scenario will show a more pronounced reduction in carbon storage across various parts of the city, while the ecological protection scenario will exhibit a smaller and more moderate reduction (Figure 8C). The primary land types contributing to carbon storage will remain Forest (about 70%) and Cropland (about 26%). The carbon storage per unit land area under the three scenarios will be 0.0001811 Tg/hm2, 0.0001810 Tg/hm2, and 0.0001815 Tg/hm2, respectively.

Table 6. Carbon storage by category under different scenarios in 2035 and carbon storage changes.
Across all three scenarios, carbon storage in Guiyang will show an upward trend. The pattern of carbon storage changes across different land categories will remain consistent among the scenarios, with only Forest and Impervious increasing in carbon storage, while all other land categories will exhibit a decrease. Compared to the natural development scenario, the total increase in carbon storage under the urban expansion scenario will be reduced by 0.09 Tg, with the exception of Impervious, where carbon storage will be lower in all other land categories. The ecological protection scenario will demonstrate the highest overall increase in carbon storage, totaling 5.70 Tg. In this scenario, all land categories, except Shrub, will experience greater increases in carbon storage compared to the other two scenarios, with less reduction in carbon storage.
Building upon the carbon storage distribution data outlined above, this section employed CV to assess the instability (uncertainty) of carbon storage in Guiyang City. It identified four categories of instability (uncertainty) regions and subsequently analyzed their structural changes, spatiotemporal evolution characteristics, and spatial autocorrelation.
According to Equation 17, the SCV (Figure 9A) was calculated for each period. Overall, carbon storage instability exhibited a general upward trend from 2000 to 2020, characterized by an initial decrease, followed by an increase, and then another decrease. Carbon storage instability was highest during the 2010–2015 period and lowest during the 2005–2010 period.
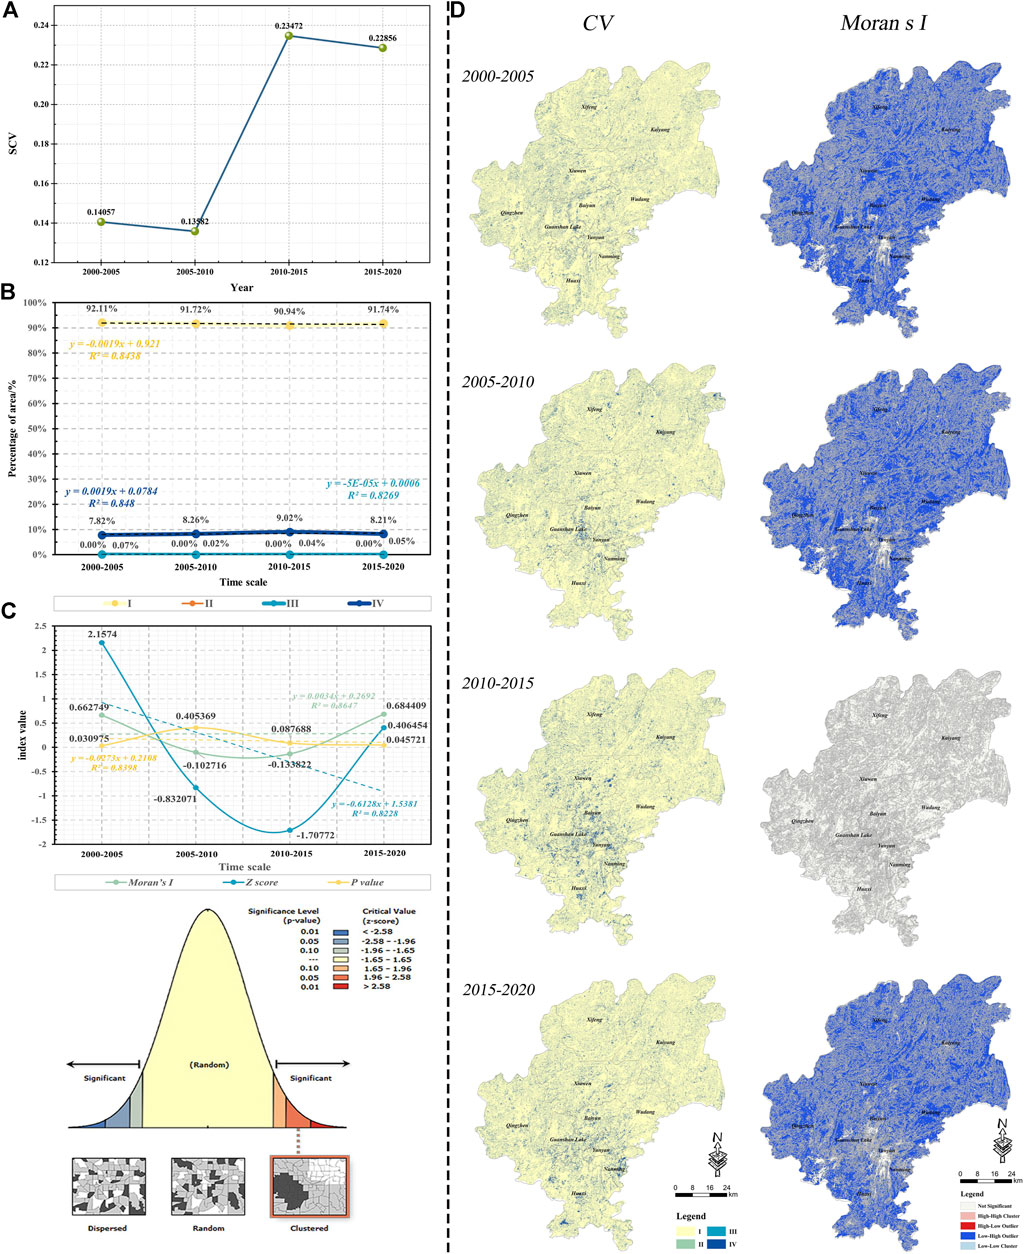
Figure 9. Characteristics of carbon storage instability. (A) Characteristics of SCV; (B) Characteristics of structure; (C) Global spatial autocorrelation results; (D) Spatial distribution and local spatial autocorrelation characteristics.
Regarding the compositional structure of instability (Figure 9B), the period from 2000 to 2020 exhibited the highest proportion of Type I areas, ranging from 90.94% to 92.11%. This data indicated a generally stable trend with a gradual downward slope. The proportions of Type II and Type III areas were relatively low, ranging from 0% to 0.07%, and showed minimal fluctuation. The proportion of Type IV areas ranged from 7.82% to 9.02%, reflecting an overall increasing trend. Carbon storage instability was greatest during the 2010–2015 period and lowest during the 2005–2010 period.
From the global autocorrelation analysis perspective (Figure 9C), the instability of carbon storage exhibited positive spatial autocorrelation with clustered distribution patterns during 2000–2005. However, during the intervals of 2015–2020, the Z value was below 1.65, suggesting an absence of significant spatial autocorrelation in carbon storage instability. Additionally, during the periods of 2005–2010 and 2010–2015, P values exceeded 0.05, further indicating the lack of spatial autocorrelation in carbon storage instability.
Based on the spatial pattern (Figure 9D), high instability was consistently observed in the south-central part of the city across all four time periods, while relatively low instability was noted in the northeastern and western regions. During 2000–2005, the global spatial characteristics of instability exhibited clustering, with local spatial patterns displaying Low-High Outliers, where high instability areas were predominantly located in the northwestern part of the city. The 2005–2010 period showed random global spatial distribution, with local patterns also indicating Low-High Outliers, but high instability areas were more concentrated in the central part of the city. The 2010–2015 period continued to display random global spatial distribution, with local patterns showing Low-High Outliers and high instability areas remaining concentrated in the central part. In the 2015–2020 period, the global spatial characteristics exhibited random distribution, local spatial features displayed Low-High Outliers, and highly unstable areas spread towards the southwest of Guanshanhu and the southeast of Nanming.
Through an overlay analysis of high carbon storage areas and regions with high carbon storage instability (Figure 10), it was found that only 10% of the areas overlap, indicating a considerable inconsistency between the two. The instability in carbon storage is primarily attributable to land use changes, suggesting that the majority of high carbon storage areas have not undergone land category transformations. The few overlapping pixels mainly correspond to areas where low-carbon storage land categories have been converted to those with higher carbon storage potential. These transitions are closely associated with policies related to reforestation and the management of stony desertification.
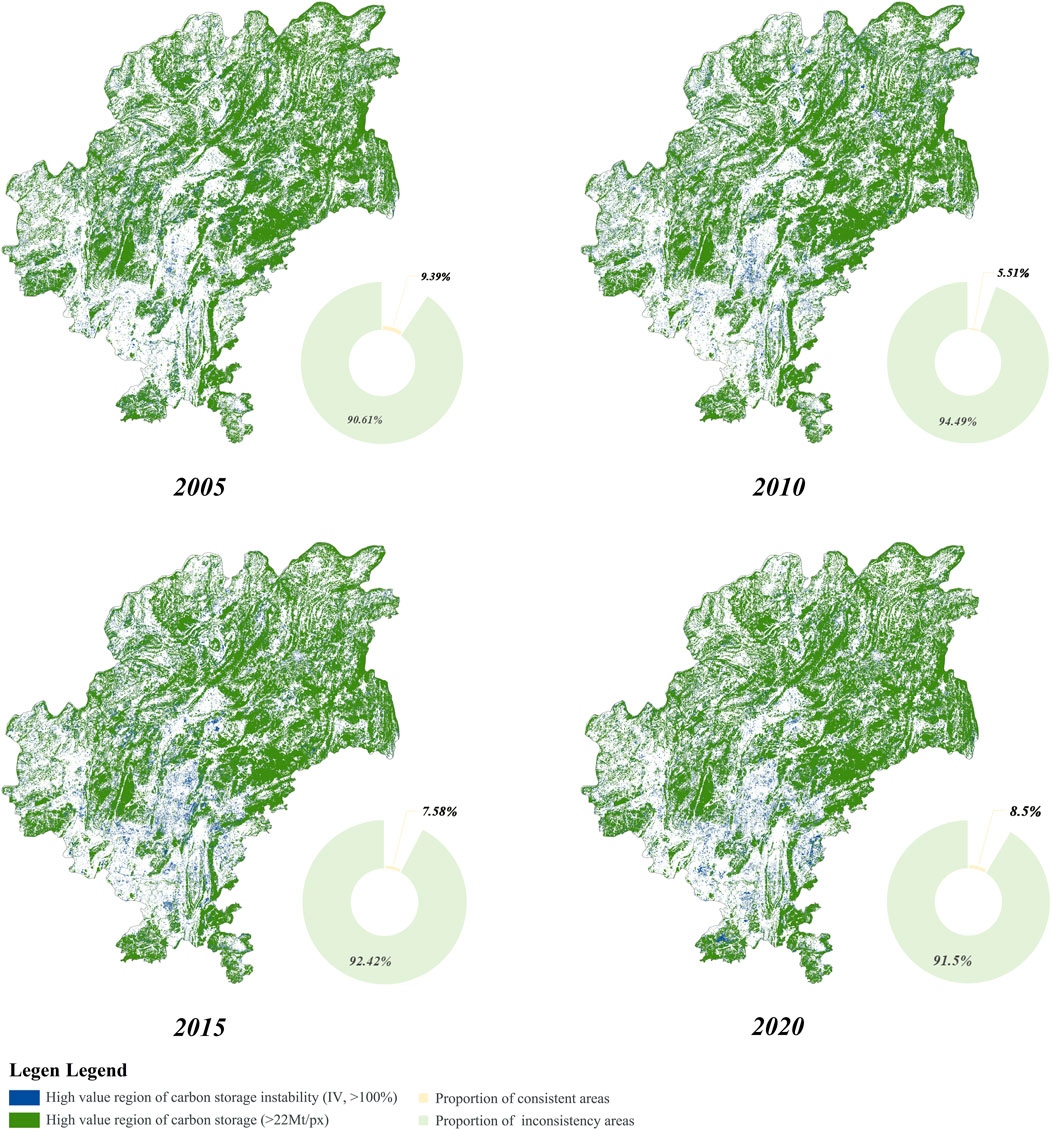
Figure 10. Superposition analysis of regions with high carbon storage and high instability.
Overall (Figures 11A, B), the carbon storage uncertainty in Guiyang City will significantly decrease compared to previous levels. The urban expansion scenario will have the highest carbon storage uncertainty, whereas the ecological protection scenario will exhibit the lowest. In the natural development scenario, Type IV uncertainty will account for 6.69%, Type II and III uncertainties for 0.06%, and Type I uncertainty for 93.25%. Under the urban expansion scenario, Type IV uncertainty will rise to 7.02%, with Type I at 92.98%, and Types II and III will be nearly negligible. In contrast, the ecological protection scenario will show a reduced Type IV uncertainty of 6.66%, with Type I reaching its highest proportion across the scenarios at 93.27%, while Types II and III will remain at 0.06%.
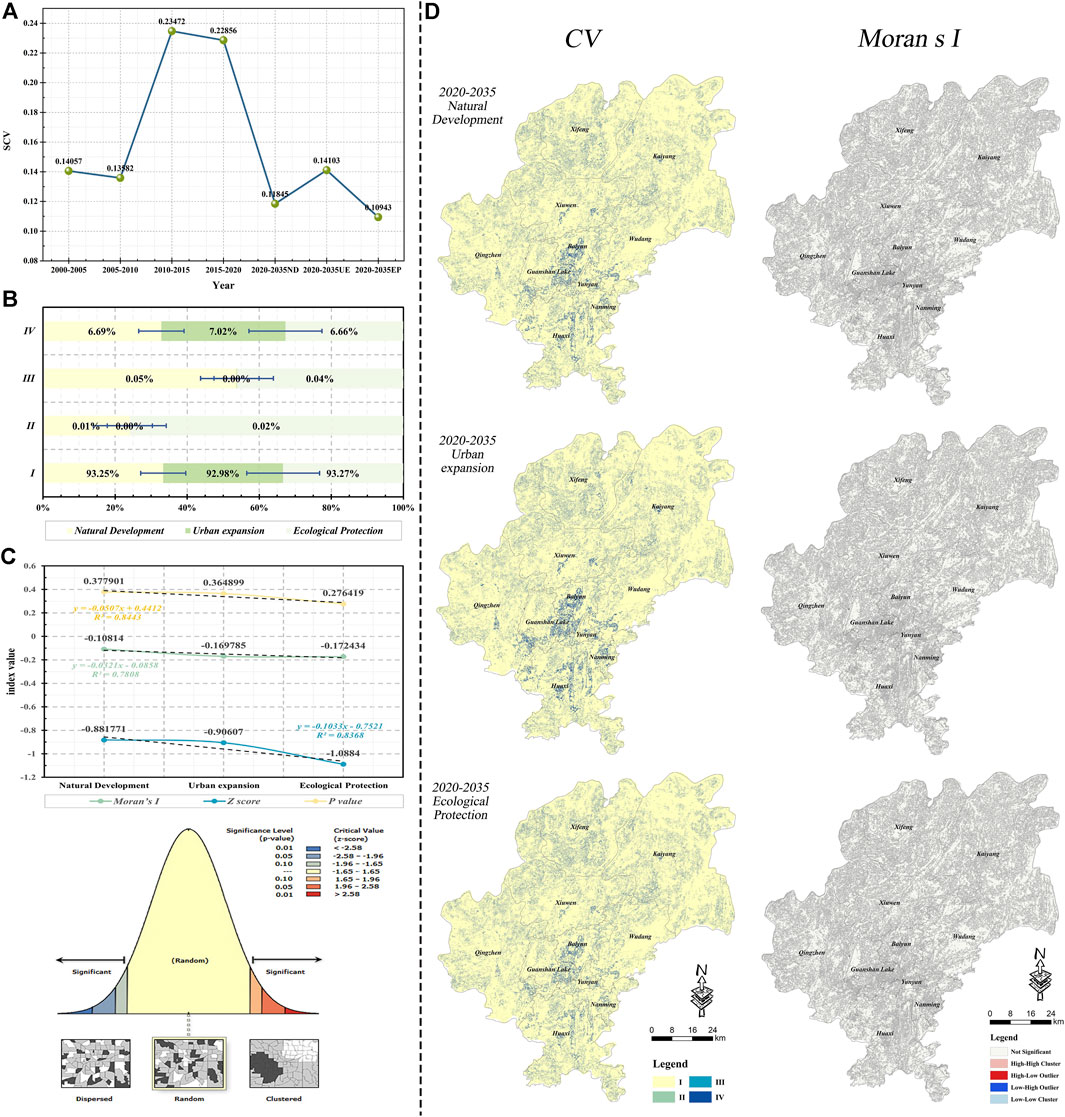
Figure 11. Characteristics of carbon storage uncertainty under multiple scenarios. (A) Characteristics of SCV; (B) Characteristics of structure; (C) Global spatial autocorrelation results; (D) Spatial distribution and local spatial autocorrelation characteristics.
As for spatial patterns (Figures 11C, D), although the global spatial autocorrelation parameters will vary across the three scenarios, all scenarios will exhibit random global autocorrelation with no significant local autocorrelation characteristics. Regarding the spatial distribution of carbon storage uncertainty, areas of high uncertainty will be primarily concentrated at the junction of Baiyun and Guanshanhu districts, along the connecting axes between Huaxi, Yunyan, and Nanming districts, and in specific localized areas within Qingzhen, Xifeng, and Kaiyang.
Based on the above data on the spatial distribution of carbon storage instability (uncertainty), this section analyzed its influence mechanism. First, stepwise regression, variance inflation factor (VIF) analysis, and P-value testing were employed to exclude collinear influencing factors. Next, MGWR model was utilized to examine the magnitude and trends of each influencing factor’s impact on carbon storage instability. Finally, PR model was applied to construct a regression fit between the CV and the regional values of the influencing factors, identifying the “stable” and “unstable” intervals of factors.
In the era of big data, technological advancements have facilitated data collection across various fields, increasing the likelihood of multicollinearity among variables (Chan et al., 2022). The correlation between independent variables can significantly impact the effectiveness of regression models (Pal et al., 2019). Therefore, it is crucial to perform multicollinearity tests before executing a regression model. However, existing studies typically rely on a single test or method for assessing collinearity (Yang Y. et al., 2024; Wang L. et al., 2022). In this study, we employed a combination of stepwise regression (Supplementary Table S3), variance inflation factor (VIF) analysis (Supplementary Table S4), and P-value testing (Supplementary Table S5). A preliminary assessment was conducted to evaluate both collinearity and statistical significance, ultimately retaining nine influential factors to optimize the MGWR model, including SHDI, AI, IJI, DEM, Mean annual Precipitation, Slope, Distance from the national highway, Distance from township, and Population density.
According to the MGWR analysis, the global regression coefficient (Figure 12) and the average regression coefficient (Table 7) indicated that DEM had the most significant effect on carbon storage instability, followed by AI, Distance from the national highway, SHDI, Mean annual Precipitation, IJI, Population density, Slope, and Distance from township. Among these, only DEM and Distance from the national highway negatively impacted carbon storage instability.
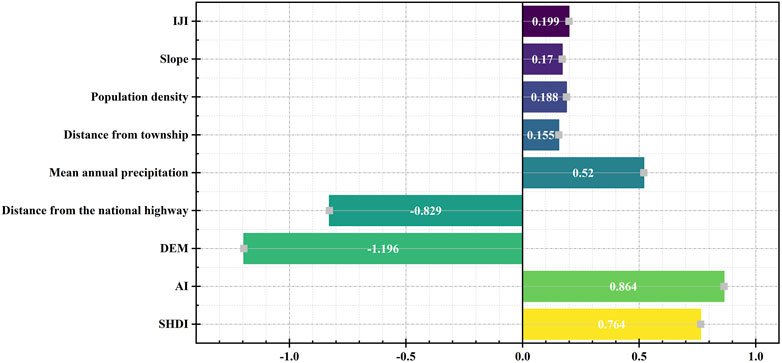
Figure 12. Global regression coefficient.
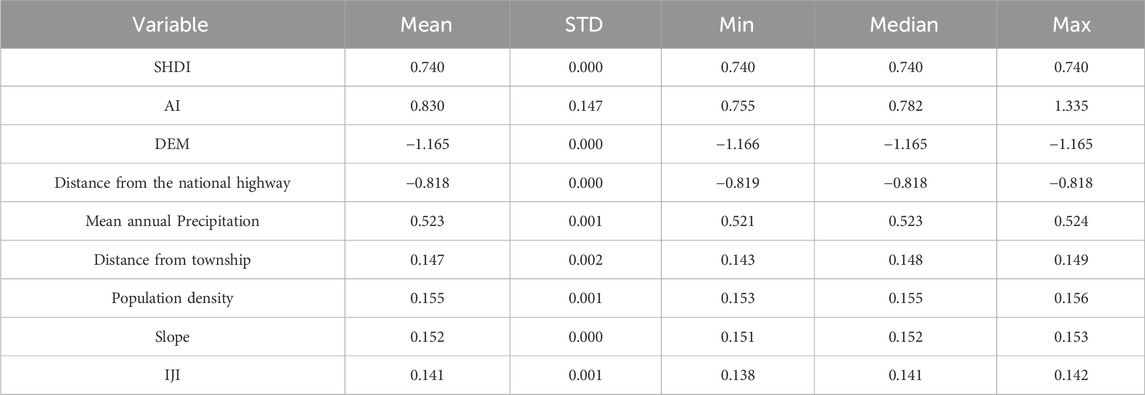
Table 7. Summary statistics for MGWR parameter estimates.
As illustrated in Figure 13, SHDI positively influenced carbon storage instability, with its influence coefficient showing an increasing trend. Greater patch diversity and fragmentation corresponded to higher instability. AI also had a positive impact on carbon storage instability, with its influence coefficient first increasing, peaking around AI = 70, and then decreasing. IJI similarly affected carbon storage instability positively, with its influence coefficient demonstrating a pattern of decreasing, then increasing, followed by another decrease and increase.

Figure 13. Influence of each factor on carbon storage instability.
DEM had a negative impact on carbon storage instability. The influence coefficient initially increased, peaked near 1250 m, and then decreased. Slope positively affected carbon storage instability, with the influence coefficient displaying a pattern of decreasing, then increasing, followed by another decrease. Mean annual precipitation also positively influenced carbon storage instability, with its influence coefficient showing an increasing-decreasing-increasing trend.
Population density positively influenced carbon storage instability, with the influence coefficient exhibiting a pattern of increasing, then decreasing, and increasing again. Within the range of 2,300 to 13,000 people per square kilometer, higher population density was associated with greater impacts on carbon storage instability.
Distance from township road positively influenced carbon storage instability, with the influence coefficient displaying a pattern of decreasing, then increasing, and decreasing again. When the distance from township road ranged from 2,000 to 7,000 m, greater distances corresponded to a lower impact on carbon storage instability. In the range of 7,000 to 14,600 m, the impact increased with distance from the township road. Beyond 14,600 m, the influence on carbon storage instability decreased sharply with increasing distance from the township road. Conversely, the Distance from the national highway negatively influenced carbon storage instability, with the influence coefficient initially increasing and then decreasing. Specifically, within the range of 0–30,000 m, greater distances from the national highway were associated with a higher impact on carbon storage instability. However, for distances between 30,000 and 50,000 m, the influence on carbon storage instability diminished as the distance from the national highway increased.
The PR model was employed to construct regression fits of CV with nine impact factors (Arlinghaus, 2023; Caceci and Cacheris, 1984). This analysis aimed to identify “stable intervals” (CV ≤ 0.36, covering CV I and CV II) and “unstable intervals” (CV > 0.36, covering CV III and CV IV) for the influence factors.
Figure 14 illustrated that carbon storage instability due to land use change exceeded 0.36 when the SHDI values were within the intervals (0.706, 1.875) and (2.365, 10.893). Conversely, when SHDI fell within the intervals (0.054, 0.706) and (1.875, 2.365), carbon storage instability was below 0.36, indicating a stable interval for carbon storage. Similarly, the stable intervals for other factors were identified as follows: AI ∈ (0, 14.127), IJI ∈ (15.137, 29.124), DEM ∈ (832.214, 982.718) ∪ (1277.432, 1331.047), Slope ∈ (832.214, 982.718) ∪ (1277.432, 1331.047), Mean annual precipitation ∈ (1377.789, 1392.014), Population density ∈ (0, 198.674) ∪ (2886.419, 3245.853), Distance from township ∈ (3472.358, 3925.024) ∪ (15136.454, 16520.382), and Distance from the national highway ∈ (231.046, 3442.611) ∪ (35248.669, 42346.013).
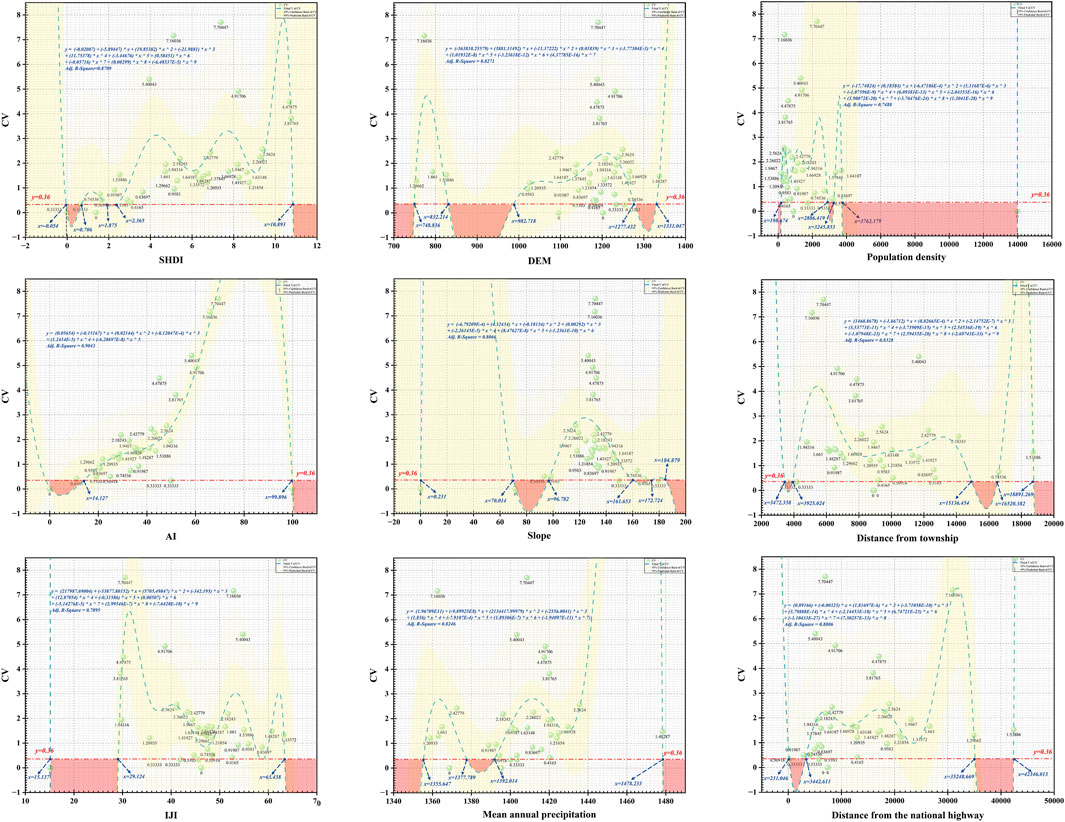
Figure 14. Relationship between each factor and CV.
Thus, a distinct relationship exists between each influencing factor and carbon storage instability/uncertainty (Supplementary Table S6). During the unstable intervals for each influencing factor, land use changes lead to high carbon storage instability, indicating that such changes are unsuitable. Conversely, within the “stable intervals,” land use changes do not cause significant fluctuations in carbon storage stability, suggesting that modifications in land use can be conducted reasonably in these areas. However, it is important to note that the “stable intervals” depicted in the figure represent theoretical results due to the sample size limitations (Peng and Deng, 2021).
Over the past 20 years, Guiyang’s total carbon storage has increased by 5.51 Tg. Analyzing the carbon storage structure (Table 5), Forest and Cropland have been the primary carbon storage sectors in Guiyang, accounting for approximately 64% and 33% of annual carbon reserves, respectively. The remaining five land types contributed only a small fraction of carbon reserves (Li et al., 2024). As shown in Figure 15, land use changes from 2000 to 2020 that contributed to increased carbon storage included transitions of Cropland-Forest, Shrub-Forest, and Shrub-Cropland. Conversely, transitions of Forest-Cropland and Forest-Shrub led to a decrease in carbon storage. Thus, the expansion of Forest has been the primary driver of increased carbon storage in Guiyang. Despite recent intensification of urbanization and desertification in Guiyang, Forest area has exhibited an “increase rather than decrease” phenomenon. This can be attributed to two main factors. First, the topography of Guiyang, a typical karst region in China, features gentle valleys due to the constraints of mountains and water bodies, which has contributed to the preservation of Forest (Peng and Deng, 2021). Second, recent policy initiatives, including the “Five Forests” program, “Returning Farmland to Forest,” and the promotion of “Ecological City,” have led to the creation of more new forests within the urban area.
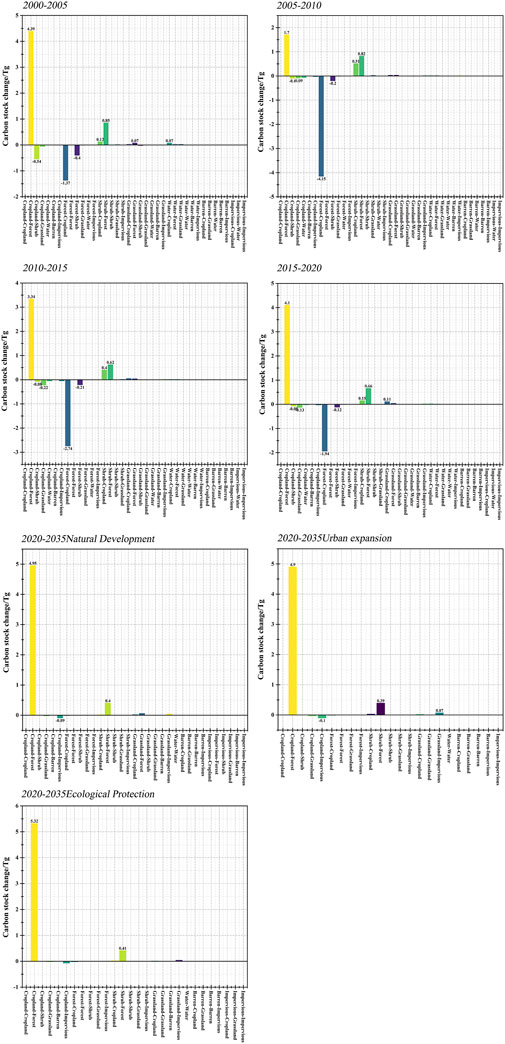
Figure 15. Impacts of land class conversions on carbon storage from 2000 to 2035.
By 2035, simulation results from the three scenarios indicate that Guiyang’s total carbon storage will continue to increase. The land use changes contributing to this increase include the transitions of Cropland-Forest and Shrub-Forest, while Cropland-Impervious are associated with a decrease in carbon storage. The primary source of Forest expansion will be the conversion of Cropland. This Forest-Cropland conversion is largely a result of policies balancing farmland requisition with compensation. Conversely, the Cropland-Impervious transformation is mainly driven by urbanization. Forest plays a crucial role in achieving “carbon neutrality” (Yao et al., 2023), while Cropland is essential for ensuring food security, and Impervious contribute significantly to economic development (Zhou et al., 2024). To achieve carbon neutrality, it is imperative to not only sustain Forest growth but also manage the conversion between Forest-Cropland and Cropland-Impervious. Such management will impact food security and economic development. Thus, it is crucial to integrate regional environmental conditions and socio-economic functions, plan land use strategically, implement policies that promote high-quality development, and balance carbon neutrality with food security and economic growth (Li et al., 2023).
Land use changes are closely related to the instability of carbon storage (Yang Y. et al., 2024). From a spatial distribution perspective (Figure 16), changes in Cropland, Forest, and Impervious were significantly associated with carbon storage instability and uncertainty type IV. Analyzing land use changes under each instability type (Figure 15) revealed that from 2000 to 2020, Type I, which exhibited the lowest instability, was predominantly composed of seven stable land classes. In contrast, Type IV, characterized by higher instability, showed significant proportions of Cropland-Forest and Forest-Cropland transitions, which persisted across all four periods. By 2035, Type I will continue to comprise the seven stable land classes, while Type IV will experience the highest turnover between Cropland and Forest. Notably, in all three future scenarios, Cropland-Forest and Cropland-Impervious transitions will gain prominence in Type IV, with Forest-Cropland no longer being the predominant transition. Additionally, the proportion of Cropland-Forest transitions will vary among the three scenarios, being highest under the ecological protection scenario and lowest under the urban expansion scenario.
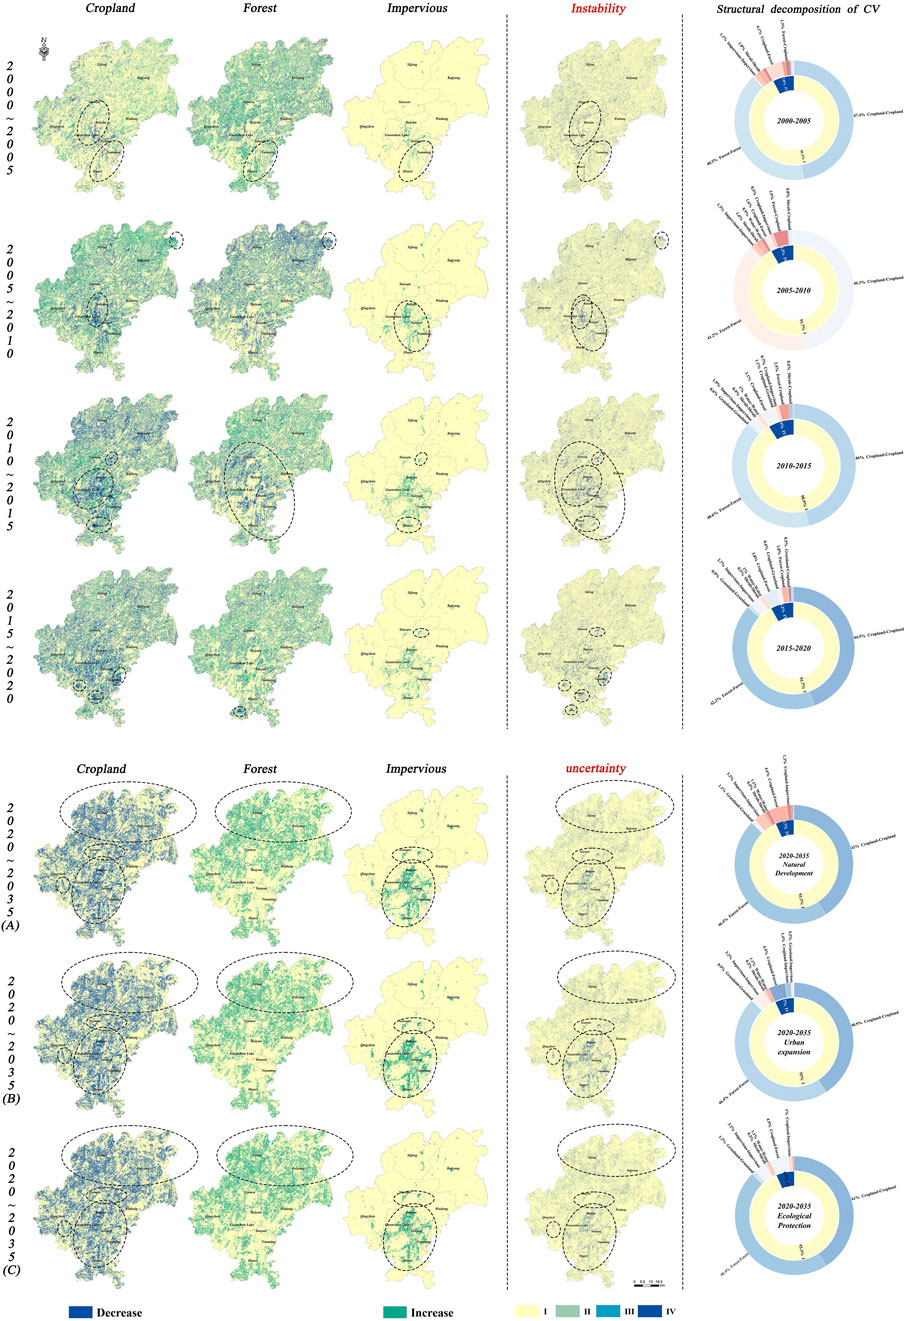
Figure 16. Response of carbon storage instability and uncertainty to land use change. (A) Natural Development; (B) Urban expansion; (C) Ecological Protection.
To further explore the relationship between land use change and the instability/uncertainty of carbon storage, Equation 16 was used to calculate the average carbon storage instability/uncertainty (ACV) for different types of land use change, based on the characteristics of carbon storage change. The high-risk land use conversion types were then identified and analyzed (Tables 8, 9). Over the past 20 years, carbon storage in Guiyang has generally remained stable, although local instability has been evident. Notably, the conversion between Forest and Cropland has significantly increased carbon storage instability. The instability was primarily driven by Cropland-Forest, Forest-Cropland, Cropland-Grassland, and Cropland-Impervious changes. Forest-Cropland conversion resulted in the most substantial reduction in carbon storage and the greatest instability. Although Cropland-Forest conversion increased carbon storage, its proportion in Type IV was the highest, and the instability caused by Cropland-Forest was comparable to that caused by Forest-Cropland. Cropland-Grassland conversion reduced carbon storage, leading to an instability of 29.26%. Cropland-Impervious conversion also decreased carbon storage, resulting in an instability of 14.07%. Additionally, instability was observed in Shrub-Forest, Shrub-Cropland, Grassland-Cropland, and Cropland-Shrub conversions, although these factors contributed to a relatively minor extent. Consequently, Forest-Cropland, Cropland-Grassland, and Cropland-Impervious conversions have been identified as significant contributors to carbon storage reduction and high instability, warranting attention in land management strategies.
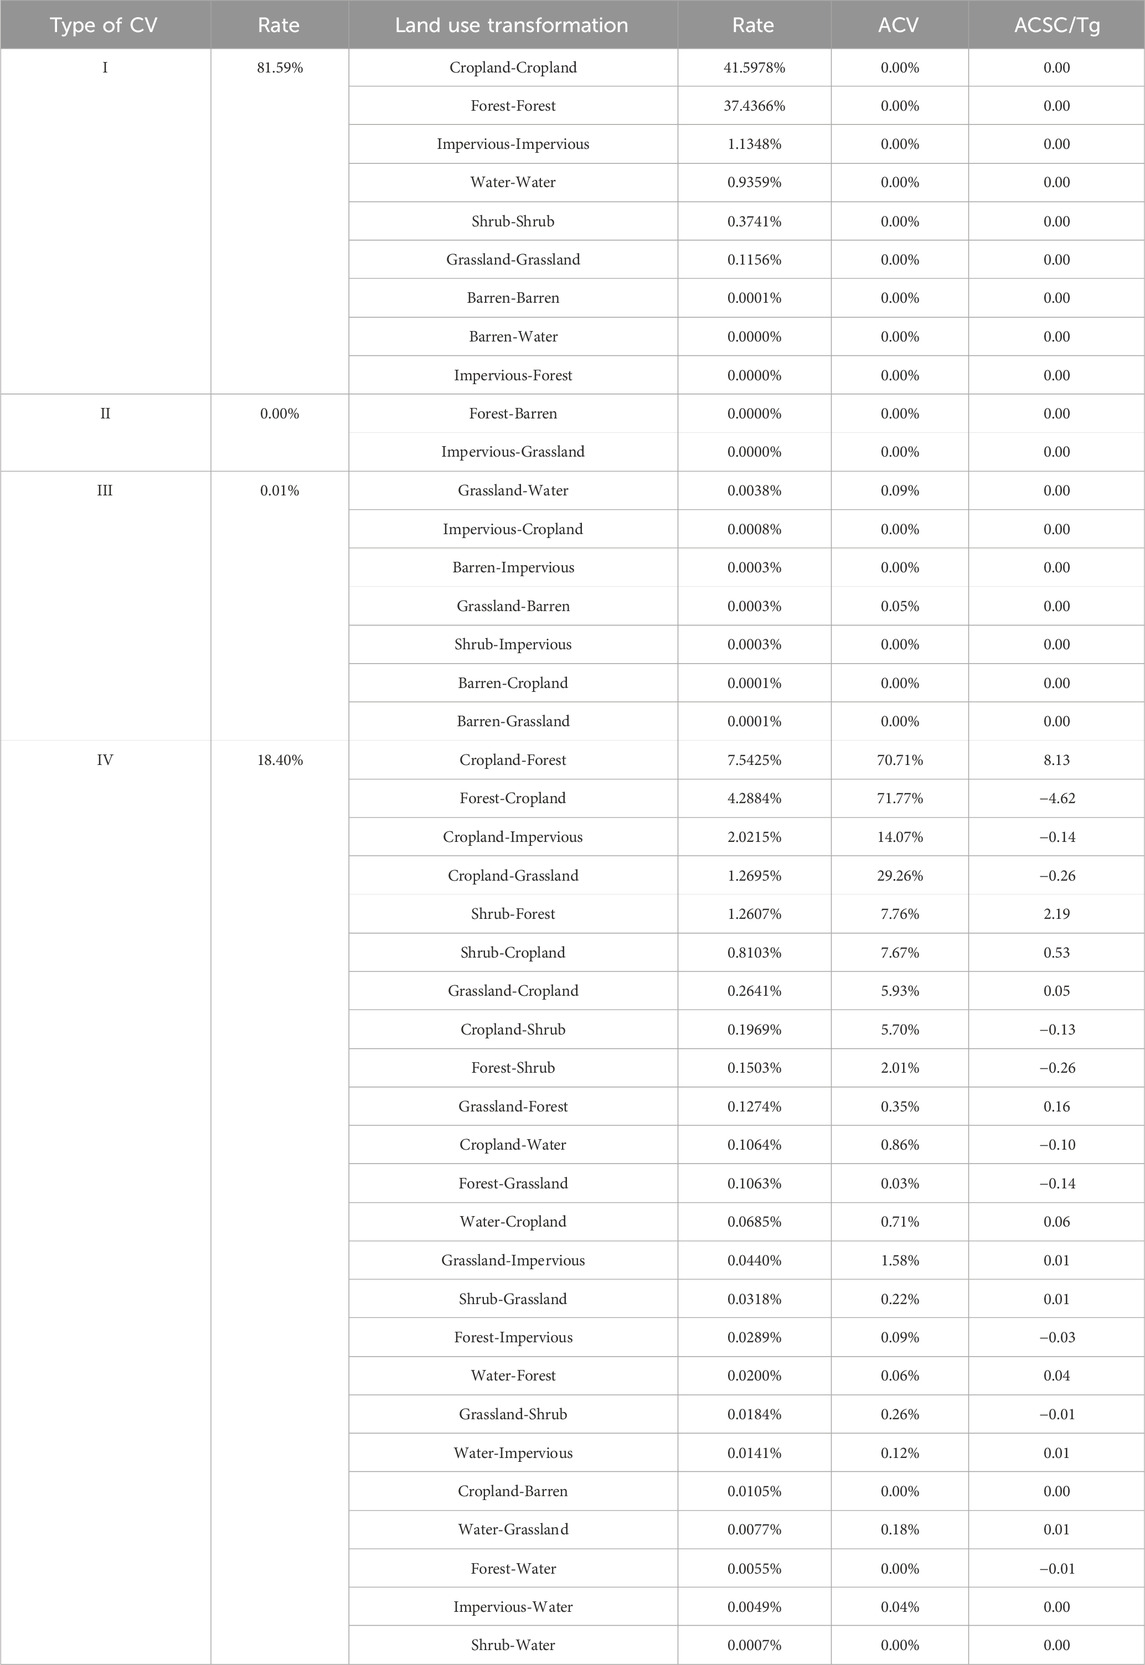
Table 8. Risk decomposition of carbon sequestration instability (ACV, Average CV; ACSC, Average carbon storage changes).
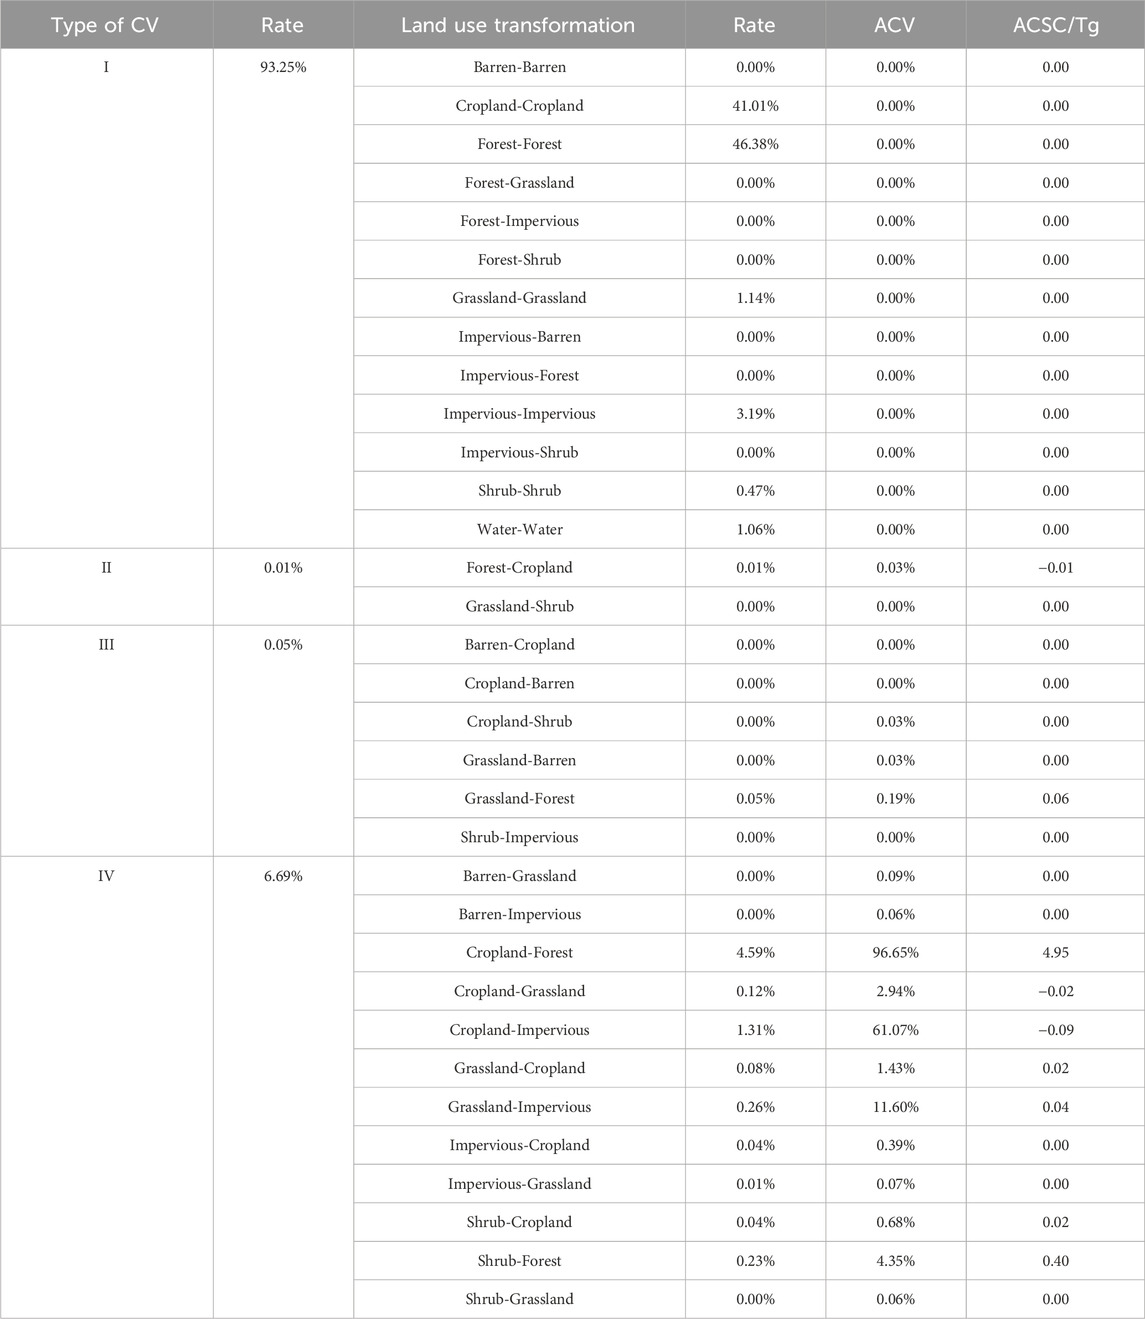
Table 9. Risk decomposition of carbon sequestration uncertainty (ACV, Average CV; ACSC, Average carbon storage changes).
In 2035, an integration of three development scenarios was performed, and the average carbon storage uncertainty (ACV) for various types of land use changes was calculated using Equation 16; Table 9. The primary sources of uncertainty were identified as Cropland-Forest, Cropland-Impervious, Grassland-Impervious, and Shrub-Forest transitions. Compared to the past 20 years, the land use change with the highest uncertainty will shift from Forest-Cropland to Cropland-Forest. Notably, despite a general trend of reduced uncertainty in future carbon storage in Guiyang, Cropland-Impervious transitions will lead to a reduction in carbon storage and an increase in uncertainty and risk. Although future carbon storage projections will indicate an upward trend, Cropland-Forest transitions, which are crucial for supporting future carbon storage, will exhibit a high level of uncertainty (96.65%), signifying a significant risk. Shrub-Forest transitions represent rocky desertification control and afforestation, but will bring uncertainty. Therefore, it is essential to prioritize the management of land use changes involving Cropland-Impervious, Cropland-Forest and Shrub-Forest in future planning.
In summary, Guiyang’s ongoing urbanization and intensified human activities have led to significant changes in land use over the past 20 years (Gao L. et al., 2022). Consequently, the instability of carbon storage has increased (Jiao et al., 2022). Moving forward, greater attention must be given to land use transitions that pose high risks of carbon storage instability and uncertainty, including Cropland-Impervious, Cropland-Forest, Shrub-Forest.
Based on the results of the above discussion, two major challenges lie ahead in the future. The first challenge is that the most effective pathway to enhancing carbon storage is through stringent control over the conversion between Forest-Cropland and Cropland-Impervious, but this could potentially affect food security and economic development. The second challenge is that the most effective approach to reducing future carbon storage uncertainty lies in strictly regulating the conversion of Cropland-Impervious, Cropland-Forest, and Shrub-Forest, yet this may have implications for economic development and overall carbon storage capacity. Therefore, under the goal of carbon neutrality, two critical questions must be addressed: How can carbon storage be effectively enhanced? How can carbon storage uncertainty be prudently mitigated? To this end, two policy recommendations are proposed.
First, enhance carbon storage scientifically while balancing carbon neutrality, food security, and economic development. (1) Implement differentiated strategies to guide and regulate land-use conversions. Forest and Cropland serve as the primary carbon storage land types in Guiyang. It is imperative to continue advancing ecological conservation initiatives and rocky desertification control strategies. The transformation of Shrub-Forest and Shrub-Cropland should be strongly encouraged, while the conversion of Cropland-Forest should be moderately promoted. Simultaneously, strict control should be exercised over the conversions of Forest-Cropland, Forest-Shrub, and Cropland-Impervious (Peng and Deng, 2021). (2) To mitigate the significant reduction in carbon storage caused by urban development and the conversion of cropland and forestland to impervious surfaces (e.g., Cropland-Impervious, Forest-Cropland), it is advisable to implement a carbon storage compensation policy. During land use transitions, changes in carbon storage should be carefully quantified. In cases where carbon storage decreases, equivalent compensation should be achieved through land-use transformations in other areas or by purchasing carbon storage credits from external sources. This approach ensures that the total carbon storage capacity remains stable and uncompromised (Zhou et al., 2023; Liu et al., 2015). (3) Moderately encouraging the conversion of Cropland-Forest can enhance carbon storage but may lead to a reduction in grain production. To address this issue, strategies should focus on improving agricultural land productivity. Specifically, efforts should be made to promote large-scale, mechanized, and digitized agricultural practices, thereby increasing grain yields per unit area. This approach could offset the potential grain production deficit caused by the conversion of Cropland-Forest (Zhou et al., 2023). (4) Urban development inevitably leads to the conversion of Cropland-Impervious, resulting in a decline in carbon storage. To mitigate this impact, efforts should focus on actively promoting the reuse of underutilized and inefficiently used construction land, thereby reducing the demand for new construction (Zhou et al., 2023). (5) Given the finite nature of land resources, relying on a “robbing Peter to pay Paul” approach is often unsustainable. Once the projected areas of high-carbon-density land types such as forests and croplands reach their peak, attention should shift to the efficient utilization of vertical space. This could involve promoting land-use integration, such as expanding afforestation and agricultural planting in unconventional spaces like rooftops and above water bodies, thereby enhancing overall carbon storage capacity (Gao S. et al., 2022; Zeng et al., 2023).
Second, to mitigate the uncertainty associated with carbon storage, it is advisable to encourage land-use transitions within the stable ranges of various influencing factors. Between 2000 and 2020, transitions such as Forest-Cropland, Cropland-Grassland, and Cropland-Impervious were associated with reduced carbon storage and high uncertainty. From 2020 to 2035, Cropland-Impervious is expected to further decrease carbon storage while increasing uncertainty and risk, whereas Cropland-Forest is anticipated to enhance carbon storage but with very high uncertainty (Yang Y. et al., 2024). Thus, controlling these land use conversions is crucial. Analysis of the factors affecting carbon storage instability and uncertainty indicates that, in descending order of influence, the most significant factors are DEM, AI, Distance from the national highway, SHDI, Mean annual Precipitation, IJI, Population density, Slope, and Distance from township. To minimize carbon storage uncertainty in Guiyang by 2035, it is recommended to prioritize land class transitions within the stable intervals: SHDI ∈ (0.054–0.706) ∪ (1.875–2.365), AI ∈ (0, 14.127), IJI ∈ (15.137, 29.124), DEM ∈ (832.214–982.718) ∪ (1277.432–1331.047), Slope ∈ (0, 0.231) ∪ (70.014–96.782) ∪ (161.653–172.724), Mean annual precipitation ∈ (1377.789–1392.014), Population density ∈ (0, 198.674) ∪ (2886.419–3245.853), Distance from township ∈ (3472.358–3925.024) ∪ (15136.454–16520.382), and Distance from the national highway ∈ (231.046–3442.611) ∪ (35248.669–42346.013).
This study has several limitations. First, while the study aims to explore the influence mechanisms, the factors considered may not encompass all relevant variables. Second, the parameter settings for the simulation scenarios are inherently subjective (Yang Y. et al., 2024). Third, although the carbon pool values are adjusted using relevant parameters, some degree of bias may still persist (Wang K. et al., 2022). Finally, the limited sample size may introduce bias in the conclusions (Ma et al., 2024). To address these limitations, future research will aim to incorporate a broader range of influencing factors, utilize deep learning techniques for model parameter determination, expand the study’s scope, and enhance the systematic and scientific rigor of the analysis.
Land use change significantly impacts carbon storage in terrestrial ecosystems (Chang et al., 2022). This study examines the instability and uncertainty of carbon storage resulting from land use changes in karst regions of China. The main findings are as follows:
(1) During 2000–2020, total carbon storage in Guiyang increased from 136.62 Tg to 142.13 Tg. By 2035, total carbon storage is projected to reach 147.50 Tg under the natural development scenario, 147.40 Tg under the urban expansion scenario, and 147.82 Tg under the ecological protection scenario. Increases in carbon storage primarily resulted from Cropland-Forest, Shrub-Forest, and Shrub-Cropland transitions, while decreases were mainly attributed to Forest-Cropland, Forest-Shrub, and Cropland-Impervious transitions. In karst regions, the mutual conversion between Shrub and Forest exerts a significant influence on carbon storage capacity.
(2) From 2000 to 2020, carbon storage instability exhibited an overall upward trend. The projected uncertainty of carbon storage from 2020 to 2035 is expected to decrease significantly compared to the previous period. Among the scenarios, urban expansion is anticipated to have the highest carbon storage uncertainty, while ecological protection is projected to have the lowest. The primary sources of instability are transitions of Cropland-Forest, Forest-Cropland, Cropland-Grassland, and Cropland-Impervious, while uncertainties mainly arise from Cropland-Forest, Cropland-Impervious, and Grassland-Impervious transitions.
(3) DEM, AI, Distance from national highways, SHDI, and Mean annual precipitation affected instability significantly. Of these, only DEM and Distance from the national highway had a negative effect on carbon storage instability.
(4) To effectively enhance carbon storage, it is imperative to strongly promote transitions of Shrub-Forest and Shrub-Cropland. Moderate encouragement should be given to conversions of Cropland-Forest, while transitions of Forest-Cropland, Forest-Shrub, and Cropland-Impervious should be appropriately constrained.
(5) To mitigate future uncertainties in carbon storage, land-use transitions should be prioritized within the stability ranges of key influencing factors, with particular emphasis on the conversions of Cropland-Forest and Cropland-Impervious.
Publicly available datasets were analyzed in this study. This data can be found here: https://zenodo.org/record/8176941, https://www.resdc.cn/.
HZ: Conceptualization, Methodology, Writing–review and editing. MT: Writing–original draft. JH: Formal Analysis, Investigation, Supervision, Writing–review and editing. JZ: Software, Writing–review and editing. JnH: Resources, Writing–review and editing. HjZ: Project administration, Writing–review and editing. YY: Visualization, Writing–review and editing.
The author(s) declare that financial support was received for the research, authorship, and/or publication of this article. This research was funded by Social Science Research Project of Education Department of Hubei Province under Grants 2023-6-717 and 2023-6-718, Construction Science and Technology Planning Project of Hubei Province under Grants [2022] 2198-122 and [2022] 2198-1.
Author HjZ was employed by Wuhan Design Consultation Group Co., Ltd. Author YY was employed by Guizhou Urban and Rural Planning and Design Research Institute Co., Ltd.
The remaining authors declare that the research was conducted in the absence of any commercial or financial relationships that could be construed as a potential conflict of interest.
The author(s) declare that no Generative AI was used in the creation of this manuscript.
All claims expressed in this article are solely those of the authors and do not necessarily represent those of their affiliated organizations, or those of the publisher, the editors and the reviewers. Any product that may be evaluated in this article, or claim that may be made by its manufacturer, is not guaranteed or endorsed by the publisher.
The Supplementary Material for this article can be found online at: https://www.frontiersin.org/articles/10.3389/fenvs.2025.1551050/full#supplementary-material
Alam, S. A., Starr, M., and Clark, B. J. F. (2013). Tree biomass and soil organic carbon densities across the Sudanese woodland savannah: a regional carbon sequestration study. J. arid Environ. 89, 67–76. doi:10.1016/j.jaridenv.2012.10.002
Alshehri, K., Chen, I.-C., Rugani, B., Sapsford, D., Harbottle, M., and Cleall, P. (2024). A novel uncertainty assessment protocol for integrated ecosystem services-life cycle assessments: a comparative case of nature-based solutions. Sustain. Prod. Consum. 47, 499–515. doi:10.1016/j.spc.2024.04.026
Anselin, L. (1995). Local indicators of spatial association—LISA. Geogr. Anal. 27 (2), 93–115. doi:10.1111/j.1538-4632.1995.tb00338.x
Ao, Y., Liu, X., Zhou, Xu, Ran, G., Yang, S., Yuan, W., et al. (2025). Differential thresholds of net ecosystem productivity in karst and non-karst regions for identifying their potential carbon sinks areas. J. Environ. Manag. 373, 123618. doi:10.1016/j.jenvman.2024.123618
Bertilsson, S., Liu, Y., Liu, C., Wang, S., Guo, Ke, Yang, J., et al. (2013). Organic carbon storage in four ecosystem types in the karst region of southwestern China. PLoS ONE 8 (2), e56443. doi:10.1371/journal.pone.0056443
Caceci, M. S., and Cacheris, W. P. (1984). Fitting curves to data. Byte 9 (5), 340–362. doi:10.1021/ac9619802
Chan, J. Y.-Le, Leow, S. M. H., Khean, T. B., Cheng, W. K., Phoong, S. W., Hong, Z.-W., et al. (2022). Mitigating the multicollinearity problem and its machine learning approach: a review. Mathematics 10 (8), 1283. doi:10.3390/math10081283
Chang, X., Xing, Y., Wang, J., Yang, H., and Gong, W. (2022). Effects of land use and cover change (LUCC) on terrestrial carbon stocks in China between 2000 and 2018. Resour. Conservation Recycl. 182, 106333. doi:10.1016/j.resconrec.2022.106333
Chen, H., Wang, C., and Ye, M. (2016). An uncertainty analysis of subsidy for carbon capture and storage (CCS) retrofitting investment in China's coal power plants using a real-options approach. J. Clean. Prod. 137, 200–212. doi:10.1016/j.jclepro.2016.07.074
Chen, S., and Yao, S. (2023). Identifying the drivers of land expansion and evaluating multi-scenario simulation of land use: a case study of Mashan County, China. Ecol. Inf. 77, 102201. doi:10.1016/j.ecoinf.2023.102201
Du, S., Zhou, Z., Huang, D., Zhang, F., Deng, F., and Yang, Y. (2023). The response of carbon stocks to land use/cover change and a vulnerability multi-scenario analysis of the karst region in southern China based on PLUS-InVEST. Forests 14 (12), 2307. doi:10.3390/f14122307
Fan, L., Cai, T., Wen, Q., Han, J., Wang, S., Wang, J., et al. (2023). Scenario simulation of land use change and carbon storage response in Henan Province, China: 1990–2050. Ecol. Indic. 154, 110660. doi:10.1016/j.ecolind.2023.110660
Fleury, P., Maréchal, J. C., and Ladouche, B. (2013). Karst flash-flood forecasting in the city of Nimes (southern France). Eng. Geol. 164, 26–35. doi:10.1016/j.enggeo.2013.06.007
Gao, L., Tao, F., Liu, R., Wang, Z., Leng, H., and Zhou, T. (2022a). Multi-scenario simulation and ecological risk analysis of land use based on the PLUS model: a case study of Nanjing. Sustain. Cities Soc. 85, 104055. doi:10.1016/j.scs.2022.104055
Gao, P. P., Li, Y. P., Gong, J. W., and Huang, G. H. (2021). Urban land-use planning under multi-uncertainty and multiobjective considering ecosystem service value and economic benefit-A case study of Guangzhou, China. Ecol. Complex. 45, 100886. doi:10.1016/j.ecocom.2020.100886
Gao, S., Yang, L., and Jiao, H. (2022b). Spatio-temporal analysis of the effects of human activities on habitat quality: a case study of Guiyang city, Guizhou province, China. Land 11 (10), 1837. doi:10.3390/land11101837
Giardina, C. P., and Ryan, M. G. (2000). Evidence that decomposition rates of organic carbon in mineral soil do not vary with temperature. Nature 404 (6780), 858–861. doi:10.1038/35009076
Grêt-Regamey, A., Brunner, S. H., Altwegg, J., and Bebi, P. (2013). Facing uncertainty in ecosystem services-based resource management. J. Environ. Manag. 127, S145–S154. doi:10.1016/j.jenvman.2012.07.028
Hamel, P., and Benjamin, P. B. (2017). Uncertainty assessment in ecosystem services analyses: seven challenges and practical responses. Ecosyst. Serv. 24, 1–15. doi:10.1016/j.ecoser.2016.12.008
Harmáčková, Z. V., and Vačkář, D. (2018). Future uncertainty in scenarios of ecosystem services provision: linking differences among narratives and outcomes. Ecosyst. Serv. 33, 134–145. doi:10.1016/j.ecoser.2018.06.005
Hou, Y. B. B., and Müller, F. (2013). Uncertainties in landscape analysis and ecosystem service assessment. J. Environ. Manag. 127, S117–S131. doi:10.1016/j.jenvman.2012.12.002
Huang, C., Zhang, C., and He, L. (2022). Assessment of the impact of rubber plantation expansion on regional carbon storage based on time series remote sensing and the invest model. Remote Sens. 14 (24), 6234. doi:10.3390/rs14246234
Huang, C.-W., Lin, Y.-P., Chiang, L.-C., and Wang, Y.-C. (2014). Using CV-GLUE procedure in analysis of wetland model predictive uncertainty. J. Environ. Manag. 140, 83–92. doi:10.1016/j.jenvman.2014.03.005
Hurvich, CLIFFORD M., and Tsai, CHIH.-LING (1989). Regression and time series model selection in small samples. Biometrika 76 (2), 297–307. doi:10.1093/biomet/76.2.297
Islam, I., Cui, S., Hoque, M. Z., Abdullah, H. M., Tonny, K. F., Ahmed, M., et al. (2022). Dynamics of tree outside forest land cover development and ecosystem carbon storage change in eastern coastal zone, Bangladesh. Land 11 (1), 76. doi:10.3390/land11010076
Jiao, Lu, Yang, R., Zhang, Y., Yin, J., and Huang, J. (2022). The evolution and determinants of ecosystem services in Guizhou—a typical karst mountainous area in southwest China. Land 11 (8), 1164. doi:10.3390/land11081164
Kinsey-Henderson, A. E., and Wilkinson, S. N. (2013). Evaluating shuttle radar and interpolated DEMs for slope gradient and soil erosion estimation in low relief terrain. Environ. Model. Softw. 40, 128–139. doi:10.1016/j.envsoft.2012.08.010
Kragten, J. (1990). Least-squares polynomial curve-fitting for calibration purposes (statcal-calibra). Anal. Chim. acta 241 (1), 1–13. doi:10.1016/S0003-2670(00)83259-6
Lahiji, R. N., Mobarghaee Dinan, N., Liaghati, H., Ghaffarzadeh, H., and Vafaeinejad, A. (2020). Scenario-based estimation of catchment carbon storage: linking multi-objective land allocation with InVEST model in a mixed agriculture-forest landscape. Front. Earth Sci. 14, 637–646. doi:10.1007/s11707-020-0825-1
Li, C., and Zhang, S. (2024). Assessing and explaining rising global carbon sink capacity in karst ecosystems. J. Clean. Prod. 477, 143862. doi:10.1016/j.jclepro.2024.143862
Li, K., Wang, S., and Cao, M. (2004). Vegetation and soil carbon storage in China.Sci. China Ser. d earth sciences-english 47 (1):49–57. doi:10.1360/02yd0029
Li, L., Fu, W., and Luo, M. (2022b). Spatial and temporal variation and prediction of ecosystem carbon stocks in yunnan province based on land use change. Int. J. Environ. Res. Public Health 19 (23), 16059. doi:10.3390/ijerph192316059
Li, L., Huang, X., and Yang, H. (2023). Optimizing land use patterns to improve the contribution of land use planning to carbon neutrality target. Land Use Policy 135, 106959. doi:10.1016/j.landusepol.2023.106959
Li, Q., Yang, L., Jiao, H., and He, Q. (2024). Spatiotemporal analysis of the impacts of land use change on ecosystem service value: a case from Guiyang, China. Land 13 (2), 211. doi:10.3390/land13020211
Li, X., Fu, J., Jiang, D., Lin, G., and Cao, C. (2022a). Land use optimization in Ningbo City with a coupled GA and PLUS model. J. Clean. Prod. 375, 134004. doi:10.1016/j.jclepro.2022.134004
Li, Y., and Geng, H. (2023). Spatiotemporal trends in ecosystem carbon stock evolution and quantitative attribution in a karst watershed in southwest China. Ecol. Indic. 153, 110429. doi:10.1016/j.ecolind.2023.110429
Li, Y., Ma, J., Li, Y., Jia, Q., Shen, X., and Xia, X. (2023a). Spatiotemporal variations in the soil quality of agricultural land and its drivers in China from 1980 to 2018. Sci. Total Environ. 892, 164649. doi:10.1016/j.scitotenv.2023.164649
Li, Y., Ma, J., Li, Y., Jia, Q., Shen, X., and Xia, X. (2023b). Spatiotemporal variations in the soil quality of agricultural land and its drivers in China from 1980 to 2018. Sci. Total Environ. 892, 164649. doi:10.1016/j.scitotenv.2023.164649
Liang, X., Guan, Q., Clarke, K. C., Liu, S., Wang, B., and Yao, Y. (2021). Understanding the drivers of sustainable land expansion using a patch-generating land use simulation (PLUS) model: a case study in Wuhan, China. Comput. Environ. Urban Syst. 85, 101569. doi:10.1016/j.compenvurbsys.2020.101569
Liang, X., Tian, He, Xia, Li, Huang, J.-L., Clarke, K. C., Yao, Y., et al. (2021). Modeling the dynamics and walking accessibility of urban open spaces under various policy scenarios. Landsc. Urban Plan. 207, 103993. doi:10.1016/j.landurbplan.2020.103993
Lin, T., Wu, D., Yang, M., Ma, P., Liu, Y., Liu, F., et al. (2022). Evolution and simulation of terrestrial ecosystem carbon storage and sustainability assessment in karst areas: a case study of Guizhou province. Int. J. Environ. Res. Public Health 19 (23), 16219. doi:10.3390/ijerph192316219
Lin, X., and Wang, Z. (2023). Landscape ecological risk assessment and its driving factors of multi-mountainous city. Ecol. Indic. 146, 109823. doi:10.1016/j.ecolind.2022.109823
Liu, C., Wu, X., and Wang, L. (2019). Analysis on land ecological security change and affect factors using RS and GWR in the Danjiangkou Reservoir area, China. Appl. Geogr. 105, 1–14. doi:10.1016/j.apgeog.2019.02.009
Liu, M., Xu, X., Wang, D., Sun, A. Y., and Wang, K. (2016). Karst catchments exhibited higher degradation stress from climate change than the non-karst catchments in southwest China: an ecohydrological perspective. J. Hydrology 535, 173–180. doi:10.1016/j.jhydrol.2016.01.033
Liu, S. Y., Hu, N.Ke, Zhang, J., and Lv, Z. C. (2018). Spatiotemporal change of carbon storage in the Loess Plateau of northern Shaanxi, based on the InVEST Model. Sci. Cold Arid Regions 10 (3), 240–250. doi:10.3724/sp.J.1226.2018.00240
Liu, T., Liu, H., and Qi, Y. (2015). Construction land expansion and cultivated land protection in urbanizing China: insights from national land surveys, 1996–2006. Habitat Int. 46, 13–22. doi:10.1016/j.habitatint.2014.10.019
Luo, D., Zhou, Z., Zhang, Lu, Chen, Q., Huang, D., Feng, Q., et al. (2024). Evolution and driver analysis of forest carbon stocks in karst mountainous areas of southwest China in the context of rocky desertification management. Catena 246, 108335. doi:10.1016/j.catena.2024.108335
Lv, J., Wang, Y., Liang, X., Yao, Y., Ma, T., and Guan, Q. (2021). Simulating urban expansion by incorporating an integrated gravitational field model into a demand-driven random forest-cellular automata model. Cities 109, 103044. doi:10.1016/j.cities.2020.103044
Ma, S., and Wen, Z. (2021). Optimization of land use structure to balance economic benefits and ecosystem services under uncertainties: a case study in Wuhan, China. J. Clean. Prod. 311, 127537. doi:10.1016/j.jclepro.2021.127537
Ma, X., Zhang, P., Yang, L., Qi, Y., Liu, J., Liu, L., et al. (2024). Assessing the relative contributions, combined effects and multiscale uncertainty of future land use and climate change on water-related ecosystem services in Southwest China using a novel integrated modelling framework. Sustain. Cities Soc. 106, 105400. doi:10.1016/j.scs.2024.105400
Mahjour, S. K., and Faroughi, S. A. (2023). Selecting representative geological realizations to model subsurface CO2 storage under uncertainty. Int. J. Greenh. Gas Control 127, 103920. doi:10.1016/j.ijggc.2023.103920
Motulsky, H. J., and Ransnas, L. A. (1987). Fitting curves to data using nonlinear regression: a practical and nonmathematical review. FASEB J. 1 (5), 365–374. doi:10.1096/fasebj.1.5.3315805
Narita, D., and Klepper, G. (2016). Economic incentives for carbon dioxide storage under uncertainty: a real options analysis. Int. J. Greenh. Gas Control 53, 18–27. doi:10.1016/j.ijggc.2016.07.021
Nie, W., Xu, B., Yang, F., Shi, Y., Liu, B., Wu, R., et al. (2023). Simulating future land use by coupling ecological security patterns and multiple scenarios. Sci. Total Environ. 859, 160262. doi:10.1016/j.scitotenv.2022.160262
Ning, J., Liu, J., Kuang, W., Xu, X., Zhang, S., Yan, C., et al. (2018). Spatiotemporal patterns and characteristics of land-use change in China during 2010–2015. J. Geogr. Sci. 28, 547–562. doi:10.1007/s11442-018-1490-0
Niu, L., and Pan, M. (2021). Research on dynamic simulation of land use change based on geographical weighted CLUE-S model. Int. J. Environ. Technol. Manag. 24 (1-2), 49–61. doi:10.1504/IJETM.2021.115728
Nordbotten, J. M., Fernø, M., Flemisch, B., Juanes, R., and Jørgensen, M. (2024). Experimentally assessing the uncertainty of forecasts of geological carbon storage. Int. J. Greenh. Gas Control 135, 104162. doi:10.1016/j.ijggc.2024.104162
Oshan, T. M., Li, Z., Kang, W., Wolf, L. J., and Fotheringham, A. S. (2019). mgwr: a Python implementation of multiscale geographically weighted regression for investigating process spatial heterogeneity and scale. ISPRS Int. J. Geo-Information 8 (6), 269. doi:10.3390/ijgi8060269
Pal, M., Bharati, P., Pal, M., and Bharati, P. (2019). “Introduction to correlation and linear regression analysis,” in Applications of regression techniques, 1–18. doi:10.1007/978-981-13-9314-3_1
Peng, T., and Deng, H. (2021). Research on the sustainable development process of low-carbon pilot cities: the case study of Guiyang, a low-carbon pilot city in south-west China. Environ. Dev. Sustain. 23 (2), 2382–2403. doi:10.1007/s10668-020-00679-0
Raich, J. W., and Nadelhoffer, K. J. (1989). Belowground carbon allocation in forest ecosystems: global trends. Ecology 70 (5), 1346–1354. doi:10.2307/1938194
Refsgaard, J. C., van der Sluijs, J. P., Højberg, A. L., and Vanrolleghem, P. A. (2007). Uncertainty in the environmental modelling process–a framework and guidance. Environ. Model. and Softw. 22 (11), 1543–1556. doi:10.1016/j.envsoft.2007.02.004
Shao, Q., Liu, S., Jia, N., Liu, G., Yang, F., Zhang, X., et al. (2023). Remote sensing assessment of the ecological benefits provided by national key ecological projects in China during 2000–2019. J. Geogr. Sci. 33 (8), 1587–1613. doi:10.1007/s11442-023-2144-4
Stocker, T. (2014). Climate change 2013: the physical science basis: working Group I contribution to the fifth assessment report of the intergovernmental panel on climate change. Cambridge: Cambridge University Press.
Sun, S., and Shi, Q. (2020). Global spatio-temporal assessment of changes in multiple ecosystem services under four IPCC SRES land-use scenarios. Earth's Future 8 (10), e2020EF001668. doi:10.1029/2020EF001668
Sun, W., Song, J., Yang, W., Zheng, Y., Li, C., and Kuang, Da (2020). Distribution of carbonate rocks and variation analysis of karst water resources in China. Carbonates Evaporites 35, 121–129. doi:10.1007/s13146-020-00657-7
Sun, Z., Salazar-Tio, R., Wu, L., Bostrøm, B., Fager, A., and Crouse, B. (2023). Geomechanical assessment of a large-scale CO2 storage and insights from uncertainty analysis. Geoenergy Sci. Eng. 224, 211596. doi:10.1016/j.geoen.2023.211596
Tobler, W. R. (1970). A computer movie simulating urban growth in the Detroit region. Econ. Geogr. 46 (Suppl. 1), 234–240. doi:10.2307/143141
Tong, X., Brandt, M., Yue, Y., Ciais, P., Rudbeck Jepsen, M., Penuelas, J., et al. (2020). Forest management in southern China generates short term extensive carbon sequestration. Nat. Commun. 11 (1), 129. doi:10.1038/s41467-019-13798-8
Wang, B., Li, X., Ma, C.-F., Zhu, G.-F., Luan, W.-F., Zhong, J.-T., et al. (2022a). Uncertainty analysis of ecosystem services and implications for environmental management–an experiment in the Heihe River Basin, China. Sci. Total Environ. 821, 153481. doi:10.1016/j.scitotenv.2022.153481
Wang, K., Li, X., Lyu, X., Dang, D., Dou, H., Li, M., et al. (2022b). Optimizing the land use and land cover pattern to increase its contribution to carbon neutrality. Remote Sens. 14 (19), 4751. doi:10.3390/rs14194751
Wang, K., Zhang, C., Chen, H., Yue, Y., Zhang, W., Zhang, M., et al. (2019). Karst landscapes of China: patterns, ecosystem processes and services. Landsc. Ecol. 34 (12), 2743–2763. doi:10.1007/s10980-019-00912-w
Wang, L., Zhu, R., Yin, Z., Chen, Z., Fang, C., Lu, R., et al. (2022c). Impacts of land-use change on the spatio-temporal patterns of terrestrial ecosystem carbon storage in the Gansu Province, Northwest China. Remote Sens. 14 (13), 3164. doi:10.3390/rs14133164
Wang, X., Wu, J., Liu, Y., Hai, X., Shanguan, Z., and Deng, L. (2022d). Driving factors of ecosystem services and their spatiotemporal change assessment based on land use types in the Loess Plateau. J. Environ. Manag. 311, 114835. doi:10.1016/j.jenvman.2022.114835
Wang, Y., Liang, D., Wang, J., Zhang, Y., Chen, F., and Ma, X. (2023). An analysis of regional carbon stock response under land use structure change and multi-scenario prediction, a case study of Hefei, China. Ecol. Indic. 151, 110293. doi:10.1016/j.ecolind.2023.110293
Wang, Z., Zeng, J., and Chen, W. (2022e). Impact of urban expansion on carbon storage under multi-scenario simulations in Wuhan, China. Environ. Sci. Pollut. Res. 29 (30), 45507–45526. doi:10.1007/s11356-022-19146-6
Watson, J., Kern, F., and Markusson, N. (2014). Resolving or managing uncertainties for carbon capture and storage: lessons from historical analogues. Technol. Forecast. Soc. Change 81, 192–204. doi:10.1016/j.techfore.2013.04.016
Wen, D., Wang, X., Liu, J., Xu, N., Wen, Z., and Hong, M. (2023). Maintaining key ecosystem services under multiple development scenarios: a case study in Guangdong–Hong Kong–Macao greater bay Area, China. Ecol. Indic. 154, 110691. doi:10.1016/J.ECOLIND.2023.110691
Wu, J., Luo, J., Zhang, H., Qin, S., and Yu, M. (2022). Projections of land use change and habitat quality assessment by coupling climate change and development patterns. Sci. Total Environ. 847, 157491. doi:10.1016/J.SCITOTENV.2022.157491
Xiao, T., Chen, T., Ma, Z., Tian, H., Meguerdijian, S., Chen, B., et al. (2024). A review of risk and uncertainty assessment for geologic carbon storage. Renew. Sustain. Energy Rev. 189, 113945. doi:10.1016/j.rser.2023.113945
Xing, Lu, Hu, M., and Wang, Yi (2020). Integrating ecosystem services value and uncertainty into regional ecological risk assessment: a case study of Hubei Province, Central China. Sci. Total Environ. 740, 140126. doi:10.1016/j.scitotenv.2020.140126
Xu, C., Zhang, Q., Yu, Q., Wang, J., Wang, F., Qiu, S., et al. (2023a). Effects of land use/cover change on carbon storage between 2000 and 2040 in the Yellow River Basin, China. Ecol. Indic. 151, 110345. doi:10.1016/j.ecolind.2023.110345
Xu, D., Zhang, Ke, Cao, L., Guan, X., and Zhang, H. (2022a). Driving forces and prediction of urban land use change based on the geodetector and CA-Markov model: a case study of Zhengzhou, China. Int. J. Digital Earth 15 (1), 2246–2267. doi:10.1080/17538947.2022.2147229
Xu, L., Liu, X., Tong, De, Liu, Z., Yin, L., and Zheng, W. (2022b). Forecasting urban land use change based on cellular automata and the PLUS model. Land 11 (5), 652. doi:10.3390/land11050652
Xu, W., Song, J., Long, Y., Mao, R., Tang, B., and Li, B. (2023b). Analysis and simulation of the driving mechanism and ecological effects of land cover change in the Weihe River basin, China. J. Environ. Manag. 344, 118320. doi:10.1016/j.jenvman.2023.118320
Yang, J., and Huang, X. (2021). 30 m annual land cover and its dynamics in China from 1990 to 2019. Earth Syst. Sci. Data Discuss. 2021, 1–29. doi:10.5194/essd-13-3907-2021
Yang, Y., Lu, Z., Yang, M., Yan, Y., and Yuyu, W. (2024b). Impact of land use changes on uncertainty in ecosystem services under different future scenarios: a case study of Zhang-Cheng area, China. J. Clean. Prod. 434, 139881. doi:10.1016/j.jclepro.2023.139881
Yang, Y., Xie, B., Lyu, J., Liang, X., Ding, D., Zhong, Y., et al. (2024a). Optimizing urban functional land towards “dual carbon” target: a coupling structural and spatial scales approach. Cities 148, 104860. doi:10.1016/j.cities.2024.104860
Yang, Y., Yuan, X., An, J., Su, Q., and Chen, B. (2024c). Drivers of ecosystem services and their trade-offs and synergies in different land use policy zones of Shaanxi Province, China. J. Clean. Prod. 452, 142077. doi:10.1016/j.jclepro.2024.142077
Yao, Y., Cheng, T., Sun, Z., Li, L., Chen, D., Chen, Z., et al. (2022). VecLI: a framework for calculating vector landscape indices considering landscape fragmentation. Environ. Model. and Softw. 149, 105325. doi:10.1016/j.envsoft.2022.105325
Yao, Y., Sun, Z., Li, L., Cheng, T., Chen, D., Zhou, G., et al. (2023). CarbonVCA: a cadastral parcel-scale carbon emission forecasting framework for peak carbon emissions. Cities 138, 104354. doi:10.1016/j.cities.2023.104354
Zeng, W., Tang, H., Liang, X., Hu, Z., Yang, Z., and Guan, Q. (2023). Using ecological security pattern to identify priority protected areas: a case study in the Wuhan Metropolitan Area, China. Ecol. Indic. 148, 110121. doi:10.1016/j.ecolind.2023.110121
Zhang, S., Yang, P., Xia, J., Wang, W., Cai, W., Chen, N., et al. (2022). Land use/land cover prediction and analysis of the middle reaches of the Yangtze River under different scenarios. Sci. Total Environ. 833, 155238. doi:10.1016/j.scitotenv.2022.155238
Zhang, S., Zhuang, Yu, Liu, L., Zhang, L., and Du, J. (2019). Risk management optimization framework for the optimal deployment of carbon capture and storage system under uncertainty. Renew. Sustain. Energy Rev. 113, 109280. doi:10.1016/j.rser.2019.109280
Zhang, Y., Yu, P., Tian, Y., Chen, H., and Chen, Y. (2023). Exploring the impact of integrated spatial function zones on land use dynamics and ecosystem services tradeoffs based on a future land use simulation (FLUS) model. Ecol. Indic. 150, 110246. doi:10.1016/J.ECOLIND.2023.110246
Zhou, H., Tang, M., Huang, J., Mei, X., and Zhao, H. (2024). Driving mechanisms and multi-scenario simulation of land use change based on National Land Survey Data: a case in Jianghan Plain, China. Front. Environ. Sci. 12, 1422987. doi:10.3389/fenvs.2024.1422987
Zhou, L., Dang, X., Sun, Q., and Wang, S. (2020). Multi-scenario simulation of urban land change in Shanghai by random forest and CA-Markov model. Sustain. Cities Soc. 55, 102045. doi:10.1016/j.scs.2020.102045
Zhou, Y., Zhong, Z., and Cheng, G. (2023). Cultivated land loss and construction land expansion in China: evidence from national land surveys in 1996, 2009 and 2019. Land Use Policy 125, 106496. doi:10.1016/j.landusepol.2022.106496
Zhu, G., Qiu, D., Zhang, Z., Sang, L., Liu, Y., Wang, L., et al. (2021). Land-use changes lead to a decrease in carbon storage in arid region, China. Ecol. Indic. 127, 107770. doi:10.1016/j.ecolind.2021.107770
Zhu, S., Zhang, C., Fang, X., Yan, Y., Hang, X., Chen, Y., et al. (2024). The spatiotemporal patterns and climate impacts of the carbon dynamics in economically developed areas of China during the past 40 years: a case of Jiangsu Province. J. Clean. Prod. 435, 140567. doi:10.1016/j.jclepro.2024.140567
Zhu, X., Li, J., Cheng, H., Zheng, L., Huang, W., Yan, Yu, et al. (2022). Assessing the impacts of ecological governance on carbon storage in an urban coal mining subsidence area. Ecol. Inf. 72, 101901. doi:10.1016/j.ecoinf.2022.101901
Keywords: carbon neutral, land use change simulation, coefficient of variation (CV), influence mechanism, stable interval, land use control, karst regions
Citation: Zhou H, Tang M, Huang J, Zhang J, Huang J, Zhao H and Yu Y (2025) Instability and uncertainty of carbon storage in karst regions under land use change: a case study in Guiyang, China. Front. Environ. Sci. 13:1551050. doi: 10.3389/fenvs.2025.1551050
Received: 24 December 2024; Accepted: 27 January 2025;
Published: 20 February 2025.
Edited by:
Salvador García-Ayllón Veintimilla, Polytechnic University of Cartagena, SpainReviewed by:
Bwalya Mutale, Kapasa Makasa Univeristy, ZambiaCopyright © 2025 Zhou, Tang, Huang, Zhang, Huang, Zhao and Yu. This is an open-access article distributed under the terms of the Creative Commons Attribution License (CC BY). The use, distribution or reproduction in other forums is permitted, provided the original author(s) and the copyright owner(s) are credited and that the original publication in this journal is cited, in accordance with accepted academic practice. No use, distribution or reproduction is permitted which does not comply with these terms.
*Correspondence: Heng Zhou, emhAd3VzdC5lZHUuY24=; Mingdong Tang, MjAyMDAxMTQ0MDI0QHd1c3QuZWR1LmNu
Disclaimer: All claims expressed in this article are solely those of the authors and do not necessarily represent those of their affiliated organizations, or those of the publisher, the editors and the reviewers. Any product that may be evaluated in this article or claim that may be made by its manufacturer is not guaranteed or endorsed by the publisher.
Research integrity at Frontiers
Learn more about the work of our research integrity team to safeguard the quality of each article we publish.