 Kai Zhou
 Xinyu Wei1
 Yichuan Zhang
94% of researchers rate our articles as excellent or good
Learn more about the work of our research integrity team to safeguard the quality of each article we publish.
Find out more
ORIGINAL RESEARCH article
Front. Environ. Sci., 14 March 2025
Sec. Environmental Informatics and Remote Sensing
Volume 13 - 2025 | https://doi.org/10.3389/fenvs.2025.1545455
This article is part of the Research TopicAir Quality: Observation, Remote Sensing, and Model Development - Volume IIView all 7 articles
Changes in blue–green–grey spaces use greatly influenced the carbon-storage capabilities of ecosystems, which is crucial for maintaining the carbon balance of regional ecosystems.By combining the Integrated Valuation of Ecosystem Services and Trade-offs (InVEST) model with the Patch-generating Land Use Simulation (PLUS) model, this study evaluates the spatiotemporal evolution of blue–green–grey spatial carbon stocks in Henan Province, China, and predicts the relationship between blue–green–grey spatial changes and carbon stocks under four future scenarios. This total amount of carbon stocks decreased by 39.75 × 10⁶ Mg from 2000 to 2020. The pattern of carbon-storage spatial distribution is characterised by ‘higher in the west and lower in the east’. The urbanisation process in Henan Province has been accelerating, and the area of grey space has increased rapidly, resulting in a substantial decline in carbon storage. Grey-space development will be severely constrained under the ecological protection (EP) scenario by 2050, where the grey-space area will decrease by 33.15% compared to that in 2020. Under the cultivated-land protection (CLP) scenario, the growth of the green space will increase considerably and carbon storage will reach the highest level. This paper offers a solid scientific foundation for promoting low-carbon and green development as well as optimising the spatial arrangement of Henan Province, China.
Increased greenhouse gas emissions cause global warming, leading to degradation of ecosystem services, which detrimentally affects human livelihood and terrestrial ecosystem health (Bellard et al., 2022; Li et al., 2022). A close relationship exists between carbon stocks in terrestrial ecosystems and the global climate crisis; in particular, terrestrial ecosystems can reduce warming and carbon climate feedbacks by absorbing and fixing atmospheric carbon dioxide (Yang et al., 2022). An important factor contributing to changes in ecosystem carbon stocks is land use and cover change (LUCC). LUCC modifies soil carbon stocks by reintroducing plant leftovers into soil and thereby modifies the soil environment, which affects carbon stocks in regional vegetation. Thus, LUCC alters the structure and function of regional ecosystems, which can eventually lead to the enhancement of territorial carbon stocks capacity or trigger regional carbon exertion, thereby further affecting global climate change (Li et al., 2022; Zheng and Zheng, 2023). Terrestrial ecosystems, as the second largest reservoir of carbon in the global carbon-stock system, have attracted extensive research attention with respect to global carbon-related changes (Li et al., 2023a).
China’s economy has improved rapidly in recent decades, which has indirectly resulted in an increase in urbanisation from 17.92% in 1978 to 65.22% in 2022 (Liu J. Y. et al., 2023). Rapid urbanisation has caused substantial LUCC, which has resulted in disappearance of a large amount of agricultural lands, wetlands and forests as well as rapid degradation of ecosystem functions (Wang et al., 2021a). In the process of rapid urbanisation in China, high-intensity land development and utilisation pose a major threat to the current territorial carbon stocks (Zhao et al., 2013; Han et al., 2021). Currently, more than 120 countries and regions have set carbon neutrality targets and formulated corresponding low-carbon development strategies (Chen et al., 2022). As one of the world’s largest developing countries and carbon emitters, China is under immense global pressure to reduce carbon emissions (Shi et al., 2023). The Chinese government has pledged to achieve an 85%–90% carbon-emission reduction target by 2060. Therefore, China’s high-quality development activities must comply with green and low-carbon development concepts, implement high-quality development concepts, promote the ‘dual-carbon’ strategy and increase carbon storage. In advocating the implementation of the ecological civilisation strategy, territorial spatial planning has continuously strengthened the strategy of constructing a pattern of ecological spatial development and protection (Zou et al., 2021a). This indicates that China’s planning focus has changed from urban expansion to co-evolution with ecological environment changes (Lei et al., 2024). The rationalisation of urban spatial layout, enhancement of carbon stocks in terrestrial ecosystems and reduction of carbon emissions have also become key issues for social development (Stankovic et al., 2021).
Researchers have performed extensive analysis on the relationship between LUCC and ecosystem carbon storage. Currently, the sample and inventory method (Robinson et al., 2023), field investigations and model simulations (Sun et al., 2023) are used to appraise carbon stocks in terrestrial ecosystems. The 3S (remote sensing, geographical information system and global positioning system) technology is being increasingly perfected; moreover, remote sensing combined with correlation models is increasingly applied for carbon-storage estimation (Li et al., 2023b). Compared with other assessment methods, combining remote sensing technology is suitable for study areas of any size and can dynamically reflect changes in carbon storage. Researchers typically have used methods such as CASA, DNDC, FORCCHN and LPJ-GUESS (Yue et al., 2023). Compared with the above models, the Integrated Valuation of Ecosystem Services and Trade-offs (InVEST) model has lower data requirements, more convenient operation, higher flexibility in parameter adjustment and higher accuracy; therefore, it is usually used to evaluate the quality of the ecological environment (Thompson, 2018). Simulated LUCC models include the CA-Mark model, Patch-generating Land Use Simulation (PLUS) model and Future Land-Use Simulation (FLUS) model, which can be used in combination with the InVEST model and are often used to simulate ecosystem carbon stocks in various scenarios. The combination of the CA-Mark and InVEST models has been used to simulate and predict LUCC from 1980 to 2050 and how this change will affect carbon storage in coastal areas (Zhu et al., 2022). Furthermore, the FLUS and InVEST models were used to forecast the pattern and change of ecosystem carbon stocks in Guilin in 2035 in natural development, economic priority, ecological priority and sustainable development scenarios (He et al., 2023).
The PLUS model is an LUCC prediction model based on raster data blocks, which can effectively mine the drivers of all types of LUCCs and simulate variations in the number of patches for various land-use types (Liang et al., 2021). This model includes the Land Expansion Analysis Strategy (LEAS) module and the cellular automata module based on multi-type random patch seeds (CARS) module. The LEAS module extracts and samples the LUCC expansion between two LUCC phases. Subsequently, based on the random forest algorithm, the development probability of various land-use types and the contribution rate of driving elements are mined and obtained. The CARS module combines random seed generation with the threshold decreasing mechanism to simulate the automatic generation of land-use-type patches under the constraint of the expansion probability. The PLUS model simulates patch changes of various land categories, which can help reliably deal with the problem of the low accuracy of simulated land types in a large study area. The PLUS and InVEST models have been used to explore the relationship between LUCC and carbon stocks in Guizhou Province in multiple scenarios over the past 20 years and to analyse the vulnerability of these carbon stocks (Du et al., 2023). In related research, most scholars’ research on carbon storage focuses on the carbon density of LUCC based on the first level LUCC types divided by scientific schools. This classification method simplifies LUCC types, and only a few scholars have used more refined classifications of LUCC types and carbon density for the study of such carbon storage (Wang et al., 2022; Gong et al., 2023).
Henan Province has a large population base and is one of the most populous provinces in China; moreover, with population growth, the construction land area in this province has expanded drastically, causing huge energy consumption. Moreover, the considerable land demand in this province has resulted in drastic LUCC, which has considerably affected the green and sustainable development and the carbon stocks in terrestrial ecosystems of the province. Henan Province plays a major role in the ecological protection (EP) of the Yellow River Basin (YRB). The important geographical location of Henan Province is critical for balancing regional carbon sources and sinks and promoting low-carbon land use management and development (Fan et al., 2023). Studying the carbon reduction path in Henan Province not only has practical significance for ensuring national food and energy security, but also provides a theoretical paradigm for achieving high-quality development in resource-based regions in central and western China. Carbon emissions in Henan are projected to peak between 2031 and 2043 in several scenarios (Fang et al., 2019). Although the loss of carbon stock in Henan is large, only few studies have assessed carbon storage in this province. Moreover, for this province, most studies have mainly focused on typical and single ecosystems such as forests and few studies have investigated the changes in ecosystem carbon storage in large areas (Wang et al., 2017, Wang et al., 2018). Furthermore, the calculation of carbon storage is based on the area of land use and the carbon density of different land use types, and the carbon density of different land use types varies greatly. A more refined division of land use type carbon density can more accurately estimate the carbon storage of the study area. Carbon stock studies have been conducted on the entire Henan Province and some areas of Henan Province. Previous studies have mainly considered six land-use types: cropland, woodland, grassland, watershed, construction land and unused land. Furthermore, Henan Province is vast and associated with a multitude of land-use types; summarising these land-use types into six types is not sufficiently accurate for carbon stock estimation (Fan et al., 2023; Wang et al., 2024). This study divides land types into 13 types based on the second level criteria, and calculates the carbon storage of the 13 land use types. Given the significant value of constructing a blue-green grey spatial system in national spatial planning. Then summarize these 13 land use types into green, blue, and grey spaces, and calculate the carbon storage of green, blue, and grey spaces. Consequently, for Henan Province, a systematic analysis of the associated blue–green–grey spatial distribution changes and carbon stock response from 2000 to 2050 is crucial for revealing the spatial and temporal shifts in carbon stocks. The results of such analysis would allow planning the regional arrangement of Henan Province to increase carbon storage in terrestrial ecosystems.
Henan Province is situated in the central and eastern parts of China in the middle and lower reaches of the Yellow River in the southern part of the North China Plain. Henan is also the only province in China that spans the Yangtze River, Huai River, Yellow River and Haihe River, with basin areas of 2.72, 8.83, 3.62 and 15,300 km2, respectively. The province occupies 1.67 × 10⁵ km2, which is 1.73% of China’s total area. The province includes 17 prefectural-level cities; moreover, a county-level city falls under the authority of this province (Figure 1). The province is made up of plains, hills and mountains, which make up 55.7%, 26.6% and 17.7% of its total area, respectively. The majority of Henan Province experiences the warm temperate zone’s transition from the northern subtropics to the continental monsoon climate. The province’s average annual precipitation is 533.4–1,095.8 mm, with average temperature variations from north to south lying within 13.3°C–15.7°C. Henan Province is situated between the coastal open area and the central and western areas and in the middle region of China’s economic development from east to west. Henan Province is an important location for agricultural production (the cultivated-land area of this province is > 7.33 × 10⁴ km2, ranking third in the country) and features crucial deposits of mineral resources. Henan Province is an important integrated transportation hub as well as a centre for people, logistics and information flows in China. Henan Province is also the core area of the main national strategy of ‘Ecological Protection and High-quality Development of the YRB’.
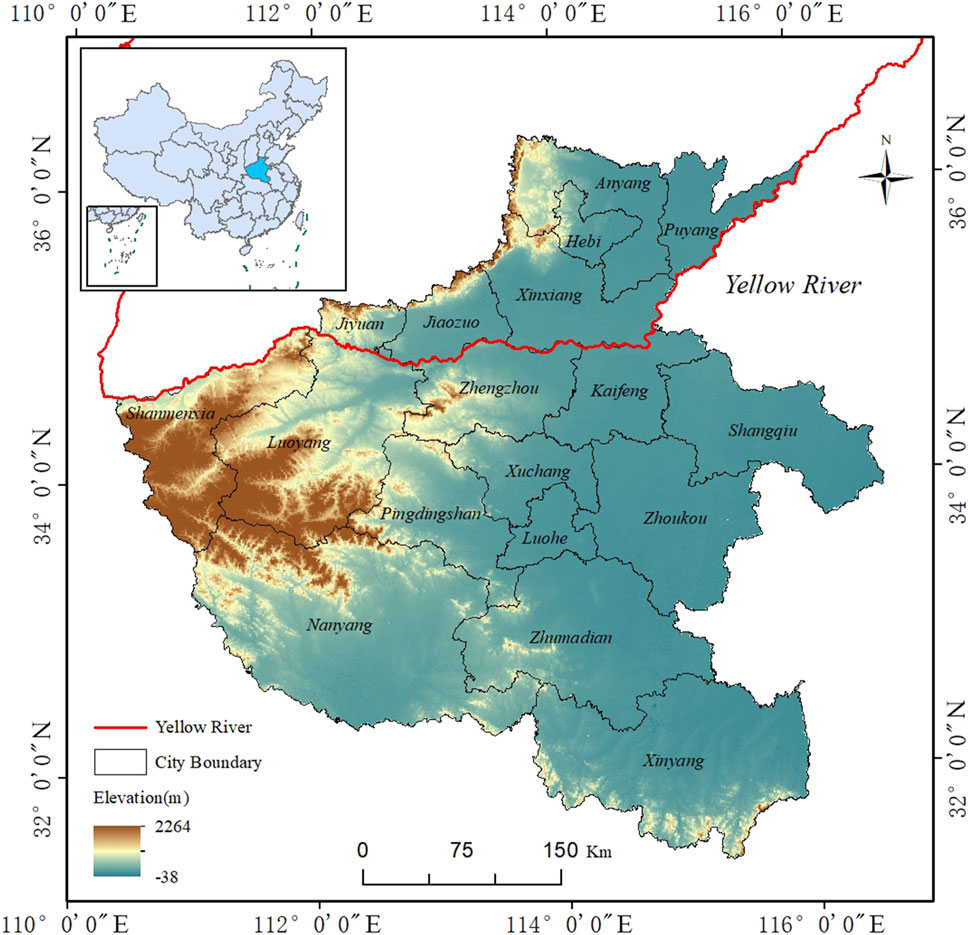
Figure 1. Regional location and scope of the Henan.
Data used herein are detailed in Table 1. The land use data for Henan Province for 2000, 2010 and 2020 were sourced from Landsat satellite images provided by the data platform of the Center for Resource and Environmental Studies of the Chinese Academy of Sciences (CAS). According to the land use/cover classification system of the CAS (6 first-level classifications and 25 second-level classifications) and the specific needs of the present study, land-use types were classified into 13 types: paddy field, dry land, woodland, shrub, open woodland, other woodland, high-coverage grassland, med-coverage grassland, low-coverage grassland, construction land, water and other unused land and marshland. Based on the LUCC classification system reported by Suligowski et al. (2021), these 13 categories of land uses were classified into blue–green–grey spaces. Digital elevation model (DEM) data were provided by the Geospatial Data Cloud Platform, and aspect and slope data were processed from the DEM data using the ArcGIS 10.2 software. Population and GDP data were provided by the Resource and Environment Research Center of the CAS. Road data, government location data and water system data were obtained from Open-Street Map. The aforementioned data were unified into raster data with a spatial resolution of 300 m with the same projection and the same number of rows and columns using ArcGIS 10.2. This data unification were performed for subsequent projection conversion, re-sampling and Euclidean distance calculations (Figure 2). Precipitation and temperature data were sourced from the National Tibetan Plateau Data Center platform.
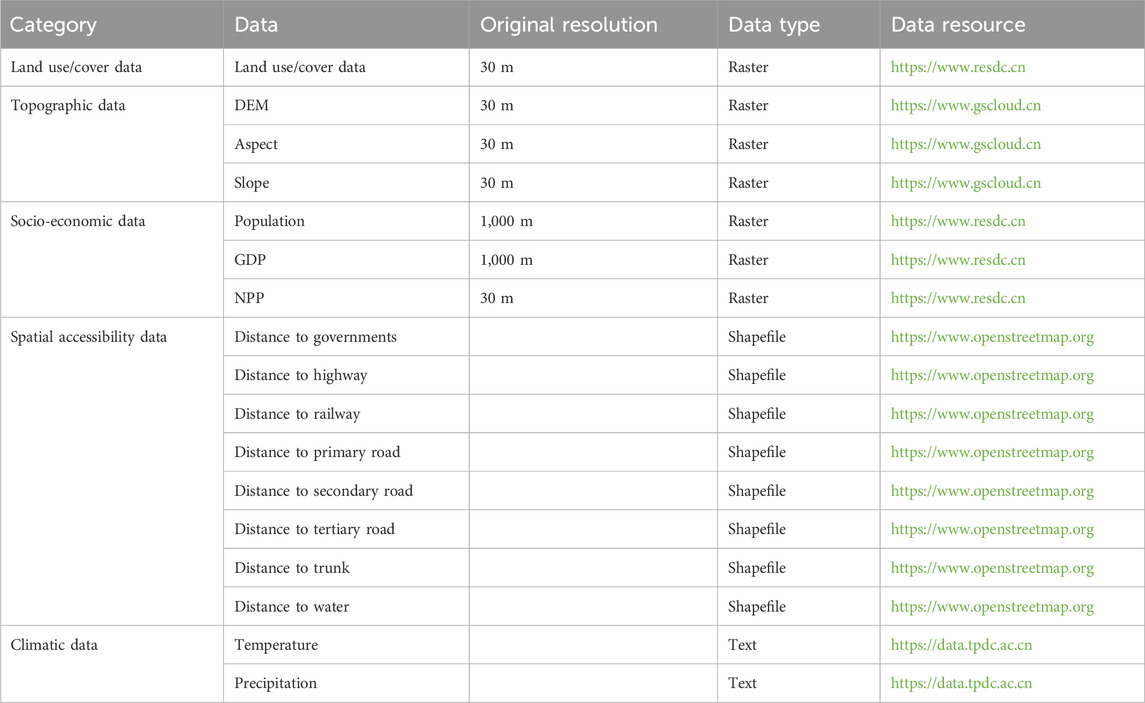
Table 1. Dataset source.
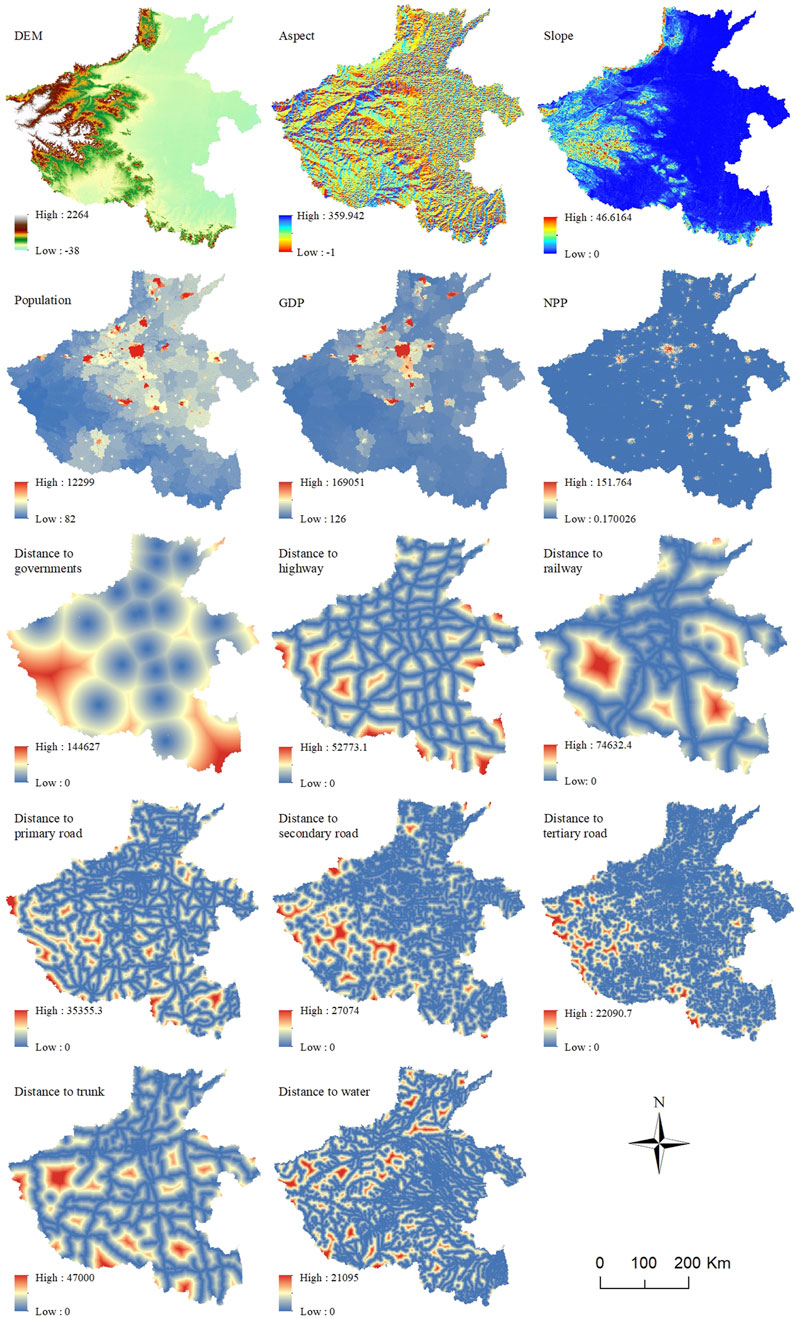
Figure 2. Drivers of land use changes in the study area.
The InVEST model includes the Carbon Storages and Sequestration module, which simplifies the calculation and transfer of carbon storage (Xu et al., 2023). Equations 1, 2 are the formulas for calculating carbon stocks in the InVEST model. The carbon density data of different land use types were divided into aboveground, underground, soil organic and dead organic biomass. Considering the difficulty of obtaining the carbon density data for dead organic biomass, these data were not considered for the research region (Zhu et al., 2022). The total carbon storage in Henan Province was estimated by combining the LUCC data with the corresponding carbon pool density according to the following formula:
where Cm is the carbon density pertaining to the land use type m, Cm_above is the aboveground carbon density pertaining to the land use type m, Cm_below is the underground carbon density pertaining to the land use type m, Cm_soil is the soil organic carbon density pertaining to the land use type m, Cm_dead is the dead organic biomass pertaining to the land use type m, Ctotal is the total carbon storage; Si is the area of the ith land-use type, and n is the number of land-use types established in the study.
Carbon density varies with many factors, such as climate, soil properties and land use, thus exhibiting notable regional differences. Only few relevant studies have been conducted on the blue–green–grey spaces in Henan Province based on the secondary land use types; therefore, this study uses research areas with similar climate and geographical locations as the calculation basis for selecting carbon density data (Chuai et al., 2011; He and Sun, 2016; Xue, 2017; Li, 2021; Zou et al., 2021b; Li et al., 2023c; Wu et al., 2023a; Xu et al., 2023; Yue et al., 2023; Zhang et al., 2023). Precipitation and air temperature considerably affect the carbon density in a region; therefore, the average annual precipitation and average annual air temperature were used to correct the carbon density to the conditions of Henan Province. The corrected carbon density values for all land-use types are listed in Table 2 (Raich and Nadelhoffer, 1989). The average precipitation in Henan Province and the entire country in 2000–2020 was 796.30 and 1,003.74 mm, respectively, and the corresponding average temperatures were 14.93°C and 14.15°C, respectively. The correction formula is as follows (Equations 3–9) (Giardina and Ryan, 2000; Litton et al., 2007; Alam et al., 2013):
where CSP is the density of soil organic carbon (Mg/hm2) adjusted using the precipitation factor; CBP and CBT are the biomass carbon densities (Mg/hm2) adjusted using the precipitation and temperature factors, respectively; MAP represents annual precipitation (mm); MAT stands for annual temperature (°C); KBP is corrected precipitation factor for biomass carbon density; KBT is corrected temperature factor for biomass carbon density; KB is the correction coefficient for biomass carbon density; KS is the correction coefficient for soil organic carbon density and C′ and C´´ are carbon densities in Henan Province and China, respectively.
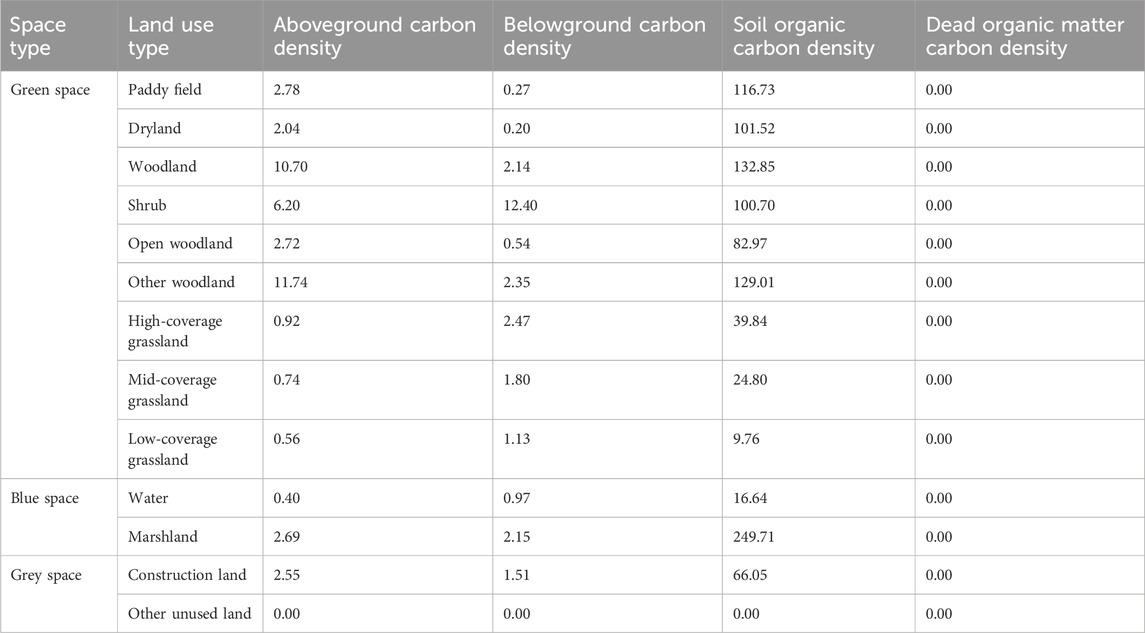
Table 2. Carbon density pertaining to each land-use type in Henan (Mg/hm2).
The PLUS model mainly performs data transformation, extraction of spatial variation in land use, prediction of the probability distribution of land suitability using the random forest technique, spatial allocation based on the adaptive inertia mechanism and accuracy validation (Wu and Wang, 2023b).
Herein, the CAS secondary land-use classification standard was used to classify the LUCC types and simulate changes in the blue–green–grey spaces. LUCC data for Henan Province for 2000 and 2010 were used to predict the province’s LUCC data for 2020 by combining 14 factors such as topography, socio-economy and spatial accessibility. The simulation findings were compared using the Kappa coefficient and overall accuracy (OA) with the authentic LUCC data for 2020. With a Kappa precision of 82.39% and an OA of 88.62%, the PLUS model seemed to be able to simulate LUCC in the study area with reasonable precision. The LEAS module of the PLUS model was used to extract the land expansion data of Henan Province in 2010 and 2020. Subsequently, the random forest algorithm was employed to predict the probability of expansion for each land-use type and the contribution of each driving elements to the expansion of all land types. Markov chains were utilised to forecast the requirement of all land types of Henan Province. The CARS module was used to simulate the land use status of Henan Province under four scenarios for 2030 and 2050 using water as a limiting factor.
The scenarios set in this study were mainly based on the historical land-use patterns of Henan Province and the territorial spatial arrangement of Henan Province (2021–2035). This planning document clearly points out that it is necessary to stabilise the base amount of cultivated land, conserve diversified ecological space, optimise the spatial layout of cities and towns and promote the coordinated development of cities and towns. Based on this development perspectives, four scenarios were established. Land use in 2030 and 2050 was simulated considering the following scenarios:
(1) Natural development (ND) scenario: Based on LUCC and its variation rate in the past 2 decades, Markov chains are used to predict future demand for all LUCC types. In this scenario, the simulated future land-use changes are found to maintain the traditional development pattern, and this scenario serves as a basis for other scenarios.
(2) Ecological protection (EP) scenario: A main goal of the national policy for promoting green, high-quality growth in the future is the ecological protection of the YRB. This scheme prioritises ecological protection in future development planning. A 30% decrease is observed in the likelihood of converting water, shrub, open woodland, other woodland and woodland to construction land. Moreover, a 20% decrease is observed in the likelihood of converting high-coverage grassland, mid-coverage grassland, low-coverage grassland, paddy fields and dry land into construction land. The probability of the transformation of construction land to paddy fields, dry land, high-coverage grassland, mid-coverage grassland and low-coverage grassland is found to increase by 10%.
(3) Cultivated-land protection (CLP) scenario: This scheme prioritises farmland protection in future development planning. Henan, as a large agricultural province, is an important pillar of national food production. Therefore, to guarantee the strategic security of national food production, the transformation of farmland to other land types is restricted by designating areas that were cultivated land in 2000, 2010 and 2020 as restricted protection zones. The conversion of paddy fields and dry land to construction land is found to decrease by 20%. Furthermore, the conversion of construction land to paddy fields and dry land is found to increase by 10%.
(4) Urban development (UD) scenario: According to the land and space planning requirements, the urbanisation rate in Henan Province is expected to reach 72% by 2035. This plan prioritises UD in future development planning. A 30% reduction is observed in the likelihood of conversion of water, shrub, open forest, other types of woodland, high-coverage grassland, mid-coverage grassland and low-coverage grassland to construction land. The probability of construction land being converted to paddy fields and dry land is found to reduce by 10%.
The change in blue–green–grey spaces in Henan Province in 2000–2020 was as follows: the overall area of green space decreased, while the areas of blue and grey spaces increased. The detailed area and proportions are specified in Table 3. In 2000–2020, Henan Province was dominated by green space, followed by grey space and blue space. In 2000–2020, the area of green space remained greater than 139.50 × 10⁵ hm2, and its proportion remained above 84.00%. In the same period, the area of blue space was consistently below 5.00 × 10⁵ hm2, which did not occupy more than 3.00% of the research region area. Over the last 2 decades, the area of green space in Henan Province has declined by 5.26 × 10⁵ hm2, whereas the areas of blue and grey spaces have increased by 0.71 × 10⁵ and 6.73 × 10⁵ hm2, respectively. The blue–green–grey spatial distribution exhibits the highest variation (4.34%) in green space during this 20-year period.
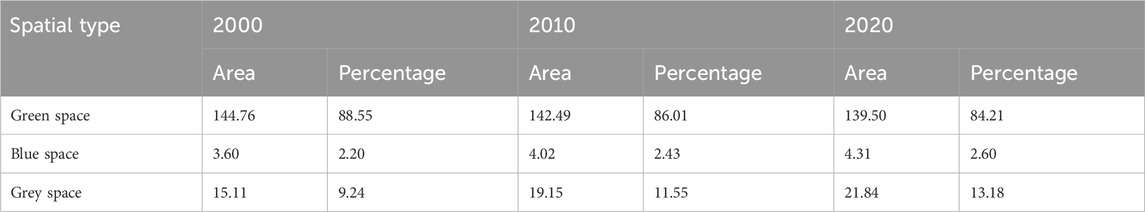
Table 3. Area and proportion of blue–green–grey-space use for Henan Province (×105 hm2) from 2000 to 2020.
The distribution of blue–green–grey space in Henan Province considerably changed from 2000 to 2020, particularly during 2000–2010 (Figure 3). With considerably high economic growth during this period, urbanisation advanced and the grey space area (of which construction land is the main component) increased; moreover, the growth of grey space area is primarily occurred in the central region. Zhengzhou city, the capital of Henan Province, is a relatively more developed economic region in the province. A development pattern is formed by Zhengzhou city as the centre and the grey space connected to it. From 2000 to 2010, the grey space area considerably expanded, with the expansion slowing down in 2010–2020. Although overall the green space area decreased, it remained relatively stable in Sanmenxia, Luoyang and Nanyang. The mountainous areas of the Funiu Mountains, Tongbai Mountains and Dabie Mountains are connected; therefore, the development of grey space in these areas was limited. Although blue space steadily increased over time, the increase comprised only 0.40% over the 20-year period and was mainly concentrated in the Nanyang Basin.
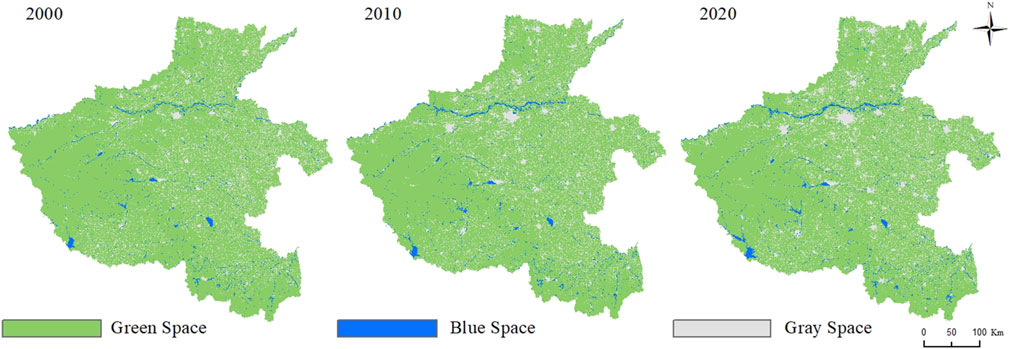
Figure 3. Blue-green-grey-spatial pattern for Henan Province from 2000 to 2020.
Carbon stocks in different types of spaces in Henan Province in the last 2 decades were assessed (Table 4). The amount of carbon stored in the province was 1,666.05 × 106 Mg, 1,666.69 × 106 Mg and 1,626.30 × 106 Mg in 2000, 2010 and 2020, respectively. In 2000–2020, carbon storage in Henan Province overall decreased by 2.39%. Green space, as the main contributor of carbon storage, continuously declined in area during 2000–2020, resulting in a loss of 74.22 × 10⁶ Mg (a decrease of 4.82%) of green-space carbon storage. Simultaneously, carbon storage in the grey space increased during this period. Although its contribution to the total carbon storage ranks second (after the green space), the grey-space storage accounted for only 9.49% of the total carbon stocks of the province.
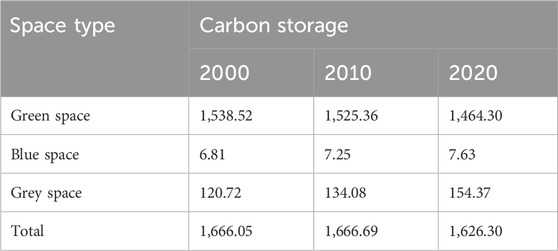
Table 4. Blue–green–grey spatial carbon storage for Henan Province (×106 Mg) from 2000 to 2020.
Considering the spatial layout, the blue–green–grey-space carbon stocks in the province from 2000 to 2020 showed the distribution characteristics of ‘higher in the west and lower in the east’, as seen in Figure 4. Throughout the study phase, Henan Province’s high-carbon-stock areas were mostly concentrated in its mountainous northwest, western and southern regions, while its low-carbon-stock areas were mostly concentrated in its central area, which has comparatively flat topography. The regions with relatively low-carbon stocks expanded in 2000–2020, with the expansion being most pronounced in the region connecting Xinxiang, Luoyang, Xuchang and other cities, with Zhengzhou as the axis.
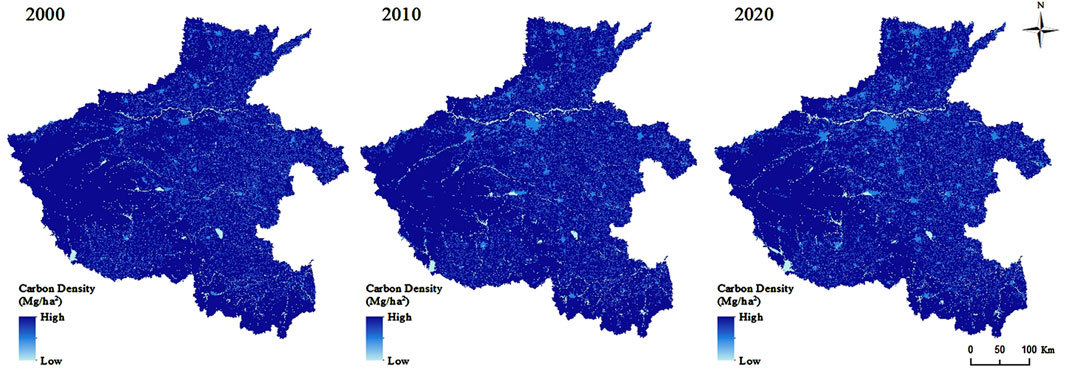
Figure 4. Spatial distribution of carbon storage for Henan Province from 2000 to 2020.
The changes in carbon-storage patterns in Henan Province over the last 2 decades were investigated (Figure 5). Subtract the carbon storage data from two predetermined periods to obtain changes in carbon storage, which can be classified into three categories: significantly reduced, basically unchanged or significantly increased. In most areas in Henan Province, carbon storage remained basically unchanged, with considerable carbon-storage reduction mainly scattered in the core urban areas of Henan Province and its western region. The province’s western region has the majority of the zones with high carbon stock value; however, a large portion of the areas with considerably reduced carbon storage is also located in the western region. The areas with significantly reduced carbon storage in 2000–2010 are mainly located in and around Zhengzhou city; the areas with remarkable increments in carbon stocks during this period are more dispersed but exhibit a higher concentration in the southern part of Xinyang. From 2010 to 2020, the zones with a significant decrease in carbon stocks in the study area showed a remarkable increasing trend and these zones were mainly concentrated in parts such as Nanyang and southern Luoyang in the western region. Furthermore, the number of areas with substantially reduced carbon stocks decreased in the central zone compared with 2000–2010. Additionally, compared with the case of 2000–2010, in 2010–2020, areas with a significant increase in carbon stocks in the entire study area showed a notable decreasing trend in quantity. Overall, the area where carbon stocks substantially decreased in the last 20 years was considerably larger than the area where carbon stocks substantially increased. The western region of Henan Province is home to most regions where carbon stocks have considerably decreased, while the zones where carbon stocks have considerably increased are primarily located in the central and eastern zones of the province.
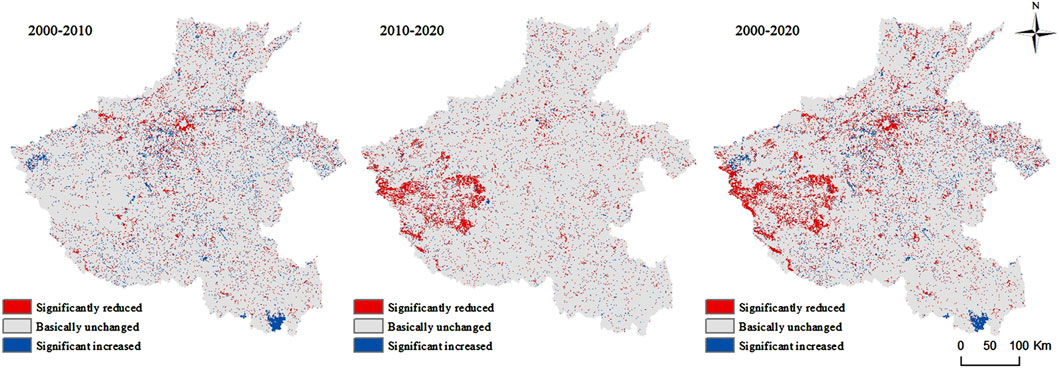
Figure 5. Spatial change in carbon stocks in Henan Province from 2000 to 2020.
The statistics for each land use type were obtained from the data presented in Table 5 (according to the classification criteria used in this study) and the blue–green–grey spatial distributions in Henan Province in all scenarios (Figure 6).
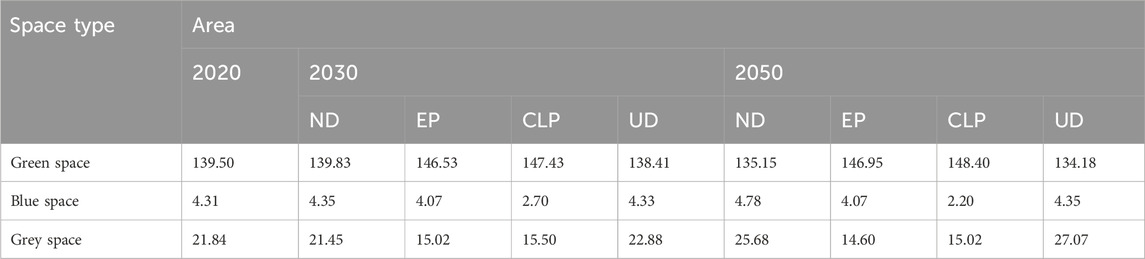
Table 5. Area of blue–green–grey-space use for Henan Province from 2020 to 2050 (×105hm2).
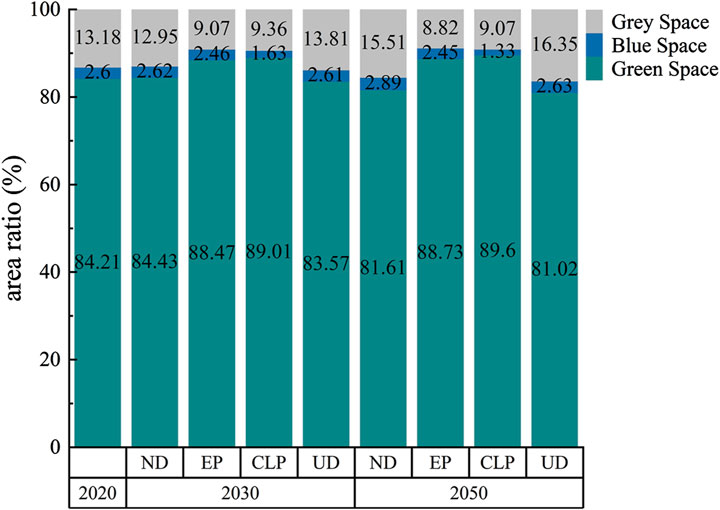
Figure 6. Proportion of blue-green-grey-space use for Henan Province from 2030 to 2050.
In the ND scenario from 2030 to 2050, Henan Province’s green-space area increases and then decreases compared with its green-space area in 2020; moreover, the blue-space area increases, while the grey-space area initially decreases and subsequently increases. Under the EP scenario, the area of green space increases by 5.34%; the area of blue space first decreases and then remains unchanged, while the area of grey space decreases by 33.15%. Under the CLP scenario, the area of green space increases to 148.40 × 10⁵ hm2 (6.38%) while the areas of blue and grey spaces decrease, with the area of blue space decreasing by 48.96%. The reduction in the area of blue space in 2020–2030 accounts for 76.30% of the total reduction. The sustained growth of green space area under CLP scenario may be related to policies such as rural construction land reclamation and Yellow River Basin farmland restoration. Furthermore, under the UD scenario, the area of green space decreases by 3.81%, while the areas of blue and grey spaces increase; moreover, the grey-space area decreases by 5.23 × 10⁵ hm2 or 23.95%.
In the 2030 ND scenario, the area of green space in Henan Province increases by 0.33 × 10⁵ hm2 (0.02%), that of blue space increases by 0.04 × 10⁵ hm2 (0.93%) and that of grey space decreases by 0.39 × 10⁵ hm2 relative to those in 2020. Under the EP scenario, the areas of green space and grey space exhibit greater changes than under the ND scenario, with the green-space area increasing by 5.04% (7.03 × 10⁵ hm2), the grey-space area decreasing by 31.23% (6.82 × 10⁵ hm2) and the blue-space area decreasing by 5.57% (0.24 × 10⁵ hm2). Under the CLP scenario, the change in the area of green space is the same as in the two aforementioned scenarios. Under this scenario, the green-space area increases by 5.68% (7.93 × 10⁵ hm2), reaching a maximum of 89.01%; compared with the EP scenario, the reduction in the blue-space area is more considerable, by 37.35% (1.61 × 10⁵ hm2), accounting for 1.63% of the area of Henan. Under the UD scenario, the area of green space decreases by 1.09 × 10⁵ hm2 by 2030, which is greater than in the other scenarios. At the same time, the trend in the blue-space area is comparable to that under the ND scenario. The grey-space area exhibits a greater increase than under the EP and CLP scenarios; specifically, the grey-space area increases by 4.76% (1.04 × 10⁵ hm2), reaching the maximum value among all scenarios, 13.81% of the area of Henan.
Under the ND scenario in 2050, the area of green space in Henan Province decreases by 4.35 × 10⁵ hm2 while the areas of blue and grey spaces increase by 0.47 × 10⁵ and 3.84 × 10⁵ hm2 (17.58%), respectively, relative to corresponding values in 2030. In the 2050-EP scenario, the area of green space in Henan Province increases by 5.34%; at the same time, the area of grey space in the EP scenario decreases by 33.15%. In the 2050 CLP scenario, the area of green space increases by 6.38%, exhibiting the largest area, 89.60% of the area of Henan; moreover, the area of blue space considerably decreases, accounting for only 1.33% of the area of Henan Province. Under the UD scenario, the decreasing trend of the area of green-space (5.32 × 10⁵ hm2) is more pronounced and the proportion of the area of green-space to the area of the province reaches the minimum value of 81.02% compared with other scenarios; moreover, the grey-space area considerably increases, constituting 16.35% of the area of Henan Province. Thus, under this scenario, green space cannot be effectively protected.
The distributions of blue–green–grey spaces in 2030 and 2050 under ND, EP, CLP and UD scenarios are shown in Figure 7. Between 2030 and 2050, the changes in blue–green–grey spatial distribution in Henan Province under the ND and UD scenarios are similar to those under the EP and CLP scenarios, with the area of grey space considerably increasing. Additionally, the changes in blue–green–grey spatial layout in Henan Province are similar under the CLP and EP scenarios, with the growth of grey space being restricted and the expansion of green space being effectively protected.
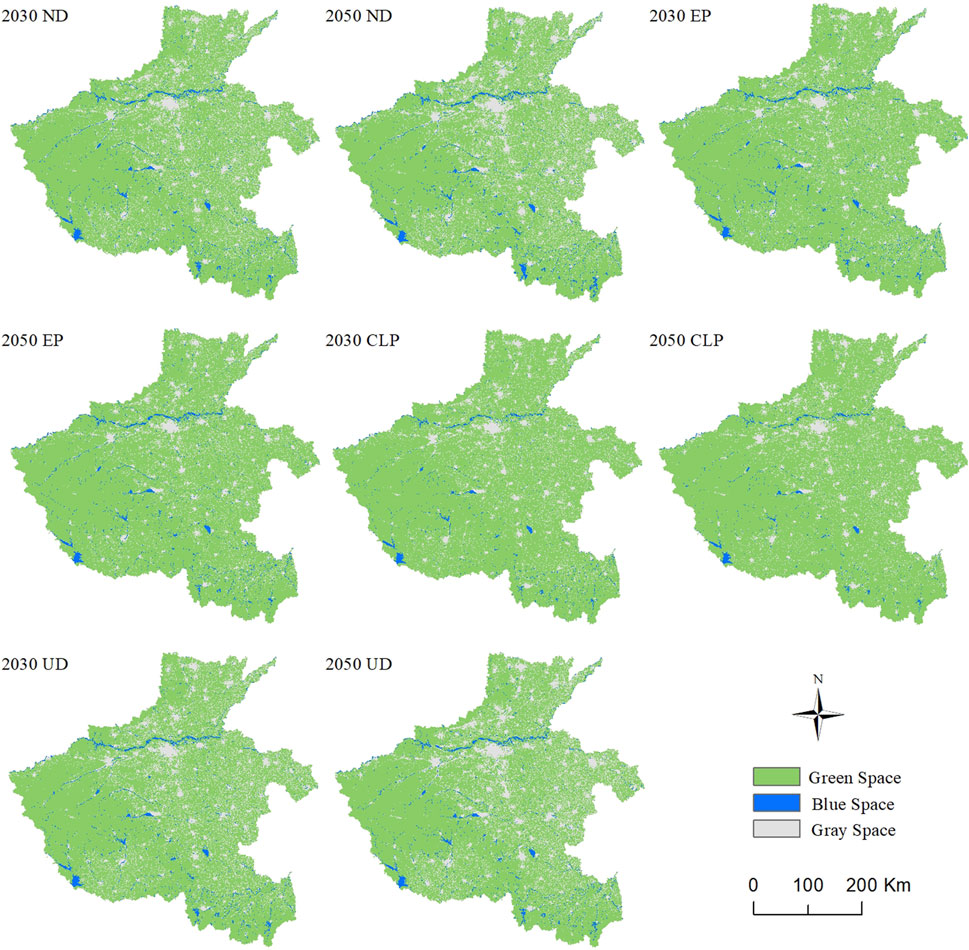
Figure 7. Distribution of blue-green-grey-space use in Henan Province from 2030 to 2050.
Table 6 shows the blue–green–grey-space carbon stocks for Henan Province under the ND, EP, CLP and UD scenarios between 2030 and 2050. Under the ND scenario, the blue–green–grey carbon storage in Henan Province increases by 42.24 × 10⁶ Mg within the 20-year period, with the green-space carbon storage increasing by 70.68 × 10⁶ Mg. However, the carbon storage in 2050 under this scenario is still lower by 1.34% than in 2020. Although the blue- and grey-space carbon storage both increase between 2020 and 2030, the green-space carbon storage considerably declines, resulting in a total decrease of 38.40 × 106 Mg by 2050. Under the EP scenario, the blue–green–grey carbon stock increases by 7.97 × 10⁶ Mg in 2020–2050, with green-space carbon storage increasing by 42.26 × 10⁶ Mg, grey-space carbon storage decreasing by 34.46 × 10⁶ Mg and blue-space carbon stock exhibiting considerable changes. Under the CLP scenario, carbon storage in green space increases, whereas carbon storage in blue and grey spaces considerably decreases. The total carbon stock reaches 1,641.39 × 106 Mg, the green-space carbon stock reaches 1,512.79 × 106 Mg. In 2020–2050, the total carbon storage increases by 15.09 × 10⁶ Mg, green-space carbon storage increases by 48.49 × 10⁶ Mg, blue-space carbon storage decreases by 32.37% (2.47 × 10⁶ Mg) and grey-space carbon storage decreases by 20.04% (30.93 × 10⁶ Mg). Under the UD scenario, the carbon stock values for blue, green and grey spaces in Henan considerably decline, particularly in 2030, with the total value of carbon storage becoming as low as 1,561.43 × 106 Mg. Under this scenario, by 2050, the total carbon storage decreases by 24.32 × 10⁶ Mg, with green-space carbon storage decreasing by 3.43% (50.26 × 10⁶ Mg) and grey-space carbon storage increasing by 16.42% (25.35 × 10⁶ Mg).
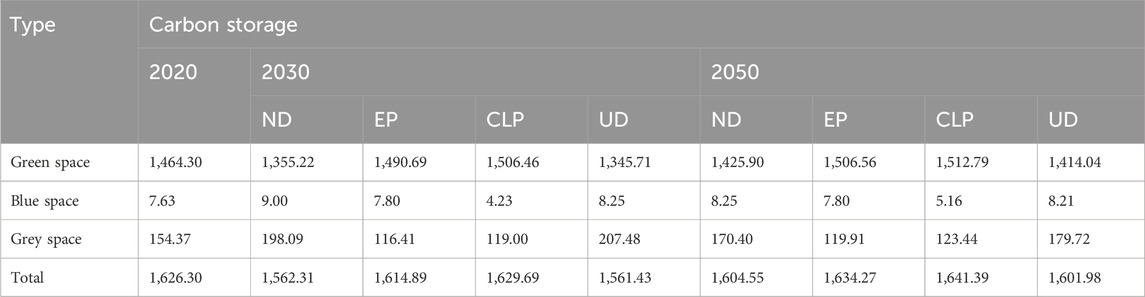
Table 6. Blue–green–grey-space carbon stocks in Henan Province under different scenarios (×106 Mg).
In 2020–2030, the ND and UD scenarios show similar trends in blue–green–grey carbon stocks in the province, with the green-space carbon stocks decreasing by 109.08 × 10⁶ and 118.59 × 10⁶ Mg, respectively. At the same time, blue- and grey-space carbon storages increase in this period. Under the ND scenario, blue-space carbon storage reaches 9.00 × 10⁶ Mg, which is higher than in the other scenarios. Under the ND and UD scenarios in 2020–2030, grey-space carbon storage increases by 28.11% (43.39 × 10⁶ Mg) and 34.40% (53.11 × 10⁶ Mg), respectively. The growth of grey-space carbon stock is the greatest under the UD scenario, with the value of carbon stock reaching 207.48 × 10⁶ Mg. Under the EP scenario, the grey-space carbon stocks are the lowest (116.41 × 10⁶ Mg), exhibiting an overall reduction of 24.59% (37.96 × 10⁶ Mg). Under the CLP scenario, green- and blue-space carbon stocks are the highest, reaching 1,506.46 × 106 and 4.23 × 10⁶ Mg in 2030, respectively. Under this scenario, the green-space carbon storage increases by 2.88% (42.16 × 10⁶ Mg) and blue-space carbon storage decreases by 44.56% (3.40 × 10⁶ Mg) in 2020–2030.
In 2030–2050, the trends in blue–green–grey carbon storage remain consistent with those in 2020–2030, with the values of carbon storage reduced by 21.75 × 10⁶ Mg (34.40 × 10⁶ Mg in the green space) and 24.32 × 10⁶ Mg (50.26 × 10⁶ Mg in the green space), respectively, compared with those in 2020. Under the EP and CLP scenarios, variations in carbon stocks are similar, with the total carbon stock increasing by 7.97 × 10⁶ and 15.09 × 10⁶ Mg, respectively. Moreover, the decrease in carbon stock in grey space is more considerable under the EP scenario (34.46 × 10⁶ Mg). Although the changes in total carbon storage are similar under these two scenarios, the blue-space carbon storage increases by 0.17 × 10⁶ Mg under the EP scenario and decreases by 2.47 × 10⁶ Mg in the CLP scenario. Overall, under the ND and UD scenarios, the total carbon stock decreases, whereas under the EP and CLP scenarios, carbon stock increases. In 2020–2050, carbon stock mostly decreases, with the UD scenario exhibiting a stronger decline than the ND scenario.
The alterations in the spatial distribution of blue–green–grey-space carbon stocks in Henan Province between 2030 and 2050 for the four scenarios are shown in Figure 8. The spatial distributions of the blue, green and grey carbon stocks are generally consistent between 2030 and 2050. However, regions with high carbon stocks are primarily centralised in high-elevation mountainous regions, low value areas show little variation except for the blue space, are mainly distributed in high-urbanisation and low-elevation regions and expand outwards from Zhengzhou as the centre point. As the capital city of Henan Province, Zhengzhou has vigorously developed transportation such as aviation ports in recent years, leading to the fragmentation of arable land and forest land, weakening the continuity of carbon sinks, and reducing carbon storage. The spatial distribution of blue–green–grey-space carbon stocks in Henan Province under the ND and UD scenarios in 2030 and 2050 is similar. Under the EP and CLP scenarios, variations in the distribution of carbon stocks in the blue–green–grey space in the study area are also similar. Additionally, changes in grey space under the ND and UD scenarios are considerably greater than those under the EP and CLP scenarios.
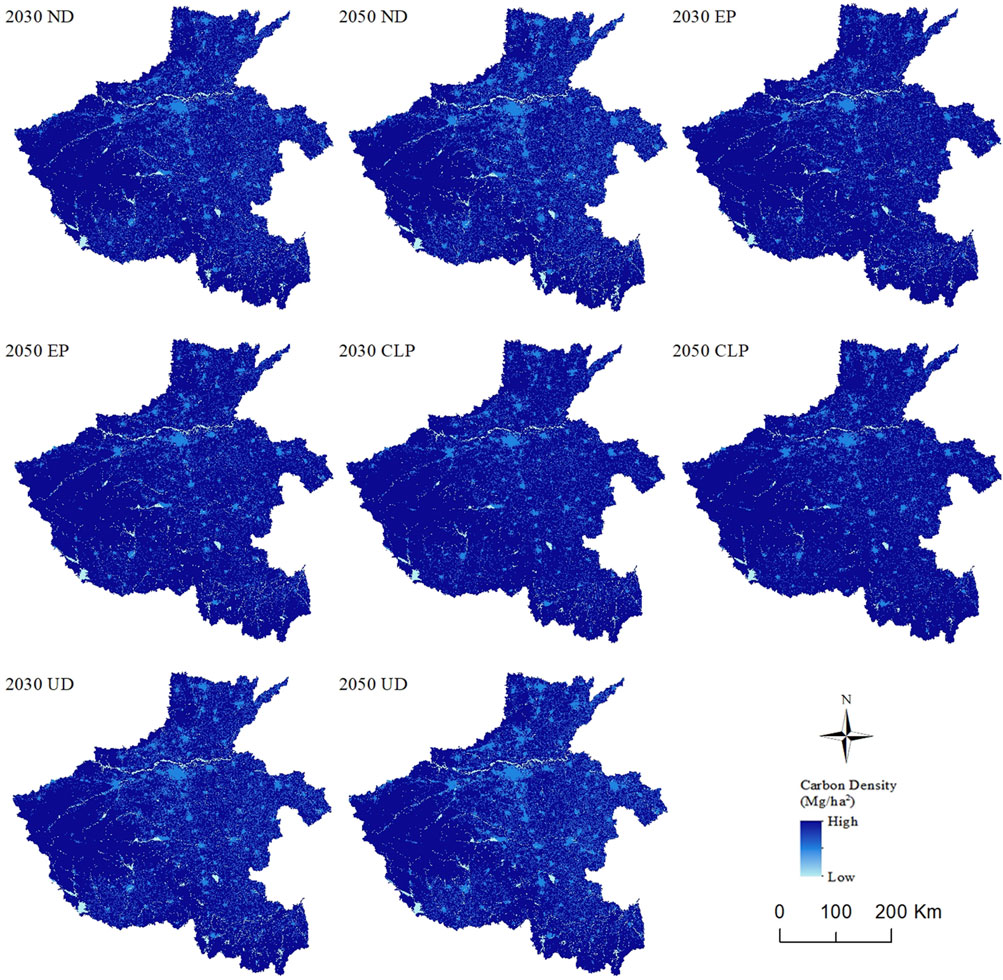
Figure 8. Spatial distribution of carbon storage for Henan Province from 2030 to 2050.
In 2030–2050, spatial variations in carbon stocks considerably differ across the four scenarios, as shown in Figure 9. Common to the four scenarios, the significant reduction in carbon storage will mainly be concentrated in high-altitude western mountainous areas such as Nanyang and Luoyang. Under the ND and UD scenarios, this apparent decrease in carbon stock shows a dense point-like distribution in the province, except for the concentration in areas such as Nanyang and Luoyang. Under the ND, EP and UD scenarios, a small number of considerable changes are observed in Xinyang and Kaifeng areas. In comparison with the other scenarios, the number of areas with considerably reduced carbon stocks in Henan Province under the EP scenario substantially decreased. Under the CLP scenario, regions with high carbon stocks considerably expand, particularly in the high-elevation southern and western areas such as Xinyang, Nanyang and Luoyang. Under the UD scenario, the quantity of areas with low carbon stocks considerably increases, mainly in low-elevation areas such as eastern and central Henan Province.

Figure 9. Spatial change in carbon storage for Henan Province from 2030 to 2050.
Henan Province is dominated by green space, and the concentration of green space in high-altitude areas such as the western part of Henan Province is particularly high. The total carbon storage distribution of Henan Province presents a regional pattern of ‘high in the west and low in the east’. The blue–green–grey spatial distribution pattern of the province is consistent with its carbon-storage distribution pattern; moreover, Chang et al. (2022) has confirmed that the regional carbon storage distribution pattern of this region is strongly influenced by land use. The blue–green–grey spatial distribution in Henan Province considerably changed from 2000 to 2020. The carbon-storage capacity is poor primarily in densely populated urban grey spaces. The construction of the Central Plains Urban Agglomeration, Central Plains Economic Zone and Zhengzhou Airport Economic Comprehensive Experimental Zone has driven substantial land use/cover changes in Henan Province, accelerating the transformation of green and grey spaces. The areas with considerable carbon storage reductions in Henan Province are mainly concentrated in cities and towns and other areas with high population density. The results of a study conducted by Fan et al. (2023) also indicate significant carbon loss around urban centres, such as Zhengzhou, in Henan Province.
Under the ND scenario, the trend of land transfer in Henan Province will remain for a long time, and the carbon storage in Henan Province will show an increasing trend from 2030 to 2050 (an increase of 42.24 × 10⁶ Mg). However, overall carbon storage will decline from 2020 to 2050. Our findings differ from those of Fan et al. (2023), possibly owing to the refinement of land-use carbon density in this study and differences in model simulation parameters. As urbanisation advances, grey space continues to expand while green space is compressed, leading to a decline in carbon storage. It is widely recognised that one factor contributing to this decline in regional carbon stocks is the increase in the area of land with weak carbon sequestration capacity (e.g., construction land) (Wang et al., 2021b). The results obtained in this study are consistent with these considerations, in which the increase in grey space with construction land as the main component leads to a decrease in the carbon storage value of Henan Province.
The aforementioned conclusions reported by Zheng and Zheng (2023) are consistent with the conclusions of this study that the water area shrinks and the carbon sequestration loss rate decreases. Under the EP scenario, the water area shrank by 0.44% in 2050 compared with the ND scenario; moreover, carbon stocks will increase by 7.97 × 10⁶ Mg in 2050 compared with those in 2020. The expansion of green space will leap forward, while the expansion of construction land, which is a major component of grey space, will be considerably limited. Moreover, the possibility of grey spaces being transformed into other space types will increase. This further confirms that an increase in the proportion of LUCC types with high carbon storage capacity under the EP scenario reported by Li et al. (2024) will directly lead to an increase in total carbon stocks.
Woodlands generally have a higher carbon sequestration capacity than arable land and store more carbon in areas with greater elevations and steeper slopes (Liu X. L. et al., 2023). In Henan Province, forests are mainly distributed in mountainous areas with high altitudes. However, future scenario simulations indicate that carbon storage under the CLP scenario surpasses that under the EP scenario. Under the CLP scenario, green space carbon storage reaches a maximum value of 1,515.70 × 106 Mg in 2050, reflecting an overall increase of 48.49 × 10⁶ Mg. This may be owing to the dominance of cultivated land, accounting for 47.5% of Henan’s total area. Under cultivated land protection policies, the carbon storage of green space with paddy fields and dry land as the main components has expanded sharply, leading to decreased carbon storage under the EP scenario than under the CLP scenario. This further indicates that Henan is a province with rapid agricultural development and a strong ecosystem carbon sequestration capacity (Zhu et al., 2020).
The expansion of construction land is closely linked to the social economy; the high rate of the encroachment of construction land in Shandong Province, where arable land is the dominant land type, has led to carbon consumption (Zheng and Zheng, 2023). A similar phenomenon is observed in this study. Under the UD scenario, the loss of carbon stocks in Henan Province will be higher than in other scenarios, reaching a peak, and the loss of carbon stocks is expected to decrease by 24.32 × 10⁶ Mg between 2030 and 2050. The unprecedented expansion of grey space has severely encroached on green space, which is a major contributor to carbon storage. In particular, greenfield carbon stocks decreased by 50.26 × 10⁶ Mg. Advances in urbanisation have led to drastic changes in the land, reducing the carbon sequestration capacity of ecosystems while increasing carbon emissions. This further validates that areas with high urbanisation rates will lead to the loss of regional carbon stocks (Xiang et al., 2022).
Henan Province, as a major agricultural region in China, has arable land that covers 47.5% of its area. This vast agricultural land has both socio-economic and natural attributes and serves as a crucial carbon pool. With increasing ecological awareness in China, the encroachment of grey space into green space has gradually decreased. Studying green space carbon storage can help establish a comprehensive and standardised development model, providing practical guidance for similar regions in China. For example, Shandong Province, another major agricultural region, shares a similar development pattern to that of Henan. In Shandong Province, cultivated land is the dominant land type and an important carbon sink. However, the large-scale encroachment of construction land on farmland and urbanisation has reduced regional ecological carbon storage services and led to carbon consumption (Zheng and Zheng, 2023).
Henan Provincial Land and Space Plan (2021–2035) proposes that the urbanisation rate should reach 72% by 2035, and the discrepancy between the supply and demand for construction land, basic farmland and ecological land will be considerably prominent by that time. The occupation of arable land, the massive shrinkage of blue–green space and the severe fragmentation of habitats have seriously affected food production and ecological security. Currently, the EP of blue and green space and the maintenance of ecological security are under increasing pressure. Thus, the development of a scientific and reasonable blue–green ecological spatial distribution pattern as well as the formulation of an active response strategy to the spatial demands of the economy, society, environment and other parties have become urgent problems in territorial planning. The vast population and low levels of urbanisation in Henan will likely continue to drive the transfer of land types in the future. To address this issue, Henan Province’s future LUCC growth and utilisation activities need to optimise the allocation of land resources and promote a harmonised growth of urbanisation, food security and ecological protection. Based on the above forecasts and the actual trends in the development of Henan Province, we suggest the following measures.
(1) Co-ordination of urban development boundaries, continuous optimisation of the spatial pattern of urbanisation, optimisation of the internal spatial structure of cities, transformation of urban development activities from external expansion to internal upgrading and establishment of an intensive and compact urbanisation pattern. The disorderly expansion of grey space should be controlled, and urban green space should be flexibly expanded to minimise carbon emissions and reduce the loss of carbon stocks
(2) Ensure the basic quantity of cultivated land, strictly protect permanent basic farmlands and delineate the cultivated-land red line at a specific location for the plots. Similarly, cropland, as the mainstay of carbon sequestration, needs to be highlighted in the future for green development of agriculture, improving the carbon sink capacity of farmland and reducing carbon emissions from agricultural production. Furthermore, a viable farmland management system can be created to improve agricultural practices, such as increasing the rate of crop residue returning, soil organic carbon density, natural fertility of the soil by increasing the input of belowground biomass and amount of fertiliser input to tillage to increase soil carbon content, ultimately improving the carbon sequestration capacity of farmlands.
(3) Strictly adhere to the demarcated red lines for EP. Carbon-emission reduction could be chosen as a strategic focus direction, with particular goals of increasing the capacity of land to sequester carbon, increasing regional carbon storage, promoting synergies between pollution reduction and carbon reduction and realising qualitative-to-quantitative improvements in the ecology of the environment. Protection and restoration measures of ecological barrier areas should be implemented, emphasising the conversion of farmland to forestlands, restoration of degraded forestland areas and improvement of the stability of ecosystems.
We analysed the land use changes in last 2 decades, simulated the LUCC patterns in all scenarios between 2030 and 2050 utilising the PLUS model and used the InVEST model to evaluate the blue–green–grey-space carbon stocks in Henan Province. The main conclusions are as follows.
(1) The changes in the blue–green–grey-space distribution in Henan Province in the last 2 decades were regular, which were mainly reflected in the overall decrease in the proportion of green space and an increase in the proportion of blue and grey spaces. During this period, the province’s carbon stock declined by 39.75 × 10⁶ Mg. In the spatial distribution of carbon stocks at the provincial level, a differential regional pattern of ‘high in the west and low in the east’ was observed. The high-carbon-stock regions were primarily concentrated in high-altitude areas (western and southern), while the low-carbon-stock regions were mainly distributed in the central part of the province with flatter terrain. Cities in this part of the province, such as Zhengzhou, have been rapidly developing in recent years, leading to considerable grey-space expansion and large carbon-stock losses.
(2) Grey-space expansion is greatly limited in the EP scenario, with a 33.15% reduction in area. In the CLP scenario, paddy fields and drylands are effectively protected, resulting in a considerable expansion of green space in Henan Province, with the green-space area reaching a maximum value. In particular, it is estimated that between 2020 and 2050, the area of green space may increase by 8.9 × 10⁵ hm2. The trends of carbon stock changes in Henan Province under the ND and UD scenarios display a high similarity: a decreasing trend caused by rapid economic development and increased economic activity. Under the EP and CLP scenarios, changes in carbon storage in Henan Province are also similar. In particular, green space with strong carbon sequestration capacity is protected, and carbon storage gradually increases, although it is still lower than at the early stage of this research. Therefore, to achieve the dual-carbon goal on time, Henan Province should maintain the area of cultivated land, efficiently perform the carbon sink function of farmland and woodland, improve the efficiency of land use, ensure intensive and efficient urbanisation and limit the encroachment of grey space into green space.
The original contributions presented in the study are included in the article/supplementary material, further inquiries can be directed to the corresponding author.
KZ: Funding acquisition, Project administration, Writing–review and editing. XW: Writing–review and editing. YW: Methodology, Writing–original draft. JW: Methodology, Writing–original draft. ZW: Data curation, Resources, Writing–original draft. YZ: Writing–review and editing.
The author(s) declare that financial support was received for the research, authorship, and/or publication of this article. This work was financially supported by the Scientific and Technological Project of Henan Province, China (Grant No. 232102320022), the Humanities and Social Sciences Research Project of the Education Department of Henan Province, China (Grant No. 2023-ZDJH-181) and the Soft Science Research Project of Xinxiang City, Henan Province, China (Grant No. RKX2021015).
The authors declare that the research was conducted in the absence of any commercial or financial relationships that could be construed as a potential conflict of interest.
The author(s) declare that no Generative AI was used in the creation of this manuscript.
All claims expressed in this article are solely those of the authors and do not necessarily represent those of their affiliated organizations, or those of the publisher, the editors and the reviewers. Any product that may be evaluated in this article, or claim that may be made by its manufacturer, is not guaranteed or endorsed by the publisher.
Alam, S. A., Starr, M., and Clark, B. J. (2013). Tree biomass and soil organic carbon densities across the Sudanese woodland savannah: a regional carbon sequestration study. J. Arid Environ. 89, 67–76. doi:10.1016/j.jaridenv.2012.10.002
Bellard, C., Marino, C., and Courchamp, F. (2022). Ranking threats to biodiversity and why it doesn´t matter. Nat. Commun. 13 (1), 1–4. doi:10.1038/s41467-022-30339-y
Chang, X. Q., Xing, Y. Q., Wang, J. Q., Yang, H., and Gong, W. S. (2022). Effects of land use and cover change (LUCC) on terrestrial carbon stocks in China between 2000 and 2018. Resour. Conservation Recycl. 182, 106333. doi:10.1016/j.resconrec.2022.106333
Chen, L., Msigwa, G., Yang, M. Y., Osman, A. L., Fawzy, S., Rooney, D. W., et al. (2022). Strategies to achieve a carbon neutral society: a review. Environ. Chem. Lett. 20 (4), 2277–2310. doi:10.1007/s10311-022-01435-8
Chuai, X. W., Huang, X. J., Zheng, Z. Q., Zhang, M., Liao, Q. L., Lai, L., et al. (2011). Land use change and its influence on carbon storage of terrestrial ecosystems in Jiangsu Province. Resour. Sci. 33 (10), 1932–1939. (in Chinese). CNKI:SUN:ZRZY.0.2011-10-016.
Du, S. L., Zhou, Z. F., Huang, D. H., Zhang, F. X. M., Deng, F. F., and Yang, Y. (2023). The response of carbon stocks to land use/cover change and a vulnerability multi-scenario analysis of the karst region in southern China based on PLUS-InVEST. Forests 14 (12), 2307. doi:10.3390/f14122307
Fan, L. Y., Cai, T. Y., Wen, Q., Han, J., Wang, S. X., Wang, J. H., et al. (2023). Scenario simulation of land use change and carbon storage response in Henan Province, China: 1990-2050. Ecol. Indic. 154, 110660. doi:10.1016/j.ecolind.2023.110660
Fang, K., Tang, Y. Q., Zhang, Q. F., Song, J. N., Wen, Q., Sun, H. P., et al. (2019). Will China peak its energy-related carbon emissions by 2030? Lessons from 30 Chinese provinces. Appl. Energy 255, 113852. doi:10.1016/j.apenergy.2019.113852
Giardina, C. P., and Ryan, M. G. (2000). Evidence that decomposition rates of organic carbon in mineral soil do not vary with temperature. Nature 404 (6780), 858–861. doi:10.1038/35009076
Gong, W. F., Duan, X. Y., Sun, Y. X., Zhang, Y. Y., Ji, P. Y., Tong, X. Y., et al. (2023). Multi-scenario simulation of land use/cover change and carbon storage assessment in Hainan coastal zone from perspective of free trade port construction. J. Clean. Prod. 385, 135630. doi:10.1016/j.jclepro.2022.135630
Han, D. L., Huang, J. P., Ding, L., Liu, X. Y., Li, C. U., and Yang, F. (2021). Oxygen footprint: an indicator of the anthropogenic ecosystem changes. Catena 206, 105501. doi:10.1016/j.catena.2021.105501
He, T., and Sun, Y. J. (2016). Dynamic monitoring of forest carbon stocks based on InVEST model. J. Zhejiang A and F Univ. 33 (03), 377–383. (in Chinese). doi:10.11833/j.issn.2095-0756.2016.03.002
He, Y. L., Ma, J. M., Zhang, C. S., and Yang, H. (2023). Spatio-temporal evolution and prediction of carbon storage in Guilin based on FLUS and InVEST models. Remote Sens. 15 (5), 1445. doi:10.3390/rs15051445
Lei, X. L., Liu, H. H., Li, S. D., Luo, Q. Q., Cheng, S. Z., Hu, G. Y., et al. (2024). Coupling coordination analysis of urbanization and ecological environment in Chengdu-Chongqing urban agglomeration. Ecol. Indic. 161, 111969. doi:10.1016/j.ecolind.2024.111969
Li, G. D., Fang, C. L., Li, Y. J., Wang, Z. B., Sun, S., He, S. W., et al. (2022). Global impacts of future urban expansion on terrestrial vertebrate diversity. Nat. Commun. 13 (1), 1628. doi:10.1038/s41467-022-29324-2
Li, J. P. (2021). Research on land use change and ecosystem carbon stock based on InVEST model. Baoding, China: Hebei Agricultural University. (in Chinese).
Li, L., Ji, G. X., Li, Q. S., Zhang, J. C., Gao, H. S., Jia, M. Y., et al. (2023c). Spatiotemporal evolution and prediction of ecosystem carbon storage in the yiluo River Basin based on the PLUS-InVEST model. Forests 14 (12), 2442. doi:10.3390/f14122442
Li, M., Zhang, J. C., Gao, H. S., Ji, G. X., Li, G. M., Li, L., et al. (2024). Spatiotemporal variation characteristics of ecosystem carbon storage in henan province and future multi-scenario simulation prediction. Land 13 (2), 185. doi:10.3390/land13020185
Li, P. C., Chen, J. D., Li, Y. X., and Wu, W. (2023b). Using the InVEST-PLUS model to predict and analyze the pattern of ecosystem carbon storage in Liaoning Province, China. Remote Sens. 15 (16), 4050. doi:10.3390/rs15164050
Li, Q., Pu, Y., Pu, Y. C., and Gao, W. (2023a). Spatial correlation analysis and prediction of carbon stock of “Production-living-ecological spaces” in the three northeastern provinces, China. Heliyon 9 (8), e18923. doi:10.1016/j.heliyon.2023.e18923
Liang, X., Guan, Q. F., Clarke, K. C., Liu, S. S., Wang, B. Y., and Yao, Y. (2021). Understanding the drivers of sustainable land expansion using a patch-generating land use simulation (PLUS) model: a case study in Wuhan, China. Comput. Environ. Urban Syst. 85, 101569. doi:10.1016/j.compenvurbsys.2020.101569
Litton, C. M., Raich, J. W., and Ryan, M. G. (2007). Carbon allocation in forest ecosystems. Glob. Change Biol. 13 (10), 2089–2109. doi:10.1111/j.1365-2486.2007.01420.x
Liu, J. Y., Yan, Q. Q., and Zhang, M. H. (2023). Ecosystem carbon storage considering combined environmental and land-use changes in the future and pathways to carbon neutrality in developed regions. Sci. Total Environ. 903, 166204. doi:10.1016/j.scitotenv.2023.166204
Liu, X. L., Ho, M. S., Hewings, G. J., Dou, Y. X., Wang, S. Y., Wang, G. Z., et al. (2023). Aging population, balanced diet and China’s grain demand. Nutrients 15 (13), 2877. doi:10.3390/nu15132877
Raich, J. W., and Nadelhoffer, K. J. (1989). Belowground carbon allocation in forest ecosystems: global trends. Ecology 70 (5), 1346–1354. doi:10.2307/1938194
Robinson, D. T., Zhang, J. X., MacDonald, D., and Samson, C. (2023). Estimating Settlement carbon stock and density using an inventory approach and quantifying their variation by land use and parcel size. Urban For. and Urban Green. 82, 127878. doi:10.1016/j.ufug.2023.127878
Shi, C. F., Zhi, J. Q., Xiao, Y., Zhang, H., Yu, Y., Zeng, Q. F., et al. (2023). How can China achieve the 2030 carbon peak goal-a crossover analysis based on low-carbon economics and deep learning. Energy 269, 126776. doi:10.1016/j.energy.2023.126776
Stankovic, M., Ambo-Rappe, R., Carly, F., Dangan-Galon, F., Fortes, M. D., Hossain, M. S., et al. (2021). Quantification of blue carbon in seagrass ecosystems of Southeast Asia and their potential for climate change mitigation. Sci. Total Environ. 783, 146858. doi:10.1016/j.scitotenv.2021.146858
Suligowski, R., Ciupa, T., and Cudny, W. (2021). Quantity assessment of urban green, blue, and grey spaces in Poland. Urban For. and Urban Green. 64, 127276. doi:10.1016/j.ufug.2021.127276
Sun, X. X., Xue, J. H., and Dong, L. N. (2023). Spatiotemporal change and prediction of carbon storage in Nanjing ecosystem based on PLUS model and InVEST model. J. Ecol. Rural Environ. 39 (1), 41–51. doi:10.19741/j.issn.1673-4831.2022.0953
Thompson, T. M. (2018). Modeling the climate and carbon systems to estimate the social cost of carbon. Wiley Interdiscip. Rev. Clim. Change 9 (5), e532. doi:10.1002/wcc.532
Wang, C., Zhan, J. Y., Zhang, F., Liu, W., and Twumasi-Ankrah, M. J. (2021b). Analysis of urban carbon balance based on land use dynamics in the Beijing-Tianjin-Hebei region, China. J. Clean. Prod. 281, 125138. doi:10.1016/j.jclepro.2020.125138
Wang, H. Y., Wu, L. S., Yue, Y. S., Jin, Y. Y., and Zhang, B. B. (2024). Impacts of climate and land use change on terrestrial carbon storage: a multi-scenario case study in the Yellow River Basin (1992–2050). Sci. Total Environ. 930, 172557. doi:10.1016/j.scitotenv.2024.172557
Wang, X. G., Yan, F. Q., Zeng, Y. W., Chen, M., He, B., Kang, L., et al. (2021a). Ecosystem services changes on farmland in response to urbanization in the Guangdong–Hong Kong–Macao Greater Bay Area of China. Land 10 (5), 501. doi:10.3390/land10050501
Wang, Y. F., Liu, L., and Shangguan, Z. P. (2017). Carbon storage and carbon sequestration potential under the grain for green program in henan province, China. Ecol. Eng. 100, 147–156. doi:10.1016/j.ecoleng.2016.12.010
Wang, Y. F., Liu, L., and Shangguan, Z. P. (2018). Dynamics of forest biomass carbon stocks from 1949 to 2008 in Henan Province, east-central China. J. For. Res. 29 (2), 439–448. doi:10.1007/s11676-017-0459-7
Wang, Z., Li, X., Mao, Y. T., Li, L., Wang, X. R., and Lin, Q. (2022). Dynamic simulation of land use change and assessment of carbon storage based on climate change scenarios at the city level: a case study of Bortala, China. Ecol. Indic. 134, 108499. doi:10.1016/j.ecolind.2021.108499
Wu, F., and Wang, Z. Y. (2023b). Assessing the impact of urban land expansion on ecosystem carbon storage: a case study of the Changzhutan metropolitan area, China. Ecol. Indic. 154, 110688. doi:10.1016/j.ecolind.2023.110688
Wu, N., Chen, N., Cheng, P., and Song, T. (2023a). Evaluaion of carbon storage on terrestrial ecosystem responses to land cover change under five future scenarios in Anhui Province. Resour. Environ. Yangtze Basin 32 (02), 415–426. (in Chinese). doi:10.11870/cjlyzyyhj202302017
Xiang, S. J., Wang, Y., Deng, H., Yang, C. M., Wang, Z. F., and Gao, M. (2022). Response and multi-scenario prediction of carbon storage to land use/cover change in the main urban area of Chongqing, China. Ecol. Indic. 142, 109205. doi:10.1016/j.ecolind.2022.109205
Xu, C. L., Zhang, Q. B., Yu, Q., Wang, J. P., Wang, F., Qiu, S., et al. (2023). Effects of land use/cover change on carbon storage between 2000 and 2040 in the Yellow River Basin, China. Ecol. Indic. 151, 110345. doi:10.1016/j.ecolind.2023.110345
Xue, Z. B. (2017). Functional assessment of ecosystem services in the Yanhe River Basin based on the InVEST model. Xi’an, China: Northwest University. (in Chinese). CNKI:CDMD:2.1017.117257.
Yang, Y. H., Shi, Y., Sun, W. J., Chang, J. F., Zhu, J. X., Chen, L. Y., et al. (2022). Terrestrial carbon sinks in China and around the world and their contribution to carbon neutrality. Sci. China Life Sci. 65 (5), 861–895. doi:10.1360/SSV-2021-0362
Yue, S. J., Ji, G. X., Chen, W. Q., Huang, J. C., Guo, Y. L., and Cheng, M. Y. (2023). Spatial and temporal variability characteristics of future carbon stocks in anhui province under different SSP scenarios based on PLUS and InVEST models. Land 12 (9), 1668. doi:10.3390/land12091668
Zhang, Y. H., Hu, Z. Q., Han, J. Z., Liu, X. Z., Feng, Z. J., and Zhang, X. (2023). Spatiotemporal relationship between ecological restoration space and ecosystem services in the Yellow River Basin, China. Land 12 (4), 730. doi:10.3390/land12040730
Zhao, J. J., Chen, S. B., Jiang, B., Ren, Y., Wang, H., Vause, J., et al. (2013). Temporal trend of green space coverage in China and its relationship with urbanization over the last two decades. Sci. Total Environ. 442, 455–465. doi:10.1016/j.scitotenv.2012.10.014
Zheng, H. L., and Zheng, H. F. (2023). Assessment and prediction of carbon storage based on land use/land cover dynamics in the coastal area of Shandong Province. Ecol. Indic. 153, 110474. doi:10.1016/j.ecolind.2023.110474
Zhu, L. Y., Song, R. X., Sun, S., Li, Y., and Hu, K. (2022). Land use/land cover change and its impact on ecosystem carbon storage in coastal areas of China from 1980 to 2050. Ecol. Indic. 142, 109178. doi:10.1016/j.ecolind.2022.109178
Zhu, W. B., Zhang, J. J., Cui, Y. P., and Zhu, L. Q. (2020). Ecosystem carbon storage under different scenarios of land use change in Qihe catchment, China. J. Geogr. Sci. 30 (9), 1507–1522. doi:10.1007/s11442-020-1796-6
Zou, L. L., Liu, Y. S., Wang, J. J., and Yang, Y. Y. (2021a). An analysis of land use conflict potentials based on ecological-production-living function in the southeast coastal area of China. Ecol. Indic. 122, 107297. doi:10.1016/j.ecolind.2020.107297
Keywords: blue-green-grey spaces, carbon storage, InVEST model, PLUS model, Henan
Citation: Zhou K, Wei X, Wang Y, Wang J, Wang Z and Zhang Y (2025) Spatiotemporal evolution and prediction of blue–green–grey-space carbon stocks in Henan Province, China. Front. Environ. Sci. 13:1545455. doi: 10.3389/fenvs.2025.1545455
Received: 15 December 2024; Accepted: 24 February 2025;
Published: 14 March 2025.
Edited by:
Nana Wu, North Carolina State University, United StatesReviewed by:
Ruochong Xu, Tsinghua University, ChinaCopyright © 2025 Zhou, Wei, Wang, Wang, Wang and Zhang. This is an open-access article distributed under the terms of the Creative Commons Attribution License (CC BY). The use, distribution or reproduction in other forums is permitted, provided the original author(s) and the copyright owner(s) are credited and that the original publication in this journal is cited, in accordance with accepted academic practice. No use, distribution or reproduction is permitted which does not comply with these terms.
*Correspondence: Kai Zhou, a3pob3U4OUBoaXN0LmVkdS5jbg==
Disclaimer: All claims expressed in this article are solely those of the authors and do not necessarily represent those of their affiliated organizations, or those of the publisher, the editors and the reviewers. Any product that may be evaluated in this article or claim that may be made by its manufacturer is not guaranteed or endorsed by the publisher.
Research integrity at Frontiers
Learn more about the work of our research integrity team to safeguard the quality of each article we publish.