 Zhijian Lin
 Hainan Liu
 Lei Shi
 Dongxu Cui2
94% of researchers rate our articles as excellent or good
Learn more about the work of our research integrity team to safeguard the quality of each article we publish.
Find out more
ORIGINAL RESEARCH article
Front. Environ. Sci., 26 March 2025
Sec. Environmental Economics and Management
Volume 13 - 2025 | https://doi.org/10.3389/fenvs.2025.1543211
This article is part of the Research TopicUrban Carbon Emissions and Anthropogenic ActivitiesView all 19 articles
The digital economy (DE) is an essential transmitter of CO2 within the economic system, significantly impacting carbon emissions and high-quality development. The Yellow River Basin (YRB) and the Yangtze River Economic Belt (YREB), China’s two most important economic regions, are critical strategically for achieving the dual carbon target. This paper uses panel data from the YRB and YREB in China from 2011 to 2021 and adopts fixed and mediating effects to explore the internal impact mechanisms and spatial heterogeneity of the DE and carbon emission intensity (CEI) in the context of new quality productivity (NQP). The research results indicate that (1) the DE can significantly reduce CEI. A 1% increase in the DE reduces CEI by 0.1536% in the YRB and 0.0643% in the YREB, respectively. (2) The DE can affect CEI in the YRB and the YREB through mechanisms such as the economic development level, industrial structure advancement and rationalization, energy structure, and level of technological progress, with industrial structure advancement having the highest impact. (3) The YRB has a lower level of DE development and a higher overall CEI than the YREB. (4) A 1% increase in the DE leads to regional CEI variations: in the upstream of the YRB and YREB, CEI decreases by 0.1424% and 0.1956%, respectively, whereas in the midstream of the YRB, it decreases by 0.1298%, and in the downstream of the YREB, it increases by 0.0707%. We propose accelerating the development of the DE and constructing a green and modernized industrial system to achieve carbon reduction and emission mitigation goals.
Excessive CO2 emissions profoundly affect climate change (Jiang et al., 2024), directly and indirectly influencing achieving the Sustainable Development Goals (Hermwille et al., 2023). China is the world’s largest economy and, thus, is crucial in mitigating global climate change (Liu L. et al., 2023; Yu et al., 2023). At the 75th session of the United Nations General Assembly in 2020, the Chinese government proposed ambitious targets to achieve peak carbon emissions by 2030 and carbon neutrality by 2060, demonstrating its commitment to addressing climate change (Li L. et al., 2022; Gao et al., 2017). China has proposed reducing carbon emissions through a dual drive of digital empowerment and green development under NQP framework to achieve sustainable development.
The DE is a significant transmitter of CO2 in the economic system (Wang et al., 2023). According to the “Global Digital Economy White Paper (2024)” released by the China Academy of Information and Communications Technology, the estimated added value of China’s core DE industries in 2023 exceeded 12 trillion yuan, accounting for approximately 10% of GDP. The DE’s rapid development has improved resource utilization efficiency and reduced pollution and carbon emissions. The prospects of this fast-growing sector for lowering carbon emissions are promising. Therefore, an in-depth study of the relationship between DE and carbon emissions is important theoretically for achieving the dual carbon goals. Current research on the impact of the DE on carbon emissions mainly focuses on four aspects: first, the analysis of how the DE affects carbon emissions, such as industrial structure (Lin and Zhou, 2021), technological progress (Yi et al., 2022), energy intensity (Zhang W. et al., 2022), and human capital (Wang et al., 2022b); second, the analysis of regional heterogeneity of this impact is often conducted at different scales, such as the provincial (Chen et al., 2023), the city (Cheng et al., 2023), and the county scales (Ma and Zhang, 2025); third, the impact of various aspects of DE development on carbon emissions involves perspectives of digital city construction (Yang et al., 2022), digital infrastructure development (Zhang et al., 2023), and digital taxation (Zeng and Yang, 2023); and fourth, the impact on different dimensions of carbon emissions, such as the effect of digital finance on carbon productivity (Sun et al., 2023) and the influence of digitalization and industrialization on total factor carbon emission performance (Ma R. et al., 2023). However, these studies typically employed singular and unsystematic indicators of the DE. Moreover, they focused on broad regions, lacking detailed investigations into specific areas and comparative analyses. The impact of the DE on carbon emissions requires further exploration, especially in the context of NQP. As China entered this higher-level form of productivity, there was an urgent need to break away from traditional economic development models and productivity paths, significantly enhancing total factor productivity and, thus, indirectly affecting carbon emissions. Therefore, in the era of NQP, it is important to explore the impact and improvement potential of traditional and NQP paths on carbon emissions under different structures according to the innovative forms of the volatile DE industry, to promote the high-quality green development of carbon emissions and the economy.
To further highlight the differences between the DE and carbon emissions under traditional and new-quality paths, this study compares the YRB and the YREB. The YRB is a crucial base for China’s energy, chemical, and basic industries, traditionally supported by agriculture, energy, and heavy industry. In recent years, it has gradually shifted toward manufacturing and high-tech industries. The YREB represents half of the country’s population and total economic output, with manufacturing, high-tech industries, and modern services serving as key pillars of the economy, possessing broad developmental depth. This research centers on single-region carbon emission evolution (Rong et al., 2023), carbon emission efficiency (Wang and Shao, 2024), CEI (Chen et al., 2022), and driving factors (Wang and Xue, 2023). Despite the research on the DE and carbon emissions in both the YRB and the YREB (Dong and Zhou, 2023; Xu and Ci, 2023), comparative research between these regions under traditional production modes and NQP is lacking. Especially in the context of NQP, developing DE in the YRB and the YREB will have different driving models owing to the regional heterogeneity of carbon emissions, leading to time lags and differences in mechanisms and spatial–temporal distributions. Therefore, studying the DE and carbon emissions in the YRB and the YREB in the context of NQP will help stakeholders and governments formulate differentiated regional development strategies, learning from one another, complementing one another’s strengths, and promoting the high-quality development of the basin economy.
Based on the above, we use panel data from 58 prefecture-level cities in the YRB and 104 in the YREB from 2011 to 2021. We analyze the impact of the DE on CEI in the YRB and YREB by employing fixed and mediating effects, focusing on the intrinsic mechanisms and spatial heterogeneity between the two regions with NQP as a key driving force. This study makes the following marginal contributions: (1) It innovatively constructed an index system of the DE comprising five key dimensions: element configuration, elemental support, innovative performance, digital industrialization, and industry digitalization. This comprehensive framework enabled a scientific measurement of the DE’s development, allowing policymakers and stakeholders to formulate precise development strategies, optimize resource allocation, and foster innovation-driven growth. (2) This study also compared the impact of the DE on CEI under NQP paradigm in the YRB and the YREB. This regional comparison provided valuable empirical insights and practical references for leveraging the DE to drive high-quality development. (3) By integrating Grossman’s theory and the Environmental Kuznets Curve (EKC) hypothesis, the study innovatively explored how the DE empowered NQP to influence carbon emissions. This introduced a novel theoretical framework for relevant research and offered concrete policy pathways to help China achieve its 2030 carbon peak and 2060 carbon neutrality goals. (4) The study revealed the differentiated effects of the DE on CEI under spatial heterogeneity across river basins. The study incorporated economic development, development models, and technological foundations, conducting a detailed assessment of the impact of the DE on carbon emissions across the upper, middle, and lower reaches of the YRB and the YREB. These findings support local governments in formulating region-specific strategies for the DE and carbon reduction policies.
The rest of this paper is organized as follows: Section 3 presents the theoretical framework and research hypotheses. Section 4 outlines the methodology, variables, and data sources. Section 5 presents the empirical results. Sections 6, 7 provide the comparative mechanism analysis and heterogeneity analysis. Finally, Section 8 concludes and provides policy implications. Section 9 discusses the study’s limitations and suggests future research. The technology roadmap is shown in Figure 1.
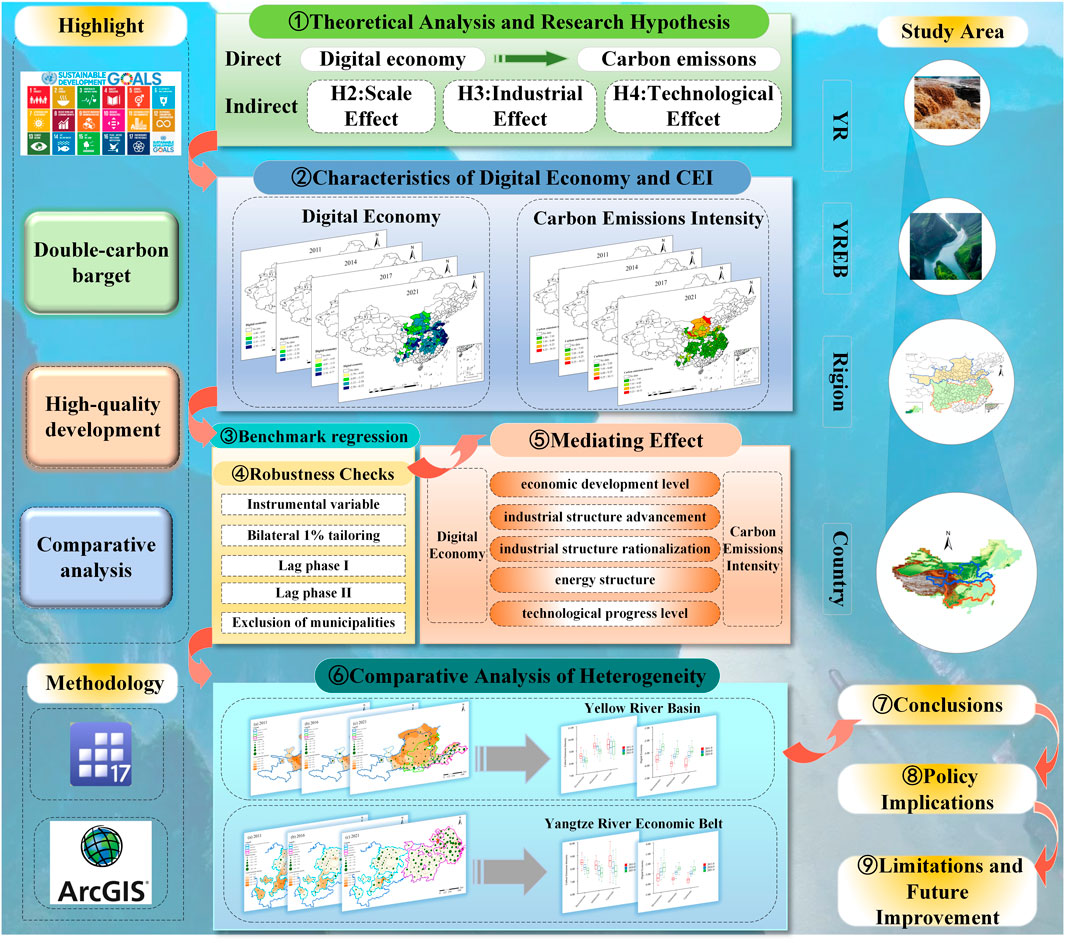
Figure 1. Technology roadmap.
The direct impact of the DE on carbon emissions manifested primarily in three ways. First, as a foundational element of the DE, digital infrastructure reduced the resource dependency of economic development, significantly lowering CEI (Zhang et al., 2023). Second, the DE broke through the regional barriers of data elements and digital technologies through spatial spillover effects. Enhancing resource mobility altered the geographical distribution of data elements, optimized resource allocation, positively influenced the energy-saving and emission-reduction efficiency of neighboring regions, and reduced CEI (Wu et al., 2021; Yi et al., 2022; Bai et al., 2023; Cheng et al., 2023). Third, developing digital technologies increases the input levels of data elements and the output levels of digital innovation, advancing the flow of innovative resources and the integration of industrial resources, enhancing economic operational efficiency and innovation capacity, reducing energy consumption, and decreasing carbon emissions (Zhang W. et al., 2022; Lin and Zhou, 2021). Based on these studies, we proposed Hypothesis 1.
Hypothesis 1. Developing DE positively contributes to decreasing carbon emissions.
NQP refers to the productivity of leading technological innovation and achieving critical disruptive technological breakthroughs. It comprises three key dimensions: the “new economy,” “new industrial forms” and “new technologies” (Zhou and Xu, 2023). As an inherently green type of productivity, it facilitates carbon reduction and emission mitigation. A significant driving force for developing NQP (Zhang and Wen, 2024), the DE directly influenced carbon reduction and sustainable development by transforming NQP and production relations. Grossman and Krueger (Grossman and Krueger, 1991) utilized the LMDI index to decompose the driving factors of carbon emissions into scale, structural, and technological effects, which logically correspond to the three dimensions of NQP, i.e., new economy, industrial forms, and technologies. By integrating Grossman’s theory with the theoretical framework of NQP, we innovatively propose a new theoretical pathway among the DE, NQP, and carbon emissions, as indicated in Figure 2.
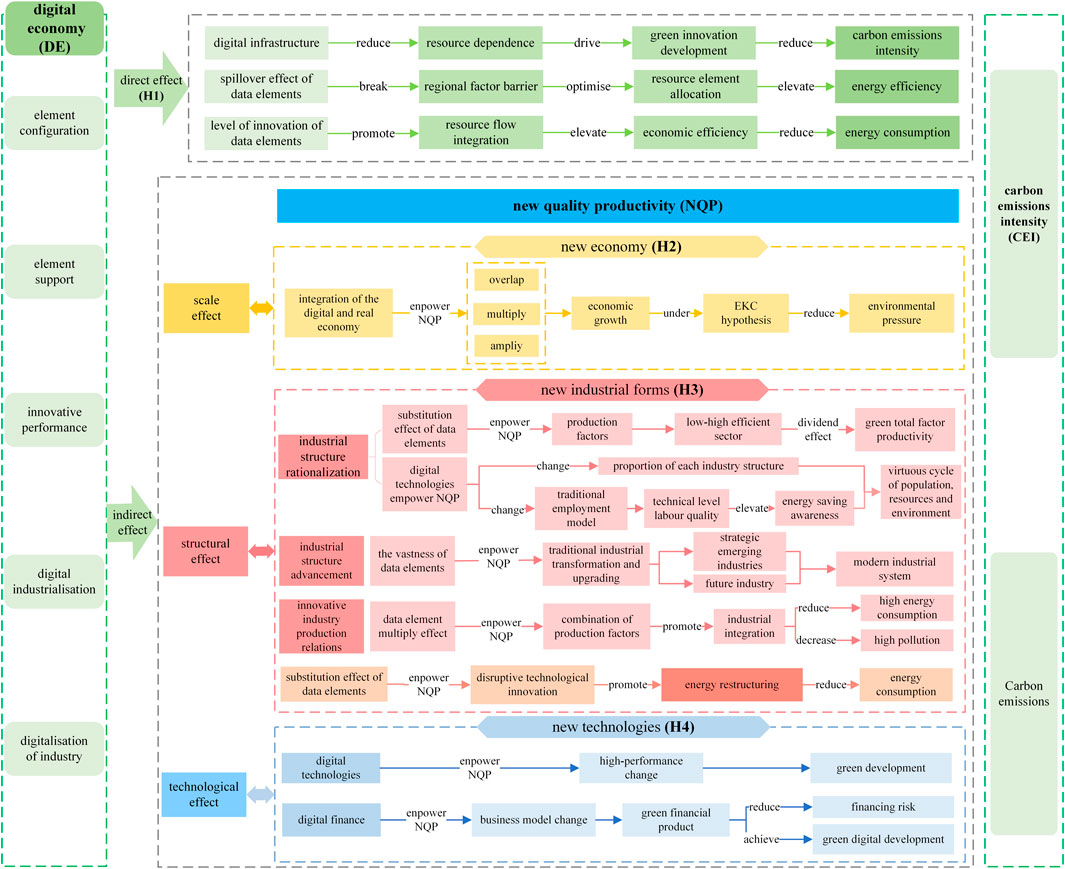
Figure 2. The mechanism between DE, NQP and CEI.
The EKC hypothesis posits an inverted U-shaped relationship between economic growth and environmental pressure, as shown in Figure 3. Environmental pressure increased with economic growth in the initial stages of economic development. However, once economic growth reached a certain level, policymakers and stakeholders recognized that excessive economic development was causing significant ecological damage. Consequently, there was a need to emphasize the dual benefits of environmental and economic sustainability. After implementing protective measures, environmental pressure decreased and the ecological environment improved (Grossman and Krueger, 1995; Yang et al., 2022; Chang et al., 2023).
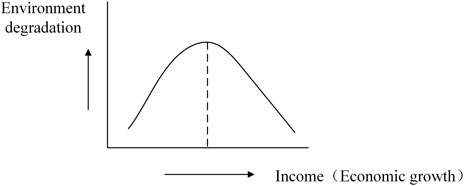
Figure 3. The Environmental Kuznets Curve (EKC) hypothesis.
The DE, driven by technological and institutional innovations, represents a new economic type integrated with the real economy. Through aspects such as digital infrastructure, industrial digitization, and digital industrialization, it empowered the development of NQP in the “new economy,” with amplifying, overlapping, and multiplicative effects on economic growth (Chang et al., 2023; Zhang and Wen, 2024). According to the EKC hypothesis, carbon emissions are anticipated to decline once the DE attains a certain level of development and the government begins to prioritize the dual benefits of environmental and economic sustainability. Based on these studies, we proposed Hypothesis 2.
Hypothesis 2. The DE empowers the “new economy” dimension of NQP, reducing carbon emissions through the scale effect.
Industry is a fundamental driver of NQP and a key dimension of “new industrial forms,” with structural shifts significantly impacting carbon emissions (Cheng et al., 2023). Within the framework of NQP, the DE influenced carbon emissions through the industrial structure in three main ways. First, the DE empowered NQP by rationalizing industrial structures. On the one hand, data elements exerted a substitution effect, shifting traditional production factors such as land and labor toward innovative configurations involving data and technology (Lu et al., 2024). This shift permitted effective production factors to flow from low-to high-efficiency sectors, leveraging the dividend effect of the DE to upgrade industrial structures, improving green total factor productivity (Lee et al., 2023). On the other hand, carbon emissions were reduced by expanding the economic scale of the tertiary industry and decreasing the proportion of coal consumption (Wang et al., 2022a). Additionally, as the DE transformed traditional industrial structures, employment models in traditional enterprises were also altered, imposing higher requirements on the workforce’s technical skills and professional qualities. The increase in high-tech personnel has increased energy-saving awareness (Edziah et al., 2021), influencing carbon emissions and achieving a virtuous cycle among the population, resources, and the environment. Second, the DE empowered NQP by advancing industrial upgrading. Leveraging its extensive factor coverage, the DE transformed traditional industries toward strategic emerging industries such as high-end equipment manufacturing and low-altitude economy industries. This transition contributed to establishing a modern industrial system, achieving new industrialization, and promoting carbon reduction. Third, the DE fostered the innovative upgrading of industrial production relations in NQP, transitioning industries from segregation to integration. The data elements’ multiplier effect advanced their integration with various production factors, fostering innovative upgrades in industrial production relations, reducing high energy consumption and pollution, and lowering CEI (Wang et al., 2022a; Wang et al., 2022c; Chang et al., 2023; Lan et al., 2023; Lee et al., 2023).
Meanwhile, energy served as a critical pillar for developing NQP and represented an essential dimension of transforming and upgrading “new industrial forms.” Its structural changes profoundly affected carbon emissions. The DE, by leveraging the substitution effect of data elements, empowered NQP, driving disruptive technological innovations that facilitated the transition of the energy structure toward low-carbon and cleaner alternatives. This transformation enhanced energy conservation and emission reduction efficiency (Wu et al., 2021; Zhang W. et al., 2022), effectively lowering CEI and contributing to developing a green industrial system. Based on these studies, we proposed Hypothesis 3.
Hypothesis 3. The DE empowers the “new industrial forms” of NQP, reducing carbon emissions through structural effects.
The rapid advancement of information technology reduced the costs of information transmission and processing (Moore, 1965; Brenner, 1997), contributing to the swift growth of the DE. “New technologies,” a critical dimension of NQP development, involved significant disruptive technological breakthroughs (Zhou and Xu, 2023). The DE, through digital technologies and data elements, empowered NQP to achieve these breakthroughs by enhancing the efficiency and quality of economic operations, optimizing the coordination between economic development and ecological protection, and influencing carbon emissions through three pathways. First, the DE boosted innovation momentum in NQP through digital technologies, achieved high-efficiency innovation transformations, reduced transaction costs for factors such as land and capital, improved transaction efficiency, and lowered energy consumption in economic operations, all of which advanced green, low-carbon development (Lin and Zhou, 2021). Second, the DE utilized the data substitution effect of data elements to empower NQP and drove disruptive technological innovations to improve traditional production methods, facilitated energy structure adjustments, reduced energy consumption, and lowered CEI (Huang, 2023; Zeng and Yang, 2023; Yu et al., 2024). Third, developing digital finance propelled NQP through disruptive technological innovations, spurred the market to create new production methods and business models, generated more green financial products, reduced investment and financing risks, and achieved green digital development, thus affecting carbon emissions (Liu Q. et al., 2023). Based on these findings, we proposed Hypothesis 4.
Hypothesis 4. The DE empowers NQP’s “new technologies,” reducing carbon emissions through technological effects.
The major cities within the YRB and the YREB are selected as the study area, as shown in Figure 4. Situated between longitudes 96°–119° E and latitudes 32°–42° N, the YRB covers approximately 795,000 km2, including 42,000 km2 of inland river areas. The YRB’s population constitutes nearly 30% of the national total, with economic development primarily concentrated in the middle and lower reaches—especially in Shandong and Henan provinces, which account for the majority share. The YREB encompasses about 2,052,000 km2, representing 21.4% of China’s total area. As of 2021, its population and regional GDP constitutes 42.9% and 46.4% of the national totals, respectively. Due to their unique geographical areas, populations, and economies, changes in carbon emissions within the YRB and the YREB profoundly affect the entire country. Moreover, under the pathway of NQP, these regions exert different impacts. The study area’s boundaries are delineated by the administrative divisions of prefecture-level cities. Additionally, based on geographical characteristics, the upper, middle, and lower reaches are distinguished to facilitate a comparative analysis of the DE and carbon emissions among the basins.
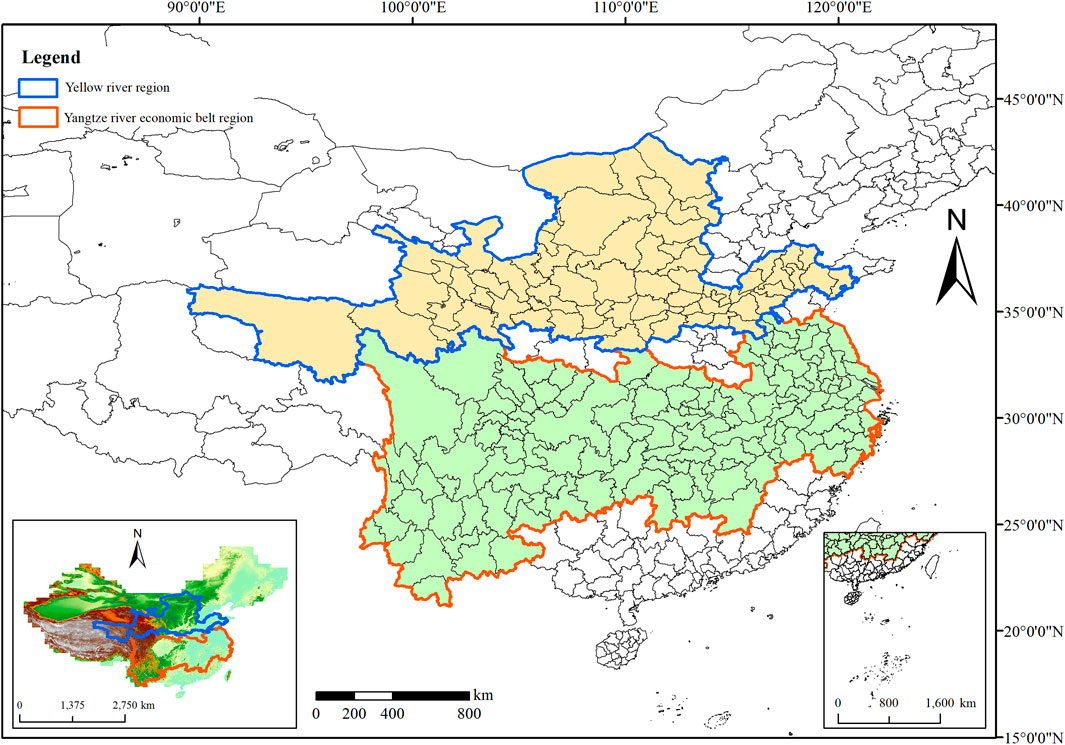
Figure 4. The geographical locations of the YRB and YREB within the study area.
The entropy method was utilized to reflect the utility value of the information entropy of indicators (Chen et al., 2023). We objectively evaluated the comprehensive DE indicator system, constructed using 18 subindicators and referencing previous studies (Lin and Zhou, 2021; Yang et al., 2022), by applying the entropy method for measuring the DE development levels of 58 prefecture-level cities in the YRB and 104 prefecture-level cities in the YREB from 2011 to 2021.
Initially, the data were standardized as follows:
where
Furthermore, the entropy value of the subindex was calculated as shown in Equation 3:
Where
Finally, the weights of the comprehensive DE indicator system were calculated by Equation 5 (as shown in Table 1):
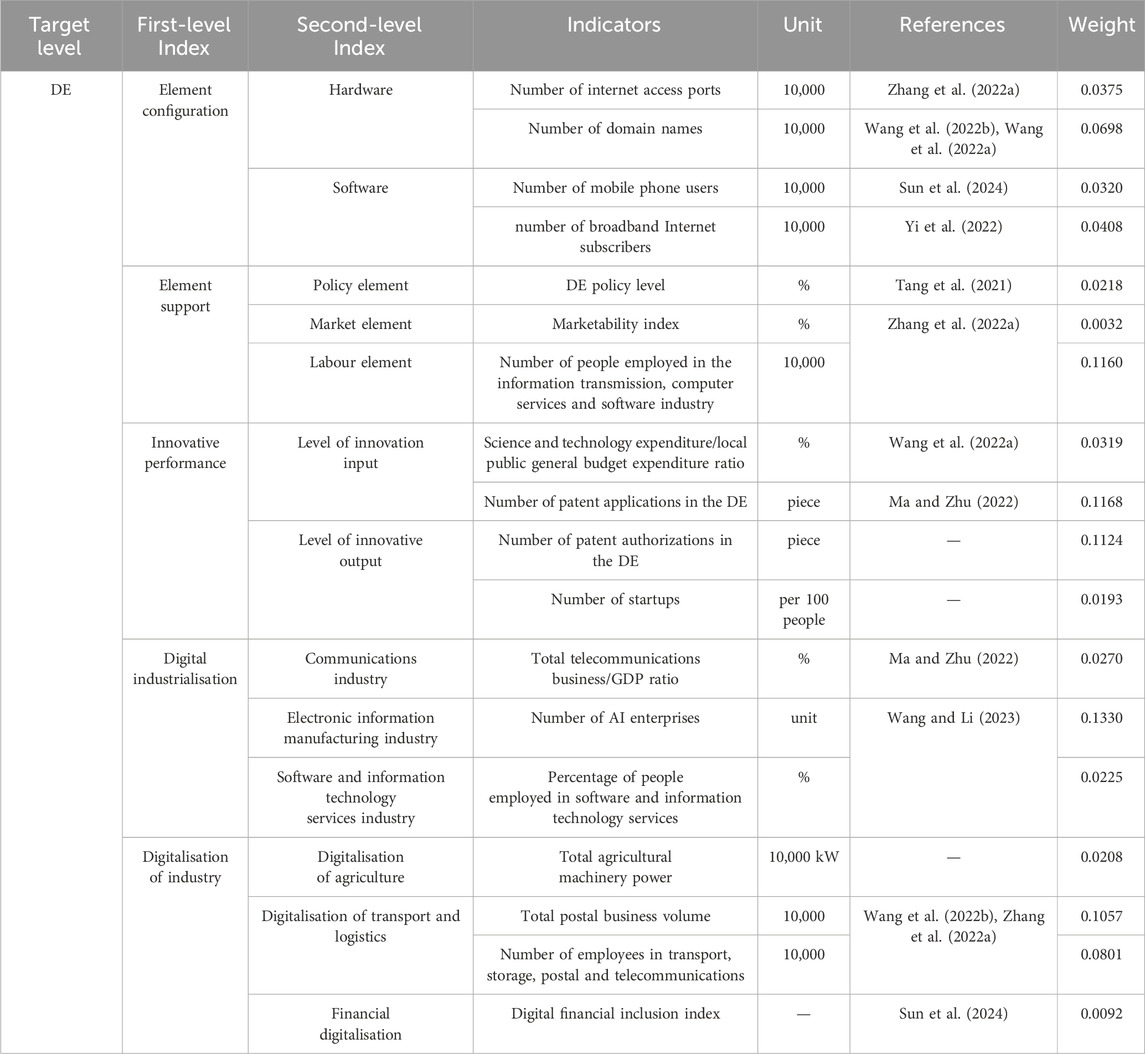
Table 1. Index system of DE.
The IPAT model (Ehrlich and Holdren, 1971) is typically used to identify the causes of environmental problems resulting from human activities. The model is as follows:
where I denotes the environmental impact, P denotes the population factors, A denotes affluence, and T denotes the broad level of technology. However, the model is limited for being singly linearized. Consequently, Dietz and Rosa (Dietz and Rosa, 1994) introduced a stochastic error term, extending the IPAT model to the STIRPAT model, allowing a more extensive analysis of the impact of social and ecological factors on the environment. The specific model is as follows:
Referring to the study (Li et al., 2023), to reduce the abnormal volatility of the data, Equation 8 was logarithmically transformed as follows:
where
The impact of the DE on carbon emissions in the YRB and the YREB were compared by constructing the following research model and Hypothesis 1 following previous theoretical models (Wang et al., 2022b; Wang et al., 2022a; Chen et al., 2023; Ma R. et al., 2023; Wang and Li, 2023):
where
Furthermore, this study investigated the intrinsic mechanisms between DE and carbon emissions by referencing relevant theoretical models (Baron and Kenny, 1986; MacKinnon et al., 2000). The following mechanism model was constructed by introducing the interaction term between the mediating variable and
The mediating variable,
CEI was selected as the dependent variable from an equity perspective, quantifying the relative variation in carbon emissions within the study region. Referring to the study by (Wang and Li, 2023), CEI was estimated as carbon emissions per unit of GDP, specifically the ratio of carbon emissions to GDP for each prefecture-level city.
The DE development index was chosen as the explanatory variable. The World Economic Forum and the G20 defined the DE as “a broad range of economic activities that use digital information and knowledge as key production factors, modern information networks as important activity spaces, and information and communication technologies to drive productivity growth.” Based on theoretical foundations and practical needs, we created an index that accurately reflects the essence of the DE and its impact on economic development. Simultaneously, we thoroughly considered the multidimensional characteristics of DE development to construct a hierarchical index system with strong practical applicability and scalability. Additionally, considering data reliability, availability, consistency, and temporal continuity, we developed a DE index system comprising five key dimensions: element configuration, elemental support, innovative performance, digital industrialization, and digitalization of industry. This framework effectively captures the DE’s growth potential and development trends. We selected 18 specific indicators to measure the DE development index and utilized the entropy weight method to synthesize the indicator system. The specific weights and indicator systems are presented in Table 1.
The mediating variables were primarily based on Grossman’s “scale–structure–technology” principle and the hypothesis analysis presented in Section 2.2. The mediating variables are as follows.
(1) Economic development level, Pgdp: This variable originates from the scale effect and the “new economy” dimension. The DE empowered NQP through digital technologies, advancing the deep integration of the digital and real economies, facilitating economic growth (Liu et al., 2024) and subsequently affecting CEI. Per capita GDP directly reflected the level of economic development (Chang et al., 2023). Therefore, we used each prefecture-level city’s per capita GDP to represent the economic development level.
(2) Industrial structure: This variable is derived from the structure effect and the “new industrial forms” dimension. The industrial structure is formed through market selection under constraints such as technology and the stage of economic development. Its optimization and upgrading can generate a “structural dividend” effect, thereby reducing carbon emissions (Wang et al., 2019). The DE promoted the collaborative development of digital and industrial digitalization through digital technologies, facilitating the innovative flow of production factors (Zhou and Xu, 2023). This empowered NQP to build a modern industrial system. Additionally, data factors had a multiplier effect, allowing for the combination of production factors and fostering industrial integration, which influences the industrial structure and indirectly impacts carbon emissions. Consequently, we selected the advancement and rationalization of the industrial structure to illustrate its mechanistic effects.
Industrial structure advancement, Isa. Data factors possessed broad applicability, empowering NQP to drive the transformation and upgrading of traditional industries to advanced industries. This expanded the proportion of emerging and future industries, achieving green and low-carbon development and reducing carbon emissions. Referring to the relevant study by (Fu, 2010), we employed the cosine method to measure the advancement of the industrial structure. First, spatial vectors were constructed based on the proportions of the primary, secondary, and tertiary industries’ added value to GDP, forming a three-dimensional industrial structure spatial vector
Subsequently, the industrial advancement value
where
Industrial structure rationalization, Isr. Rationalizing the industrial structure refers to the quality of industry aggregation, reflecting the degree of input–output coupling and the effective utilization of resources between industries. Typically, structural deviation is used to measure this; however, this approach neglects the importance of each industry to the economy; additionally, using absolute values complicates the analysis. Therefore, to assist in the study, Gan et al. (Gan et al., 2011) introduced the Theil index (Theil, 1967), which measures the structural deviations in output and employment among different industries and assesses the superior characteristics of each industry in the economy (Yuan and Zhu, 2018). Thus, the Theil index was utilized to calculate the rationalization of the industrial structure using the following formula:
Where
(3) Energy structure, Ens: The energy structure was derived from the technology effect and the “new technologies” dimension. Digital technologies fostered NQP development by driving the extensive integration of data elements and disruptive technological innovations. This transformation increased the share of green and low-carbon industries while reducing reliance on high-energy-consuming and high-carbon-emitting sectors, such as coal, accelerating the energy structure’s transition and upgrading (Yang et al., 2022; Huang et al., 2023). It also enhanced carbon emission efficiency, reduced energy consumption, and promoted a sustainable balance among the population, resources, and the environment. Because coal has remained China’s primary energy source, its consumption trends effectively reflected adjustments in the energy structure. Therefore, the energy structure was measured by the proportion of coal consumption to total energy consumption in each prefecture-level city (Wang et al., 2022a). Owing to data acquisition considerations, total energy consumption was calculated using natural gas, liquefied petroleum gas, social electricity consumption, and urban heating (including steam heating and thermal power plant heating), converted using standard coal coefficients. The specific formula is as follows:
(4) Level of technological progress, Ltp: The level of technological progress was derived from the technology effect and the “new technologies” dimension. Digital technologies empowered NQP, fostering disruptive technological innovations and achieving efficient transformations that enhanced total factor productivity and improved carbon emission efficiency. Additionally, digital finance drove the innovation of production relations, altered production and consumption patterns, enhanced the technological momentum of industrial forms toward decarbonization, fostered green and low-carbon financial products, reduced carbon emissions, and realized green digital development (Liu Q. et al., 2023; Sun et al., 2023; Tian et al., 2024). Consequently, technological progress was proxied by the number of green patents issued (Bottazzi and Peri, 2007; Wang et al., 2022a).
To mitigate the omitted variable bias, control variables potentially influencing the CEP were selected based on the aforementioned STIRPAT theoretical framework, in conjunction with frequency statistical methods and data availability. These variables were subsequently log-transformed:
(1) Level of Opening (Lopn): The level of openness affects energy-saving and emission reduction efficiency through internet-related channels (Wu et al., 2021). Therefore, the opening level was measured by the total import and export trade ratio to GDP (Han et al., 2021). (2) Broad Level of Science and Technology (Erg): Government environmental regulations influence the development of environmental technologies, under which the internet economy impacts total factor carbon emissions to some extent (Kou and Xu, 2022). Consequently, the broad level of science and technology was quantified using the ratio of environmental keywords to the total number of words in government work reports. (3) Population Density (Pop): An increase in population typically stimulates greater consumption demand, leading to elevated industrial and household carbon emissions (Hua et al., 2018). Thus, population density was assessed by the ratio of the permanent population to the administrative area of each region. (4) Level of Government Support: Low government subsidies, such as fossil fuel subsidies, negatively impact economic growth and carbon dioxide emissions (Lin and Ouyang, 2014). Therefore, government support was measured by the ratio of local general public budget expenditure to GDP (Ma R. et al., 2023). (5) Level of Urbanization (URB): The level of urbanization affects the energy efficiency (Han et al., 2021) and consumption per unit of time and space, thereby influencing carbon emissions per unit of space. Accordingly, urbanization was measured by the proportion of the urban population to the total population (Wang et al., 2022a). (6) Level of Urban Greening: Larger per capita areas of urban parks corresponded to greater fixed amounts of carbon dioxide, t positively contributing to local carbon emission control (Chen and Lee, 2020; Wang and Li, 2023). Consequently, the per capita park green space area (Zhang W. et al., 2022; Wang and Li, 2023) determined the level of urban greening.
Per data availability and watershed administrative divisions, we used panel data from 58 cities in the YRB and 104 cities in the YREB from 2011 to 2021 to explore the impact of the DE on carbon emissions. CEO was the dependent variable, with the total carbon emission data obtained from the Emissions Database for Global Atmospheric Research. The independent variable, DE, was measured using data sourced from the National Bureau of Statistics, the China Statistical Yearbook, the China Urban Statistical Yearbook, provincial statistical yearbooks, the China Academy of Information and Communications Technology, CINIC, the CNRDS database, local business registration records, prefecture-level city statistical bulletins, local government websites, the China Regional Statistical Yearbook, and the Peking University Inclusive Finance Index. Mediating variables included industrial structure, with data derived from provincial statistical yearbooks; energy structure, with data obtained from the China Urban Statistical Yearbook, provincial statistical yearbooks, and prefecture-level city bulletins; and green technology level, with data sourced from CNRDS. The control variables were measured using data from the National Bureau of Statistics, the China Urban Statistical Yearbook, provincial statistical bulletins, government work reports, and the China Urban Construction Yearbook. Additionally, we applied interpolation to supplement and estimate missing data for certain years in the indicators. Table 2 presents the descriptive statistics of the variables, all of which were log-transformed.
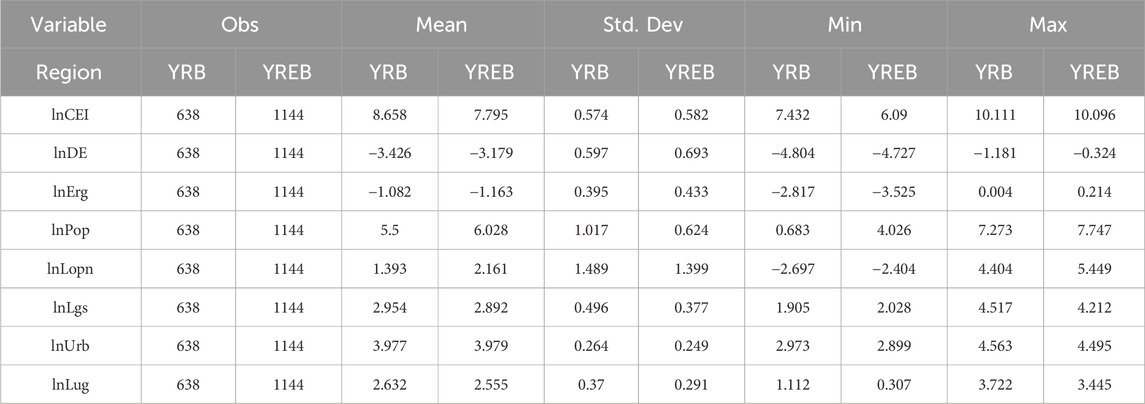
Table 2. Descriptive statistics of the variables (after logarithm).
Figure 5 illustrates the DE and CEI spatial distribution across the YRB and the YREB. The DE’s overall development gradually increased, which was mainly attributed to the promotional effects of national policies such as “Broadband China” “Internet +” and “Big Data Action” (State Council, 2013; State Council, 2015b; State Council, 2015a). The overall development of the DE in the YREB was significantly higher than in the YRB. One possible reason could be that Hangzhou, as the birthplace of China’s DE, generated economic agglomeration effects due to its geographic closeness to neighboring cities, thus promoting economic growth along the Yangtze River.
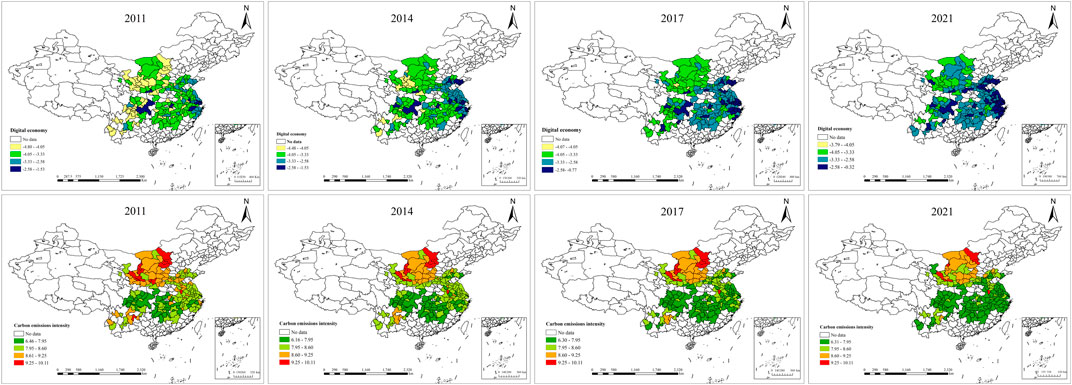
Figure 5. Spatial distribution of CEI and DE in the YRB and YREB for selected years.
Overall CEI also gradually decreased, which was closely related to policy guidance emphasizing climate change and constructing an environmentally friendly society, as outlined in the “China’s Policies and Actions for Addressing Climate Change (2011)” white paper and the 12th Five-Year Plan, 13th Five-Year Plan, and 14th Five-Year Plans (Ministry of Ecological Environment, 2011; State Council, 2011; State Council, 2016a; State Council, 2021b). As economic development levels improve, cleaning technology is constantly innovated, reducing the potential energy intensity (Li et al., 2017)and reducing CEI. However, CEI in the YRB continued to be significantly higher than in the YREB, possibly because the YRB served as an essential energy and chemical industrial base in China, characterized by higher industrial pollutant emissions and low-quality, inefficient industrial development with insufficient high-quality progress.
In the benchmark model, we primarily assessed the direct impact of DE on CEI. In the third row of columns (1) and (2) of Table 3, the coefficients of lnDE for both the YRB and the YREB were negative at the 1% significance level, indicating that DE development significantly reduced CEI. Specifically, each 1% increase in the level of DE development reduced CEI by 0.1536% in the YRB and 0.0643% in the YREB. First, under the “Broadband China” strategy, improving and developing digital infrastructure reduced CEI (Yang et al., 2022). Second, due to the efficient, integrated, and green nature of digital technologies such as big data and artificial intelligence, they enhanced energy efficiency and advanced green technological innovation, reducing carbon emissions (Wang and Li, 2023). Additionally, digital innovation facilitated digital industrialization and industrial digitization, positioning data as a new factor of production, transforming the structure of production factors, and reducing carbon emissions generated in social production. Therefore, Hypothesis 1 was confirmed.
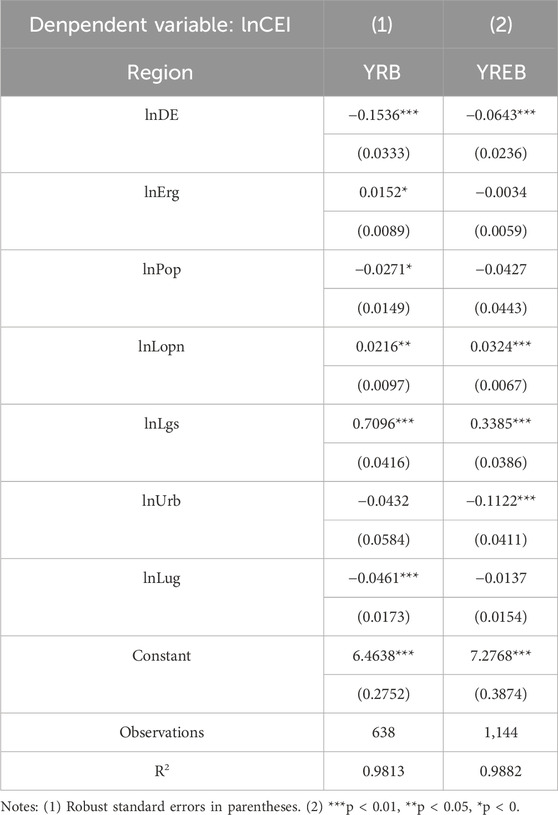
Table 3. Estimation results for the benchmark model.
The first column of Table 3 reflected the key influencing factors of CEI: (1) lnErg positively impacted CEI in the YRB, indicating that the strengthening of environmental regulations in this region increased CEI. (2) lnPop hurt CEI in the YRB. Population agglomeration reduced the scope of pollution diffusion, improving the quality and efficiency of carbon emission purification within the region, thereby reducing CEI. (3) lnLopn positively impacted CEI in both the YRB and the YREB at the 10% significance level, indicating that greater openness was associated with higher CEI. (4) lnLgs positively impacted CEI in the YRB and the YREB at the 1% significance level. Higher government subsidies, such as fossil fuel subsidies, led to greater consumption, which was not conducive to reducing CEI. (5) lnUrb significantly negatively impacted CEI in the YREB. The high level of urbanization in this region promoted improvements in energy efficiency, thereby reducing CEI. (6) lnLug significantly negatively impacted CEI in the YRB. A larger per capita area of urban parks indicated a more substantial carbon sink capacity, which was beneficial for controlling carbon emissions.
We employed the instrumental variable method (IV) to address the endogeneity issues arising from omitted variables, reverse causality, or measurement errors. Lagged variables are generally not influenced by the current regression error term, satisfying the exogeneity condition, and are highly correlated with the level of DE development. The lagged value of the DE level, calculated through the principal component analysis, was used as an instrument for the DE level. First, the Hausman test was used to verify endogeneity; it found that the p-values for both the YRB and the YREB were below 0.1, confirming the endogeneity between the DE and CEI. Next, we conducted underidentification and weak instrumental variable tests on the selected instrumental variable. As shown in Table 4, the p-values for the underidentification test in columns (1) and (2) for the YRB and the YREB were both below 0.1, passing the underidentification test (Kleibergen and Paap, 2006). Additionally, the C-D Wald F statistic and the Kleibergen–Paap r Wald F statistic in both regions exceeded the critical values, confirming the weak instrumental variable test. These tests confirmed the robustness of the instrumental variable results.

Table 4. Estimation results for the robustness checks.
Moreover, we conducted three types of robustness checks (as shown in Table 4). (1) Bilateral 1% tailoring: all variables were subjected to 1% two-sided winsorization prior to regression analysis to mitigate the potential adverse effects of outliers on the baseline regression results. The estimation results are presented in columns (3) and (4) of Table 4, where the coefficients of lnDE in both the YRB and the YREB remained significantly negative, ratifying the robustness of the baseline regression. (2) Lag Effects: Following the relevant study by (Chen et al., 2023), all variables except CEI were lagged by one to two periods to examine the impact of lagged effects on the relationship between the DE and CEI. The regression results with a one-period lag are shown in columns (5) and (6) of Table 4, where the coefficients of the DE in the YRB and the YREB were 0.1425 and 0.0556, respectively, both significant at the 1% level. The regression results with a two-period lag are displayed in columns (7) and (8) of Table 4, with coefficients of 0.1681 and 0.0487 for the DE in the YRB and the YREB, respectively (significant at the 1% and 10% levels, respectively). These findings confirmed the robustness of the baseline regression. (3) Excluding Municipalities: Considering that the economic scale of municipalities far exceeds that of other cities, and following (Wang and Li, 2023), we excluded Shanghai and Chongqing from the sample for the regression analysis. The estimated results in column (10) of Table 4 indicate that developing DE inhibited CEI within the YREB, satisfying the 1% significance level. These tests confirmed the robustness of the baseline regression results.
Based on Hypotheses two to four and Grossman’s theory, we proposed that within the YRB and the YREB, the DE influenced CEI through scale, structural, and technological effects through four potential pathways—economic development, industrial structure, energy structure, and technological progress—as shown in Table 5 and Figure 6.
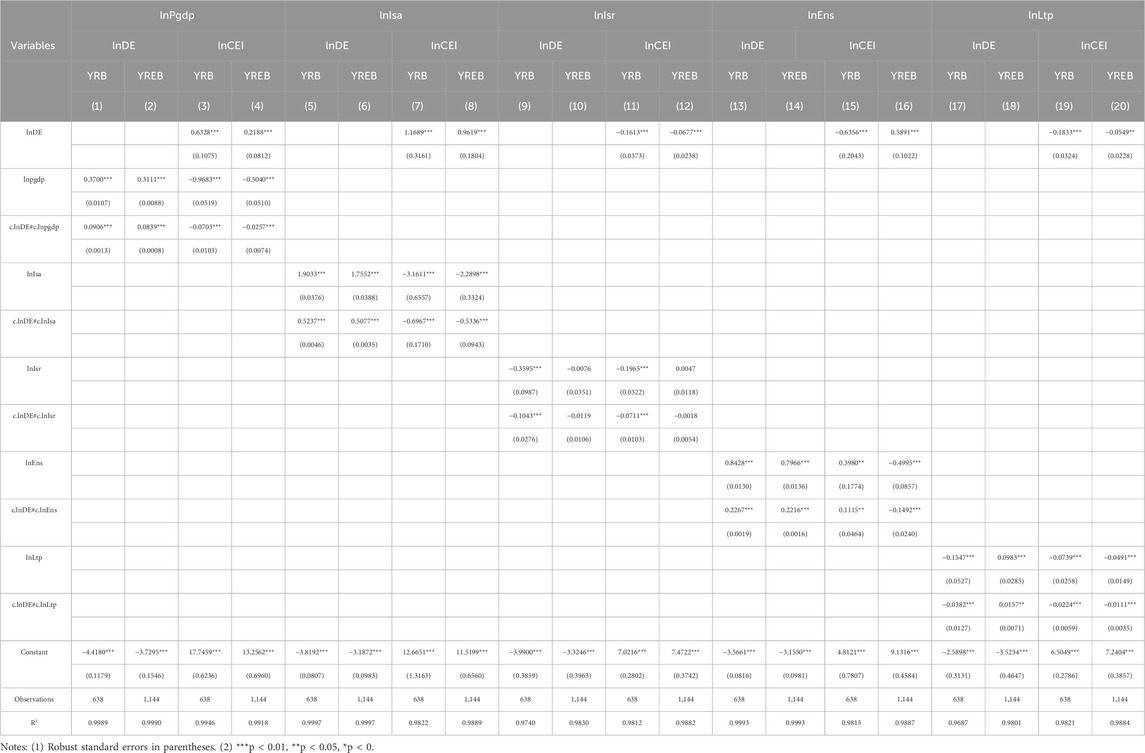
Table 5. Results of the mediating effects.
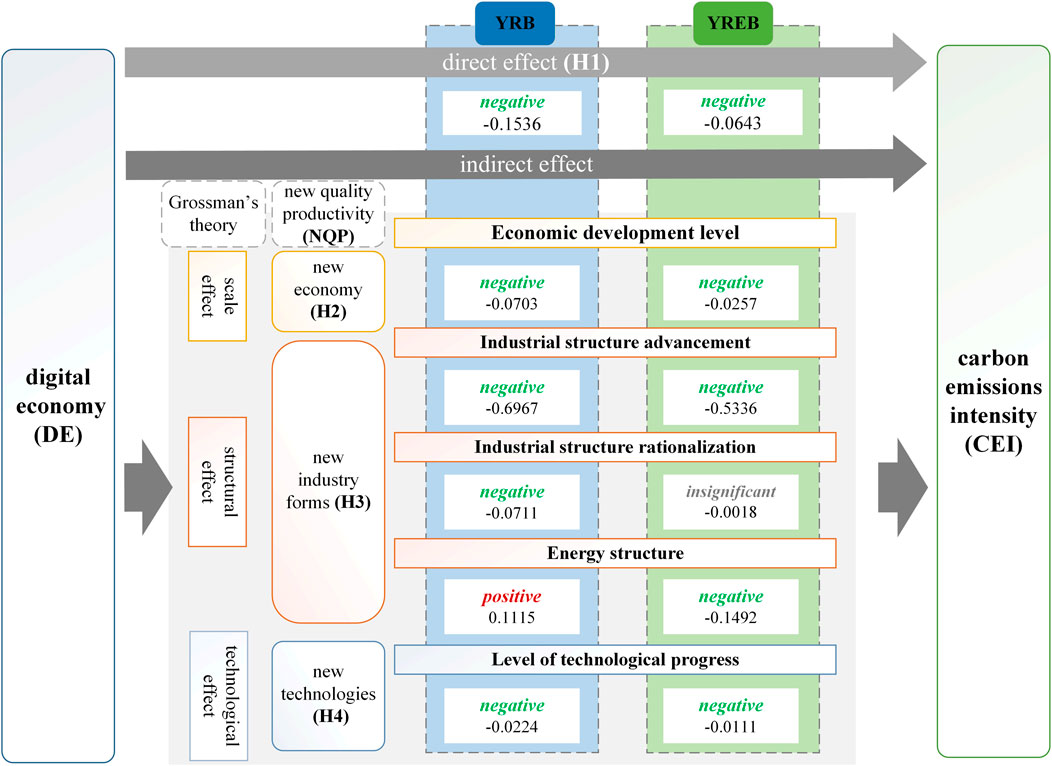
Figure 6. Results of the mediating effects in the YRB and YREB.
With reference to studies by (Jaccard, 2001; Brambor et al., 2006), we examined the mediating role of the level of economic development in DE’s effect on CEI using an interaction term between the levels of DE development and economic development in Equations 10, 11. Considering the multicollinearity and model fit, we centered all interaction terms in this paper. The results in columns (1) to (4) of Table 5 indicate that c.lnDE#c.lnpgdp significantly impacted CEI negatively in both the YRB and the YREB. Specifically, a 1% increase in the DE reduced CEI of the YRB and YREB by 0.0703% and 0.0257%, respectively, through improved economic development, with more pronounced results observed in the YRB. This finding aligns with the EKC hypothesis. In the YRB, where the development of DE remains relatively underdeveloped and the traditional economy continues to be dominant, digitalization has a more pronounced enabling effect. A leading driver of economic growth, developing DE enhances resource allocation efficiency and induces structural shifts in production methods and development models. This transformation accelerates the transition toward a technology-intensive and low-carbon economy, potentially facilitating an earlier arrival at the EKC turning point, resulting in a more rapid decline in CEI and fostering sustainable low-carbon development. Therefore, Hypothesis 2 was confirmed.
To comprehensively assess the mediating effect of the industrial structure, it was divided into two pathways: industrial structure advancement and rationalization. The interaction term between the DE development level and industrial structure advancement was used in the estimation Equations 10, 11 to test the mediating role of industrial structure advancement in the impact of the DE on CEI. Columns (5)–(8) of Table 5 indicate that c.lnDE#c.lnIsa negatively affected CEI in both the YRB and the YREB, with industrial structure advancement the most influential pathway among all effects. Specifically, a 1% increase in the DE reduced CEI by 0.6967% and 0.5336% in the YRB and the YREB, respectively, through industrial structure advancement. The study by (Wang et al., 2022c) found that, overall, production structure factors related to the digital industry significantly negatively affected China’s embodied carbon emissions from 2002 to 2017, which aligned with our conclusion on the development of industries toward digitalization and advancement. Both regions thoroughly understood supply-side structural reform, continuously advancing the transformation of industrial structures toward technology-, knowledge-, and innovation-intensive types, such as vigorously advancing strategic emerging industries driven by cutting-edge technologies. However, the pace of traditional industry renewal and development in the YRB was slower than in the YREB. Therefore, utilizing the DE to support the digital and green transformation of traditional industries in the YRB had a more substantial dividend effect, advancing industry reductions of CEI.
The interaction term between the level of DE development and industrial structure rationalization was then used in the estimation Equations 10, 11 to test the mediating role of industrial rationalization. Columns (9)–(12) of Table 5 indicate that c.lnDE#c.lnIsr negatively affected CEI in the YRB. Specifically, a 1% increase in the DE reduced CEI by 0.0711% through industrial rationalization. However, this effect was not significant in the YREB, possibly because the YREB’s industrial rationalization level from 2011 to 2017 was above the national average; thus, the impact of using the DE to achieve green innovation through industrial rationalization was less significant than in the YRB. According to the analysis in Section 4.1, the overall development level of the DE in the YREB was higher than in the YRB. Consequently, we concluded that significant reforms in industrial rationalization were likely less effective at reducing CEI than other beneficial adjustments, such as advancements in the industrial structure.
The interaction term between the DE development level and the energy structure was utilized in estimation Equations 10, 11 to examine the mediating role of the energy structure. Columns (13)–(16) of Table 5 present the regression results, indicating that c.lnDE#c.lnEns was significant in both YREB and YRB, but had opposite effects. Specifically, a 1% increase in DE results in a 0.1492% reduction in CEI in YREB, while it increases CEI by 0.1115% in YRB. A possible explanation is that, in recent years, the YREB has leveraged digital technologies like artificial intelligence to improve the intelligence and greening of the energy system, continually increasing the proportion of clean and green energy consumption and thus reducing CEI. In contrast, the situation in YRB can be explained from two perspectives. First, the YRB still heavily depends on traditional energy sources like coal, and the lack of diversification in its energy structure has led to increased CEI as DE grows. Second, the energy transition in YRB has been relatively slow; the development of DE has not effectively harnessed the substitution effect of clean and green energy, resulting in concentrated energy consumption and a further rise in CEI. Therefore, while fostering the development of DE, it is essential to accelerate the green transformation of the energy structure to achieve coordinated and sustainable economic and environmental development.
In summary, although some effects were not significant, this did not hinder verifying the structural effect’s mediating role in the impact of the DE on CEI. Therefore, Hypothesis 3 was confirmed.
Finally, columns (17)–(20) of Table 5 estimated Equations 10, 11 to test the mediating role of the interaction term between the level of DE development and technological progress on CEI. Columns (19) and (20) showed that c.lnDE#c.lnLtp was significant, with a 1% increase in the DE reducing CEI by 0.0224% and 0.0111% in the YRB and the YREB, respectively, by improving the green technology level. The effect was more significant in the YRB. The findings in the YREB aligned with those of Ma L. et al. (2023). Wang et al. (2022d) demonstrated that ICT agglomeration reduced carbon emissions through technological innovation, particularly when the level of technological innovation surpassed a critical threshold. Our conclusions were logically consistent with this finding. A possible explanation for the more significant mediating effects in the YRB was that the region’s industrial structure was mainly composed of energy and chemical industries, and the level of carbon emission reduction through digital technology was not as advanced as in the YREB. Digital technology plays a crucial role in promoting carbon emission reduction. For the YRB, strengthening the depth of technological development might have amplified the impact of the technical effect. Therefore, Hypothesis 4 was confirmed.
To explore the differences in the impact of the DE on CEI in the YRB and the YREB, we divided each basin into upper, middle, and lower reaches according to their geographic characteristics. We conducted separate estimations for subsamples in each region (Table 6).
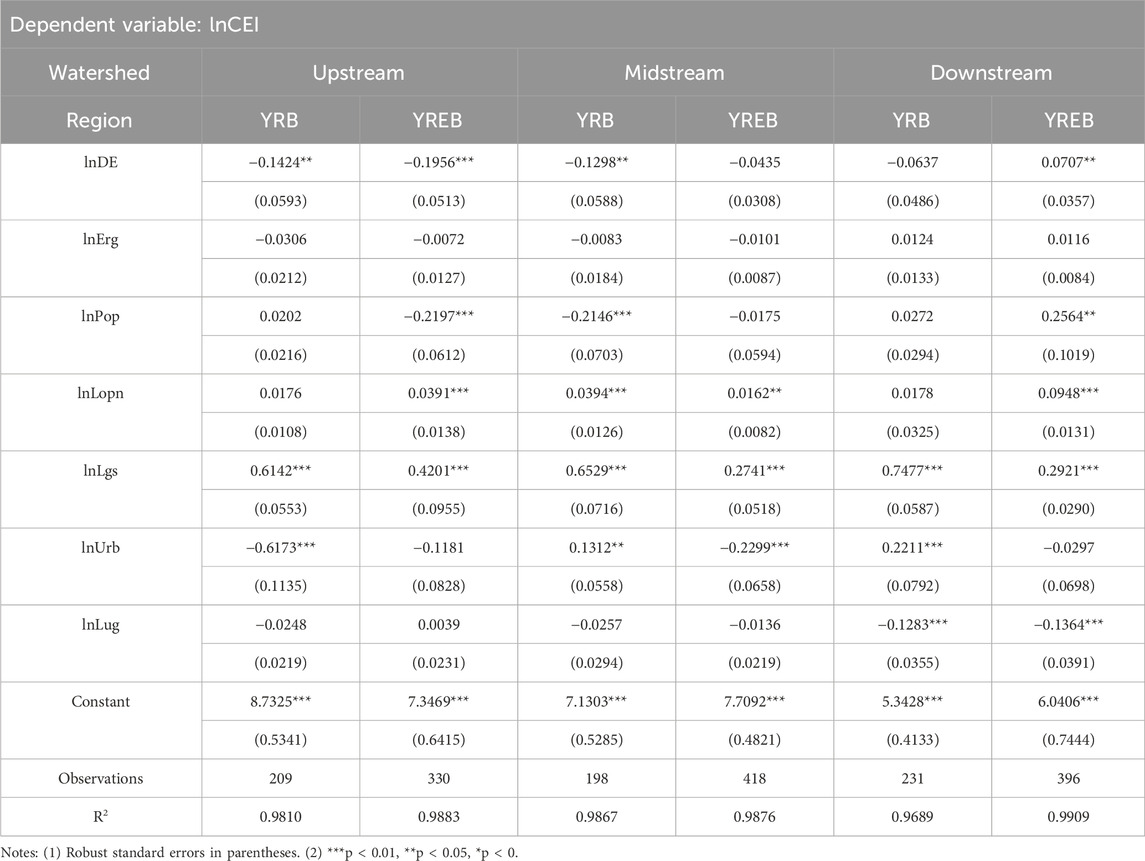
Table 6. Estimation results for different watersheds.
First, in the sample regression for each basin, the DE coefficients in the upper and middle reaches of the YRB were significantly negative. Specifically, a 1% increase in DE resulted in a decrease of CEI by 0.1424% and 0.1298% in the upper and middle reaches, respectively. However, developing DE in the downstream reaches did not meaningfully contribute to reducing CEI. From a spatial perspective, the average level of DE development in the upper and middle reaches was lower than in the downstream regions, while the average CEI was higher. Possible explanations for the results in the upper and middle reaches of the YRB include the following: first, the provinces in these areas had relatively low levels of economic development and engaged in significant industrial transfers from downstream areas, leading to a high proportion of traditional and heavy industries. Simultaneously, the development of digital technologies and supporting infrastructure was insufficient, hindering both digitalization and industrial digitalization. The industrial structure was inefficient, with significant carbon emissions. Second, energy consumption intensity was high, while clean energy technologies, such as carbon capture and storage, trailed behind those in downstream regions. An explanation for the situation in the downstream region may lie in its industrial structure, primarily composed of light industries and agriculture, resulting in low CEI and limiting the potential of DE to reduce emissions. Investing in digital technologies, optimizing industrial structures, enhancing regulations on traditional energy sectors, supporting renewable energy industries like wind and solar, and advancing green innovation technologies could help to lower carbon emissions in the upper and middle reaches (Tian et al., 2024).
In the sample regression of the YREB, the DE coefficients were −0.1956 (P < 0.01) and 0.0707 (P < 0.05) in the upper and lower reaches, respectively. This indicated that a 1% increase in DE decreased CEI by 0.1956% in the upstream regions, with an increase of 0.0707% in the downstream regions. However, in the middle reaches, developing DE did not significantly reduce CEI. Figure 7(3), 7 (4) display the quantile distributions of DE and CEI in the YREB, showing that the average levels in some downstream regions were higher than in the upper and middle reaches. These results can be interpreted as follows: in the downstream provinces of the YREB, digital information technology was highly advanced, with industries such as telecommunications and electronic information expanding significantly and actively integrating digital elements, leading to an advanced DE. However, this development was accompanied by substantial electricity consumption, with coal-fired power generation and other high-carbon energy sources comprising a large share of the energy supply, resulting in higher CEI. Additionally, the rapid growth of the logistics industry driven by online shopping led to hidden carbon emissions, particularly in manufacturing and transportation. In the upstream regions of the YREB, near Sichuan and Yunnan, natural advantages such as high altitudes and abundant water flow gradients supported the development of clean hydropower, providing energy for DE. At the same time, these regions were dominated by traditional heavy industries and resource-based sectors, contributing to higher CEI. DE development in these areas assisted in transforming industry, improving energy utilization efficiency, and reducing carbon emissions. In the middle reaches of the YREB, the lack of significant effects on CEI reduction could be explained by the predominance of traditional high-carbon industries and delays in digital transformation, which limited the carbon reduction potential of DE. The insufficient development of digital infrastructure and inadequate application of clean and green technologies further constrained progress toward green transformation and low-carbon development.

Figure 7. Spatial and data distribution of CEI and DE in different watersheds of the YRB and YREB in selected years.
Then, in the overall sample regression of the YRB and the YREB, the effect of DE development on reducing CEI was significant in the upstream regions of both basins, with a more pronounced effect in the YREB than in the YRB. In the middle reaches, the effect was significant in the YRB, while the downstream effects were not significant in either basin. A possible explanation for this was that the YREB’s upstream area has steep terrain, and hydropower development has taken place. At the same time, the upstream area contains many metal industries, and using hydropower-driven electricity helped convert the development momentum, reduce environmental pollution, achieve digital and green development, and lower CEI. This also reflected the differences between the basins.
In 2016, China introduced the “Internet Plus” initiative, marking a critical turning point in accelerating its DE. Following the 2015 Paris Agreement, China reinforced its low-carbon policies 2016, shaping the carbon emissions trajectory. Additionally, the release of the Yangtze River Economic Belt Development Plan Outline (State Council, 2016b) the same year advanced the region’s transition toward high-quality development. Therefore, we selected 2016 as the dividing point, as it was a pivotal year, to provide a more explicit analysis of the development differences in DE and CEI between the YRB and the YREB, as shown in Figure 7. The results indicated that, across the upper, middle, and lower reaches, with few exceptions, the overall level of DE development in the YRB was below that in the YREB, while CEI remained generally higher. A possible explanation was that, since the reform and opening-up, China’s economic center has gradually shifted southward, driving th growth of emerging technology enterprises, such as Huawei and Tencent, in southern provinces, which spurred forward industrial transformation, andupgrades in surrounding areas, advancing green development (Li J. et al., 2022; Wang et al., 2022b).
Considering the potential relationship between the DE and CEI in the YRB and the YREB, we employed fixed effects and mechanism effects to conduct a thorough study of the impact of the DE on CEI in the context of NQP in the YRB and the YREB from 2011 to 2021. Furthermore, we explored the intrinsic mechanisms and spatial variability of the DE’s influence on CEI and investigated how to achieve green, high-quality development. The study reached the following conclusions: (1) Between 2011 and 2021, the DE played a positive role in reducing CEI in both the YRB and the YREB, with a more pronounced impact observed in the YRB; (2) The DE in the YRB and the YREB affects CEI through scale, structural, and technological effects, aligning with the concepts of the new economy, new industrial forms, and innovations in technology under the theory of NQP. The economic development level, the advancement of the industrial structure, the optimization of the industrial framework, the energy structure, and the level of technological progress varied across the regions. Additionally, digital industrialization and the advancement of green technology highlighted vital developmental pathways through which the DE influences CEI; (3) Overall, from 2011 to 2021, the levels of the DE in both the YRB and the YREB consistently improved, while CEI steadily decreased. However, the overall development level of the DE in the YRB was lower than that of the YREB, and its CEI was higher than that of the YREB; (4) The results of the heterogeneity analysis indicated that the impact of the DE on CEI in the YRB was such that the effect in the upstream region was greater than in the middle reaches, with no significant effect observed downstream. In contrast, in the YREB the upstream effect was greater than the downstream effect, with no notable effect in the middle reaches.
Achieving national climate goals and the corresponding costs depend entirely on regional actions within the country (Yu et al., 2023). Therefore, based on the research analysis, we proposed several policy implications.
First, cities in the YRB and YREB should emphasize the role of the DE in reducing CEI. The YRB should focus on leveraging the DE to mitigate CEI in the upper and middle reaches, promote the creation of a digital twin of the Yellow River, enhance monitoring and sensing capabilities, improve ecological monitoring, and increase efficiency in addressing carbon emission issues. The YREB should highlight the positive impact of the DE on reducing CEI in both upstream and downstream regions, develop green logistics, strengthen supply chain resilience, and promote smart logistics and low-carbon transportation technologies to minimize carbon emissions in the transportation sector. Additionally, cities in both the YRB and YREB should further enhance digital infrastructure, increase financial investments, and fully utilize technologies such as cloud computing and big data to advance the digital transformation of traditional industries, empowering low-carbon and green development by constructing the DE.
Second, cities in the YRB and the YREB should optimize their economic structures and facilitate the deep integration of industrial upgrades and digitalization, systematically establishing a green and low-carbon modern industrial system. The Yellow River Basin Ecological Protection and High-Quality Development Strategy (State Council, 2021a) provides essential guidance for balancing the region’s economic growth with ecological sustainability. In light of the research findings, cities in the YRB should consider the following: (1) developing strategic emerging industries that integrate production, supply, and demand through innovative resource aggregation, promoting green, low-carbon, and digital development to achieve new scale effects through the integration of digital and physical economies; (2) leveraging the role of industrial clusters and urban agglomerations as demonstration zones for industrial transfer, enhancing the capacity to undertake industrial transfers both domestically and internationally; (3) establishing comprehensive pilot zones for transforming old and new growth drivers, demonstration zones for industrial transformation and upgrading, and bases for new industrialization. For cities in the YREB: (1) further improve the collaborative development of industrial, innovation, and supply chains, promoting their deep integration; (2) accelerate the high-end, intelligent, and green upgrading of traditional industries, enhancing the use of digital technologies to empower the digital transformation of competitive manufacturing sectors in the YREB, create competitive digital industry clusters, build an intelligent manufacturing system with low consumption and high output, and effectively implement the requirements for green and high-quality development.
Third, cities in the YRB and the YREB should accelerate developing green technologies and constructing innovation systems to provide vital technical support for building a high-quality development framework. NQP has inherent characteristics that protect the ecological environment and promote the harmonious coexistence of humans and nature, aligning with green and high-quality development. Therefore, the cities of YRB and YREB should thoroughly prioritize applying new technologies. Cities and governments in the YRB should remove barriers to the cross-regional and cross-basin flow of resource factors, promote the efficient flow of technology as a factor of production, improve resource utilization efficiency, and construct a pilot area for ecological protection and high-quality development. Cities and governments in the YREB should increase investment in the research and development of green technology, encourage industry-university-research cooperation, and use digital low-carbon technology to achieve the green transformation of enterprises. For example, big data technology can monitor emissions in real time and reduce pollution.
Moreover, cities within the YREB accelerated optimizing and adjusting their energy structures by promoting the integration of digital technologies with energy transformation. They advanced the deployment of smart grids and distributed energy systems to improve energy efficiency. Simultaneously, efforts were made to reduce reliance on high-carbon energy, expand the use of renewable sources, and work toward building a clean, low-carbon, safe, and efficient modern energy system.
Although this study addresses some research gaps in the relationship between DE and carbon emissions, it also has some limitations and research prospects.
First, geographic factors such as land use and urbanization influence the spatial heterogeneity of carbon emissions in the YRB and the YREB. The extent to which spatial and human factors shape the underlying mechanisms remain underexplored. Future studies could incorporate interdisciplinary driving factor detection to investigate further heterogeneity differences across the upper, middle, and lower reaches.
Second, the proportion of coal consumption in the total energy consumption was a proxy for the energy structure. However, due to data availability constraints, equally important factors such as renewable energy penetration and energy efficiency could not be quantitatively examined. Future research should consider these factors to provide a more comprehensive understanding of how energy structure adjustments influence carbon emissions.
Third, our study primarily focused on CEI while overlooking efficiencies due to data limitations. Future research could compare how the development of DE affects the carbon emission efficiency in the YRB and YREB. A multiperspective, multidimensional approach is needed to explore the strategic differences in how the DE contributes to regional carbon peaking and carbon neutrality.
Fourth, the applicability of this research’s findings to other developing countries requires further validation. Economic structures, energy reliance, and policy frameworks likely shaped the effects of DE on carbon reduction. For instance, energy dependencies varied across major river basins, including India’s Ganges and Brahmaputra, Brazil’s São Francisco and Amazon, and Egypt’s Nile. While India and Egypt depend on fossil fuels, Brazil primarily utilizes hydropower. Policy approaches also diverged, with India advancing its digital infrastructure via the India Stack and Brazil prioritizing renewable energy strategies (Empresa de Pesquisa Energética, 2020). Furthermore, data limitations restricted the external validity of the findings. Future research should incorporate multicountry panel data and microlevel analyses to facilitate comparative assessments and inform policy design for sustainable development in emerging economies.
The datasets presented in this article are not readily available because Data will be made available on request. Requests to access the datasets should be directed to ZL, emhpamlhbmxpbl93b3JrQDE2My5jb20=.
ZL: Conceptualization, Data curation, Formal Analysis, Methodology, Resources, Software, Validation, Visualization, Writing–original draft, Writing–review and editing. HL: Conceptualization, Supervision, Validation, Writing–review and editing. LS: Conceptualization, Resources, Validation, Writing–review and editing. DC: Funding acquisition, Project administration, Writing–review and editing.
The author(s) declare that financial support was received for the research, authorship, and/or publication of this article. This research was funded by the National Key Research and Development Program of China (grant number 2019YFD1100800) and the Shandong Provincial Social Science Planning Research Project (grant number 19CDNJ21).
The authors declare that the research was conducted in the absence of any commercial or financial relationships that could be construed as a potential conflict of interest.
The authors declare that no Generative AI was used in the creation of this manuscript.
All claims expressed in this article are solely those of the authors and do not necessarily represent those of their affiliated organizations, or those of the publisher, the editors and the reviewers. Any product that may be evaluated in this article, or claim that may be made by its manufacturer, is not guaranteed or endorsed by the publisher.
Bai, L., Guo, T., Xu, W., Liu, Y., Kuang, M., and Jiang, L. (2023). Effects of digital economy on carbon emission intensity in Chinese cities: a life-cycle theory and the application of non-linear spatial panel smooth transition threshold model. Energy Policy 183, 113792. doi:10.1016/j.enpol.2023.113792
Baron, R. M., and Kenny, D. A. (1986). The moderator–mediator variable distinction in social psychological research: conceptual, strategic, and statistical considerations. J. Pers. Soc. Psychol. 51, 1173–1182. doi:10.1037/0022-3514.51.6.1173
Bottazzi, L., and Peri, G. (2007). The international dynamics of R&D and innovation in the long run and in the short run. Econ. J. 117, 486–511. doi:10.1111/j.1468-0297.2007.02027.x
Brambor, T., Clark, W. R., and Golder, M. (2006). Understanding interaction models: improving empirical analyses. Polit. Anal. 14, 63–82. doi:10.1093/pan/mpi014
Chang, H., Ding, Q., Zhao, W., Hou, N., and Liu, W. (2023). The digital economy, industrial structure upgrading, and carbon emission intensity — empirical evidence from China’s provinces. Energy Strategy Rev. 50, 101218. doi:10.1016/j.esr.2023.101218
Chen, L., Lu, Y., Meng, Y., and Zhao, W. (2023). Research on the nexus between the digital economy and carbon emissions—evidence at China’s province level. J. Clean. Prod. 413, 137484. doi:10.1016/j.jclepro.2023.137484
Chen, X., Meng, Q., Shi, J., Liu, Y., Sun, J., and Shen, W. (2022). Regional differences and convergence of carbon emissions intensity in cities along the Yellow River Basin in China. Land 11, 1042. doi:10.3390/land11071042
Chen, Y., and Lee, C.-C. (2020). Does technological innovation reduce CO2 emissions?Cross-country evidence. J. Clean. Prod. 263, 121550. doi:10.1016/j.jclepro.2020.121550
Cheng, Y., Zhang, Y., Wang, J., and Jiang, J. (2023). The impact of the urban digital economy on China’s carbon intensity: spatial spillover and mediating effect. Resour. Conserv. Recycl. 189, 106762. doi:10.1016/j.resconrec.2022.106762
Dietz, T., and Rosa, E. A. (1994). Rethinking the environmental impacts of population, affluence and technology. Hum. Ecol. Rev. 1, 277–300.
Dong, R., and Zhou, X. (2023). Analysis of the nonlinear and spatial spillover effects of the digital economy on carbon emissions in the Yellow River Basin. Sustainability 15, 5253. doi:10.3390/su15065253
Edziah, B. K., Sun, H., Anyigbah, E., and Li, L. (2021). Human capital and energy efficiency: evidence from developing countries. Am. J. Ind. Bus. Manag. 11, 599–610. doi:10.4236/ajibm.2021.116038
Ehrlich, P. R., and Holdren, J. P. (1971). Impact of population growth. Obstet. Gynecol. Surv. 26, 769–771. doi:10.1097/00006254-197111000-00014
Empresa de Pesquisa Energética (2020). Plano Nacional de Energia - 2050. EPE, Brasília, Brazil. Available online at: https://www.epe.gov.br/pt/publicacoes-dados-abertos/publicacoes/Plano-Nacional-de-Energia-2050 (Accessed December 10, 2024).
Fu, L. (2010). An empirical research on industry structure and economic growth. Stat. Res. 27, 79–81. doi:10.19343/j.cnki.11-1302/c.2010.08.011
Gan, C., Zheng, R., and Yu, D. (2011). An empirical study on the effects of industrial structure on economic growth and fluctuations in China. China Econ. Res. 46 (4–16), 31.
Gao, Y., Gao, X., and Zhang, X. (2017). The 2 °C global temperature target and the evolution of the long-term goal of addressing climate change—from the united Nations framework convention on climate change to the Paris agreement. Engineering 3, 272–278. doi:10.1016/J.ENG.2017.01.022
Grossman, G. M., and Krueger, A. B. (1991). Environmental impacts of a north american free trade agreement. Cambridge, Mass: National Bureau of Economic Research.
Grossman, G. M., and Krueger, A. B. (1995). Economic growth and the environment. Q. J. Econ. 110, 353–377. doi:10.2307/2118443
Han, J., Miao, J., Shi, Y., and Miao, Z. (2021). Can the semi-urbanization of population promote or inhibit the improvement of energy efficiency in China? Sustain. Prod. Consum. 26, 921–932. doi:10.1016/j.spc.2021.01.008
Hermwille, L., Dzebo, A., Iacobuţă, G. I., and Obergassel, W. (2023). Global stocktake and the SDG midterm review as opportunities for integration. Nat. Clim. Change 13, 1002–1004. doi:10.1038/s41558-023-01813-2
Hua, Y., Xie, R., and Su, Y. (2018). Fiscal spending and air pollution in Chinese cities: identifying composition and technique effects. China Econ. Rev. 47, 156–169. doi:10.1016/j.chieco.2017.09.007
Huang, L., Zhang, H., Si, H., and Wang, H. (2023). Can the digital economy promote urban green economic efficiency? Evidence from 273 cities in China. Ecol. Indic. 155, 110977. doi:10.1016/j.ecolind.2023.110977
Huang, S. (2023). The comprehensive environmental efficiency analysis based on a new data envelopment analysis: the super slack based measure network three-stage data envelopment analysis approach. J. Clean. Prod. 400, 136689. doi:10.1016/j.jclepro.2023.136689
Jaccard, J. (2001). Interaction effects in logistic regression. SAGE Publications, Inc. doi:10.4135/9781412984515
Jiang, T., He, X., Su, B., Havea, P. H., Wei, K., Kundzewicz, Z. W., et al. (2024). COP 28: challenge of coping with climate crisis. Innovation 5, 100559. doi:10.1016/j.xinn.2023.100559
Kleibergen, F., and Paap, R. (2006). Generalized reduced rank tests using the singular value decomposition. J. Econom. 133, 97–126. doi:10.1016/j.jeconom.2005.02.011
Kou, J., and Xu, X. (2022). Does internet infrastructure improve or reduce carbon emission performance? -A dual perspective based on local government intervention and market segmentation. J. Clean. Prod. 379, 134789. doi:10.1016/j.jclepro.2022.134789
Lan, Y., Wei, J., and Duan, X. (2023). The effects of the digital economy on carbon emission: evidence from China. Emerg. Mark. Finance Trade 60, 1468–1483. doi:10.1080/1540496X.2023.2256942
Lee, C.-C., He, Z.-W., and Yuan, Z. (2023). A pathway to sustainable development: digitization and green productivity. Energy Econ. 124, 106772. doi:10.1016/j.eneco.2023.106772
Li, A., Zhang, A., Zhou, Y., and Yao, X. (2017). Decomposition analysis of factors affecting carbon dioxide emissions across provinces in China. J. Clean. Prod. 141, 1428–1444. doi:10.1016/j.jclepro.2016.09.206
Li, J., Chen, L., Chen, Y., and He, J. (2022a). Digital economy, technological innovation, and green economic efficiency—empirical evidence from 277 cities in China. Manag. Decis. Econ. 43, 616–629. doi:10.1002/mde.3406
Li, L., Zhang, Y., Zhou, T., Wang, K., Wang, C., Wang, T., et al. (2022b). Mitigation of China’s carbon neutrality to global warming. Nat. Commun. 13, 5315. doi:10.1038/s41467-022-33047-9
Li, X., Li, S., Li, C., Shi, J., and Wang, N. (2023). The impact of high-quality development on ecological footprint: an empirical research based on STIRPAT model. Ecol. Indic. 154, 110881. doi:10.1016/j.ecolind.2023.110881
Lin, B., and Ouyang, X. (2014). A revisit of fossil-fuel subsidies in China: challenges and opportunities for energy price reform. Energy Convers. Manag. 82, 124–134. doi:10.1016/j.enconman.2014.03.030
Lin, B., and Zhou, Y. (2021). Does the Internet development affect energy and carbon emission performance? Sustain. Prod. Consum. 28, 1–10. doi:10.1016/j.spc.2021.03.016
Liu, L., Yang, Y., Liu, S., Gong, X., Zhao, Y., Jin, R., et al. (2023a). A comparative study of green growth efficiency in Yangtze River Economic Belt and Yellow River Basin between 2010 and 2020. Ecol. Indic. 150, 110214. doi:10.1016/j.ecolind.2023.110214
Liu, Q., Wu, W., Song, J., Dai, T., Jiang, H., Xu, J., et al. (2023b). How does digital finance accelerate low-carbon development: evidence from the Yellow River Basin, China. J. Environ. Plan. Manag. 68, 386–405. doi:10.1080/09640568.2023.2258449
Liu, Y., Zhang, X., and Shen, Y. (2024). Technology-driven carbon reduction: analyzing the impact of digital technology on China’s carbon emission and its mechanism. Technol. Forecast. Soc. 200, 123124. doi:10.1016/j.techfore.2023.123124
Lu, J., Guo, Z., and Wang, Y. (2024). Levels of development of new quality productivity, regional differences and paths to enhancement. J. Chongqing Univ.(Soc. Sci. Ed.) 30, 1–17. doi:10.11835/j.issn.1008-5831.jg.2024.03.002
Ma, D., and Zhu, Q. (2022). Innovation in emerging economies: research on the digital economy driving high-quality green development. J. Bus. Res. 145, 801–813. doi:10.1016/j.jbusres.2022.03.041
Ma, L., Hong, Y., He, S., Luo, H., Liu, G., Zheng, J., et al. (2023a). The influence of digital economy development on urban carbon emission intensity in the Yangtze River Economic Belt: mediating mechanism and spatial effect. Front. Ecol. Evol. 11. doi:10.3389/fevo.2023.1148505
Ma, R., Zhang, Z., and Lin, B. (2023b). Evaluating the synergistic effect of digitalization and industrialization on total factor carbon emission performance. J. Environ. Manag. 348, 119281. doi:10.1016/j.jenvman.2023.119281
Ma, Z., and Zhang, P. (2025). Myth of the digital economy: can it continually contribute to a low-carbon status and sustainable development? Environ. Impact Assess. Rev. 110, 107688. doi:10.1016/j.eiar.2024.107688
MacKinnon, D. P., Krull, J. L., and Lockwood, C. M. (2000). Equivalence of the mediation, confounding and suppression effect. Prev. Sci. 1, 173–181. doi:10.1023/A:1026595011371
Ministry of Ecological Environment (2011). White paper on China’s policies and actions to address climate change. Available online at: https://www.mee.gov.cn/ywgz/gjjlhz/lydt/201111/t20111123_220431.shtml (Accessed December 10, 2024).
Rong, T., Zhang, P., Li, G., Wang, Q., Zheng, H., Chang, Y., et al. (2023). Spatial correlation evolution and prediction scenario of land use carbon emissions in the Yellow River Basin. Ecol. Indic. 154, 110701. doi:10.1016/j.ecolind.2023.110701
State Council (2011). Outline of the Twelfth five-year plan for national economic and social development of the people’s Republic of China. Available online at: https://www.gov.cn/zhuanti/2011-03/16/content_2623428.htm (Accessed December 10, 2024).
State Council (2013). Circular of the state Council on the issuance of the ‘broadband China’ strategy and implementation programme. Available online at: https://www.gov.cn/zhengce/zhengceku/2013-08/16/content_5060.htm (Accessed December 10, 2024).
State Council (2015a). Circular of the state Council on the issuance of the action programme for promoting the development of big data. Available online at: https://www.gov.cn/gongbao/content/2015/content_2929345.htm (Accessed December 10, 2024).
State Council (2015b). Guiding opinions of the state Council on actively promoting ‘internet Plus’ actions. Available online at: https://www.gov.cn/zhengce/zhengceku/2015-07/04/content_10002.htm (Accessed December 10, 2024).
State Council (2016a). Official issuance of the outline of the plan for the development of the Yangtze River Economic Belt. Available online at: https://www.gov.cn/xinwen/2016-09/12/content_5107501.htm (Accessed December 10, 2024).
State Council (2016b). Outline of the Thirteenth five-year plan for national economic and social development of the people’s Republic of China. Available online at: https://www.gov.cn/xinwen/2016-03/17/content_5054992.htm (Accessed December 10, 2024).
State Council (2021a). The central committee of the communist party of China and the state Council have issued the ‘outline of the ecological protection and high-quality development plan for the Yellow River Basin. Available online at: https://www.gov.cn/gongbao/content/2021/content_5647346.htm (Accessed December 10, 2024).
State Council (2021b). Outline of the Fourteenth five-year plan for the national economic and social development of the people’s Republic of China and the vision 2035. Available online at: https://www.gov.cn/xinwen/2021-03/13/content_5592681.htm (Accessed December 10, 2024).
Sun, G., Fang, J., Li, J., and Wang, X. (2024). Research on the impact of the integration of digital economy and real economy on enterprise green innovation. Technol. Forecast. Soc. Change 200, 123097. doi:10.1016/j.techfore.2023.123097
Sun, H., Chen, T., and Wang, C. N. (2023). Spatial impact of digital finance on carbon productivity. Geosci. Front. 15, 101674. doi:10.1016/j.gsf.2023.101674
Tang, L., Lu, B., and Tian, T. (2021). Spatial correlation network and regional differences for the development of digital economy in China. Entropy 23, 1575. doi:10.3390/e23121575
Tian, H., Zhao, T., Wu, X., and Wang, P. (2024). The impact of digital economy development on carbon emissions-based on the perspective of carbon trading market. J. Clean. Prod. 434, 140126. doi:10.1016/j.jclepro.2023.140126
Wang, J., Dong, K., Dong, X., and Taghizadeh-Hesary, F. (2022a). Assessing the digital economy and its carbon-mitigation effects: the case of China. Energy Econ. 113, 106198. doi:10.1016/j.eneco.2022.106198
Wang, J., Dong, K., Sha, Y., and Yan, C. (2022b). Envisaging the carbon emissions efficiency of digitalization: the case of the internet economy for China. Technol. Forecast. Soc. Change 184, 121965. doi:10.1016/j.techfore.2022.121965
Wang, J., Dong, X., and Dong, K. (2022c). How digital industries affect China’s carbon emissions? Analysis of the direct and indirect structural effects. Technol. Soc. 68, 101911. doi:10.1016/j.techsoc.2022.101911
Wang, J., Dong, X., and Dong, K. (2022d). How does ICT agglomeration affect carbon emissions? The case of Yangtze River Delta urban agglomeration in China. Energy Econ. 111, 106107. doi:10.1016/j.eneco.2022.106107
Wang, K., Wu, M., Sun, Y., Shi, X., Sun, A., and Zhang, P. (2019). Resource abundance, industrial structure, and regional carbon emissions efficiency in China. Resour. Policy 60, 203–214. doi:10.1016/j.resourpol.2019.01.001
Wang, L., and Xue, W. (2023). Analysis of carbon emission drivers and multi-scenario projection of carbon peaks in the Yellow River Basin. Sci. Rep. 13, 13684. doi:10.1038/s41598-023-40998-6
Wang, W., He, Y., Lei, Y., Gao, W., Li, Y., Lan, H., et al. (2023). Digital economy sectors are key CO2 transmission centers in the economic system. J. Clean. Prod. 407, 136873. doi:10.1016/j.jclepro.2023.136873
Wang, X., and Li, J. (2023). Heterogeneous effect of digital economy on carbon emission reduction. J. Clean. Prod. 429, 139560. doi:10.1016/j.jclepro.2023.139560
Wang, Z., and Shao, H. (2024). Spatiotemporal interactions and influencing factors for carbon emission efficiency of cities in the Yangtze River Economic Belt, China. Sustain. Cities Soc. 103, 105248. doi:10.1016/j.scs.2024.105248
Wu, H., Xue, Y., Hao, Y., and Ren, S. (2021). How does internet development affect energy-saving and emission reduction? Evidence from China. Energy Econ. 103, 105577. doi:10.1016/j.eneco.2021.105577
Xu, Z., and Ci, F. (2023). Spatial-temporal characteristics and driving factors of coupling coordination between the digital economy and low-carbon development in the Yellow River Basin. Sustainability 15, 2731. doi:10.3390/su15032731
Yang, Z., Gao, W., Han, Q., Qi, L., Cui, Y., and Chen, Y. (2022). Digitalization and carbon emissions: how does digital city construction affect China’s carbon emission reduction? Sustain. Cities Soc. 87, 104201. doi:10.1016/j.scs.2022.104201
Yi, M., Liu, Y., Sheng, M. S., and Wen, L. (2022). Effects of digital economy on carbon emission reduction: new evidence from China. Energy Policy 171, 113271. doi:10.1016/j.enpol.2022.113271
Yu, B., Zhao, Z., Wei, Y.-M., Liu, L., Zhao, Q., Xu, S., et al. (2023). Approaching national climate targets in China considering the challenge of regional inequality. Nat. Commun. 14, 8342. doi:10.1038/s41467-023-44122-0
Yu, Z., Liu, Y., Yan, T., and Zhang, M. (2024). Carbon emission efficiency in the age of digital economy: new insights on green technology progress and industrial structure distortion. Bus. Strategy Environ. 33, 4039–4057. doi:10.1002/bse.3683
Yuan, H., and Zhu, C. (2018). Do national high-tech zones promote the transformation and upgrading of China’s industrial structure. China ind. Econ., 60–77. doi:10.19581/j.cnki.ciejournal.2018.08.004
Zeng, J., and Yang, M. (2023). Digital technology and carbon emissions: evidence from China. J. Clean. Prod. 430, 139765. doi:10.1016/j.jclepro.2023.139765
Zhang, J., Lyu, Y., Li, Y., and Geng, Y. (2022a). Digital economy: an innovation driving factor for low-carbon development. Environ. Impact Assess. Rev. 96, 106821. doi:10.1016/j.eiar.2022.106821
Zhang, S., and Wen, J. (2024). Digital economy empowers new quality productivity: an analytical framework. Contemp. Econ. Manag. 46, 1–9. doi:10.13253/j.cnki.ddjjgl.2024.07.001
Zhang, W., Fan, H., and Zhao, Q. (2023). Seeing green: how does digital infrastructure affect carbon emission intensity? Energy Econ. 127, 107085. doi:10.1016/j.eneco.2023.107085
Zhang, W., Liu, X., Wang, D., and Zhou, J. (2022b). Digital economy and carbon emission performance: evidence at China’s city level. Energy Policy 165, 112927. doi:10.1016/j.enpol.2022.112927
Keywords: digital economy, carbon emissions, comparative study, yellow river basin, yangtze river economic belt
Citation: Lin Z, Liu H, Shi L and Cui D (2025) Seeing green high-quality development: how the digital economy affects carbon emissions in the yellow river basin and yangtze river economic belt. Front. Environ. Sci. 13:1543211. doi: 10.3389/fenvs.2025.1543211
Received: 11 December 2024; Accepted: 28 February 2025;
Published: 26 March 2025.
Edited by:
Martin Siegert, University of Exeter, United KingdomReviewed by:
Irina Georgescu, Bucharest Academy of Economic Studies, RomaniaCopyright © 2025 Lin, Liu, Shi and Cui. This is an open-access article distributed under the terms of the Creative Commons Attribution License (CC BY). The use, distribution or reproduction in other forums is permitted, provided the original author(s) and the copyright owner(s) are credited and that the original publication in this journal is cited, in accordance with accepted academic practice. No use, distribution or reproduction is permitted which does not comply with these terms.
*Correspondence: Hainan Liu, bGl1aGFpbmFuQHNkanp1LmVkdS5jbg==
Disclaimer: All claims expressed in this article are solely those of the authors and do not necessarily represent those of their affiliated organizations, or those of the publisher, the editors and the reviewers. Any product that may be evaluated in this article or claim that may be made by its manufacturer is not guaranteed or endorsed by the publisher.
Research integrity at Frontiers
Learn more about the work of our research integrity team to safeguard the quality of each article we publish.