
95% of researchers rate our articles as excellent or good
Learn more about the work of our research integrity team to safeguard the quality of each article we publish.
Find out more
ORIGINAL RESEARCH article
Front. Environ. Sci. , 19 March 2025
Sec. Water and Wastewater Management
Volume 13 - 2025 | https://doi.org/10.3389/fenvs.2025.1543143
 Jing-An Lin1,2
 Nils Volkenborn1,2*
Woodchip-based media are increasingly used to remove excess nitrate from groundwater but data on nitrogen removal rates and greenhouse gas formation for different woodchip types, nitrogen loading and temperatures is limited. Here, we present data from a 1-year long column experiment in which the nitrogen removal performance of 4 different aged woodchip media was assessed for a range of nitrogen loading rates at different temperatures. Nitrate removal and greenhouse gas formation (CH4, N2O) were measured under nitrate-replete (excess nitrate in effluent), nitrate-limited (complete nitrate removal) and nitrate-deplete conditions (no nitrate in influent). At 14°C, nitrate removal rates were highest in oak (4.3 g N m−3 day−1) followed by maple/cherry (3.2 g N m−3 day−1), oak/pine (2.2 g N m−3 day−1) and pine (0.4 g N m−3 day−1). At 20°C, nitrate removal rates increased by a factor of 2.6 times in oak, oak/pine and maple/cherry and by a factor of 6 in pine. CH4 and N2O typically did not co-occur in effluent. Maximal effluent CH4 concentrations were observed under nitrate-deplete conditions and CH4 formation rates increased with temperature. In contrast, concentrations of N2O, a denitrification intermediate, were only significantly elevated in partially denitrified effluent under nitrate-replete conditions. The data provided here can help to make more informed decisions on the optimal design of woodchip-based nitrate removing bioreactors to maximize nitrate removal and minimize greenhouse gases formation associated with unavoidable under- and over-treatment of nitrate.
Anthropogenic nitrogen has led to the eutrophication of coastal waters worldwide (Howarth and Marino, 2006; Malone and Newton, 2020; Nixon, 1995). Submarine groundwater discharge can be a major pathway of nitrogen input (Paerl, 1997; Rodellas et al., 2015; Slomp and Van Cappellen, 2004). Denitrifying permeable reactive barriers (PRBs) that intercept groundwater nitrate plumes before they enter surface water are a promising approach to help reduce nitrogen loading in coastal waters (Graffam et al., 2020; Robertson et al., 2008; Schipper and Vojvodic-Vukovic, 2001). Unlike ion exchange or membrane treatment technologies, which require water to be pumped and are therefore are energy intensive (Chung et al., 2007; Huang et al., 2020), PRBs operate passively, making them a cost-effective alternative for long-term nitrate removal.
Woodchips are an inexpensive and readily available medium for PRBs and provide a lasting carbon source for heterotrophic denitrifying soil bacteria (Christianson et al., 2017; Lopez-Ponnada et al., 2017). As groundwater flows into the woodchip media, oxygen (O2) is quickly consumed by aerobic heterotrophic bacteria, and - when nitrate is present - denitrification becomes the dominant pathway of organic matter mineralization, converting problematic nitrate into inert dinitrogen gas (N2). Woodchip-based media have been found to also remove other pollutants such as perchlorate (Roberston et al., 2008), some PPCPs (Clyde et al., 2021), and pesticides (Wrightwood et al., 2021; Ewere et al., 2024).
The nitrogen removal effectiveness of woodchip-based bioreactors is well established (Christianson et al., 2012; Manca et al., 2021; Robertson and Cherry, 1995; Schipper and Vojvodić-Vuković, 1998), but the efficiency depends on many factors, including woodchip type, age and size, media porosity, and is furthermore temperature dependent (Addy et al., 2016; Lopez-Ponnada et al., 2017). Few studies have quantified the temperature dependency of nitrogen removal rates of different woodchip media (Cameron and Schipper, 2010; Robertson et al., 2008; Schmidt and Clark, 2013).
Knowledge of nitrate removal rates is important to make informed decisions about the design of nitrogen removing bioreactors. For example, the thickness of a PRB should be chosen to allow for the complete removal of nitrate by providing sufficiently long hydraulic retention times (HRTs) for a given groundwater nitrogen concentration and groundwater velocity. Theoretically, the optimal PRB thickness is one that depletes nitrate and completes denitrification without providing excess total organic carbon (TOC), which could stimulate alternative anaerobic organic pathways, specifically methanogenesis.
In reality however, groundwater velocities can vary seasonally or short-term, such as seasonal aquifer recharge or after heavy precipitation events (Wittenberg et al., 2019), or with tides at nearshore locations (Graffam et al., 2020). Groundwater nitrate concentrations often vary in space and time (Santos et al., 2008; Sharples et al., 2007) and microbial rates can vary seasonally due to changes in groundwater temperatures (Hassanpour et al., 2017). Given these variations in nitrogen loading and microbial activity, some degree of under- or overtreatment by a PRB with fixed and uniform thickness is unavoidable.
Undertreatment occurs when nitrate is not completely removed, and denitrification intermediates, specifically the greenhouse gas (GHG) nitrous oxide (N2O) may be released from bioreactors. Conversely, overtreatment occurs when nitrate becomes depleted within the woodchip media and - under freshwater conditions - methanogenesis can become the dominant organic matter mineralization pathway. The trade-off between under- and overtreatment in relation to GHG release under nitrate-replete and nitrogen-limited conditions is poorly constrained, but a better assessment could help to inform PRB or bioreactor design.
Here, we present insights from a 1-year long laboratory column experiment in which nitrogen removal and GHG formation were assessed for four different types of aged woodchip media at three different temperatures. Triplicates of 1-m-long columns filled with oak, maple/cherry mix, oak/pine mix, and pine woodchips were exposed to a range of hydraulic loading rates and influent nitrate concentrations establishing nitrate-replete (excess nitrate in effluent), nitrate-limited (no nitrate in effluent), and nitrate-deplete (no nitrate in influent) conditions to determine nitrate removal and GHG production rates under these contrasting conditions. We hypothesized that CH4 and N2O concentrations in column effluent would be minimal when nitrate loading matches the nitrate removal capacity of the woodchip media and increasing CH4 and N2O concentrations under nitrate-deplete and nitrate-replete conditions, respectively. The data presented here will help optimizing PRB design, by considering the trade-offs of under- and overtreatment of groundwater nitrogen plumes.
Four types of woodchips (oak, maple/cherry mix, oak/pine mix and pine, chip size 4–20 mm) were retrieved in 2019 from woodchip-boxes which had been deployed since 2015 in a pond in Easthampton (NY, United States). In an area with appreciable groundwater discharge so that discharged water passed the woodchip boxes before being released into the overlying water. The woodchips used in this study were therefore aged under water-saturated and likely anoxic conditions for multiple years.
Transparent polycarbonate cores (length 1.1 m, ID 3.85 cm) were filled with an average of 967 g (range 945–991 g, wet weight) of the woodchip - pea gravel mixtures (2:1 by volume). Three replicates were set up for each woodchip type (Figure 1) and columns were set up in a temperature-controlled room. Influent was supplied bottom-up using a computer-controlled multi-head peristaltic pump (Masterflex 7550).
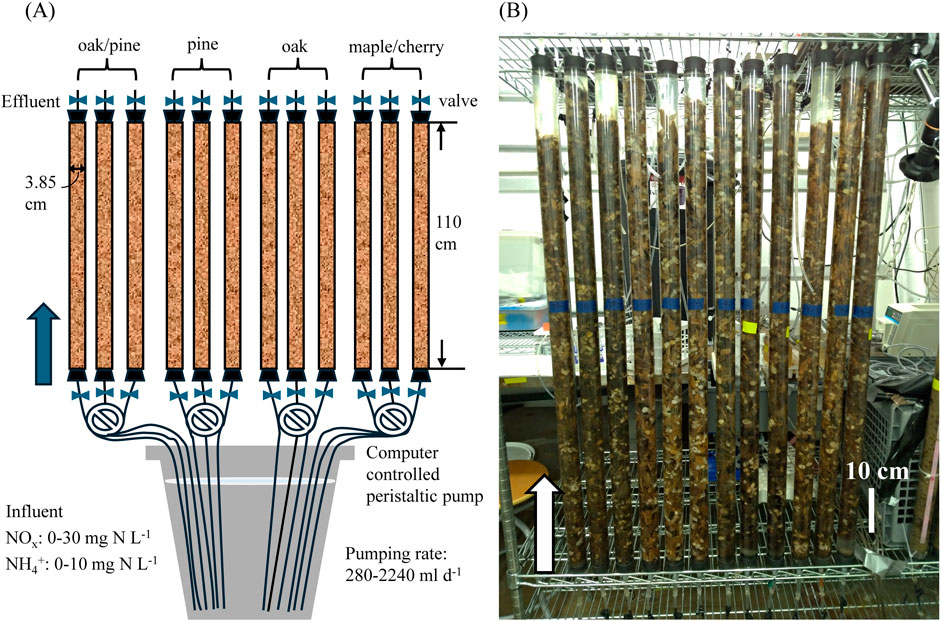
Figure 1. (A) Schematic and (B) picture of the experimental setup of the 1-year long column experiment with triplicates of different types of aged woodchip media (oak/pine, pine, oak, maple/cherry) mixed with pea gravel (2:1 by volume). Influent was applied bottom up with a multi-head peristaltic pump at rates between 280 mL d−1 column−1 to establish hydraulic retention times between 0.25 and 2 days.
The experiment was started at a temperature of 20°C before a subset of hydraulic loading and nitrate concentration combinations were assessed at 7°C and 14°C. Rates of nitrate-nitrite (NOx) removal and TOC, N2O and CH4 production were estimated from the differences between influent and effluent concentrations.
The experiment started in March 2020. Due to a COVID-related university shutdown, the delivery pump was stopped a few weeks later and pumping was resumed in June 2020. During this initial “hibernation” period, the columns remained water-saturated, except for three columns (two oak and one maple/cherry) that drained. Water saturation was re-established in these columns 1 week before the experiment was restarted.
Over the course of the experiment, influent NOx concentrations and pumping rates were varied between 0 and 30 mg N L−1 and 280–2,240 mL column−1 d−1 (Supplementary Table 1), corresponding to theoretical HRTs of 2.0–0.25 days and linear groundwater velocities of 55–440 cm day−1. The selected NOx concentrations (up to 30 mg N L−1) are representative for groundwater NOx concentrations in polluted aquifers (Burow et al., 2010). The simulated groundwater velocities cover the range that has been documented in nearshore aquifers (Buxton and Modica, 1992) and resulted in HRTs similar to HRTs applied in previous column and bioreactor studies (Healy et al., 2012; Hoover et al., 2016; Robertson et al., 2008). Since groundwater velocities at nearshore locations can be influenced by tides and vary over time (Graffam et al., 2020), a dynamic HRT treatment was included by cycling between 1-day, 0.5-day, 1-day and 2-day HRT every 3 h, resulting in an average HRT of 0.9 days.
During the initial 28 days, the columns received a constant supply of sodium nitrate solution at a concentration of 25 mg N L−1. Starting on Day 28, ammonium (NH4+) in the form of ammonium chloride was added at a concentration of 10 mg N L−1 in addition to NOx to assess nitrogen transformations other than denitrification within the woodchip media.
The experiment was conducted at three different temperatures: 20°C for the first 213 days (Day 0–213), 7°C for the following 96 days (Day 214–309), and 14°C for the final 42 days (Day 310–351). After each temperature change, the columns were supplied with influent for at least 2 weeks before samples were collected.
The selected combinations of NOx influent concentrations and pumping rates (and corresponding linear velocities and HRTs) allowed us to establish three distinct operational settings and experimental conditions for different woodchip type media at different temperatures, defined and motivated as follows:
NOx-limited conditions were established when NOx was completely removed within columns. For this study, we defined NOx-limited conditions as times when NOx was applied and effluent NOx concentrations were <1 mg N L−1. As our setup did not allow for sampling along the flow path within columns, it remains speculative how much of a column was NOx-limited. Despite this uncertainty, these settings can be viewed as representative of field conditions, where NOx depletion may occur in downstream portions of the woodchip media.
NOx-replete conditions were established when “excess” NOx was present in effluent. This was achieved by increasing pumping rates (lowering HRT) and/or increasing influent NOx concentrations. NOx removal rates under NOx-replete conditions were used to assess maximal NOx removal rates, where NOx would not limit denitrification. Such conditions can occur in in-ground systems when a PRB is too thin, groundwater with more elevated NOx concentrations passes through, or groundwater velocities increase.
NOx-deplete conditions were established by not adding NOx and NH4+ to the influent water during specific time periods (Day 130–170 at 20°C, Day 294–309 at 7°C, and Day 310–324 at 14°C). NOx-deplete conditions were used to determine maximal CH4 formation rates. While it is unlikely that NOx-deplete conditions occur in the field, such conditions may be encountered in the downstream portions of a PRB when incoming NOx is low and/or groundwater velocities decrease.
Influent and effluent samples (15–65 mL) for the analysis of nitrogen (NOx and NH4+) and TOC were collected on a weekly or biweekly basis. When pumping rates were changed, samples were collected after the water in columns was replaced at least 3 times. 500 mL of effluent was collected for CH4 and N2O analyses on day 55, 93, 107, 113, 129, 170, 309, and 324 in 1-L Tedlar bags connected to the effluent tubing.
Effluent volumes collected over a 21-h period (Day 352–353) were used to measure gas volume discharges, derived from the difference between the expected volume (multiplication of pumping rate and time) and collected volume.
At the end of the experiment, primary porosity (drainable water) and the volume of gas filled pore spaces were determined for each column. First, the columns were fully drained to determine the volume occupied by drainable water. Second, a rhodamine solution was injected bottom-up, and time-lapse images were taken at 60-s intervals to determine the time it took for the dye to appear in the effluent. The tracer solution was prepared by adding 1.4 mL of the stock solution (20% Rhodamine WT) in 14 L of DI water. Effluent tubes were illuminated with an array of blue-light emitting diodes; further details are provided in (Graffam et al., 2020). The time required for the tracer to appear in the effluent, along with the pumping rate during injection, was used to calculate the volume of water in a fully water-saturated column (i.e., primary porosity). The difference between the initial drain and primary porosity was used to determine gas-filled pore space at the time of the initial drain.
These column-specific data were used to derive the true HRTs for a given pumping rate in each column and assess whether variations in NOx removal were related to these differences in the media’s hydraulic properties.
Nitrogen (NOx, NH4+) and TOC were analyzed spectrophotometrically. Nitrogen was measured using Lachat Quikchem 8500 Series 2 autoanalyzer using standard methods (EPA 350.1 and 353.2). TOC was measured using Shimadzu TOC autoanalyzer using standard methods (EPA 415.3). To analyze dissolved GHG samples, 10 mL of sample was equilibrated with a N2 headspace within a 60-mL syringe for at least 30 min. The headspace gas samples were then analyzed with a Shimadzu gas chromatograph (GC-2014). The concentrations of dissolved gases were calculated using an equation derived from Roberts and Shiller (2015) and the solubility constants for CH4 and N2O, as detailed in Wiesenburg and Guinasso Jr (1979) and Weiss and Price (1980), respectively. In addition, pH was measured for influent and effluent samples.
NOx removal rates and net GHG (CH4, N2O) and TOC production rates were calculated based on the difference between influent and effluent concentrations, multiplied by the pumping rate during sampling, and divided by column volume. Net GHG fluxes were calculated similarly but divided by the column’s cross-sectional area.
Temperature dependency of NOx removal and CH4 production rates were assessed using Q10 values (Davidson et al., 2006), which describes how much a reaction rate increases with a 10°C temperature rise, according to Equation 1.
where R = Reaction rate and T1 and T2 are two different temperatures.
To assess when steady-state conditions were established at the onset of the experiment, repeated measures ANOVA (RM-ANOVA) was used to analyze the impact of woodchip type and time on NOx removal rates during the initial 45 days of the experiment. Post-Hoc pairwise tests (Tukey Honestly Significant Difference) were used to determine the day after which NOx removal rates were statistically similar on consecutive sampling days.
Two-factorial ANOVA was used to assess the impact of 1) HRT, woodchip type and the interaction term and 2) temperature, woodchip type and the interaction term on steady-state NOx removal rates, and CH4 and TOC production (differences between effluent and influent). One-factorial ANOVA was used to assess the differences of porosity and air volume between different woodchip types.
The analyses of the effects of HRT and woodchip type on NOx removal rate included the period when the temperature was held at 20°C. Whenever rate estimates were available from multiple time points, the average rate of each column was used.
For the analysis of temperature and woodchip type effects on NOx removal rates, data collected at 1-day HRT under NOx-replete conditions was included, making sure that rates were not limited by NOx availability. Whenever rate estimates were available from multiple time points, the average rate of each column was used.
The analysis of the effects of temperature and woodchip type on TOC and CH4 production included data collected under NOx-deplete conditions, thus representing maximal net production.
Levene’s test was used to verify the homoscedasticity of data across different woodchip types, HRTs and temperatures. To meet homoscedasticity criteria, NOx removal rate data for analysis of HRT × woodchip type was square root transformed, while NOx removal rate and CH4 production data for analysis of temperature × woodchip type were transformed using fourth root. TOC production data for analysis of temperature × woodchip type was log-transformed. If any estimated rates were negative for one or more columns, a value of 1 was added to all data prior to transformation.
When experimental factors or the interaction between factors had a significant effect, post-hoc pairwise tests (Tukey Honestly Significant Difference) were used to identify differences between treatments. Statistical analyses for NOx removal rate and CH4 production were performed using TIBCO Statistica™ 14.0.0, while analyses for TOC production, porosity and air volume were performed using Python package ‘statsmodels’.
During the first 45 days of the experiment with a 1-day HRT at 20°C, NOx-replete conditions were maintained in most columns (Figure 2A). NOx removal rates significantly differed between woodchip types (RM-ANOVA, F (3, 8) = 11.0, p < 0.01), due to significantly lower NOx removal in pine than all other woodchip types (post-hoc p < 0.01). NOx removal rates varied significantly over time across all woodchip types (F (6, 48) = 106.9, p < 0.001) but became stable on day 35 as indicated by insignificant pairwise comparison between sampling points after day 35 (post-hoc p > 0.96).

Figure 2. (A) Effluent NOx concentrations (mean ± standard deviation (SD), n = 3) and (B) NOx removal rates (mean ± SD, n = 3) of different woodchip media over time under NOx-replete and NOx-deplete conditions and varied HRTs (0.25–2 days). Woodchip types are indicated by different marker shapes. Black line represents influent NOx concentrations. Over the course of the 1-year long experiment the temperature was changed from 20°C to 7°C to 14°C, indicated by different background colors. Dashed lines indicate times when HRTs were changed. Dyn represents dynamic HRT with an average of 0.9 days.
Average NOx removal (expressed as concentration declines) increased from 18.8 mg N L−1 prior to day 35 to 19.8 mg N L−1 after day 35 in oak columns at 1-day HRT. In contrast, NOx removal decreased from 22.8 to 17.3 mg N L−1 in maple/cherry columns, from 19.6 to 13.3 mg N L−1 in oak/pine columns, and from 13.7 to 5.6 mg N L−1 in pine columns. The two oak columns that dried out during the hibernation period exhibited consistently higher NOx removal rates than the undisturbed column. Similarly, the maple/cherry column that dried out during the hibernation period exhibited 8% higher NOx removal rate compared to the other two maple/cherry columns during the first 21 days but consistently showed a lower removal rate thereafter.
Once stable nitrogen removal rates were established (Day 35), HRTs were varied between 0.25 and 2 days. NOx removal rates significantly varied as a function of HRT (F (3, 32) = 20.3, p < 0.001, Figure 2B) and woodchip type (F (3, 32) = 45.9, p < 0.001) without a significant interaction between both factors (F (9, 32) = 0.63, p = 0.76).
NOx removal rates were significantly higher at 1-day HRT than at HRTs of 0.5 or 0.25 days (post-hoc p < 0.05), while NOx removal rates at dynamic HRT were similar to those at a 1-day HRT (post-hoc, p = 0.79). At 20°C, NOx-replete conditions were maintained at HRTs of 0.25, 0.5 and 1 day for most of the columns, while NOx-limited conditions were established in all woodchip media at 2-day HRT, except pine (Figure 2).
NOx removal rates in oak (7.0 g N m−3 d−1) and maple/cherry (6.2 g N m−3 d−1) were similar (post-hoc p = 0.64) but significantly higher than in oak/pine (4.7 g N m−3 d−1; post-hoc p < 0.01) and pine (1.3 g N m−3 d−1; post-hoc p < 0.001). NOx removal rates were 9.0, 7.9, 6.1, and 2.6 g N m−3 d−1 at 1-day HRT, 6.8, 6.3, 4.4, and 0.6 g N m-3 d-1 at 0.5-day HRT, 3.2, 3.0, 2.8, and 0.5 g N m−3 d−1 at 0.25-day HRT for oak, maple/cherry, oak/pine, and pine, respectively (Supplementary Table 1). NOx removal rates at dynamic HRT were 9.0, 7.5, 5.5 and 1.6 g N m−3 d−1 for oak, maple/cherry, oak/pine and pine, respectively.
Temperature had a significant impact on NOx removal rates across woodchip types (F (2, 24) = 261.6, p < 0.001, Figure 3) with significantly higher rates at 20°C than at 14°C (post-hoc p < 0.001) and significantly higher rates at 14°C than at 7°C (post-hoc p < 0.001).
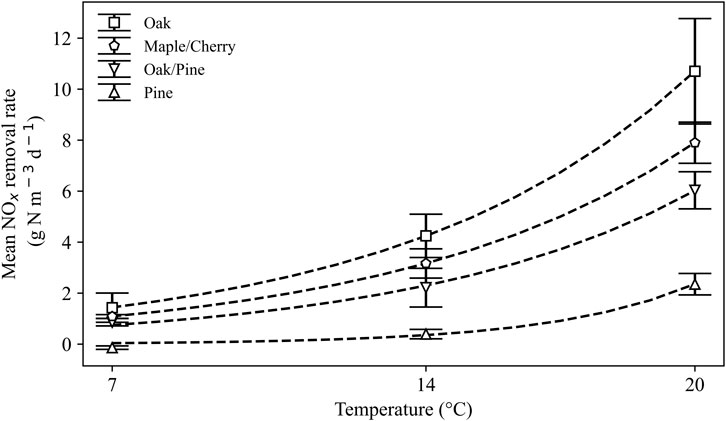
Figure 3. NOx removal rates (mean ± SD, n = 3) in different woodchip type media at 7, 14, and 20°C under NOx -replete conditions, i.e., >1 mg N L−1 in effluent.
Across temperatures, NOx removal rates were dependent on woodchip type (F (3, 24) = 94.4, p < 0.001) without a significant interaction between woodchip type and temperature (F (6, 24) = 2.3, p = 0.07).
At 20°C, the average NOx removal rates from the final five measurements (Day 175–213) were 10.7, 7.9, 6.0 and 2.4 g N m−3 d−1 for oak, maple/cherry, oak/pine and pine, respectively (Figure 3), with concentration declines of 23.5, 17.4, 13.3 and 5.2 mg N L−1 over the 110 cm long columns.
At 14°C, NOx-replete conditions were maintained at 1-day and 2-day HRT. At 1-day HRT, NOx removal rates were 4.3, 3.2, 2.2 and 0.4 g N m−3 d−1 for oak, maple/cherry, oak/pine and pine, respectively (Figure 3), with concentration declines of 9.3, 7.0, 4.9, and 0.9 mg N L−1. At 2-day HRT, NOx removal rates were 4.7, 3.5, 3.1 and 0.6 g N m−3 d−1 for oak, maple/cherry, oak/pine and pine, respectively.
At 7°C, NOx-replete conditions were maintained in all woodchip types at all tested HRTs. At 1-day HRT, NOx removal rates were 1.4, 1.1, 0.9 and −0.1 g N m−3 d−1 for oak, maple/cherry, oak/pine and pine, respectively (Figure 3), with concentration declines of 3.1, 2.4, 1.9, and −0.3 mg N L−1. At 2-day HRT, NOx removal rates were 1.8, 1.3, 1.1 and −0.1 g N m−3 d−1 for oak, maple/cherry, oak/pine and pine, respectively.
The columns consistently received an average NH4+ supply of 10 mg N L−1 from Day 29, with exceptions of periods without nitrogen supply. NH4+ exhibited relatively modest consumption across all columns (Supplementary Figure 1). For example, at 20°C, the average consumption ranged from 0.3 to 2.8 mg N L−1 across different HRTs. At 14°C, NH4+ consumption ranged between 0.8 and 2.5 mg N L−1, while at 7°C, NH4+ exhibited both consumption and production, with < 1.5 mg N L−1 concentration differences between influent and effluent.
Under NOx-deplete conditions, effluent CH4 concentrations were highly temperature-dependent and strongly varied between woodchip types (Figure 4A). Effluent CH4 concentrations were significantly affected by woodchip type (F (3, 24) = 39.4, p < 0.001) and temperature (F (2, 24) = 97.0, p < 0.001), while the interaction of woodchip type and temperature was barely significant (F (6, 24) = 2.4, p = 0.06). CH4 effluent concentrations significantly differed across temperatures in all tested woodchip types (post-hoc p < 0.05) in the order of maple/cherry > oak/pine > oak > pine.

Figure 4. (A) Effluent CH4 (mean ± standard error (SE), n = 3) and (B) TOC concentrations (mean ± SD, n = 3) in different woodchip type media at 2-day HRT under NOx-deplete conditions at 7, 14, and 20°C. Black points represent influent CH4 or TOC concentrations.
At 20°C, effluent CH4 concentrations were 1.0, 3.9, 2.9 and 0.4 mg C L−1 for oak, maple/cherry, oak/pine and pine, respectively, corresponding to CH4 production rates of 0.2, 0.9, 0.6 and 0.08 g C m−3 d−1 (Supplementary Table 2). At 14°C, CH4 concentrations were 0.2, 0.7, 0.3 and 0.1 mg C L−1 for oak, maple/cherry, oak/pine and pine, respectively, with CH4 production rates of 0.04, 0.2, 0.07 and 0.02 g C m−3 d−1. At 7°C, CH4 concentrations were 0.06, 0.3, 0.09 and 0.002 mg C L−1 for oak, maple/cherry, oak/pine and pine, respectively, corresponding to CH4 production rates of 0.01, 0.08, 0.02 and 0.0002 g C m−3 d−1.
Under NOx-replete and NOx-limited conditions at 20°C, effluent CH4 concentrations were much lower than under NOx-limited conditions and inversely correlated with effluent NOx concentrations (Figure 5A), i.e., elevated effluent CH4 concentrations were only evident when NOx was limited (effluent <1 mg N L−1). At 0.5-day, 0.25-day and dynamic HRTs, columns remained NOx-replete and CH4 concentrations were always below 0.4 mg C L−1. Average effluent CH4 concentrations for oak, maple/cherry and oak/pine were 0.7, 2.2, and 1.4 mg C L−1 (Supplementary Table 3) at 2-day HRT with NOx-limited conditions and 0.4, 0.9, and 0.4 at 1-day HRT with NOx-replete (oak/pine, 1 maple/cherry column) or NOx-limited conditions (oak and 2 of the maple/cherry columns). Pine columns never became NOx-limited and average effluent CH4 concentrations remained below 0.005 mg C L−1.
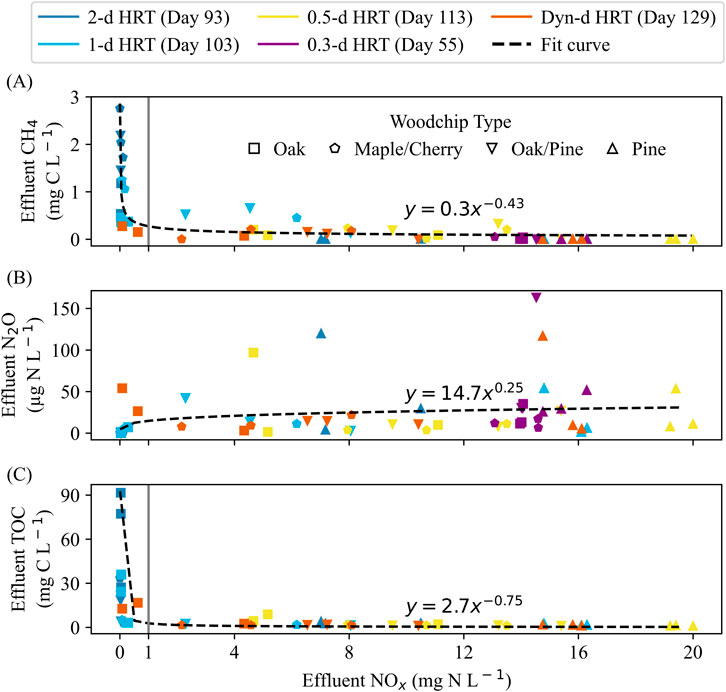
Figure 5. The relationships between effluent NOx concentrations and (A) CH4 (B) N2O, and (C) TOC concentrations under NOx-replete and NOx-limited conditions at 20°C. Colors represent different HRTs applied over time, and woodchip types are indicated by different symbols. Dashed lines represent curve fits to the data, and the black solid line indicates an effluent NOx concentration of 1 mg N L−1.
Influent N2O concentrations ranged from 0.61 to 0.86 μg N L−1, with N2O being either consumed or produced throughout the experiment.
Elevated N2O concentrations in effluent were detected only under NOx-replete conditions. The relationship between effluent NOx and effluent N2O was relatively weak (R2 = 0.08, Figure 5B), but effluent N2O concentrations remained consistently low under NOx-limited conditions. For example, at 2-day HRT, effluent N2O concentrations were below 0.3 μg N L−1. When NOx was limited at 1-day HRT, effluent N2O levels from oak and maple/cherry columns were below 7 μg N L−1.
Maximum average N2O concentrations were 36.1, 13.0, 74.6, and 51.2 μg N L−1 for oak, maple/cherry, oak/pine, and pine, respectively, without a consistent relationship with HRTs (Supplementary Table 3). The highest N2O production rates were observed at a 0.25-day HRT, with average effluent N2O concentrations reaching 19.9, 11.9, 74.6, and 35.6 μg N L−1 for oak, maple/cherry, oak/pine, and pine, respectively, corresponding to N2O production rates of 34.0, 19.8, 130.7, and 61.7 mg N m−3 d−1.
Influent TOC concentrations varied between 0.9 and 2.3 mg C L−1, and TOC concentrations generally increased in the columns throughout the experiment. Under NOx-deplete conditions at 20°C, TOC concentrations increased by 44.3, 4.5, 1.9, and 1.4 mg C L−1 in oak, maple/cherry, oak/pine, and pine columns, respectively (Figure 4B), corresponding to TOC production rates of 10.1, 1.0, 0.4, and 0.3 g C m−3 d−1 (Supplementary Table 4). At 14°C, TOC concentrations increased by 21.6, 8.5, 7.7, and 0.6 mg C L−1 for oak, maple/cherry, oak/pine, and pine, respectively, yielding production rates of 4.9, 1.9, 1.7, and 0.1 g C m−3 d−1. At 7°C, TOC concentrations increased by 6.3, 3.0, 1.7, and 0.5 mg C L−1 for oak, maple/cherry, oak/pine, and pine, respectively, corresponding to production rates of 1.4, 0.7, 0.4, and 0.1 g C m−3 d−1.
TOC production under NOx-deplete conditions was significantly affected by the interaction between temperature and woodchip type (F (6, 24) = 8.6, p < 0.001). This interactive effect was characterized by pronounced increase in TOC production with temperature in oak columns (Figure 4B) with mean effluent concentrations of 8 mg C L−1 at 7°C, 22.8 mg C L−1 at 14°C, and 45.7 mg C L−1 at 20°C. In contrast, mean effluent TOC concentrations in all other woodchip types at all temperatures remained <10 mg C L-1. TOC production in maple/cherry and oak/pine columns were highest at the intermediate temperature of 14°C. In pine, mean effluent TOC concentrations remained <2.8 mg C L−1 across temperatures (Figure 4B).
Under NOx-replete and NOx-limited conditions at 20°C, effluent TOC concentrations were inversely correlated with effluent NOx concentrations (Figure 5C) and were only >8.8 mg C L−1 under NOx-limited conditions (effluent NOx < 1 mg N L−1). At 2-day HRT, mean effluent TOC concentrations were 65.4, 20.6, 14.7, and 3.2 mg C L−1 for oak, maple/cherry, oak/pine, and pine, respectively, corresponding to TOC production rates of 14.6, 4.4, 3.1, and 0.5 g C m−3 d−1 (Supplementary Table 4). These values were higher than those observed under NOx-deplete conditions at 20°C. At 1-day HRT (Day 107), mean effluent TOC concentrations were 21.2, 3.2, 2.2, and 1.8 mg C L−1 for oak, maple/cherry, oak/pine, and pine, respectively, with TOC production rates of 9.2, 1.0, 0.6, and 0.4 g C m−3 d−1. At 0.5-day and dynamic HRTs, effluent TOC concentrations remained below 2 mg C L−1 for maple/cherry, oak/pine and pine, and mean TOC production rates were lower than 0.5 g C m−3 d−1. Mean effluent TOC concentrations of oak were 5.1 and 10.7 mg C L−1 at 0.5-day and dynamic HRTs, corresponding to TOC production rates of 3.8 and 4.9 g C m−3 d−1, respectively (Supplementary Table 4).
Primary porosity varied between 0.35 and 0.52, with an average value of 0.45 across all columns (Table 1). Significant differences in primary porosity were observed among different woodchip types (F (3, 9) = 7.7, p < 0.01). The average porosity of oak (0.38) was significantly lower than that of oak/pine (0.48) and pine (0.49) (post-hoc, p < 0.05), and barely significantly lower than maple/cherry (0.46) (post-hoc, p = 0.06). The porosities of maple/cherry, oak/pine, and pine were similar (post-hoc, p > 0.6). The differences in HRTs between columns were influenced by the variations in porosities, accounting for up to 37% of the observed differences from the average HRTs (Supplementary Table 1).
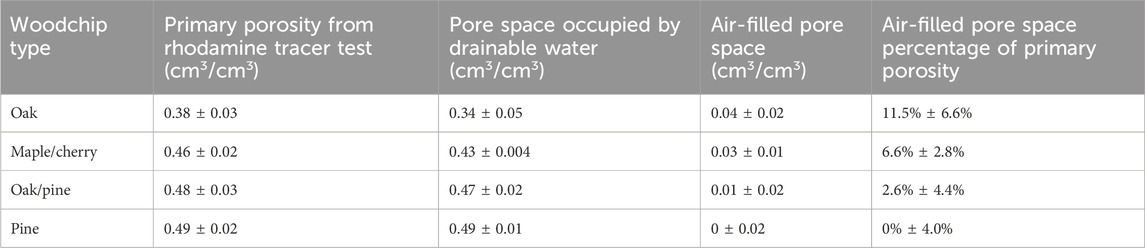
Table 1. Primary porosity, pore space occupied by drainable water, and air filled pore space in relation to primary porosity (mean ± SD, n = 3) for different woodchip media.
Air-filled pore spaces ranged between 0 and 0.07, representing 11.5% ± 6.6%, 6.6% ± 2.8%, 2.6% ± 4.4%, and 0% ± 4.0% of primary porosity for oak, maple/cherry, oak/pine, and pine, respectively.
The oak columns with porosities of 0.35 and 0.38 exhibited on average 1.4-fold higher NOx removal rates than the third less densely packed oak column with a porosity of 0.42 at 20°C and 14°C, and 2.3-fold higher NOx removal rates at 7°C.
All woodchip types continued to remove NOx throughout this 1-year long experiment after they had been deployed in the field for 5 years. A previous study has reported sustained NOx removal by woodchips for over 15 years (Robertson et al., 2008). At the onset of the experiment, NOx removal rates were elevated before stabilizing after approximately 1 month (Figure 2). Stagnant and presumably anoxic conditions without flow during the 3 months prior to the start of the experiment likely resulted in a buildup of labile organic matter, which promoted NOx removal during the first weeks. Interestingly, columns that dried out during the experimental setup initially showed higher NOx removal rates than those that remained water-saturated, suggesting that unsaturated, oxic conditions amplified this phenomenon. This is consistent to the study (Hathaway et al., 2017), in which aerobic portion of the bioreactor facilitate carbon degradation, enhancing NOx removal rates. NOx removing activity re-established within 10 days, indicating a high resilience of the denitrifying microbial community to long-term NOx-deplete conditions in water-saturated columns as well as to exposure to O2 in the accidentally drained columns.
Once NOx removal stabilized, NOx removal rates were consistently higher in hardwood (oak and maple/cherry) than in softwood (pine), and intermediate in the hardwood/softwood mixture (oak/pine). Under NOx-replete conditions at 20°C, NOx removal rates in hardwood (mean of oak and maple/cherry: 9.3 g N m−3 d−1) and softwood (pine: 2.4 g N m−3 d−1) were within the range reported in previous studies conducted at similar temperatures (i.e., 2.9–21 g N m−3 d−1 for hardwood and 2.4–16.1 g N m−3 d−1 for softwood; Table 2).
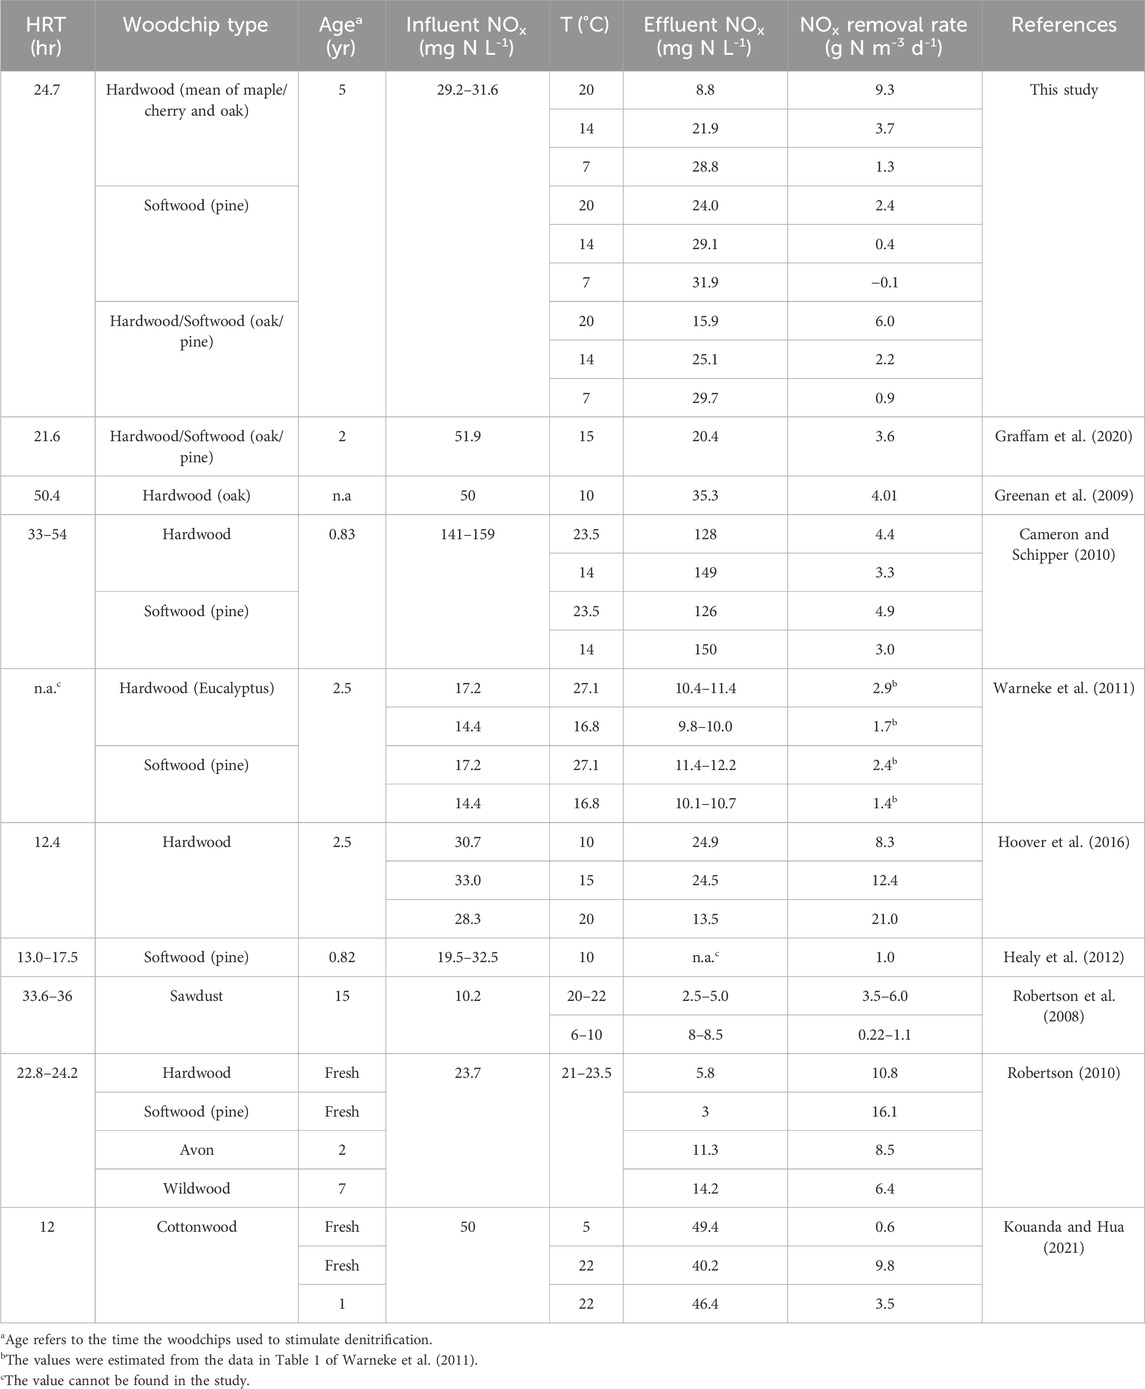
Table 2. NOx removal rates reported from woodchip column or barrel studies under different operational settings of HRT, woodchip type and age, influent NOx and temperature.
These differences in NOx removal between woodchip media were consistent across temperatures. At 14°C, NOx removal rates for hardwood (3.7 g N m−3 d−1) and softwood (0.4 g N m−3 d−1) were close to the range reported for temperatures between 10°C and 17°C (1.7–12.4 g N m−3 d−1 for hardwood and 1.0–3.0 g N m−3 d−1 for softwood; Table 2). Average NOx removal rates at 7°C were 1.3 g N m−3 d−1 in hardwood and 0.9 g N m−3 d−1 in the hardwood/softwood mixture, while there was no NOx removal in pine. These rates are close to the range of 0.22–1.1 g N m−3 d−1 reported for sawdust at temperatures between 6°C and 10°C (Robertson et al., 2008).
Previous studies report inconclusive results with respect to NOx removal rates by hard-versus softwood woodchips (Table 2), including no significant differences in between hardwoods and softwoods (Cameron and Schipper, 2010), or higher rates in softwood than hardwood (Robertson, 2010), suggesting that factors other than woodchip type, such as woodchip age, surface area, and pore structure, may influence NOx removal rates (Halaburka et al., 2017; Chen et al., 2025). Softwood, such as pine, generally has a lower density, which facilitates greater O2 penetration, leading to higher decay rates with initially elevated NOx removal but much faster carbon depletion (Addy et al., 2016). Thus, the age of woodchips may explain the lower NOx removal rates observed for softwood in our study, because pine woodchips in our study had been deployed for 5 years, while pine woodchips used in studies by Cameron and Schipper (2010) and Robertson (2010) were <10 months old.
NOx removal rates were strongly temperature dependent. The Q10 values of oak, maple/cherry and oak/pine were on average 4.5–4.7 (Table 3), which is similar to Q10 value of 4.7 reported by Schmidt and Clark (2013) and 4.95 reported by Robertson et al. (2008), but higher than values of 1.3–2.9 reported by Cameron and Schipper (2010) and Hoover et al. (2016). For pine, the Q10 value derived from the temperature range between 14°C and 20°C was 20.3, one order magnitude higher than Q10 value of 1.2 or 2 reported for pine (Elgood et al., 2010; Warneke et al., 2011). This high Q10 value was driven by the very low NOx removal rate in pine at 14°C. Apparently, denitrification in aged pine woodchips used in our study was highly temperature dependent and completely ceased at 7°C (Figure 3). Low NOx removal by pine at low temperatures is consistent with previous findings (Schmidt and Clark, 2013). Pine woodchips in our study (5 years) were older than in the studies by Elgood et al. (2010) (2 years), and Warnecke et al. (2011) (2.5 years), which may explain why appreciable NOx removal in our study was only observed at 20°C.
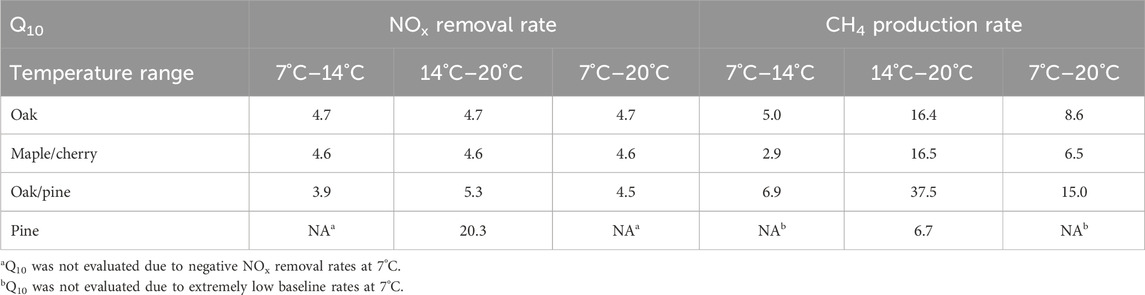
Table 3. Q10 values of NOx removal rates and CH4 production rates across different temperature ranges for various woodchip media. They represent the factor by which the reported rates would increase when the temperature increases by 10°C.
Under NOx-replete conditions, effluent TOC concentrations always remained <15 mg C L−1 (Figure 5C). TOC concentrations increased under NOx-limited conditions, suggesting the occurrence of fermentation, which produces soluble organic compounds (Tugtas et al., 2010). Low TOC release under NOx-deplete conditions from all woodchip media (Figure 4B) was likely the major reason for the low NOx-removal rates at 7°C.
HRT also had a significant effect on NOx removal rates under NOx-replete conditions. In theory, doubling HRT should have resulted in a 50% lower NOx concentration decline, while the treated volume of water would have doubled, leading to similar NOx removal rates. The fact that NOx removal significantly declined at short HRTs (0.5 and 0.25 days) was likely driven by deeper penetration of O2 into the woodchip columns at high flow velocities, leading to a smaller volume of (anoxic) woodchip media contributing to denitrification (Graffam et al., 2020).
Across all tested woodchip types at 20°C, effluent CH4 concentrations of >1 mg C L−1 were only detected if NOx concentrations in samples were <0.2 mg NL−1, and always were <0.7 mg C L−1 in samples with NOx concentrations >1 mg N L−1 (Figure 5A), consistent with the expected sequence of organic mineralization pathways based on energy yield from organic matter oxidation with NOx and CO2 (Korom, 1992). Effluent CH4 concentrations in our study (0.0002–3.9 mg C L−1) were within the range reported in previous studies under NOx-limited conditions (Davis et al., 2019; Elgood et al., 2010). Area-normalized dissolved CH4 fluxes ranged from 0.0002 to 0.92 g C m−2 d−1 (Supplementary Tables 2, 3), similar to ranges reported by Elgood et al. (2010) and Gibert et al. (2019).
Oak exhibited lower CH4 production than oak/pine and maple/cherry. This was somewhat surprising because under NOx-deplete conditions and across the tested temperatures, effluent from oak woodchip media had the highest TOC concentrations (up to 56.3 mg C L−1 at 20°C, Figure 4B). These data suggest that CH4 production in oak was not limited by TOC availability. We suspect that the low pH measured in oak under NOx-deplete and -limited conditions may have inhibited methanogenesis as reported by Ye et al. (2012). At 20°C under NOx-deplete conditions, average pH in effluent from oak was 4.2, while maple/cherry, oak/pine, and pine maintained a pH of 5.3, 5.5, and 6.4, respectively (Supplementary Figure 2). High TOC production in oak may have led to an accumulation of fermentative by-products like acetate, which can lower pH (Tugtas et al., 2010). This more acidic environment likely contributed reduced CH4 production in oak columns despite high TOC availability.
The highest effluent CH4 concentrations were found in maple/cherry and oak/pine under NOx-deplete conditions at 20°C. Effluent from these two media had comparably low TOC concentrations, indicating efficient conversion of TOC into CH4 in the absence of NOx.
Under NOx-replete conditions effluent CH4 concentrations remained low, likely because denitrification was the major pathway of TOC mineralization, although any produced CH4 could have been oxidized anaerobically, e.g., by nitrate or nitrite reduction (N-AOM, or N-DAMO) (Timmers et al., 2017; Welte et al., 2016).
Effluent CH4 and TOC concentrations measured at different temperatures suggest differential temperature sensitivity of the major microbial functional groups in the tested woodchip media. CH4 formation under NOx-deplete conditions was most temperature dependent (Figure 4A). Average Q10 values were 10, 8.6, 19.8, and 6.7 for oak, maple/cherry, and oak/pine, and pine, respectively (Table 3). Q10 values for CH4 production were even higher when based on the rates measured at 14°C and 20°C (16.4, 16.5, and 37.5 for oak, maple/cherry, and oak/pine, respectively) indicating the most pronounced increase in methane formation for the temperature increase from 14 to 20°C. TOC production was less temperature-dependent than methane formation and effluent TOC concentrations in oak/pine and maple/cherry were highest at the intermediate temperature (14°C, Figure 4B). High rates of CH4 formation apparently constrained effluent TOC concentrations in oak/pine and maple/cherry. In contrast, TOC production in oak had an average Q10 of 4.5, similar to the Q10 of NOx removal rates indicating a more balanced TOC release and NOx-removal in oak across the tested temperature range, leading to lower CH4 production.
Elevated N2O concentrations were only detected under NOx-replete conditions (Figure 5B), consistent with the fact that N2O is a denitrification intermediate and therefore is expected to be present in partially denitrified effluent. Mean N2O concentrations varied between 0.12 and 74.6 μg L−1 which is similar to the range of 40–200 μg N L−1 reported by Davis et al. (2019) and <1–36 μg N L−1 reported by Elgood et al. (2010). The maximum N2O production rate recorded for oak/pine at a HRT of 0.25 days was 130.7 mg N m−3 d−1 which is within the range of 28.95–478.43 mg N m−3 d−1 reported by Davis et al. (2019) for HRTs of 0.33 and 0.083 days, respectively under NOx-replete conditions.
The corresponding N2O fluxes from woodchip media ranged from −0.17–142.1 mg N m−2 d−1. At 1-day HRT, N2O fluxes varied 1.2–9.6 mg N m−2 d−1 which align well with N2O fluxes of −5.4-14.6 mg N m−2 d−1 reported by Elgood et al. (2010), 9.6 ± 9.1 mg N m−2 d−1 reported by Gibert et al. (2019), and 0.11–2.15 mg N m−2 d−1 reported by Healy et al. (2012). For similar or longer HRTs. However, in our study higher dissolved N2O fluxes of up to 142.1 mg N m−2 d−1 were found at the shortest tested HRTs of 0.5 and 0.25 days. These short HRTs corresponded to hydraulic loading rates of approx. 220 and 440 cm day−1, and at these high velocities, O2 can be expected to penetrate halfway or even deeper into the columns (Graffam et al., 2020). Deep penetration of oxic water may have interfered with denitrification and may have contributed to high dissolved N2O fluxes at short HRTs.
The physical characteristics of woodchip columns, including porosity and woodchip size has been shown to influence NOx removal rates (Lopez-Ponnada et al., 2017). Increased porosity generally increases HRT, thereby enhancing NOx removal (Cameron and Schipper, 2012). Conversely, lower porosity, resulting from smaller woodchip size and a more densely packed matrix, can also improve NOx removal by increasing the surface area of the media (Peterson et al., 2015). Our findings indicate that more densely packed oak columns enhance NOx removal, despite reduced HRT.
Throughout the experiment gas bubbles were frequently observed through the transparent walls of the columns. Gas bubbles were trapped between woodchips and pea gravel, but moved upwards, e.g., when disturbed during sampling. Eventually gas left the columns through effluent tubing which was obvious during sampling. As a consequence, the liquid volumes collected over a 21-h period (mean: 472 mL) varied by up to 60 mL across columns. The average gas volume collected over a 21-h period was 23 mL, without significant differences between woodchip types (F (3, 8) = 0.63, p = 0.6). The bubbles were likely largely composed of N2 and CO2 that outgassed from supersaturated solution in the denitrifying bioreactors but could also have included N2O and CH4. Over the 6–48 h sampling period, different volumes of gas exited each column which may in part explain the high degree of variability in CH4 and N2O effluent concentrations from woodchip column replicates. The potential significance of trapped gas release from bioreactors and the roles of woodchip pore structure and sizes have been proposed by McGuire and Reid (2019). Unfortunately, the gas phase in tedlar bags was not analyzed separately in our study. However, the composite liquid and gas sample collected over 6–48 h period was typically stored for several days. Over that time an equilibrium between the gas and liquid phase should have been established and the GHG concentrations measured from a liquid phase subsample represented an inclusive measure of GHG release as our approach included “hot moments” of GHG fluxes (McGuire and Reid, 2019). To better understand NOx removal and GHG formation and transport in different woodchip media, future research is needed to explore the complex interplay between woodchip surface properties, woodchip pore structures, microbial diversity and activity in woodchip media microhabitats at different temperatures and nitrate loading.
GHGs produced in bioreactors may be unproblematic if GHGs are not released to the atmosphere but are removed downstream, e.g., within the aquifer downstream of PRBs, or–if outgassed - in soil above a bioreactor (Brunton et al., 2024). Nevertheless, any denitrifying bioreactor can - and should - be designed to maximize NOx removal and minimize the formation of GHGs by providing a sufficiently long HRT to remove all incoming NOx but avoiding significant overtreatment. GHG formation is minimized when the thickness of a PRB allows for complete removal without overtreatment.
This study highlights the trade-off between under- and over-treatment of a NOx plume. CH4 and N2O did not co-occur at significant concentrations in effluent. Elevated N2O concentrations were present in effluent only when NOx was not fully removed - consistent with the notion that N2O is an intermediate during denitrification and thus is expected to be present in partially denitrified effluent. CH4, on the other hand, only built up when NOx became depleted within columns and maximal when columns were supplied with NOx-deplete water, consistent with the idea that under freshwater conditions CO2 is the next favorable abundant electron acceptor in a woodchip-pea gravel media, once NOx is depleted.
Groundwater NOx concentrations and velocities typically vary in space and time and some degree of under and overtreatment is unavoidable. A chosen PRB thickness (or HRT) could lean towards over or undertreatment if the release of either CH4 or N2O would pose significantly higher global warming risk. In our study, peak molar concentrations of CH4 with a global warming potential (GWP) of 27 under NOx-deplete conditions (overtreatment) were 64-fold higher than peak concentrations of N2O with a GWP of 273 under NOx-replete conditions (undertreatment). In a hypothetical scenario with a groundwater NOx concentration of 10 mg N L−1 and a groundwater discharge of 1 ft3 ft−2 d−1, the optimal thickness of oak and maple/cherry woodchip-based barriers to achieve complete NOx removal at 20°C would be 0.9 ft and 1.3 ft, respectively.
If the NOx concentration were to decrease by half, leading to NOx depletion halfway through the bioreactors, maximal CH4 flux is estimated to be 40 mg CH4 m-2 d−1 for oak and 219 mg CH4 m−2 d−1 for maple/cherry. Conversely, if NOx concentration were to increase and NOx was only partially removed, maximal N2O production would be 12 mg N2O m−2 d−1 for oak and 6.2 mg N2O m−2 d−1 for maple/cherry. The related GWP for CH4 release is 1.1 g CO2eq m−2 d−1 for oak and 5.9 g CO2eq m−2 d−1 for maple/cherry, and for N2O release 3.2 g CO2eq m−2 d−1 for oak and 1.7 g CO2eq m−2 d−1 for maple/cherry. N2O release during undertreatment and CH4 release during overtreatment of a NOx plume have therefore relatively similar GWP, so that neither under- or over-treatment is preferable. The optimal designed bioreactor (e.g., HRT or PRB thickness) is therefore somewhat resilient against fluctuations around the expected NOx loading as neither under- nor over-treatment poses a significantly higher global warming risk. A more comprehensive risk assessment should consider the fate of GHGs downstream of the woodchip denitrifying media. For example, CH4 can be oxidized to CO2 or N2O can be reduced to N2 if suitable conditions for these processes exist in the aquifer downstream, in the unsaturated soil above subsurface installations, in marine sediments, or in the overlying water column. More work is needed to assess if (or which) GHGs are more likely to be removed and not be released into the atmosphere.
Hardwood woodchip media that had been deployed in a field, and thus had been exposed to water saturated anoxic conditions for 5 years, continued to remove NOx at considerable rates, i.e., 4.3 g N m−3 day−1 at 14°C by oak. NOx removal rates differed among woodchip types, increased with temperature and were furthermore impacted by the porosity of media with higher N removal rates at lower porosity (i.e., denser packing), despite shorter HRTs. In this study, oak woodchips showed the best performance with high NOx removal rates and comparably low GHGs formation. NOx removal by pine was severely reduced at 14°C and ceased at 7°C. This study highlights a tradeoff between under and overtreating NOx plumes in terms of GHG formation: CH4 was only released when water was overtreated and N2O was only released when water was undertreated. Given the variability of groundwater NOx concentrations, velocities, and temperatures in the field, some degree of under and overtreatment and associated release of GHGs will be unavoidable. However, whether or not GHGs released from media in the subsurface represent a global warming risk will depend on the fate of GHGs downstream of an installation. If a large fraction of the released GHGs would be released to the atmosphere, the estimated fluxes would be at the upper range of reported fluxes from wetlands but given the comparable small cross-section area of subsurface installations even if scaled up significantly, the resultant fluxes would be small. More comprehensive risk assessment should also consider the global warming risk of doing nothing, i.e., enhanced GHGs release than can be attributed to more eutrophic conditions without nitrogen removing interventions (Bonaglia et al., 2024; Brunton et al., 2024).
The raw data supporting the conclusions of this article will be made available by the authors, without undue reservation.
J-AL: Conceptualization, Data curation, Formal Analysis, Investigation, Methodology, Resources, Software, Validation, Visualization, Writing–original draft, Writing–review and editing. NV: Conceptualization, Data curation, Formal Analysis, Funding acquisition, Investigation, Methodology, Project administration, Resources, Software, Supervision, Validation, Visualization, Writing–review and editing.
The author(s) declare that financial support was received for the research, authorship, and/or publication of this article. This research was funded by the New York State Department of Environmental Conservation [NYS-DEC01-C00366GG-3350000] and supported by NYS Center for Clean Water Technology.
We would like to thank Molly Graffam (Cornell Cooperative Extension of Suffolk County) for assistance in column setup and advice on GHG measurement. Ron Paulsen P.G. Principle - Coastline Evaluation Corp is thanked for providing aged woodchip media. We also want to thank NYS Center for Clean Water Technology’s personnel, specifically Caitlin Asato for conducting nitrogen and TOC measurement, Rachel Smolinski for helping with experiment maintenance and nitrogen measurements, and Stuart Waugh for general advice on this project.
The authors declare that the research was conducted in the absence of any commercial or financial relationships that could be construed as a potential conflict of interest.
The author(s) declare that no Generative AI was used in the creation of this manuscript.
All claims expressed in this article are solely those of the authors and do not necessarily represent those of their affiliated organizations, or those of the publisher, the editors and the reviewers. Any product that may be evaluated in this article, or claim that may be made by its manufacturer, is not guaranteed or endorsed by the publisher.
The Supplementary Material for this article can be found online at: https://www.frontiersin.org/articles/10.3389/fenvs.2025.1543143/full#supplementary-material
Addy, K., Gold, A. J., Christianson, L. E., David, M. B., Schipper, L. A., and Ratigan, N. A. (2016). Denitrifying bioreactors for nitrate removal: a meta-analysis. J. Environ. Qual. 45, 873–881. doi:10.2134/jeq2015.07.0399
Bonaglia, S., Cheung, H. L. S., Politi, T., Vybernaite-Lubiene, I., McKenzie, T., Santos, I. R., et al. (2024). Eutrophication and urbanization enhance methane emissions from coastal lagoons. Limnol. Oceanogr. Lett. 10, 140–150. doi:10.1002/lol2.10430
Brunton, A. M., Zilles, J. L., Cooke, R. A., and Christianson, L. E. (2024). Nitrous oxide and methane production and consumption at five full-size denitrifying bioreactors treating subsurface drainage water. Sci. Total Environ. 919, 170956. doi:10.1016/j.scitotenv.2024.170956
Burow, K. R., Nolan, B. T., Rupert, M. G., and Dubrovsky, N. M. (2010). Nitrate in groundwater of the United States, 1991−2003. Environ. Sci. Tech. 44, 4988–4997. doi:10.1021/es100546y
Buxton, H. T., and Modica, E. (1992). Patterns and rates of ground-water flow on long island, New York. Groundwater 30, 857–866. doi:10.1111/j.1745-6584.1992.tb01568.x
Cameron, S. G., and Schipper, L. A. (2010). Nitrate removal and hydraulic performance of organic carbon for use in denitrification beds. Ecol. Eng. 36, 1588–1595. doi:10.1016/j.ecoleng.2010.03.010
Cameron, S. G., and Schipper, L. A. (2012). Hydraulic properties, hydraulic efficiency and nitrate removal of organic carbon media for use in denitrification beds. Ecol. Eng. 41, 1–7. doi:10.1016/j.ecoleng.2011.11.004
Chen, S., Wang, M., Wu, M., Lu, Y., Fu, A., Gobler, C. J., et al. (2025). Greenhouse gas emission and denitrification kinetics of woodchip bioreactors treating onsite wastewater. Water Res. 268, 122562. doi:10.1016/j.watres.2024.122562
Christianson, L., DeVallance, D., Faulkner, J., and Basden, T. (2017). Scientifically advanced woody media for improved water quality from livestock woodchip heavy-use areas. Front. Environ. Sci. Eng. 11, 2. doi:10.1007/s11783-017-0909-7
Christianson, L., Helmers, M., Bhandari, A., Kult, K., Sutphin, T., and Wolf, R. (2012). Performance evaluation of four field-scale agricultural drainage denitrification bioreactors in Iowa. Trans. ASAE. 55, 2163–2174. doi:10.13031/2013.42508
Chung, J., Rittmann, B. E., Wright, W. F., and Bowman, R. H. (2007). Simultaneous bio-reduction of nitrate, perchlorate, selenate, chromate, arsenate, and dibromochloropropane using a hydrogen-based membrane biofilm reactor. Biodegradation 18, 199–209. doi:10.1007/s10532-006-9055-9
Clyde, P., Lee, C., Price, R., Venkatesan, A., and Brownawell, B. (2021). Occurrence and removal of PPCPs from on-site wastewater using nitrogen removing biofilters. Water Res. 206, 117743. doi:10.1016/j.watres.2021.117743
Davidson, E. A., Janssens, I. A., and Luo, Y. (2006). On the variability of respiration in terrestrial ecosystems: moving beyond Q10. Glob. Change Biol. 12, 154–164. doi:10.1111/j.1365-2486.2005.01065.x
Davis, M. P., Martin, E. A., Moorman, T. B., Isenhart, T. M., and Soupir, M. L. (2019). Nitrous oxide and methane production from denitrifying woodchip bioreactors at three hydraulic residence times. J. Environ. Manage. 242, 290–297. doi:10.1016/j.jenvman.2019.04.055
Elgood, Z., Robertson, W. D., Schiff, S. L., and Elgood, R. (2010). Nitrate removal and greenhouse gas production in a stream-bed denitrifying bioreactor. Ecol. Eng. 36, 1575–1580. doi:10.1016/j.ecoleng.2010.03.011
Ewere, E., White, S., Mauleon, R., and Benkendorff, K. (2024). Soil microbial communities and degradation of pesticides in greenhouse effluent through a woodchip bioreactor. Environ. Pollut. 359, 124561. doi:10.1016/j.envpol.2024.124561
Gibert, O., Assal, A., Devlin, H., Elliot, T., and Kalinc, R. M. (2019). Performance of a field-scale biological permeable reactive barrier for in-situ remediation of nitrate-contaminated groundwater. Sci. Total Environ. 659, 211–220. doi:10.1016/j.scitotenv.2018.12.340
Graffam, M., Paulsen, R., and Volkenborn, N. (2020). Hydro-biogeochemical processes and nitrogen removal potential of a tidally influenced permeable reactive barrier behind a perforated marine bulkhead. Ecol. Eng. 155, 105933. doi:10.1016/j.ecoleng.2020.105933
Greenan, C. M., Moorman, T. B., Parkin, T. B., Kaspar, T. C., and Jaynes, D. B. (2009). Denitrification in wood chip bioreactors at different water flows. J. Environ. Qual. 38, 1664–1671. doi:10.2134/jeq2008.0413
Halaburka, B. J., LeFevre, G. H., and Luthy, R. G. (2017). Evaluation of mechanistic models for nitrate removal in woodchip bioreactors. Environ. Sci. Tech. 51, 5156–5164. doi:10.1021/acs.est.7b01025
Hassanpour, B., Giri, S., Pluer, W. T., Steenhuis, T. S., and Geohring, L. D. (2017). Seasonal performance of denitrifying bioreactors in the Northeastern United States: field trials. J. Environ. Manage. 202, 242–253. doi:10.1016/j.jenvman.2017.06.054
Hathaway, S. K., Bartolerio, N. A., Rodríguez, L. F., Kent, A. D., and Zilles, J. L. (2017). Denitrifying bioreactors resist disturbance from fluctuating water levels. Front. Environ. Sci. 5, 35. doi:10.3389/fenvs.2017.00035
Healy, M. G., Ibrahim, T. G., Lanigan, G. J., Serrenho, A. J., and Fenton, O. (2012). Nitrate removal rate, efficiency and pollution swapping potential of different organic carbon media in laboratory denitrification bioreactors. Ecol. Eng. 40, 198–209. doi:10.1016/j.ecoleng.2011.12.010
Hoover, N. L., Bhandari, A., Soupir, M. L., and Moorman, T. B. (2016). Woodchip denitrification bioreactors: impact of temperature and hydraulic retention time on nitrate removal. J. Environ. Qual. 45, 803–812. doi:10.2134/jeq2015.03.0161
Howarth, R. W., and Marino, R. (2006). Nitrogen as the limiting nutrient for eutrophication in coastal marine ecosystems: evolving views over three decades. Limnol. Oceanogr. 51, 364–376. doi:10.4319/lo.2006.51.1_part_2.0364
Huang, X., Guida, S., Jefferson, B., and Soares, A. (2020). Economic evaluation of ion-exchange processes for nutrient removal and recovery from municipal wastewater. npj Clean. Water 3, 7. doi:10.1038/s41545-020-0054-x
Korom, S. F. (1992). Natural denitrification in the saturated zone: a review. Water Resour. Res. 28, 1657–1668. doi:10.1029/92WR00252
Kouanda, A., and Hua, G. (2021). Determination of nitrate removal kinetics model parameters in woodchip bioreactors. Water Res. 195, 116974. doi:10.1016/j.watres.2021.116974
Lopez-Ponnada, E. V., Lynn, T. J., Peterson, M., Ergas, S. J., and Mihelcic, J. R. (2017). Application of denitrifying wood chip bioreactors for management of residential non-point sources of nitrogen. J. Biol. Eng. 11, 16. doi:10.1186/s13036-017-0057-4
Malone, T. C., and Newton, A. (2020). The globalization of cultural eutrophication in the coastal ocean: causes and consequences. Front. Mar. Sci. 7, 670. doi:10.3389/fmars.2020.00670
Manca, F., Wegscheidl, C., Robinson, R., Argent, S., Algar, C., De Rosa, D., et al. (2021). Nitrate removal performance of denitrifying woodchip bioreactors in tropical climates. Water 13, 3608. doi:10.3390/w13243608
McGuire, P. M., and Reid, M. C. (2019). Nitrous oxide and methane dynamics in woodchip bioreactors: effects of water level fluctuations on partitioning into trapped gas phases. Environ. Sci. Technol. 53, 14348–14356. doi:10.1021/acs.est.9b04829
Nixon, S. W. (1995). Coastal marine eutrophication: a definition, social causes, and future concerns. Ophelia 41, 199–219. doi:10.1080/00785236.1995.10422044
Paerl, H. W. (1997). Coastal eutrophication and harmful algal blooms: importance of atmospheric deposition and groundwater as “new” nitrogen and other nutrient sources. Limnol. Oceanogr. 42, 1154–1165. doi:10.4319/lo.1997.42.5_part_2.1154
Peterson, I. J., Igielski, S., and Davis, A. P. (2015). Enhanced denitrification in bioretention using woodchips as an organic carbon source. J. Sustain. Water Built Environ. 1, 04015004. doi:10.1061/JSWBAY.0000800
Roberts, H. M., and Shiller, A. M. (2015). Determination of dissolved methane in natural waters using headspace analysis with cavity ring-down spectroscopy. Anal. Chim. Acta 856, 68–73. doi:10.1016/j.aca.2014.10.058
Robertson, W. D. (2010). Nitrate removal rates in woodchip media of varying age. Ecol. Eng. 36, 1581–1587. doi:10.1016/j.ecoleng.2010.01.008
Robertson, W. D., and Cherry, J. A. (1995). In-situ denitrification of septic-system nitrate using reactive porous-media barriers-field trials. Ground Water 33, 99–111. doi:10.1111/j.1745-6584.1995.tb00266.x
Robertson, W. D., Ptacek, C. J., and Brown, S. J. (2008). Rates of nitrate and perchlorate removal in a 5-year-old wood particle reactor treating agricultural drainage. Groundw. Monit. Rem 29, 87–94. doi:10.1111/j.1745-6592.2009.01231.x
Robertson, W. D., Vogan, J. L., and Lombardo, P. S. (2008). Nitrate removal rates in a 15-year-old permeable reactive barrier treating septic system nitrate. Groundw. Monit. Rem. 28, 65–72. doi:10.1111/j.1745-6592.2008.00205.x
Rodellas, V., Garcia-Orellana, J., Masqué, P., Feldman, M., and Weinstein, Y. (2015). Submarine groundwater discharge as a major source of nutrients to the Mediterranean Sea. Proc. Nat. Acad. Sci. 112, 3926–3930. doi:10.1073/pnas.1419049112
Santos, I. R. S., Burnett, W. C., Chanton, J., Mwashote, B., Suryaputra, I. G. N. A., and Dittmar, T. (2008). Nutrient biogeochemistry in a Gulf of Mexico subterranean estuary and groundwater-derived fluxes to the coastal ocean. Limnol. Oceanogr. 53, 705–718. doi:10.4319/lo.2008.53.2.0705
Schipper, L. A., and Vojvodić-Vuković, M. (1998). Nitrate Removal from groundwater using a denitrification wall amended with sawdust: field trial. J. Environ. Qual. 27, 664–668. doi:10.2134/jeq1998.00472425002700030025x
Schipper, L. A., and Vojvodic-Vukovic, M. (2001). Five years of nitrate removal, denitrification and carbon dynamics in a denitrification wall. Water Res. 35, 3473–3477. doi:10.1016/s0043-1354(01)00052-5
Schmidt, C. A., and Clark, M. W. (2013). Deciphering and modeling the physicochemical drivers of denitrification rates in bioreactors. Ecol. Eng. 60, 276–288. doi:10.1016/j.ecoleng.2013.07.041
Sharples, J., Tweddle, J. F., Mattias Green, J. A., Palmer, M. R., Kim, Y.-N., Hickman, A. E., et al. (2007). Spring-neap modulation of internal tide mixing and vertical nitrate fluxes at a shelf edge in summer. Limnol. Oceanogr. 52, 1735–1747. doi:10.4319/lo.2007.52.5.1735
Slomp, C. P., and Van Cappellen, P. (2004). Nutrient inputs to the coastal ocean through submarine groundwater discharge: controls and potential impact. J. Hydrol. 295, 64–86. doi:10.1016/j.jhydrol.2004.02.018
Timmers, P. H. A., Welte, C. U., Koehorst, J. J., Plugge, C. M., Jetten, M. S. M., and Stams, A. J. M. (2017). Reverse methanogenesis and respiration in methanotrophic archaea. Archaea 2017, 1–22. doi:10.1155/2017/1654237
Tugtas, A. E., Tezel, U., and Pavlostathis, S. G. (2010). A comprehensive model of simultaneous denitrification and methanogenic fermentation processes. Biotechnol. Bioeng. 105, 98–108. doi:10.1002/bit.22443
Warneke, S., Schipper, L. A., Matiasek, M. G., Scow, K. M., Cameron, S., Bruesewitz, D. A., et al. (2011). Nitrate removal, communities of denitrifiers and adverse effects in different carbon substrates for use in denitrification beds. Water Res. 45, 5463–5475. doi:10.1016/j.watres.2011.08.007
Weiss, R., and Price, B. (1980). Nitrous oxide solubility in water and seawater. Mar. Chem. 8, 347–359. doi:10.1016/0304-4203(80)90024-9
Welte, C. U., Rasigraf, O., Vaksmaa, A., Versantvoort, W., Arshad, A., Op den Camp, H. J. M., et al. (2016). Nitrate- and nitrite-dependent anaerobic oxidation of methane. Environ. Microbiol. Rep. 8, 941–955. doi:10.1111/1758-2229.12487
Wiesenburg, D. A., and Guinasso Jr, N. L. (1979). Equilibrium solubilities of methane, carbon monoxide, and hydrogen in water and sea water. J. Chem. Eng. Data 24, 356–360. doi:10.1021/je60083a006
Wittenberg, H., Aksoy, H., and Miegel, K. (2019). Fast response of groundwater to heavy rainfall. J. Hydrol. 571, 837–842. doi:10.1016/j.jhydrol.2019.02.037
Wrightwood, O. M., Hattaway, M. E., Young, T. M., and Bischel, H. N. (2021). Assessment of woodchip bioreactor characteristics and their influences on joint nitrate and pesticide removal. ACS ES&T Water 2, 106–116. doi:10.1021/acsestwater.1c00277
Ye, R., Jin, Q., Bohannan, B., Keller, J. K., McAllister, S. A., and Bridgham, S. D. (2012). pH controls over anaerobic carbon mineralization, the efficiency of methane production, and methanogenic pathways in peatlands across an ombrotrophic–minerotrophic gradient. Soil Biol. biochem. 54, 36–47. doi:10.1016/j.soilbio.2012.05.015
Keywords: groundwater nitrate, woodchip, permeable reaction barrier (PRB), denitrificafion, greenhous gases, methane - CH4
Citation: Lin J-A and Volkenborn N (2025) Nitrate removal in woodchip-based bioreactors and greenhouse gas formation tradeoffs between under- and over-treatment. Front. Environ. Sci. 13:1543143. doi: 10.3389/fenvs.2025.1543143
Received: 10 December 2024; Accepted: 28 February 2025;
Published: 19 March 2025.
Edited by:
Antonio Albuquerque, University of Beira Interior, PortugalReviewed by:
Bhuvan Vemuri, Micron, United StatesCopyright © 2025 Lin and Volkenborn. This is an open-access article distributed under the terms of the Creative Commons Attribution License (CC BY). The use, distribution or reproduction in other forums is permitted, provided the original author(s) and the copyright owner(s) are credited and that the original publication in this journal is cited, in accordance with accepted academic practice. No use, distribution or reproduction is permitted which does not comply with these terms.
*Correspondence: Nils Volkenborn, bmlscy52b2xrZW5ib3JuQHN0b255YnJvb2suZWR1
Disclaimer: All claims expressed in this article are solely those of the authors and do not necessarily represent those of their affiliated organizations, or those of the publisher, the editors and the reviewers. Any product that may be evaluated in this article or claim that may be made by its manufacturer is not guaranteed or endorsed by the publisher.
Research integrity at Frontiers
Learn more about the work of our research integrity team to safeguard the quality of each article we publish.