 Shengdi Zhang1,2*
 Jiachen Wang2
- 1School of Economics, Nankai University, Tianjin, China
- 2School of Computer Science and Technology, Tianjin University, Tianjin, China
Introduction: The long-term high carbon economic model, while driving economic growth, has also led to climate issues. Faced with this challenge, reducing carbon emissions and advocating low-carbon economic development have become the focus of international attention. Although the Yangtze River Delta region holds an important position in economic and technological innovation, its carbon emissions are still continuously increasing.
Methods: To explore the mutual influence between low-carbon economy and energy technology innovation, this study took the Yangtze River Delta region as the research object, collected data from the region from 2010 to 2022, and analyzed and explored the correlation between the two. Then, using spatial econometric methods, a spatial model was constructed to explore the spatial effects between the two in depth.
Results: Research data showed that, taking adjacency matrix as an example, when the level of energy technology innovation increased by 1%, the low-carbon economic development level in the Yangtze River Delta region would increase by 21.15%. In terms of geographical distance matrix, when the level of energy technology innovation increased by 1%, the low-carbon economic development level in the Yangtze River Delta region would also increase by 19.95%. The energy technology innovation in the Yangtze River Delta was positively correlated with the development of low-carbon economy, with energy innovation technology mainly improving the low-carbon economic level of the Yangtze River Delta region through carbon reduction and decarbonization. In addition, the interaction between energy technology innovation and the environment also shows a significant spatial spillover effect on the development of low-carbon economy.
Discussion: In summary, the empirical results of this study indicate that the Yangtze River Delta region should prioritize the following measures to enhance its energy technology innovation and promote low-carbon development: The first is to encourage enterprises and scientific research institutions to increase investment in low-carbon technologies; The second is to implement more detailed environmental regulatory policies, including carbon emission standards, technical standards, and market access conditions; The third is to promote enterprises to realize low-carbon transformation.
1 Introduction
In recent years, the severity of global climate change and environmental problems has become increasingly apparent, and these issues have emerged as a common challenge faced by governments and all sectors of society. The increase in greenhouse gases has been linked to rising global temperatures, as well as to increasingly frequent extreme weather events, water shortages, and ecosystem disruption. In this context, Low Carbon Economy (LCE), as a new development model, has been widely concerned by the international community for its coordination among emission reduction, environmental protection, and economic growth (Yang M. et al., 2023; Caglar, 2023). LCE places significant emphasis on the mitigation of carbon emissions and environmental degradation, while concurrently ensuring economic growth. This commitment encompasses not only the development and utilization of renewable energy sources but also the transformation and upgrading of advanced technologies and industrial sectors. The Yangtze River Delta (YRD) region, as one of the most economically developed regions in China, gathers a large number of industries and population, and its economic aggregate accounts for a large part of the country. However, the region’s high level of carbon emissions remains an important challenge in its development. In the process of rapid industrialization in the past, issues of resource consumption and environmental pollution have gradually emerged, especially in carbon emissions, which have become bottlenecks restricting its sustainable development. Although the policy level has begun to attach importance to low-carbon development and formulated a number of relevant policies, carbon emissions continue to grow. Therefore, how to realize the transformation of LCE and realize the coordinated development of economy and environment has become an urgent problem for academia and policymakers. In this context, technological innovation, especially Energy Technology Innovation (ETI), is considered a key factor in achieving the goal of a LCE. The development and promotion of new technologies has the potential to enhance energy efficiency, reduce reliance on high-carbon energy sources, and effectively mitigate Greenhouse Gas Emissions (GGE). The YRD region has a strong foundation in technology research and development and industrial innovation, and the level of its ETI directly affects the level of low-carbon economic development in this region. Therefore, an in-depth study of the relationship between LCE and ETI is not only helpful to deepen the theoretical research but also can provide an empirical basis for policy making and promote the sustainable low-carbon development of the region (Panzera and Postiglione, 2022; Karimi et al., 2023).
The main variables studied include ETI, LCE, Carbon Emission Intensity (CEI), and Environmental Regulation Index (ERI). Among them, ETI represents the research and development of new technologies and the enhancement of the application capacity of existing technologies in energy, which directly affects the development of LCE. High levels of ETI can effectively reduce CEI, that is, the carbon emissions generated per unit of GDP, which promotes the formation of a LCE. At the same time, the development of LCE can in turn encourage more ETIs, and promote the R&D investment of enterprises and society in low-carbon technologies through the guidance of market demand and environmental policies. Therefore, there is a positive interaction between ETI and LCE. The ERI, as an external policy variable, further promotes the synergistic development between ETI and LCE by strengthening the control of carbon emissions. The complexity and dynamics of this interaction reflect the importance and urgency of regional sustainable development.
The Spatial Metrology Method (SMM), as a method for studying spatial distribution characteristics and spatial correlations, provides scholars with a new perspective to deeply explore the relationship between LCE and ETI in YRD region. The use of SMM can not only help staff understand the direct correlation between the two but also reveal their indirect effects, such as Spatial Spillover Effects (SSE) (Jiang et al., 2022). This study analyzed panel data of 33 cities in YRD from 2010 to 2022 by constructing a Spatial Durbin Model (SDM) and obtained the relevant mechanisms of various influencing factors. The purpose is to further explore the correlation between YRD region’s LCE and ETI, and provide valuable policy recommendations for the sustainable development of YRD region’s LCE. The final research results provide valuable references for policymakers, entrepreneurs, and researchers in the region, promoting the healthy development of YRD region’s LCE. This study consists of five sections in total. Section 1 is an analysis and summary of relevant research reviews. Section 2 analyzes the theoretical knowledge of this study and proposes hypotheses. Section 3 is to build a spatial econometric model to explore the relationship between ETI and LCE in YRD region. Section 4 is an empirical analysis, while Section 5 is a summary and recommendations for the paper.
2 Related works
There is a close relationship between LCE and ETI, and many scholars have conducted a series of studies on the relationship between the two. L. Xin et al. utilized provincial panel data from 2006 to 2020 to construct an evaluation system for measuring Inclusive Low-carbon Development (ILCD) in China. From the comprehensive perspective of SSE and threshold effects, the SSE and regional boundaries of renewable ETI on ILCD were explored. Renewable ETI and ILCD exhibited a spatial pattern of “high in the east and low in the west”. Renewable ETI had a significant driving effect on ILCD in both the local and neighboring areas, but its driving effect was more significant in the mature stage (Xin et al., 2023). Y. Xu et al. explored the impact of local government competition and Green Technology Innovation (GTI) on Low Carbon Economy Transition (LCET) in the context of China’s government led economic development system. Empirical analysis was conducted using system Generalized Method of Moments (GMM), panel threshold model, and geographically weighted regression method, using data from 30 provincial-level administrative regions from 2006 to 2019. The competition among local governments not only significantly suppressed LCET but also significantly suppressed the positive effect of GTI on LCET. When GTI was used as a threshold, there is a significant N-type relationship between it and LCET. In areas with low competition intensity, local government competition had a stronger inhibitory effect on LCET (Xu Y. et al., 2023). K. Ullah et al. used time series data from 1990 to 2020 to study the roles of Green Energy Consumption (GEC), ecological innovation, and urbanization in explaining Pakistan’s LCE and environmental sustainability goals. This study used symmetric, asymmetric, and quantile autoregressive lag models to explore the short-term and long-term relationships between explanatory and non-explanatory variables. The use of symmetric autoregressive lag models can effectively identify the average impact of explanatory variables on the dependent variable in equilibrium states. The asymmetric autoregressive lag model allows researchers to examine the dynamic effects of shocks in different directions on the explained variables, thereby revealing potential nonlinear relationships between variables. Furthermore, by examining the effects under varying quantiles, the autoregressive lag model can elucidate the differential impacts of the explanatory variables on the explained variables under diverse circumstances, thereby enhancing the accuracy and reliability of the research findings. LCE, GEC, ecological innovation, urbanization, per capita GDP, and labor force exhibit a co-integration relationship in the long term. GEC and effective ecological innovation are the most important paths to ensure environmental sustainability, while urbanization, per capita GDP, and labor has a negative impact on LCE. Therefore, emphasizing GEC, ecological innovation, and controlled urbanization, as well as incorporating environmental policies into economic development policies, are of great policy significance for formulating Pakistan’s environmental sustainability strategy (Ullah et al., 2023). S. Meng et al. used the STIRPAT model to empirically analyze the impact of renewable energy electricity consumption on Carbon Productivity (CP) in 30 provinces of China from 2011 to 2020, using data on CP, technological progress, economic development level, population, energy efficiency, and industrial structure rationality. China’s CP showed a clear SSE, characterized by a spatial positive correlation distribution pattern of “high-high” and “low-low”. The utilization of renewable energy occupied an active position in stimulating the LCE progress, showing a positive SSE in the horizontal spatial dimension and an increasing trend in the overall improvement of the environment in the vertical temporal dimension. Among the seven regions in China, Renewable Energy Consumption (REC) in North China, East China, and Central China had a dominant effect on CP. In addition, about 29% of the positive effects of REC on CP were indirectly achieved through technological progress (Meng et al., 2023).
SMM is a product of the combination of econometrics and geographic information systems, used to address issues in geographic or spatial data, particularly spatial dependence and heterogeneity. Common SMMs include Spatial Weight Matrix (SWM), spatial lag model, spatial error model, spatial autoregressive model, etc. Many experts have conducted a series of studies based on these spatial models. Y. Yang et al. used panel data from China from 2000 to 2018 to evaluate the Efficiency of Green Development (GDE) using the Super-SBM model, and conducted empirical analysis using the system generalized moment estimation method. Capital mismatch had a significant inhibitory effect on the GDE. In addition, capital mismatch also limited technological innovation, which played an important role in improving the GDE. Further research on the impact of regional heterogeneity revealed that capital mismatch had a more significant negative impact on the GDE in the central and western regions, while its impact was not significant in the eastern regions (Yang Y. et al., 2022). Hasanov F J et al. proposed a theoretical framework to quantitatively analyze the impact of technological progress, REC, and international trade on carbon emissions using SMM. The quantitative analysis results showed that technological progress, REC, and export scale contributed to reducing carbon dioxide emissions, while GDP and import scale both increased pollution in the long and short term (Hasanov et al., 2021). S. Safdar et al. used panel data from six South Asian countries from 1996 to 2020 to examine the stationarity of variables using structural break-point panel unit root tests, and confirmed that variables are stationary under first-order differences. They conducted long-term analysis using FMOLS and DOLS models, and estimated an auto-regressive distributed lag model with enhanced cross sections to ensure robustness. Reducing GGE could effectively improve the environment. In addition, both GDP and trade openness had a positive impact on economic and social outcomes, while natural resource rents were positively correlated with GGE (Safdar et al., 2022). Haque MI analyzed the correlation between oil price shocks, energy consumption, carbon emissions, and per capita GDP using static and dynamic panel estimation SMMs over a 30-year data period of Gulf Cooperation Council countries. It was found that population growth is positively correlated with energy consumption, while energy consumption is positively correlated with CO2 emissions. Therefore, measures needed to be taken to save energy and reduce emissions, and demand side management should be implemented (Haque, 2020).
Wu Q et al. addressed the environmental issues in China’s pharmaceutical manufacturing industry by proposing a method to measure Total Factor Productivity (TFP) using Data Envelopment Analysis (DEA), which yielded more precise results than traditional models. The study, based on panel data from 30 provinces from 2004 to 2019 and spatial econometric models, explored the impact of environmental regulation on the TFP of the pharmaceutical manufacturing industry, enriching research on clean production (Wu et al., 2022). Hou X et al. examined the effect of Low-Carbon City Pilot Programs (LCCP) on carbon emissions in China, proposing a method that utilizes enterprise-level tax survey data and a staggered Differences-in-Differences (DID) approach. The research resulted in a 30% reduction in emissions and a 36% increase in energy efficiency (Hou et al., 2023). Bai D et al. studied the importance of GTI in economic growth in developing countries, employing a new synthetic control DID model to empirically test the impact of Ecological Civilization Pilot Programs (ECP) on GTI in pilot provinces. The study found that after implementing the ECP, the number of green utility model patents in the pilot provinces increased by an average of 38.1%, while the number of green invention patents increased by 23.1% (Bai et al., 2023). Wang X et al. explored the significance of renewable energy deployment by applying spatial econometric methods to analyze the effect of green finance on renewable energy utilization in 30 provinces in China from 2006 to 2020. They also examined the moderating effects of government intervention measures (such as environmental regulation and natural gas promotion). The research combined SDMs and a DID approach to assess the overall effects of the green bond policy first introduced in 2015 (Wang X. et al., 2024). Wang Z et al. focused on the issue of green innovation within energy companies. They proposed an analytical method based on the adoption of Artificial Intelligence (AI) and found that the widespread application of AI significantly improved green innovation efficiency in energy companies. This effect was particularly evident in companies actively engaged in environmental, social, and governance activities. However, executives focused on short-term interests may undermine the positive impact of AI on enhancing green innovation (Wang Z. et al., 2024).
In summary, many scholars have discussed the relationship between energy and LCE and have achieved certain results. However, most research focuses on areas with certain limitations. There is a lack of specific research to analyze the relationship between YRD and other regions with rapid economic development and high levels of energy technology. Based on this background, this study concentrates on a sample of 33 cities within the YRD region. Utilizing the SDM approach, it aims to elucidate the correlation between their LCE and energy innovation. The objective is to furnish policy recommendations that will facilitate the sustainable development of the YRD region.
3 Theoretical analysis and research hypotheses
The theoretical framework of the research is built around four core variables: LCE, ETI, CEI and ERI. Firstly, ETI is regarded as a primary catalyst for LCE development. The integration of innovative clean energy technologies and enhanced energy efficiency has been demonstrated to effectively mitigate CEI, defined as the carbon intensity per unit of GDP. Secondly, the promotion of LCE has been shown to encourage enterprises and scientific research institutions to increase investment in ETI R&D through market mechanisms and policy guidance, thus forming a virtuous cycle. In addition, ERI, as a representative of government policies, influences the behavior choice of enterprises in environmental protection and the direction of technological innovation. The implementation of more stringent environmental regulations is likely to prompt companies to adopt more advanced technologies to comply with policy requirements. This will further promote the development of LCE. On this basis, the following two research hypotheses are proposed:
Hypothesis 1. The improvement of ETI level will significantly promote the development of LCE.
Hypothesis 2. Environmental regulation has a significant moderating effect on the relationship between ETI and LCE.
This theoretical framework provides a solid foundation for the subsequent empirical analysis and helps to deeply explore the interaction and influence mechanism between variables.
Currently, discussions on LCE in China mostly focus on the dominant factors that affect its development and regional differences, especially the impact of green and low-carbon technologies on LCE (Gardiner and Hajek, 2020). However, for specific regions such as YRD, there is currently a lack of correlated research to prove the specific impact of a certain factor within the region on LCE. Therefore, this study chooses YRD, a region with highly developed technology and economy, to explore its relationship with LCE in depth from a broader perspective of ETI. Firstly, this study selects four commonly used indicators, namely, R&D Expenditure (R&D-E), Number of Energy Innovation Patents (EIPN), number of High-tech Energy Enterprises (HTEE), and R&D Sales (R&D-S) of HTEE, as the measurement indicators of YRD’s ETI level (Barma and Modibbo, 2023; Yang G. et al., 2023; Zeng et al., 2023; Li et al., 2024). All data used in this study are from China Statistical Yearbook and relevant statistical yearbooks to ensure the authority and reliability of data. The data in the China Statistical Yearbook not only cover the relevant information of 33 cities in the YRD region but also reflect the comprehensive status of each city in terms of economic development, technological innovation, and carbon emissions. This makes the data have a good representation and can fully reflect the relationship between LCE and ETI in the YRD region, providing a solid empirical basis for research. Considering the objective and content of the study, the 33 cities in the YRD region selected as the sample range can fully represent the economic and technological development level of the region. This region is one of the most economically active and technologically innovative regions in China. The differences in LCE and ETI among cities in this region can exactly reveal the complexity and diversity of research questions. At the same time, the data period is selected from 2010 to 2022, which not only covers the implementation period of the national policy on LCE and ETI but also reflects the rapid economic development and sustainable development challenges faced by the region. Therefore, it is appropriate to maintain the existing sample range and time period, which is conducive to fully analyzing the interaction and mechanism of each variable. Figure 1 shows the changes in R&D-E and EIPN of YRD region from 2010 to 2022.
Figures 1a, b show the changes in R&D-E and EIPN in Shanghai, Jiangsu, Zhejiang, and Anhui provinces in the YRD region, respectively. In Figure 1a, over time, the R&D-E of the three provinces and one city showed a continuous upward trend, with Jiangsu Province having the largest increase. In Figure 1b, from 2010 to 2022, the overall EIPN of the three provinces and one city increased, but the upward trend began to slow down after 2011.
Figures 2a, b show the number of HTEEs and R&D-S changes in three provinces and one city in the YRD region, respectively. In 2 (a), with the change of time, the number of HTEEs in the three provinces and one city has increased, but the proportion of HTEEs in Shanghai, Jiangsu, and Zhejiang provinces is relatively high, while the proportion in Anhui province is relatively small. In 2 (b), the R&D-S revenue proportion of HTEE in three provinces and one city has remained stable at around 35%, with Jiangsu Province having the highest sales revenue proportion. The data are based on the analysis of relevant statistical data, specifically from the Statistical Yearbook of three provinces and one city in the YRD. The annual statistics in the yearbook provide detailed information on R&D investment and sales revenue of high-tech enterprises in each province and city, allowing estimates of this data to be accurately reflected.
Based on Figures 1, 2, the ETI of the YRD region is at a leading level nationwide. Among them, Shanghai ranks among the top three in the country, while Hefei, the city with the best ETI in Anhui Province, only ranks 17th in the country. Therefore, there is still a significant gap in the ETI level of the YRD region, which can be further explored. In addition to analyzing ETI, this study also analyzed the current development status of LCE in YRD region. Figure 3 shows the Total Carbon Emissions (TCE) and Carbon Emission Share (CES) in the YRD region.
Figures 3a, b show the TCE and CES situation of YRD’s three provinces and one city from 2010 to 2022, respectively. Jiangsu Province has the highest TCE and CES among the four provinces, while Zhejiang Province is similar to Anhui Province, and Shanghai has the lowest TCE.
In Table 1, the ERI of the three provinces and one city has shown a continuous upward trend since 2016. The ERI of Shanghai has always been higher than that of the other three provinces, because Shanghai has introduced many encouraging policies to protect the environment, such as subsidies for purchasing new energy vehicles and special subsidies for energy-saving projects. Compared to Shanghai, the other three provinces have fewer policies related to environmental regulations, resulting in lower ERI.
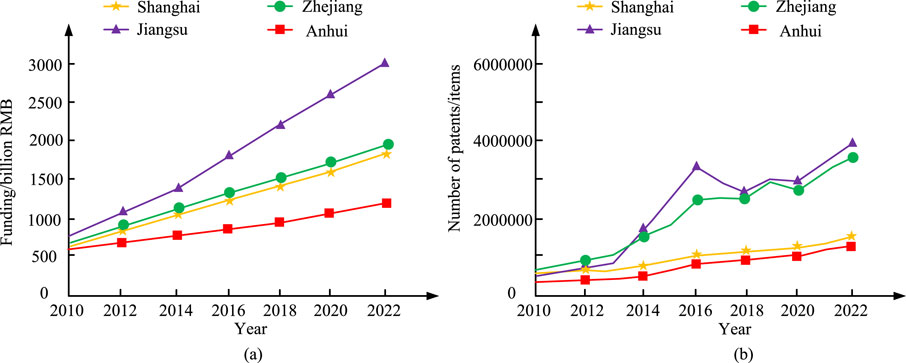
Figure 1. Changes in R&D-E and EIPN in the YRD region from 2010 to 2022. (a) Changes in research and development expenditure, (b) Changes in patent programmes.
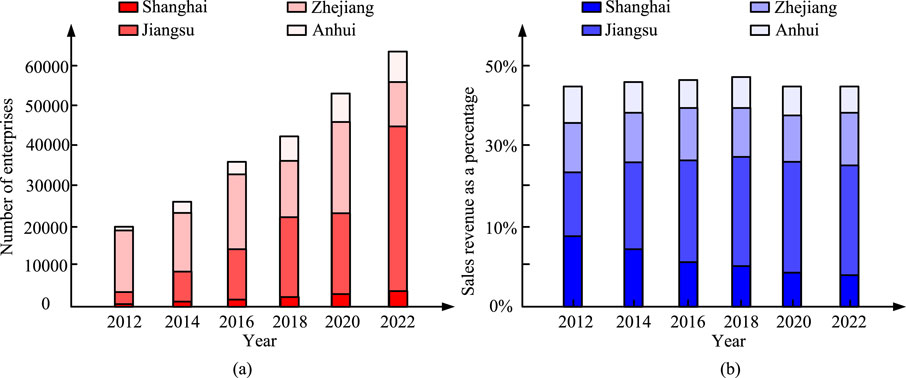
Figure 2. Changes in the Number of HTEE and R&D-S in the YRD region, 2010–2022. (a) Changes in the number of high-tech energy technology enterprises, (b) Changes in R&D sales of high-tech energy technoloy companies.
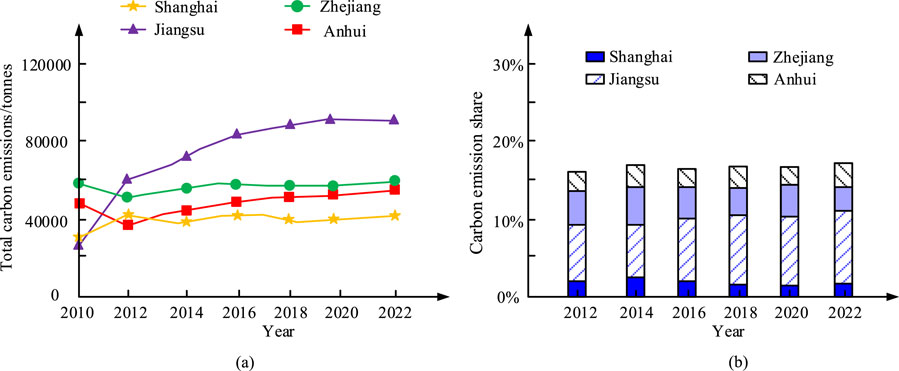
Figure 3. TCE and CES in the YRD region, 2010–2022. (a) Change in weight of carbon emissions, (b) Share of carbon emissions.

Table 1. Changes in the ERI in the YRD region, 2010–2022.
4 Method design for the impact of YRD region’s ETI on LCE under spatial econometric analysis
Through the analysis of the current development status of YRD region ETI and LCE, this study proposes two hypotheses in total. Hypothesis 1: The ETI level of YRD region has a significant SSE effect on the LCE development. Hypothesis 2: The increase in ETI levels in the YRD region has an active promoting effect on developing local LCE. To prove the proposed hypothesis, this study will use a series of SMMs to conduct empirical analysis on the correlation between ETI and LCE development.
4.1 Indicator selection and variable description
To more accurately reveal the relationship between ETI and LCE development in the YRD region, this study used panel data from 33 cities in YRD from 2010 to 2022 for analysis. Table 2 shows the selected relevant indicators.
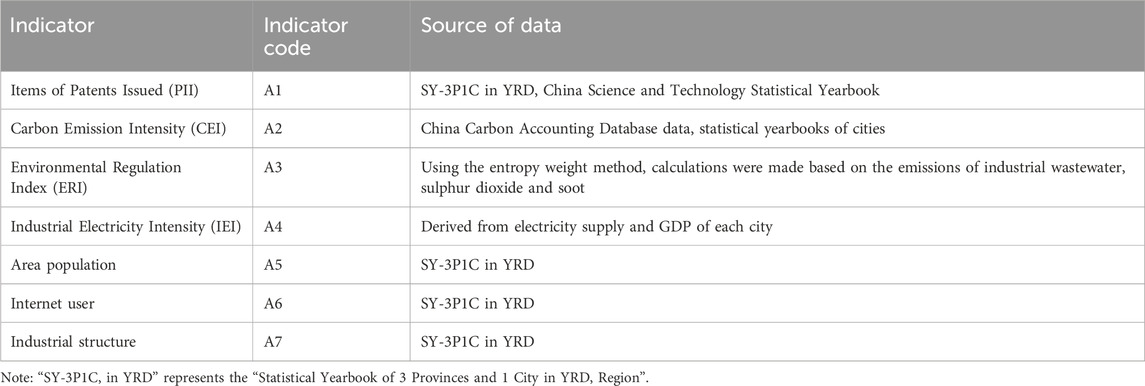
Table 2. Explanatory table of indicators.
In Table 2, a total of seven indicators are selected, including PII, CEI, ERI, IEI, regional population, internet users, and industrial structure. The CEI indicator is represented by the carbon emissions per unit of regional GDP. Among the seven indicators mentioned above, energy-related PII can reflect the level of ETI, CEI can reflect the development level of LCE, and ERI can reflect both the level of ETI and the development level of LCE.
Due to the need to use entropy weight method to determine the weights of ERI, the extreme value method is first used to standardize the various data in ERI. When the data of ERI are all positive indicators, the standardized processing formula is Equation 1 (Mahmood and Ali, 2023; Tiangui et al., 2022).
In Equation 1,
When there are
In Equation 3,
In Equation 4,
In Equation 5,
In Equation 6,
In Equation 7,
In Equation 8,
4.2 Construction of spatial models
Spatial Auto-correlation Test (SACT) is a type of SMM commonly used to explore the spatial relationships between variables. Common SACT methods include Moran’s I and Geary’s C index analysis (Zhao et al., 2019; Zhang et al., 2023). This study mainly uses Moran’s I to analyze the spatial correlation level between LCE and ETI. The first is to build the SWM and set the mathematical model of the Adjacency Weight Matrix (AWM) in the matrix, as shown in Equation 9 (Guo et al., 2021).
In Equation 9,
In Equation 10,
In Equation 11,
Due to the ability of SACT to quantitatively describe the spatiotemporal dependence of LCE in various cities of YRD, this study conducts SACT on LCE (Tian et al., 2023; Yu et al., 2018). The Global Moran’s I in global SACT is adopted to reveal the spatial correlation within the overall region. The expression of Global Moran’s I is shown in Equation 12.
In Equation 12,
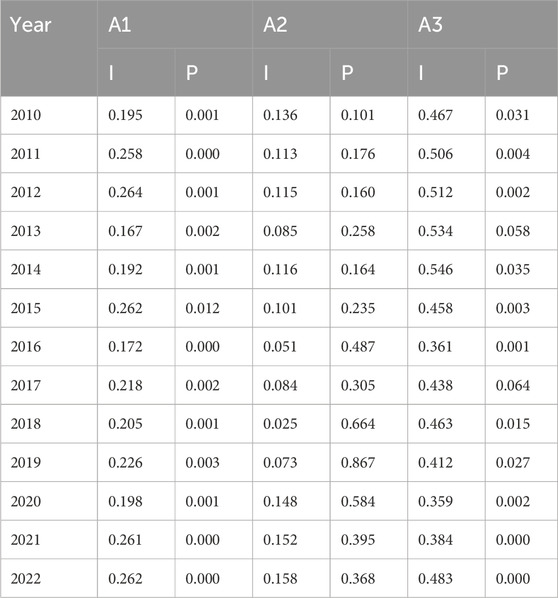
Table 3. Moran’s index under the SAM.
Table 3 shows the Moran’s Index of 33 cities A1, A2, and A3 in YRD under SAM from 2010 to 2022. The value range of Moran’s index is between −1 and 1, and a value close to one indicates positive spatial auto-correlation, meaning similar values tend to cluster together. A value close to −1 indicates negative spatial auto-correlation, meaning similar values tend to be dispersed. A value close to 0 indicates no significant spatial auto-correlation, meaning that the observed values are randomly distributed in space. Table 3 shows that A1, A2, and A3 all exhibit spatial clustering in SAM.
In addition to using global SACT to analyze the spatial correlation of a certain attribute value in the overall direction of the region, it is also necessary to use local SACT to analyze the specific locations where spatial clustering occurs (Xu Z. et al., 2023; Yang X. et al., 2022). Three time points, 2010, 2015, and 2020, are selected to analyze the local auto-correlation Moran scatter distribution of CEI, ETI, and ERI in the YRD region.
Table 4 shows the Local Spatial Auto-Correlation (LSAC) Moran scatter clustering of CEI for 33 cities. Among them, H-HA indicates that two nearby cities with high CEI exhibit significant spatial clustering. L-LA indicates that two nearby cities with low CEI exhibit significant spatial clustering. L-HA and H-LA both indicate that there is no clustering in space. In Table 4, H-HA cities are generally cities with slightly underdeveloped economies such as Lianyungang, Huai’an, and Huainan. These cities have a high CEI in their economic development process, so they are unable to drive surrounding cities towards LCE direction. On the contrary, most of the cities in L-LA are relatively developed first tier cities such as Hangzhou, Shanghai, Nanjing, and Suzhou. These cities themselves have a relatively high level of economic development, which can drive some surrounding cities to develop towards LCE. Overall, most cities have gradually developed towards the L-LA and L-HA directions over time, indicating a decreasing trend in the total CEI of the YRD region.
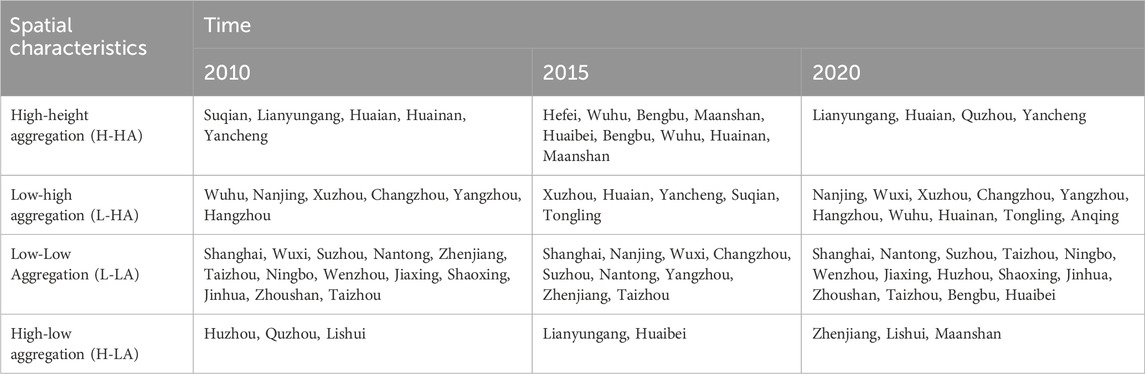
Table 4. Local spatial auto-correlation of CEI Moran scatter city clustering.
Table 5 shows the clustering of LSAC Moran scatter points at the ETI level. PII represents the ETI level of the YRD region (Xie et al., 2022). Both H-HA and L-LA data exhibit significant spatial clustering. This is because regions with higher or lower levels of ETI are more prone to spatial concentration. In addition, cities with high levels of energy innovation, such as Shanghai, Suzhou, and Wuxi, generally have more developed economies. On the contrary, cities such as Ma’anshan, Tongling, and Anqing are mostly concentrated in areas with low energy innovation levels, which is related to their relatively lagging economic development. Overall, as time goes on, the number of cities in the L-LA area shows a gradually decreasing trend, indicating that ETI has a certain radiative driving effect.
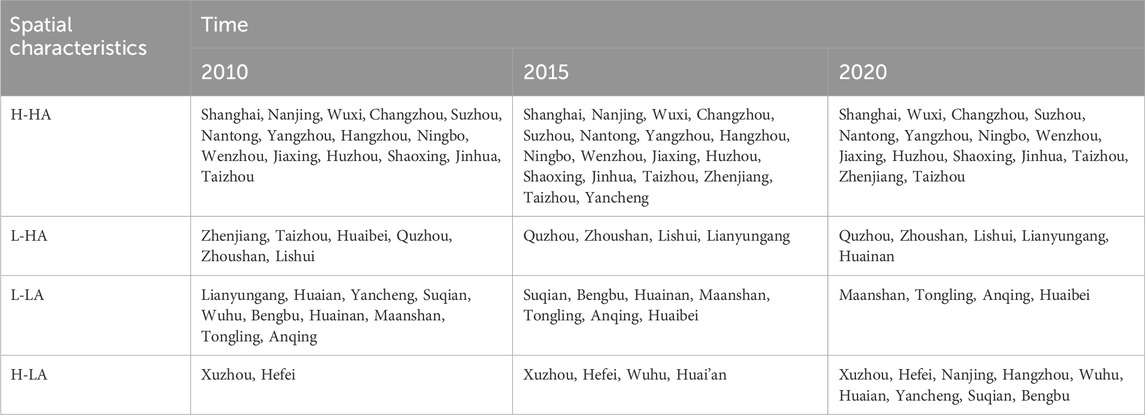
Table 5. Local spatial auto-correlation of energy ETI Moran scatter city clustering.
Table 6 shows the Moran scatter distribution of ERI LSAC in 2010, 2015, and 2020. ERI data only shows significant clustering in the H-HA quadrant, and does not exhibit significant spatial clustering features in the other three quadrants.
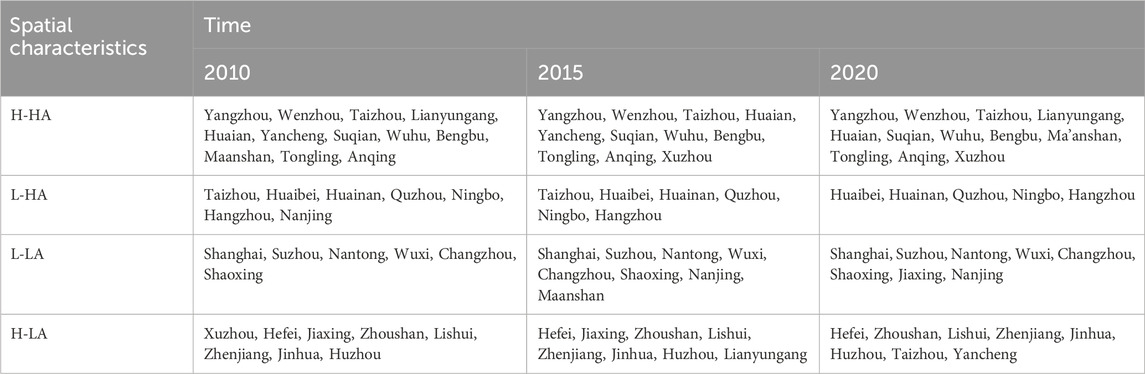
Table 6. Local spatial auto-correlation of ERI Moran scatter urban agglomeration.
5 Empirical results on the impact of ETI in YRD region on LCE under spatial econometric analysis
Global and local SACT reveal the spatial clustering degree of CEI, ETI, and ERI in different cities at different time points. This study further utilizes empirical analysis related detection methods to explore the correlation between the selected indicators, thereby proving the correctness of the hypothesis.
5.1 Descriptive statistical results
Descriptive statistics were used to analyze the impact relationship between various correlation coefficients, and the correlation coefficient analysis between various variables was obtained as shown in Table 7.
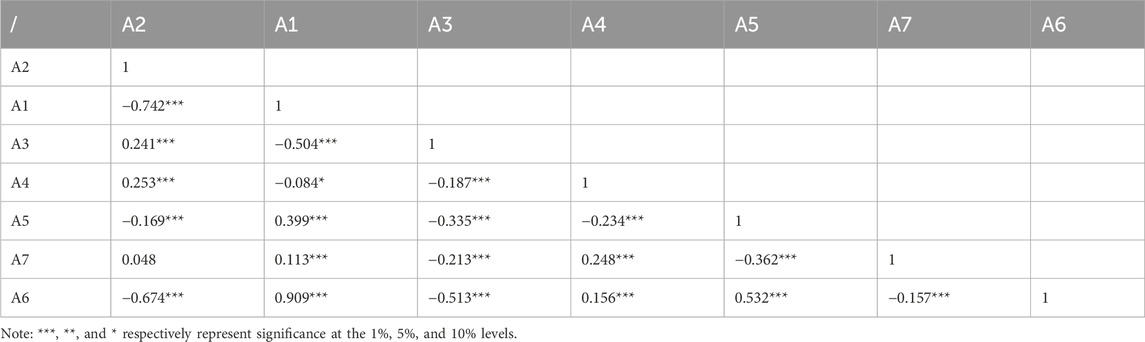
Table 7. Analysis of correlation coefficients of variables.
Table 7 reveals the correlation coefficients and their significant characteristics among various variables. There is a significant correlation between the selected variables, with a 1% significance level between PII and CEI, which fully demonstrates that an increase in ETI level will effectively reduce the intensity of carbon emissions and promote the development of LCE. Figure 4 presents the descriptive analysis results between each variable.

Figure 4. Descriptive statistical analysis of variables.
Figure 4 shows the descriptive statistical analysis of each variable. These include Low-Carbon Technology Innovation (LTI) and Low-Carbon Economy Network Technology (LENT), which measures regional R&D and application capabilities in emerging low-carbon technologies. LTI reflects a region’s level of technological innovation to promote the development of LCE. LENT mainly measures the development of Internet and information technology infrastructure in a region to support the development of LCE. The large standard deviation between LTI and LENT indicates significant differences in ETI levels and internet development speed across different regions. The standard deviation of IEI is the smallest, so its impact on the development level of LCE in various regions is relatively small.
5.2 Selection results of spatial econometric models
Using five different spatial econometric testing methods to explore the spatial correlation between energy innovation level and LCE, the testing results of the five spatial models are shown in Table 8.
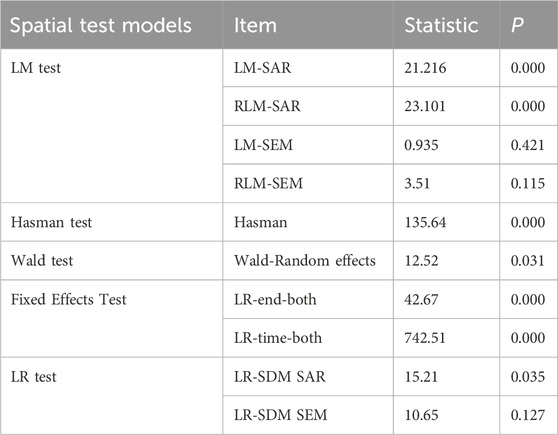
Table 8. Test results of the five spatial models.
In Table 8, a total of five testing methods, LM, Hasman, Wald, fixed effects, and LR, were selected to explore the relationship between energy innovation and LCE, development. LM-SAR, LM-SAR, Hasman, Wald-Random effects, LR-end-bottom, LR-time-both, LR-SDM, SAR, LR-SDM SEM, were all significant at the 1% level, therefore SDM, was used for further analysis.
5.3 The results of the spatial panel durbin model
There is a significant spatial correlation between energy technology, LCE, and ERI in the YRD region. Therefore, CEI serves as the dependent variable and technological innovation level as the core explanatory variable to construct a spatial panel Durbin model for further analysis of its spatial effects. Table 9 shows the comparison of different panel models.
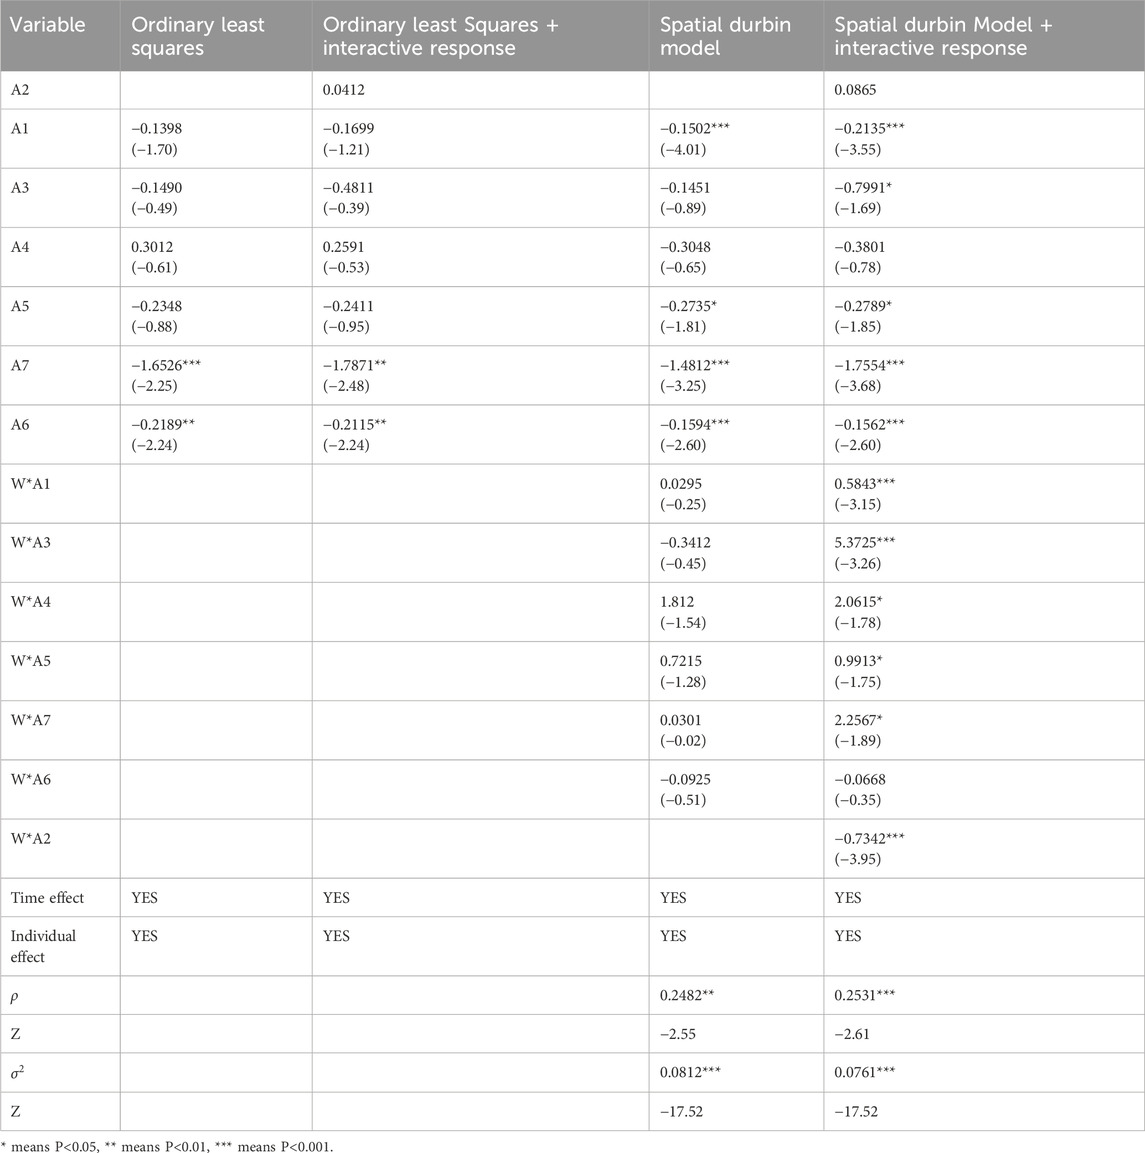
Table 9. Comparison results of different panel models.
According to Table 9, the impact of ETI under spatial panels on LCE is significant at the 1% level, while it is not significant in ordinary panels. This indicates that the ETI under the space panel has a significant spatial effect on the development of LCE, and the improvement of energy technology level can suppress CEI and promote the development of LCE. In addition,
In Table 10, the values of
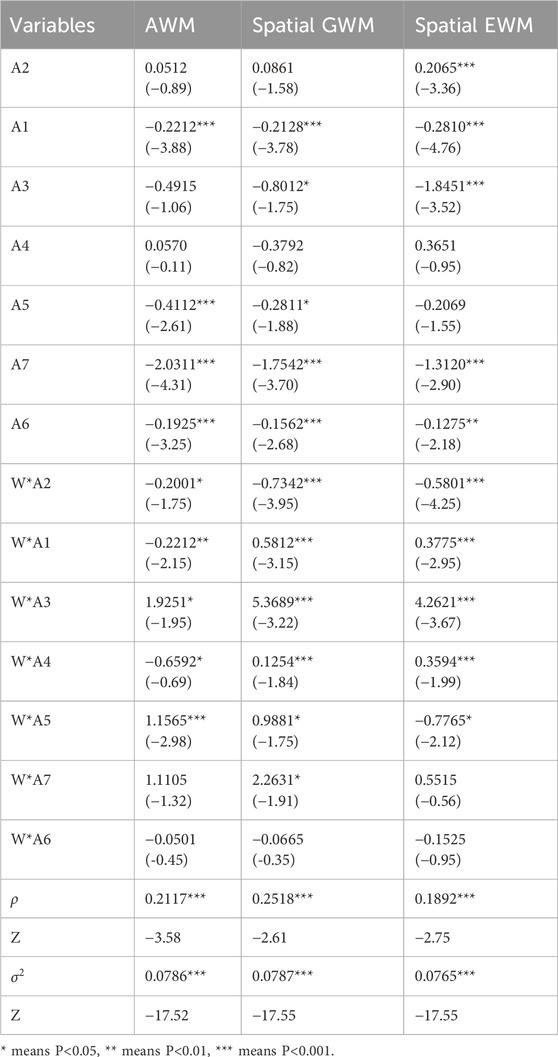
Table 10. Spatial Durbin regression results.
In Table 11, the regression results under the Durbin model show that all core variables can be significant at the 10% level under different circumstances. From the perspectives of AWM, GWM, and EWM, when the ETI level increases by 1%, the LCE development level of the YRD region will increase by 21.15%, 19.95%, and 26.98%. In addition, the ERI at all three matrix angles increases by 1%. In summary, combining the ETI level of the YRD region with ERI has a significant SSE effect on the development of LCE, and improving the interaction between energy innovation level and ERI can effectively promote the development of local LCE. To further verify the stability of the results of the paper, more control variables are used to analyze the model. The variables introduced include Per capita Gross Domestic Product (PGDP), Foreign Direct Investment (FDI), Population Density (POPD), Industrial Structure (INDS), Education Level (EDU), Internet Penetration (INTERNET), and Environmental Investment (ENVI), and the results are shown in Table 12.
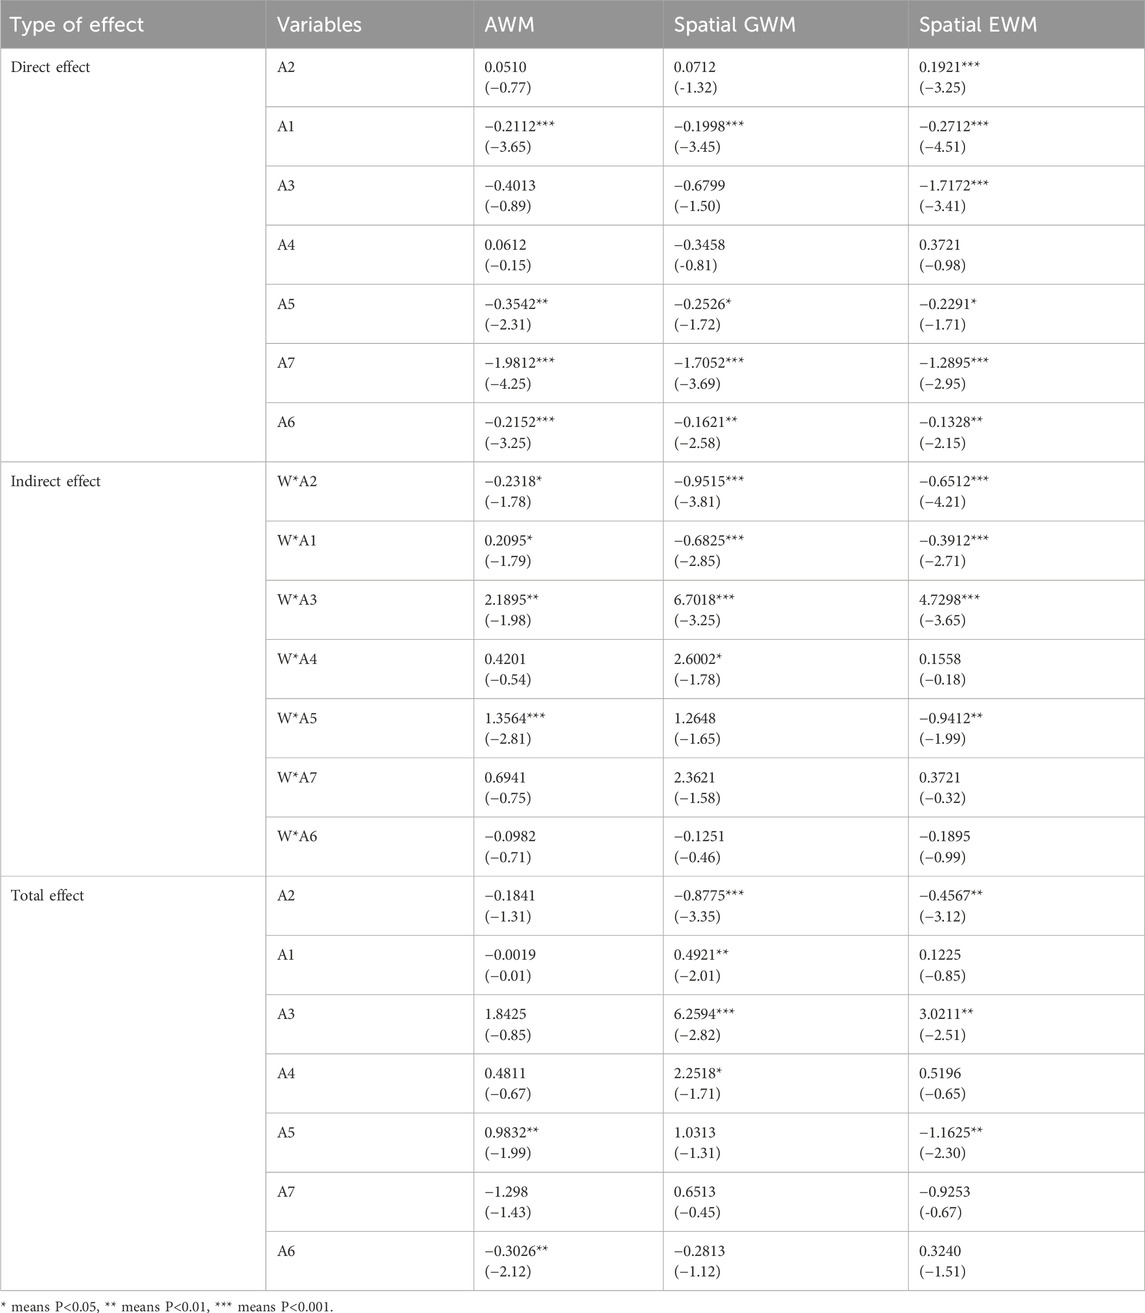
Table 11. Spatial Durbin decomposition effects.
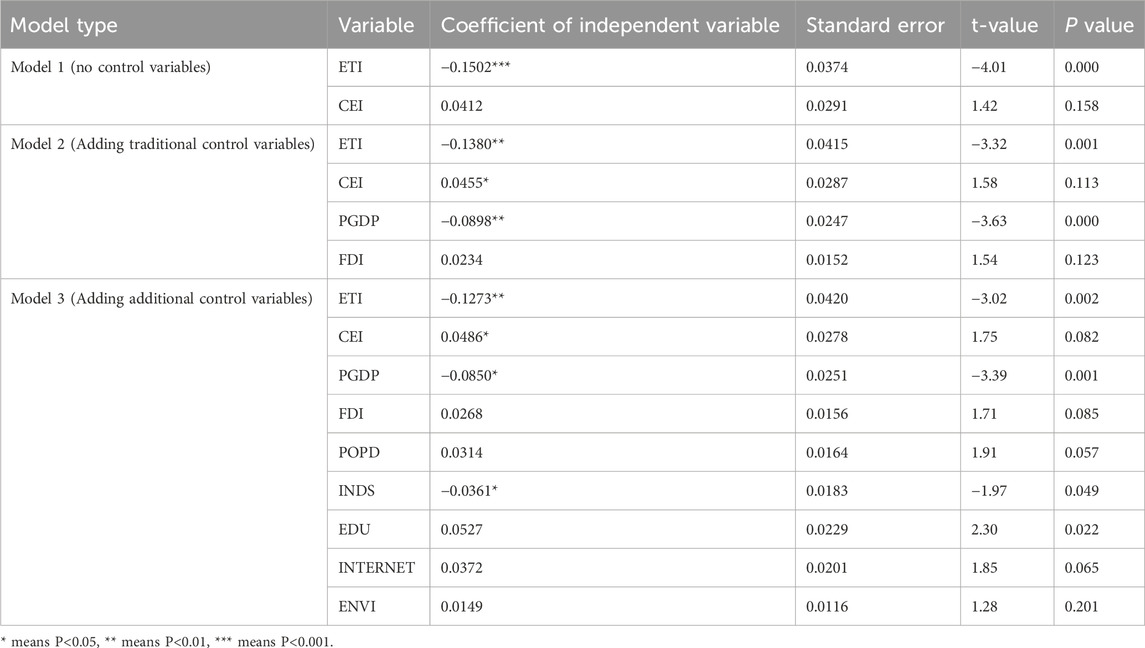
Table 12. Comparison of model results by introducing control variables.
Among the results in Table 12, regression results of model 1 show that ETI has a significant negative relationship with CEI, which accords with the preliminary hypothesis. The coefficient of ETI in Model 2 has decreased slightly, but it is still significant. This suggests that the control variables have limited influence on the primary relationship. At the same time, the introduced PGDP has a significant negative impact on CEI, reflecting the relationship between the level of economic development and carbon emissions. Model 3 further reduces the ETI coefficient, but the correlation remains significant after the introduction of multiple control variables. In this model, several new control variables (such as POPD, INDS, EDU, etc.) also show significance, indicating that they have an impact on the relationship between LCE and ETI.
According to the above empirical results, there is a significant negative correlation between ETI and LCE. This result not only confirms the validity of Hypothesis 1 but also illustrates the important role of ETI in promoting the development of LCE. When ETI levels increase, CEI is significantly reduced, indicating that advanced energy technologies can effectively reduce GGE and support the construction of a LCE. This finding is consistent with expectations in the theoretical framework, suggesting that technological innovation can effectively drive the transition to a LCE by improving energy efficiency and promoting clean energy. For the test of Hypothesis 2, empirical analysis also shows that the ERI plays an important moderating role in the interaction between ETI and LCE. Specifically, in regions with stronger environmental regulations, the relationship between ETI and LCE is more significant. This indicates that when the policy environment imposes more stringent requirements for LTI, enterprises will increase their investment in clean technology research and development to meet the policy standards. Consequently, this will promote the development of LCE. This result shows that government policy is not only the direct driving force to promote technological innovation but also guides the direction of LCE to a certain extent.
The specific mechanism between ETI and LCE is primarily reflected in the promotion of ETI, which directly reduces carbon emissions per unit production process by introducing more efficient clean energy technologies. Furthermore, the promotion of ETI optimizes and purifies the energy structure, compelling enterprises to prioritize environmental performance in production and operation. The implementation of innovative technologies has the dual benefit of reducing reliance on traditional high-carbon energy sources and promoting the widespread adoption of renewable energy sources. This, in turn, fosters societal awareness and acceptance of LCE.
6 Conclusion and policy recommendations
To explore the relationship between the ETI level of YRD region and the development of LCE, this study used empirical analysis methods to construct an SDM analysis to analyze the data of YRD 33 cities from 2010 to 2022. Using this data as a sample, the impact of ETI level on LCE was obtained. The research results indicated that cities with higher LCE levels in the YRD region had higher spatial clustering, and ETI could have a positive impact on the development of LCE. In addition, the combination of energy innovation and environmental regulations could have a significant SSE effect on the development of LCE, and the interaction between the two could effectively promote the positive development of LCE. Based on the above results, the study proposes the following policy recommendations. First, the government should set up a special fund to support the research and development and application of clean energy technologies, and guide enterprises and scientific research institutions to increase investment in low-carbon technologies. Second, the government should encourage and support the establishment of joint innovation and technology transfer platforms between enterprises, research institutions, universities, and the government to promote resource sharing and technology exchange. Third, the government should establish and strictly implement more detailed environmental regulatory policies, including carbon emission standards, technical standards, and market access conditions, to promote enterprises to low-carbon transition. The fourth strategy is to raise social awareness of low-carbon and clean technologies through public promotion, education, and training, and encourage public participation in low-carbon actions. The fifth is to encourage cities in the YRD region to share low-carbon development experience and technology application cases, and promote regional coordinated development through institutional innovation and policy coordination.
Data availability statement
The original contributions presented in the study are included in the article/supplementary material, further inquiries can be directed to the corresponding author.
Author contributions
SZ: Investigation, Supervision, Writing–review and editing. JW: Investigation, Writing–original draft.
Funding
The author(s) declare that no financial support was received for the research, authorship, and/or publication of this article.
Conflict of interest
The authors declare that the research was conducted in the absence of any commercial or financial relationships that could be construed as a potential conflict of interest.
Generative AI statement
The author(s) declare that no Generative AI was used in the creation of this manuscript.
Publisher’s note
All claims expressed in this article are solely those of the authors and do not necessarily represent those of their affiliated organizations, or those of the publisher, the editors and the reviewers. Any product that may be evaluated in this article, or claim that may be made by its manufacturer, is not guaranteed or endorsed by the publisher.
References
Bai, D., Hu, J., Irfan, M., and Hu, M. (2023). Unleashing the impact of ecological civilization pilot policies on green technology innovation: evidence from a novel SC-DID model. Energy Econ. 125, 106813. doi:10.1016/j.eneco.2023.106813
Barma, M., and Modibbo, U. M. (2023). Multiobjective mathematical optimization model for municipal solid waste management with economic analysis of reuse/recycling recovered waste materials. J. Comput. Cognitive Eng. Knowl. Data Eng. 1 (3), 122–137. doi:10.47852/bonviewJCCE149145
Caglar, A. E. (2023). Can nuclear energy technology budgets pave the way for a transition toward low-carbon economy: insights from the United Kingdom. Sustain. Dev. 31 (1), 198–210. doi:10.1002/sd.2383
Gardiner, R., and Hajek, P. (2020). Interactions among energy consumption, CO2, and economic development in European Union countries. Sustain. Dev. Knowl. Data Eng. 28 (4), 723–740. doi:10.1002/sd.2023
Guo, Z., Chen, S. S., Yao, S., and Mkumbo, A. C. (2021). Does foreign direct investment affect SO2 emissions in the Yangtze River Delta? A spatial econometric analysis. Chin. Geogr. Sci. 31 (3), 400–412. doi:10.1007/s11769-021-1197-5
Haque, M. I. (2020). Oil price shocks and energy consumption in GCC countries: a system-GMM approach. Knowl. Data Eng. 23 (6), 9336–9351. doi:10.1007/s10668-020-01027-y
Hasanov, F. J., Khan, Z., Hussain, M., and Tufail, M. (2021). Theoretical framework for the carbon emissions effects of technological progress and renewable energy consumption. Sustain. Dev. Knowl. Data Eng. 29 (5), 810–822. doi:10.1002/sd.2175
Hou, X., Hu, Q., Liang, X., and Xu, J. (2023). How do low-carbon city pilots affect carbon emissions? Staggered difference in difference evidence from Chinese firms. Econ. Anal. Policy 79 (1), 664–686. doi:10.1016/j.eap.2023.06.030
Hu, H., Lv, T., Zhang, X., Xie, H., Fu, S., Geng, C., et al. (2023). Spatiotemporal heterogeneity and decoupling decomposition of industrial carbon emissions in the Yangtze River Delta urban agglomeration of China. Environ. Sci. Pollut. Res. 30 (17), 50412–50430. doi:10.1007/s11356-023-25794-z
Jiang, Z., Huang, Y., and Beil, D. R. (2022). The role of feedback in dynamic crowdsourcing contests: a structural empirical analysis. Manag. Sci. 68 (7), 4858–4877. doi:10.1287/mnsc.2021.4140
Karimi, A. N., Ahmadi, S. M. T., Nazeer, N., Zangoei, S., and Dehdar, F. (2023). The role of renewable energy consumption on environmental degradation in EU countries: do institutional quality, technological innovation, and GDP matter? Environ. Sci. Pollut. Res. Knowl. Data Eng. 30 (15), 44607–44624. doi:10.1007/s11356-023-25428-4
Li, H. A. O., Bhatti, Z., Abbas, Q., Ahmad, I. S. H. T. I. A. Q., Iqbal, N. A. D. E. E. M., and Aziz, B. A. B. A. R. (2024). Measuring low carbon energy, economic and environmental sustainability performance of BRICS. Singap. Econ. Rev. 69 (1), 357–376. doi:10.1142/S0217590820500617
Li, X., Han, L., Yang, L., and Zhang, T. (2023). Green development efficiency and spatial characteristics of urban clusters: a case of Yangtze River Delta city cluster. Emerg. Market. Fin. Trade 59 (7), 1993–2007. doi:10.1080/1540496X.2022.2161301
Liu, Y., and Han, Y. (2021). Impacts of urbanization and technology on carbon dioxide emissions of yangtze river economic belt at two stages: based on an extended stirpat model. Sustainability 13 (13), 7022–7023. doi:10.3390/su13137022
Mahmood, T., and Ali, Z. (2023). Analysis of Maclaurin symmetric mean operators for managing complex interval-valued q-Rung orthopair fuzzy setting and their applications. JCCE 2 (2), 98–115. doi:10.47852/bonviewJCCE2202164
Meng, S., Sun, R., Guo, F., and Deng, Y. (2023). The mechanism of renewable energy consumption, technological innovation and carbon productivity-an empirical study of Chinese data. Environ. Sci. Pollut. Res. 30 (8), 20673–20687. doi:10.1007/s11356-022-23557-w
Panzera, D., and Postiglione, P. (2022). The impact of regional inequality on economic growth: a spatial econometric approach. Reg. Stud. 56 (5), 687–702. doi:10.1080/00343404.2021.1910228
Safdar, S., Khan, A., and Andlib, Z. (2022). Impact of good governance and natural resource rent on economic and environmental sustainability: an empirical analysis for South Asian economies. Environ. Sci. Pollut. Res. 29 (55), 82948–82965. doi:10.1007/s11356-022-21401-9
Tian, S., Meng, Y., Li, X., Si, L., and Yin, Y. (2023). Industrial co-agglomeration, Internet utilization, and the development of green and low-carbon cycle-based on the empirical study of 41 cities in the Yangtze River Delta of China. Environ. Sci. Pollut. Res. 30 (25), 66867–66896. doi:10.1007/s11356-023-27012-2
Tiangui, L., Hu, H., Zhang, X., Hualin, X., Wang, L., and Shufei, F. (2022). Spatial spillover effects of urbanization on carbon emissions in the Yangtze River Delta urban agglomeration, China. Environ. Sci. Pollut. Res. 29 (23), 33920–33934. doi:10.1007/s11356-021-17872-x
Ullah, K., Abbas, S., Tariq, M., Mahmood, N., and Kaechele, H. (2023). The symmetric and asymmetric impacts of green energy, eco-innovation, and urbanization in explaining low-carbon economy for Pakistan. Environ. Sci. Pollut. Res. 30 (12), 33375–33395. doi:10.1007/s11356-022-24407-5
Wang, L. J., Yang, P. L., Ma, J. J., Zhu, Z. N., and Tian, Z. H. (2023). Digital economy and industrial energy efficiency performance: evidence from the city of the Yangtze River Delta in China. Environ. Sci. Pollut. Res. 30 (11), 30672–30691. doi:10.1007/s11356-022-24353-2
Wang, X., Hong, K., Ren, X., and Taghizadeh-Hesary, F. (2024a). Can green finance act as a catalyst to renewable energy deployment? Evidence from China using a spatial econometric approach. Energy 311 (1), 133302. doi:10.1016/j.energy.2024.133302
Wang, Z., Wang, X., and Liang, L. (2019). Green economic efficiency in the Yangtze River Delta: spatiotemporal evolution and influencing factors. Ecosyst. Health Sustain. 5 (1), 20–35. doi:10.1080/20964129.2018.1559000
Wang, Z., Zhang, T., Ren, X., and Shi, Y. (2024b). AI adoption rate and corporate green innovation efficiency: evidence from Chinese energy companies. Energy Econ. 132 (1), 107499. doi:10.1016/j.eneco.2024.107499
Wu, Q., Li, Y., Wu, Y., Li, F., and Zhong, S. (2022). The spatial spillover effect of environmental regulation on the total factor productivity of pharmaceutical manufacturing industry in China. Sci. Rep. 12 (1), 11642. doi:10.1038/s41598-022-15614-8
Xie, F., Li, Y., and Zhang, B. (2022). Threshold effect of industrial agglomeration on carbon productivity in China’s Yangtze River economic belt: a perspective of technical resourcing. Environ. Sci. Pollut. Res. 29 (43), 64704–64720. doi:10.1007/s11356-022-20310-1
Xin, L., Sun, H., and Xia, X. (2023). Renewable energy technology innovation and inclusive low-carbon development from the perspective of spatiotemporal consistency. Environ. Sci. Pollut. Res. 30 (8), 20490–20513. doi:10.1007/s11356-022-23556-x
Xu, Y., Ge, W., Liu, G., Su, X., Zhu, J., Ran, Q., et al. (2023a). The impact of local government competition and green technology innovation on economic low-carbon transition: new insights from China. Environ. Sci. Pollut. Res. 30 (9), 23714–23735. doi:10.1007/s11356-022-23857-1
Xu, Z., Wang, X., and Wu, G. (2023b). Exploring the coupling relationship of industrial agglomeration and low-carbon economy considering spatiotemporal differentiation: an empirical study in China’s construction machinery industry. Front. Eng. Manag. 10 (2), 285–299. doi:10.1007/s42524-022-0197-1
Yang, G., Gui, Q., Supanyo, P., Zhang, F., Yang, X., and Gong, G. (2023b). Temporal and spatial changes and influencing factors of low-carbon economy efficiency in China. Environ. Monit. Assess. 195 (1), 55. doi:10.1007/s10661-022-10599-3
Yang, M., Wang, D., Chen, X., Lei, X., and Cao, L. (2023a). Influence mechanism of technological innovation of electric power industry on carbon emission reduction in China. Int. J. Clim. Change Strateg. Manage. 15 (2), 232–246. doi:10.1108/IJCCSM-04-2022-0055
Yang, X., Jia, Z., and Yang, Z. (2022b). Effect mechanism of intellectual property rights protection on city-level CO2 emissions in China: a spatial econometric perspective. Environ. Eng. Sci. 39 (2), 178–192. doi:10.1089/ees.2020.0524
Yang, Y., Wu, D., Xu, M., Yang, M., and Zou, W. (2022a). Capital misallocation, technological innovation, and green development efficiency: empirical analysis based on China provincial panel data. Environ. Sci. Pollut. Res. 29 (43), 65535–65548. doi:10.1007/s11356-022-20364-1
Yu, S., Hu, X., Zhang, X., and Li, Z. (2018). Convergence of per capita carbon emissions in the Yangtze River economic belt, China. Energy Environ. 30 (5), 776–799. doi:10.1177/0958305x18813620
Zeng, S., Gu, J., and Peng, X. (2023). Low-carbon cities comprehensive evaluation method based on Fermatean fuzzy hybrid distance measure and TOPSIS. Artif. Intell. Rev. 56 (8), 8591–8607. doi:10.1007/s10462-022-10387-y
Zhang, B., Yin, J., Jiang, H., and Qiu, Y. (2023). Spatial–temporal pattern evolution and influencing factors of coupled coordination between carbon emission and economic development along the Pearl River Basin in China. Environ. Sci. Pollut. Res. 30 (3), 6875–6890. doi:10.1007/s11356-022-22685-7
Keywords: spatial econometrics, durbin model, energy, technology, low carbon economy, innovation
Citation: Zhang S and Wang J (2025) The correlation between low-carbon economy and energy technology innovation in the Yangtze River Delta region under spatial econometric methods. Front. Environ. Sci. 13:1543124. doi: 10.3389/fenvs.2025.1543124
Received: 10 December 2024; Accepted: 24 February 2025;
Published: 15 April 2025.
Edited by:
Jinyu Chen, Central South University, ChinaReviewed by:
Ying Zhu, Xi’an University of Architecture and Technology, ChinaYuanfang Chai, Yunnan University, China
Copyright © 2025 Zhang and Wang. This is an open-access article distributed under the terms of the Creative Commons Attribution License (CC BY). The use, distribution or reproduction in other forums is permitted, provided the original author(s) and the copyright owner(s) are credited and that the original publication in this journal is cited, in accordance with accepted academic practice. No use, distribution or reproduction is permitted which does not comply with these terms.
*Correspondence: Shengdi Zhang, MjMxMjcwM0BtYWlsLm5hbmthaS5lZHUuY24=