 Yemiao Lin
 Junfeng Dai2*
- 1College of Environmental Science and Engineering, Guilin University of Technology, Guilin, China
- 2Collaborative Innovation Center for Water Pollution Control and Water Security in Karst Region, Guilin University of Technology, Guilin, China
- 3Guangxi Key Laboratory of Environmental Pollution Control Theory and Technology, Guilin University of Technology, Guilin, China
Introduction: Understanding the effects of water level fluctuations on wetland ecosystems is crucial for water resource management and ecological conservation. While there have been some studies on this topic, comprehensive analyses of how water level changes affect the hydrological connectivity and water quality of complex lake-type wetlands remain relatively limited. This work aims to explore the effects of water level changes on the connectivity and water quality of lake-type water bodies in the Huixian Karst Wetland, Guilin.
Methods: Water quality data for Mudong Lake from January 2021 to December 2022 were obtained by collecting monthly water samples and conducting laboratory tests for six common water quality parameters. Through a combination of remote sensing image data, drone image data and actual measured data on the Mudong Lake water level, the comprehensive ecological-hydrological connectivity index and comprehensive water quality index were used to evaluate the water level changes in Mudong Lake, water body connectivity, and water quality. The correlations between them were then analysed.
Results: The results show that as the water level increases, the degree of landscape fragmentation decreases, and the water connectivity index increases by 262%. In addition, as the water level increases, the comprehensive water quality pollution index shows an overall downward trend.
Discussion: However, the factors affecting lake water quality are complex and changeable. Future research could consider increasing the monitoring frequency during critical periods of rapid hydrological change, such as rainfall-runoff events, to capture more precise and detailed hydrological and water quality data. This study provides an important example of the effects of changes in water level and wetland connectivity on the water quality of a lake ecosystem.
1 Background
Lake-type wetlands, also known as lacustrine wetlands, are located within enclosed water bodies such as lakes and reservoirs. They are low-lying areas that are temporarily or permanently inundated, with water depths not exceeding 2 m Lakes, as integral components of inland wetlands, play a crucial role in maintaining water quality, preserving water resources, and providing habitats for flora and fauna while also offering valuable resources for human societies. However, over the past century, the hydrological conditions of most lakes, both internally and externally, have undergone significant changes (De Jager et al., 2012; Wu et al., 2019). Due to ongoing climate variability and persistent human activities (Bridgewater and Kim, 2021; Kraemer B. M. et al., 2020; Wayne et al., 2017; Woolway R. I. et al., 2020), further alterations in these conditions are anticipated over the next century (Milly et al., 2002; Palmer et al., 2008). These hydrological changes are expected to impact the ecological structure, connectivity of water bodies, and water quality and quantity of lakes.
Water level fluctuations, as a key indicator of lake water balance and a critical process influencing lake ecosystem structure and function, are highly sensitive to human interventions and climate change, and have significant impacts on lake ecosystems. (Zohary and Ostrovsky, 2011; Gownaris et al., 2018). The effects of water level changes on water quality in lake-type wetlands are complex and varied (Huang X. Y. et al., 2023; Yin Y. Z. et al., 2024), driven primarily by both long-term and short-term fluctuations in water level. These changes directly influence water quality, affect the transport and distribution of nutrients, and consequently induce alterations in water quality. Furthermore, fluctuations in water level can impact the stability of aquatic ecosystems, leading to changes in food web structure (Li et al., 2021a) and species richness. For example, seasonal variations in water levels influence the distribution of vegetation and species diversity in the Everglades wetlands of Florida, United States (van der Valk et al., 2015).
The Huixian Karst Wetland, classified as a lake-type wetland, is renowned for its unique geological landscapes and rich biodiversity. Additionally, the Huixian Wetland holds significant importance in terms of ecological tourism and scientific research. Mudong Lake, which is situated in the core area of the Huixian Karst Wetland, is the largest water body within the wetland, and its evolution closely influences the wetland environment. Therefore, studying hydrological and ecological indicators such as water level, water quantity, water body connectivity, and water quality in Mudong Lake is of paramount importance for its conservation and for sustainable development within the basin.
Due to unsustainable development practices, such as continuous land reclamation for agriculture and the establishment of fishponds, Mudong Lake has experienced a dramatic reduction in water area from its original 2,100 ha to less than 90 ha. Additionally, during periods of low water levels, severe water shortages further compromise structural integrity and functionality. Fragmentation of the Mudong Lake landscape has intensified, affecting the overall integrity and connectivity of the lake, while water pollution has exceeded the self-purification capacity of the lake. Hence, recognizing the close connection between lakes and wetlands and implementing strategies to protect and restore the ecological balance of lakes are pressing issues that need to be addressed.
At present, research on Mudong Lake primarily focuses on biodiversity surveys and the assessment of pollution and risks associated with lake water and sediment, including nitrogen, phosphorus, heavy metals, and antibiotics. However, limited research has focused on the relationship between water level fluctuations, water quality changes, and the spatial patterns of lakes. Based on collected data on water level, water quality, and remote sensing imagery of Mudong Lake, this study aims to investigate how landscape patterns and water quality respond to water level changes. The findings are expected to provide valuable insights for water pollution control and ecological hydrology management in Mudong Lake.
2 Summary and data sources
2.1 Overview of Mudong Lake
Mudong Lake is located within the jurisdiction of Mudong village, near the middle of the ancient Guiliu Canal in Huixian Wetland, Huixian town, Lingui District, Guilin city, and surrounds the solitary karst peak Longshan. The lake receives input from the Li River upstream and discharges into the Liu River downstream. As an irregular river-fed lake, it is the largest existing water area in the Huixian Wetland. This low-latitude research area features a subtropical monsoon climate characterized by hot and rainy summers and dry and less rainy winters. Mudong Lake is situated in the relatively flat Gufeng Plain, with elevations ranging mostly from 147 m to 150 m. The northern part of Mudong Lake is a typical karst peak cluster valley, with towering peaks reaching elevations of approximately 300–500 m. The southern part consists of the Jiaguan Ridge Mountains, with peak elevations generally ranging from 200–400 m. This terrain characterized by high elevations in the north and south and low-elevation flat areas in the middle is conducive to the convergence of surface water flow towards the middle.
The aquatic plants in Mudong Lake are relatively lush, but with the invasion of alien species, which occupy the water surface and compete for the ecological niches of the original species, the composition of vegetation in Mudong Lake tends to be uniform. Coupled with large-scale agricultural development and pond aquaculture, fragmentation of the lake’s surface and accelerated loss of water resources are evident. Mudong Lake is surrounded by numerous farmlands and fishponds; rice is cultivated mainly in summer, and vegetables are cultivated sporadically in winter. Excess fertilizer continuously pollutes the water body through drainage channels and soil residues. In addition, nearby villagers raise ducks and geese freely in the waters of Mudong Lake, directly polluting the water body with poultry farming wastewater. The overview map of the study area is shown in Figure 1.
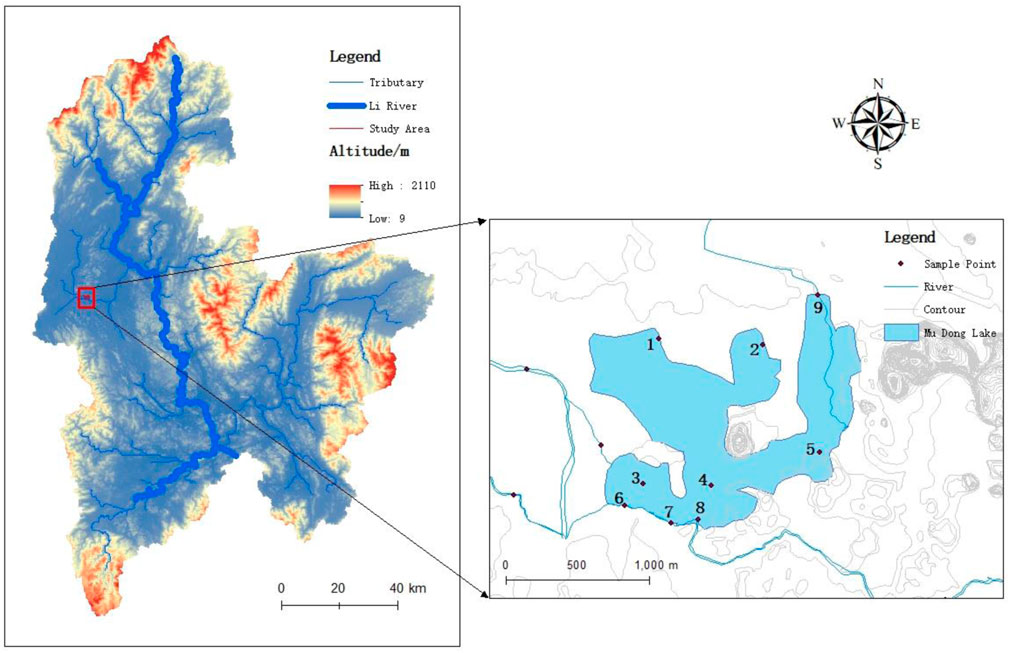
Figure 1. Schematic diagram of Mudong Lake, its surrounding water system and nine water quality sampling points.
2.2 The data sources
The data sources for this article primarily consist of water quality data obtained from field measurements and laboratory experiments. Water samples were collected at a depth of 10–20 cm below the water surface at each sampling site using 1 L amber glass bottles. The pH, dissolved oxygen (DO), and temperature were measured on-site. The samples were then transported to the laboratory for the analysis of total nitrogen (TN), ammonia nitrogen (NH₃-N), nitrate nitrogen (NO₃⁻-N), and total phosphorus (TP). To ensure accurate results, the analyses were completed within 48 h, with the samples stored at 4°C during this period.The analytical methods used were:Total nitrogen, Determined using alkaline potassium persulfate digestion and ultraviolet spectrophotometry (HJ 636–2012); Ammonia nitrogen (NH₃-N),Measured using Nessler’s reagent colorimetric method (HJ 535-2009); Nitrate nitrogen (NO₃⁻-N), Measured using ultraviolet spectrophotometry (HJ/T 346-2007); Total phosphorus (TP), Determined using the ammonium molybdate spectrophotometric method (GB 11893-89).
Sentinel remote sensing image data (with less than 9.7% cloud cover) were sourced from the European Space Agency (https://dataspace.copernicus.eu/). Unmanned aerial vehicle (UAV) image data across the study area (with a resolution of approximately 0.2 m) were captured using a DJI Phantom 4 RTK quadcopter drone in September 2021, December 2021, and June 2022. The monthly rainfall data were sourced from the Guilin Hydrological Station, while the daily water level and temperature data were obtained from 10 HOBO-U20 self-recording water level loggers.
2.3 Research methodology
2.3.1 UAV monitoring
Aerial photographs of the research area were captured by a UAV over a two-day period to obtain high-precision remote sensing images. Based on shape, colour, texture, and spectral characteristics combined with ground survey results, land cover classification was performed on three-phase remote sensing images. The random forest method was employed, with the classification results of the majority decision trees serving as the final classification result for each pixel (Breiman, 1996; Breiman, 2001). During the field sampling process at Mudong Lake, on-site field surveys were conducted to determine ground land cover types and corresponding image features of remote sensing images while referencing high-resolution remote sensing images from Google Earth.
2.3.2 Ecological hydrological connectivity comprehensive index method
The ecological hydrological connectivity composite index has been widely applied in the study of ecosystems such as wetlands, lakes, and watersheds, and is well-recognized in academic research with proven applicability and effectiveness. Due to the differences in units and physical meanings among various landscape indices, these indices cannot be directly used for calculation. Therefore, it is necessary to standardize each index. The range method can standardize data with different units. In the assessment of lake connectivity, evaluation indices can be positively (CECI- Comprehensive Ecological-Hydrological Connectivity Index, CON- Connectivity Index, COH- Patch Cohesion Index) or negatively (DIV- Divergence Index, FN- Fragmentation Index)related to connectivity. The negatively related indices can be converted to positively related indices for easier comprehensive analysis. As shown in Equations 1, 2
In the equation, Yi represents the standardized value of the i-th index, Xi represents the actual value of the i-th index, Xmax represents the actual maximum value of the i-th index, and Xmin represents the actual minimum value of the i-th index.
2.3.3 Landscape pattern index method
The landscape pattern indices can be calculated and analysed at both the class level and landscape level. In this study, we selected landscape indices at the class level to analyse the landscape dynamic patterns in the Mudong Lake watershed. Type-level analysis leverages high spatial resolution data, such as remote sensing and field observation data, to depict the spatial patterns of different water body types and the impact of water level fluctuations on water surface area and water quality in greater detail, thereby providing clearer and more accurate analytical results for the study (Bai J. H. et al., 2008; Liu J. P. et al., 2014; Zhao Y. L. et al., 2024). These indices have been widely used in similar studies and have proven effective in capturing the key landscape attributes relevant to our research questions. Fragstats 4.2 was utilized for calculating the landscape pattern indices, and the selected landscape pattern indices are as shown in Equations 3–10:
Patch density (PD):
In the equation:
- PD represents patch density, expressed as patches per hectare (hm^2).
- N represents the number of patches.
- A represents the patch area in hectares (hm^2).
Largest patch index (LPI):
In the equation:
- LPI represents the largest patch index.
- amax represents the maximum area of a patch of a certain type.
A represents the total area of patches of a certain type.
The range of the largest patch index is from 0 to 100.
Landscape shape index (LSI):
In the equation:
- LSI represents the landscape shape index.
- li represents the sum of the perimeters of all patches of landscape type i.
- minli represents the minimum perimeter of patches of landscape type i.
Perimeter-Area Fractal Dimension (PAFRAC):
In the equation:
- PAFRAC represents the perimeter-area fractal dimension.
- m represents the total number of landscape types.
- n represents the total number of patches for landscape type i.
- aij represents the area of patch ij.
- pij represents the perimeter of patch ij.
Connectivity index (CONNETCT):
In the equation:
- CONNECT represents the connectivity index.
- ni represents the number of patches for the i-th landscape type.
- cijk represents the connectivity status between patches j and k of the i-th landscape type, where 0 indicates disconnected and 1 indicates connected.
Patch cohesion index (COHESION):
In the equation:
- COHESION represents the patch cohesion index.
- pij represents the perimeter of patch ij.
- aij represents the area of patch ij.
- A represents the total landscape area.
Division index (DIVISION):
In the equation:
- DIVISION represents the division index.
- aij represents the area of patch ij.
- A represents the total landscape area.
- m represents the total number of landscape types.
- n represents the total number of patches for landscape type i.
Fragmentation index (FN):
In the equation:
- FN represents the fragmentation index.
- Np stands for the total number of landscape patches.
- Nc denotes the ratio of the total landscape area to the minimum patch area.
The ecological-hydrological connectivity composite index integrates various landscape indices to provide a more quantitative and intuitive representation of the changes in connectivity of lakes under different water levels. To achieve this goal, both connectivity and fragmentation aspects are considered, utilizing four landscape indices—the connectivity index, patch cohesion index, division index, and fragmentation index—to construct the ecological-hydrological connectivity composite index. As shown in Equation 11.
In the equation:
- CECI represents the ecological-hydrological connectivity composite index.
- CON stands for the connectivity index.
- COH represents the patch cohesion index.
- DIV denotes the division index.
- FN stands for the fragmentation index.
2.3.4 Pearson correlation analysis method
The Pearson correlation analysis method is a commonly used method for analysing relationships and involves measuring the strength of the linear correlation between two variables. Absolute values of correlation coefficients between 0.1 and 0.3 indicate a weak correlation between variables, absolute values between 0.3 and 0.5 indicate a moderate correlation, and values above 0.5 indicate a strong correlation between variables. A P value <0.05 indicates a significant correlation between two variables; P <0.01 indicates a highly significant correlation between two variables. As shown in Equation 12
2.3.5 Comprehensive pollution index method
The comprehensive pollution index method is derived from the assessment of individual water quality parameters, and the measured values of each water quality assessment factor are compared to their respective standards. It can integrate multiple pollution factors, providing a comprehensive assessment of pollution and avoiding the issue that a single pollution factor may not fully reflect the overall water quality condition.This comparison yields the single pollutant index Pi. The comprehensive pollution index P is obtained by summing the single pollutant indices with equal weights. As shown in Equations 13, 14.
In the equation:
- Pi represents the pollution index of water quality indicator i at the monitoring point.
- n is the number of water quality indicators included in the assessment.
- Ci is the measured concentration of water quality indicator i at the monitoring point.
- Si is the assessment standard of water quality indicator i.
- P is the comprehensive pollution index of water quality.
The comprehensive pollution index categorizes water bodies into four classes based on their magnitude:
- When P ≤ 0.8, the water quality is considered satisfactory.
- When 0.8 < P ≤ 1.0, the water quality is considered mostly satisfactory.
- When 1.0 < P ≤ 1.5, the water quality is considered polluted.
- When P > 1.5, the water quality is considered heavily polluted.
2.3.6 Calculation of the water level, surface area, and volume of Mudong Lake
Changes in lake volume ultimately manifest as variations in lake water level and surface area. When the lake water level rises, the surface area increases, and the lake volume increases. Conversely, when the lake water level decreases, the surface area diminishes, and the lake volume decreases. The fluctuations in lake volume are closely associated with changes in lake water level and surface area. The variation in volume caused by minor fluctuations in water level can be expressed using the Equations 15–17:
In other words,
In the equation:
- L1 is the minimum monitored water level of the lake.
- VL1 represents the dead storage capacity of the lake at water level L1.
- L2 denotes any arbitrary water level of the lake.
- VL2 corresponds to the lake volume at water level L2.
Integrating the water level–area curve yields the water level–volume relationship for Mudong Lake (Peng et al., 2023).
The relationships among water level, surface area, and volume are crucial for analysing the impacts of water level changes on connectivity and water quality. As the water level rises, the lake area expands, enhancing connectivity with surrounding water bodies. Changes in water volume directly affect hydrodynamics and water quality. The framework of these relationships aids in gaining a deeper understanding of how lake ecosystems respond to fluctuations in water level.
3 Results and analysis
3.1 The impact of water level changes on water body connectivity
The water level is an important indicator characterizing the dynamic evolution of rivers and lakes, with direct or indirect impacts on the aquatic environment (Mao et al., 2023). Currently, there is no unified evaluation method or grading criterion for assessing hydrological connectivity. Therefore, based on other research findings (Li et al., 2021b; Li et al., 2021c; Shen and Liu, 2021; Sun et al., 2021; Wu et al., 2021; Xie et al., 2021; Cui et al., 2021; Thoms et al., 2005; Peacock, 2003; Reckendorfer and Schiemer, 2001), it is necessary to establish evaluation standards for the hydrological connectivity of Mudong Lake. See Table 1 below.
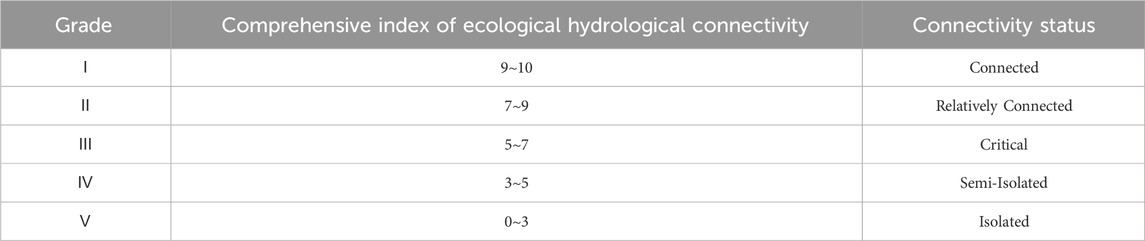
Table 1. Hydrological connectivity evaluation criteria.
Figure 2 shows that with the gradual increase in the water level during the monitoring period from 147.5 m to 149 m, the comprehensive ecological-hydrological connectivity index increased from 2.5 to 9.05. Particularly, within the water level range of 147.5 m–147.8 m, the ecological-hydrological connectivity index increased rapidly. However, after reaching a water level of 147.8 m, the increasing trend of the connectivity index slowed with further increases in the water level. The landscape pattern of the lake area is the result of the combined effects of natural factors and human activities (Liu et al., 2017). Due to unrestrained human development and utilization, Mudong Lake has gradually been encroached upon by farmland and fishponds, and approximately 50% of the lake has been fragmented or broken apart (Cai, 2012). As the water level of Mudong Lake rises, its ecological-hydrological connectivity strengthens, which is beneficial for the restoration of its structure and can also enhance its pollutant removal capacity. Additionally, the increased connectivity of Mudong Lake can provide a favourable ecological environment for aquatic plants, animals, and migratory birds. Therefore, implementing water level management measures to restore the ecological connectivity of the lake is necessary.
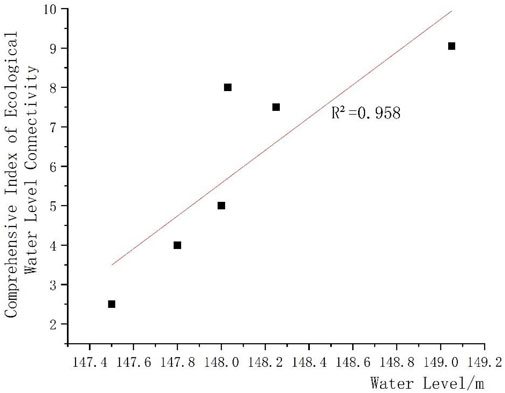
Figure 2. Relationship between water level and the ecological connectivity composite index.
Under varying hydrological conditions, the landscape metrics of the Mudong Lake basin change significantly. The number of patches decreases from the wet period to the dry period, while the areas of lakes, forests, and drylands increase by 204.00%, 193.23%, and 119.29%, respectively. In contrast, the area of ponds decreases by 12.29%. During the wet period, the patch density of paddy fields is 3–115 times higher than that of other land types, whereas other types display their lowest densities during this period. Significant differences are observed in the patch densities of forests and grasslands between the normal and dry periods. The largest patch index indicates that lakes dominate during the wet period. As water levels decline, forests and grasslands progressively emerge as the dominant landscape components, while the indices for rivers and river surfaces drop markedly. The shape index indicates that forests and grasslands have more irregular shapes, whereas water bodies are generally more regular. The landscape shape index is lowest during the wet period, suggesting that rising water levels simplify landscape structure. The perimeter-area fractal dimension suggests that the landscape is simplest during the wet period, with the smallest fractal dimensions, and becomes more intricate during the normal and dry periods. Paddy fields and pond surfaces typically exhibit relatively regular shapes, while grasslands, forests, and river surfaces tend to be more complex. The patch cohesion index is highest for water bodies during the wet period but relatively low for forests, grasslands, drylands, and paddy fields, indicating weaker cohesion among these land types. Combined with measures of landscape connectivity, this finding suggests that rising water levels enhance the connectivity of lakes and river surfaces. The isolation index reveals that water levels have the greatest effect on lake isolation. During the wet period, lakes exhibit the lowest isolation, which increases as water levels drop. Grasslands and forests also become more isolated during the wet period. Changes in the fragmentation index indicate that rising water levels reduce landscape fragmentation. The fragmentation index is lowest during the wet period and highest during the dry period. Rising water levels amplify landscape transformations and increase landscape sensitivity. From the dry to the wet period, as water levels rise, landscape connectivity improves, fragmentation decreases, and the landscape transitions from grasslands and forests to lakes.
Hydrological connectivity influences wetland habitat extent, habitat structure and quality, biodiversity, and aquatic ecosystem processes, making it a topic worthy of further investigation and research (Carrara, et al., 2012; Perkin, et al., 2015; Giosan, et al., 2014; Cui et al., 2016).
3.2 The impact of water level changes on water quality
3.2.1 Temporal and spatial variation characteristics of water quality parameters
In this study, nine monitoring points were selected to analyse the current status of water quality changes in Mudong Lake during different water periods (Figure 1).
The variation in the dissolved oxygen (DO) concentration at each sampling point in Mudong Lake is depicted in Figure 3A. DO is crucial for improving water quality, maintaining the health of aquatic ecosystems, and conserving biodiversity (Li et al., 2023). It is an important indicator for assessing water quality (Zhang, 2023) and serves as a vital parameter for the self-purification of water bodies (Kannel et al., 2007). The annual average DO concentration in Mudong Lake is 6.46 mg/L, with a minimum value of 0.62 mg/L and a maximum value of 13.52 mg/L. The maximum variation is 21.8 times. Overall, most of the DO concentrations met Class III water quality standards, with a few instances falling into the Class V category.
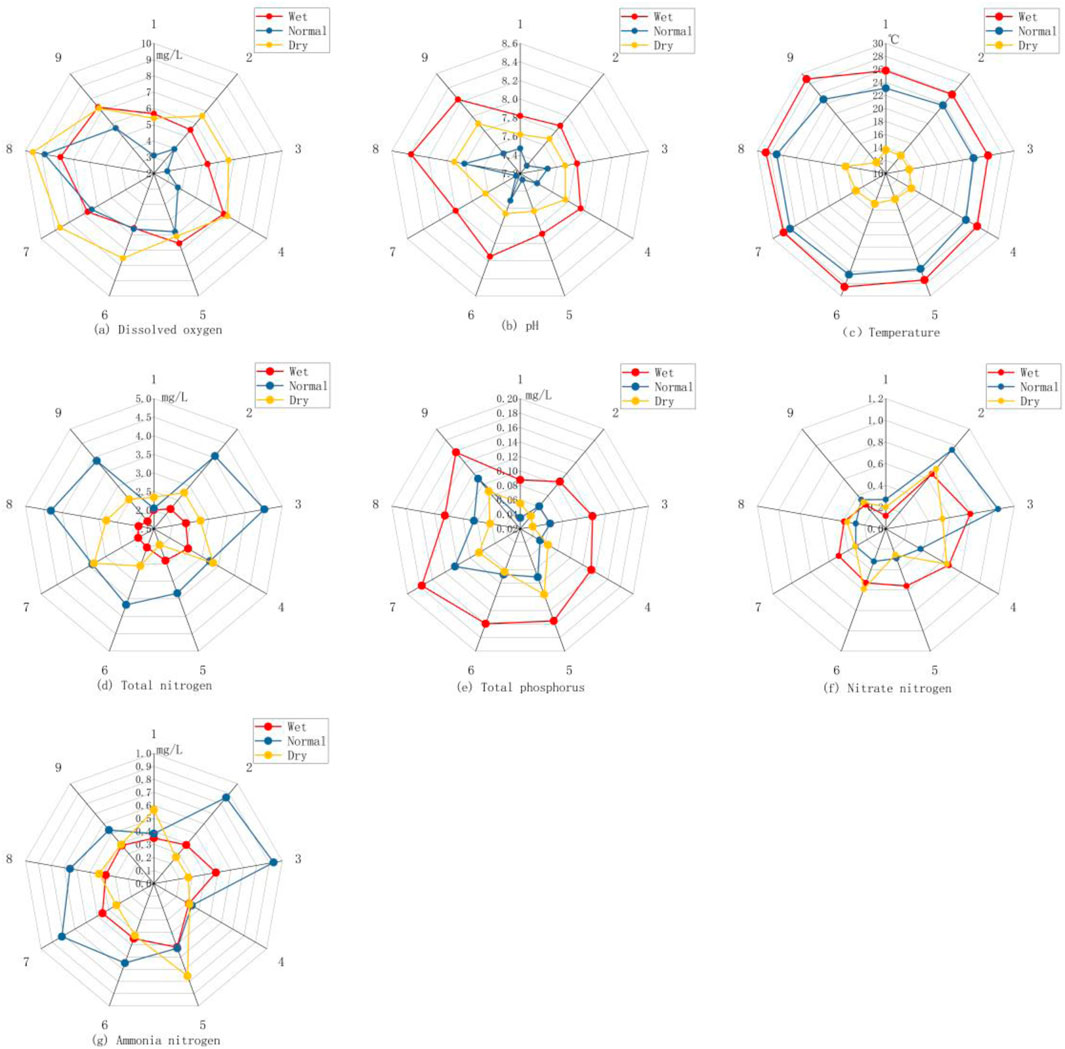
Figure 3. Variations in seven water quality factors at nine sampling points in the Mudong Lake basin. (A) Dissolved oxygen (B) pH (C) temperature (D) total nitrogen (E) total phosphorus (F) nitrate nitrogen (G) ammonia nitrogen.
During the dry period, the DO concentrations are generally greater than those during the normal and wet periods. This may be due to the higher temperatures during the normal and wet periods, which lead to a decrease in the DO content. Additionally, during the dry period, lower water levels and increased water surface agitation from wind and waves facilitate greater air‒water contact, promoting more oxygen dissolution. Moreover, the lower temperatures during the dry period compared to those during the normal and wet periods allow the water to accommodate more DO.
In terms of spatial distribution, the DO concentrations at the internal points within Mudong Lake are greater than those at the edge sampling points. This could be attributed to the presence of more aquatic plants in the lake centre which generate more oxygen through photosynthesis. Additionally, the water level at the internal points is higher than that at the edge points, and the more active mixing and turbulence in the centre of the lakepromote oxygen dissolution. These various factors contribute to significant differences in DO concentrations at different sampling points in the lake.
The variation in pH is illustrated in Figure 3B. The mean pH is 7.73, and the pH ranges from 7.03 to 8.69 across all sampling points; these valuescomply with the water quality standards outlined in the “Environmental Quality Standards for Surface Water” (GB3838-2002) and fall within the range of Class I to Class V water quality, indicating slightly alkaline water quality. Temporally, the pH values exhibit a pattern of wet period > dry period > normal period, while spatially, the pH values do not vary significantly. The minor difference in pH between the internal and edge sampling points could be attributed to the respiration of aquatic plants and microorganisms within the lake, which produce slightly more carbon dioxide at the internal sampling points than at the lake’s edge, resulting in slightly lower pH values.
The variation in temperature is depicted in Figure 3C. The mean temperature of Mudong Lake is 24.47°C and ranges from 10.2°C to 37.1°C. Temperature variations are evident across different water periods, with temperatures generally higher during the wet period, followed by the normal period and the dry period, which aligns with the seasonal patterns in the study area. Two-factor variance analysis of temperature at sampling points during different water periods reveals significant temporal differences (p < 0.01) but nonsignificant spatial differences. The internal sampling points within the lake exhibit slightly lower temperatures than the edge sampling points, likely due to the deeper water within the lake compared to its edges, as shallow water bodies are more directly influenced by sunlight.
The variations in total nitrogen, ammonia nitrogen, and nitrate nitrogen are depicted in Figures 3D–G, respectively. Total nitrogen is a crucial factor influencing the ecologicalconditions of aquatic environments. Elevated total nitrogen concentrations can lead to eutrophication of water bodies, posing risks to aquatic organisms and human health (Ji et al., 2023). During the monitoring period, the total nitrogen concentration in Mudong Lake ranged from 0.43 mg/L to 8.17 mg/L, representing a difference of 19 times. The concentrations of ammonia nitrogen and nitrate nitrogen ranged from 0.05 mg/L to 1.69 mg/L and from 0.01 mg/L to 2.28 mg/L, respectively. According to the Class III water quality evaluation standards outlined in the “Environmental Quality Standards for Surface Water” (GB3838-2002), 73.4% of the water samples exceeded the total nitrogen limit, while 9.4% exceeded the ammonia nitrogen limit and 77.34% exceeded the total phosphorus limit, indicating significant total nitrogen pollution in Mudong Lake. Temporally, total nitrogen concentrations during the normal period were greater than those during the dry and wet periods, while individual sampling points exhibited abnormal ammonia nitrogen and nitrate nitrogen levels during the normal period. This anomaly may be attributed to dredging activities initiated in Mudong Lake in September 2021, which led to the release of a significant amount of pollutants as a result of sediment disturbance. Spatially, nitrate nitrogen concentrations at the lake’s edge were generally lower than those in the lake’s interior. Nitrate ions serve as essential nitrogen sources for plants (Tong et al., 2004), and the lush vegetation along the lake’s edge, predominantly wild weeds without fertilization, naturally reduces nitrate nitrogen content in the water.
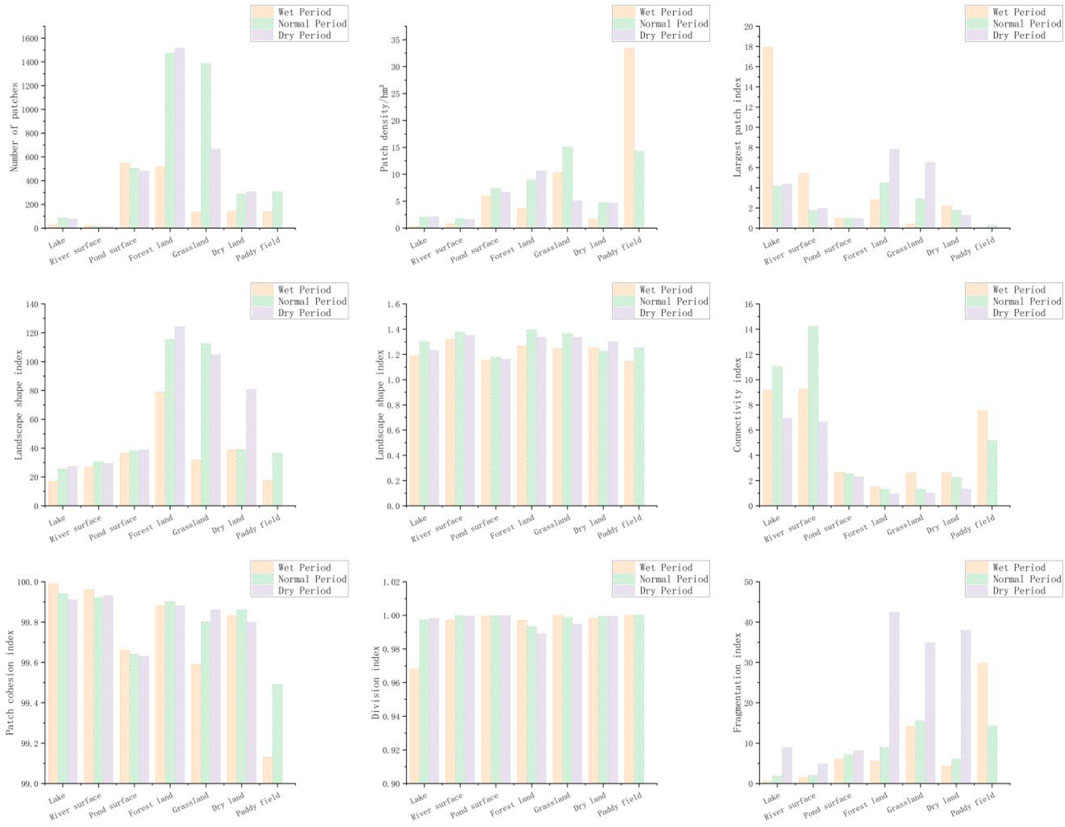
Figure 4. Changes in landscape metrics across different hydrological periods in the Mudong Lake basin.
3.2.2 Water quality–water level response relationship
To assess variations in water quality in Mudong Lake, four indicators were selected: ammonia nitrogen, total nitrogen, total phosphorus, and chemical oxygen demand.
The comprehensive pollution index method was utilized to comprehensively assess the water quality of Mudong Lake. The evaluation standards are based on Class III water quality objectives for Hui Xian wetland protection and restoration, with specific limit values outlined in “Surface Water Environmental Quality Standards” (GB3838-2002). Maintaining water quality at the Class III standard is a primary goal of wetland conservation and restoration efforts (Wu, 2014).
Figure 5 clearly shows that during the normal water period, the comprehensive pollution index is relatively high, with the proportion of heavy pollution being the highest. This is attributed to the dredging activities carried out in Mudong Lake during the monitoring period, which led to the release of pollutants from the sediment, resulting in an increase in the comprehensive pollution index.
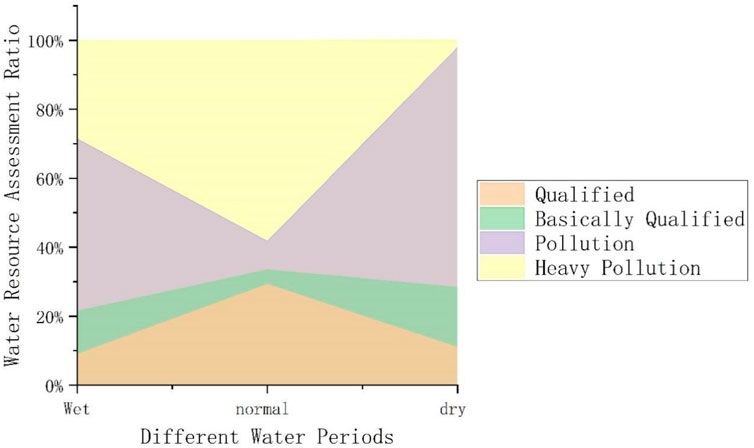
Figure 5. Proportions of water quality classes in Mudong Lake in different water periods.
During the wet and dry periods, the water quality mainly falls into the pollution and heavy pollution categories. The primary reasons for the shift towards heavy pollution include the runoff of fertilizers from agricultural irrigation and the exchange of water between the lake and fishponds during rainwater flushing.
During the dry period, heavy pollution accounts for the smallest proportion of the comprehensive pollution index. This is because agricultural and livestock activities are relatively minimal during this period, and the hydrological cycle is weak. Consequently, there is less input of pollutants into the lake from rainfall runoff, resulting in a lower proportion of heavy pollution.
Overall, water quality during the wet period is sometimes worse than that during the normal and dry periods. This may be attributed to the fact that although water levels are higher during the wet period, increasing the environmental capacity, the enhanced input of water also introduces a large amount of pollutants. The rapid increase in pollutants within a short period exceeds the self-purification capacity of the lake. Additionally, since the sampling frequency in this study is monthly, the data may not accurately capture the specific self-purification processes of the lake. These factors contribute to the poor water quality during the wet period in the study area.
As shown in Figure 6. During the wet period, the water level exhibits a clear negative correlation with the comprehensive pollution index. As the water level rises, the water environment’s capacity increases, leading to a general decline in the comprehensive pollution index and an overall improvement in water quality.

Figure 6. Illustrates the response relationships between the average water quality indicators and comprehensive pollution index of Mudong Lake during different water periods (wet, normal, and dry) and the water level.
During the normal and dry periods, when the water level is between 147.60 m and 148.00 m, there is a significant decrease in the comprehensive pollution index with increasing water level. However, as the water level continues to increase beyond this range, there is a slight deterioration in water quality.
The relationship between water level changes and the comprehensive pollution index is not linear during the normal and dry periods; instead, it shows a parabolic trend. This indicates that as the water level rises, factors such as rainfall and river convergence increase the water volume, leading to a temporary increase in pollutants, thus causing an initial increase in the comprehensive pollution index. After a certain period of response, the lake’s self-purification capacity starts to increase, resulting in an overall improvement in water quality. However, as the water quality stabilizes and the pollutant content increases with increasing water volume, the water quality deteriorates.
The correlation coefficients between water level and water surface area during the wet, normal, and dry periods are 0.90, 0.87, and 0.60, respectively, with the wet period exhibiting a significantly higher correlation than the normal and dry periods. The impact of water level on the pollution index is less significant during the normal and dry periods compared to the wet period. The lake’s self-purification capacity is more pronounced during the wet period.
4 Discussion and conclusion
Based on field investigations, sampling, and laboratory-based experimental data of Mudong Lake and its surrounding areas from January 2021 to December 2022, as well as remote sensing and UAV image data, the dynamic characteristics of Mudong Lake’s water level, landscape pattern, water volume, and water quality were analysed. This study quantitatively analysed the impact of water level on landscape patterns, water volume, and water quality in the study area. The main conclusions are as follows:
(1) Based on the relationship between the water level and lake connectivity, the water level required to maintain the standard connectivity of Mudong Lake is 149.05 m. Based on the classification results of the UAV remote sensing images, the water area is largest during the wet period, reaching 206.51 ha. From the dry period to the wet period, as the water level increases from 147.5 m to 149 m, the ecological-hydrological connectivity index shows a significant increasing trend, from 2.5 to 9.05, an increase of 262%. This trend indicates that water level changes have a significant impact on the ecological-hydrological connectivity, and at the same time, the connectivity of the water landscape is significantly improved, while the fragmentation degree of the landscape is significantly reduced. This quantitative result provides a scientific basis for the management of Mudong Lake water bodies, emphasizing the importance of water level management for lake ecosystems.
(2) Based on measurements of Mudong Lake’s main water quality monitoring indicators and the analysis of water level changes, according to water quality evaluation, Mudong Lake needs to meet Class III water quality standards. The overall water quality during the wet period and dry period is better than that during the normal water period. The water level required to maintain the standard water quality (meeting Class III water quality standards) during the wet period is 149.15 m, and that during the dry period is 148.00 m.
(3) To achieve Class III water quality standards, the water volume required for Mudong Lake during the observation period is 100.38 × 10^4 cubic metres during the wet period and 99.5 × 10^4 cubic metres during the dry period.
(4) To maintain necessary water level management, several solutions can be considered: stablishing real-time water level and ecological monitoring systems to provide up-to-date data for informed decision-making; Sustainable Land Use Practices, Encouraging land use practices that reduce water consumption and prevent excessive land degradation, which can further affect water levels and wetland health; Support the implementation of ecosystem restoration projects, among other initiatives. Collaborate with wetland management authorities to set up a long-term water quality monitoring program and raise awareness among farmers around Mudong Lake and its surrounding areas about effective water quality protection measures, such as the proper use of fertilizers. Provide references for water resource management strategies for similar ecosystems around the world.
(5) The use of monthly sampling in this study presents a limitation, as it is insufficient to capture short-term hydrological fluctuations. Future research could consider increasing the monitoring frequency during critical periods of rapid hydrological change, such as rainfall-runoff events, to capture more precise and detailed hydrological and water quality data. The limitations of the water quality indicators selected in this study may not provide a comprehensive assessment of water pollution. A broader range of indicators will be necessary for a more comprehensive evaluation in future research.
Data availability statement
The datasets presented in this article are not readily available because The data are part of an ongoing study. Requests to access the datasets should be directed to Yemiao Lin, bGlueWVtaWFvX3R5QDE2My5jb20=.
Author contributions
YL: Conceptualization, Data curation, Formal Analysis, Investigation, Methodology, Software, Validation, Visualization, Writing–original draft, Writing–review and editing. JD: Funding acquisition, Methodology, Project administration, Resources, Supervision, Writing–review and editing. XP: Conceptualization, Data curation, Investigation, Writing–review and editing. ZL: Investigation, Writing–review and editing. ZW: Investigation, Writing–review and editing.
Funding
The author(s) declare that financial support was received for the research, authorship, and/or publication of this article. This research was funded by the National Natural Science Foundation of China (No. 52269010), the Science and Technology Planning Project of Guangxi, China (No. AB 23026045) and the Science and Technology Plan Project of Guilin (No. 20220114-2).
Conflict of interest
The authors declare that the research was conducted in the absence of any commercial or financial relationships that could be construed as a potential conflict of interest.
Generative AI statement
The author(s) declare that no Generative AI was used in the creation of this manuscript.
Publisher’s note
All claims expressed in this article are solely those of the authors and do not necessarily represent those of their affiliated organizations, or those of the publisher, the editors and the reviewers. Any product that may be evaluated in this article, or claim that may be made by its manufacturer, is not guaranteed or endorsed by the publisher.
References
Bai, J. H., Ouyang, H., Cui, B. S., Wang, Q. G., and Chen, H. (2008). Changes in landscape pattern of alpine wetlands on the Zoige Plateau in the past four decades. Acta Ecol. Sin. 28 (5), 2245–2252. doi:10.1016/S1872-2032(08)60046-3
Bridgewater, P., and Kim, R. E. (2021). 50 Years on, w(h)ither the Ramsar convention? A case of institutional drift. Biodivers. Conservation 30 (13), 3919–3937. doi:10.1007/s10531-021-02281-w
Cai, D. (2012). “Research on huixian karst wetland ecosystem,” in Research on huixian karst wetland ecosystem. China.
Carrara, F. A., Rodriguez-Iturbe, I., and Rinaldo, A. (2012). Dendritic connectivity controls biodiversity patterns in experimental metacommunities. Proc. Natl. Acad. Sci. U. S. A. 109 (15), 5761–5766. doi:10.1073/pnas.1119651109
Cui, B. S., Cai, Y. Z., Xie, T., Ning, Z. H., and Hua, Y. Y. (2016). Ecological effects of wetland hydrological connectivity: challenges and prospects. J. Beijing Normal Univ. Nat. Sci. 52 (06), 738–746. doi:10.16360/j.cnki.jbnuns.2016.06.011
Cui, G., Yan, L., and Tong, S. (2021). Analysis of the causes of wetland landscape patterns and hydrological connectivity changes in momoge national nature reserve based on the Google Earth engine platform. Arabian J. Geosciences 14 (3), 170. doi:10.1007/s12517-021-06568-8
De Jager, N. R., Thomsen, M., and Yin, Y. (2012). Threshold effects of flood duration on the vegetation and soils of the upper Mississippi river floodplain, USA. For Ecol Manag 270, 135–146. doi:10.1016/j.foreco.2012.01.023
Giosan, L., Syvitski, J., Constantinescu, S., and Day, J. (2014). Climate change: protect the world's deltas. Nature 516, 31–33. doi:10.1038/516031a
Gownaris, N. J., Rountos, K. J., Kaufman, L., Kolding, J., Lwiza, K. M. M., and Pikitch, E. K. (2018). Water level fluctuations and the ecosystem functioning of lakes. J. Gt. Lakes. Res. 44 (6), 1154–1163. doi:10.1016/j.jglr.2018.08.005
Huang, X. Y., Gao, M. Y., Wang, J. D., Wang, M. M., Chen, S. E., Gong, Z. J., et al. (2023). Long-term success patterns of water quality in a flood pulse system lake:A case study of lake Luoma,Jiangsu province. Environ. scinence 44 (01), 219–230. doi:10.13227/j.hjkx.202203097
Ji, X. Y., Wang, S. S., Yang, K., and Ren, P. (2023). Analysis of spatiotemporal variation characteristics of total nitrogen concentration in surface water in China from 2016 to 2020. J. Ecol. Environ. 31, 1184–1192. doi:10.16258/j.cnki.1674-5906.2022.06.014
Kannel, P. R., Lee, S., Lee, Y. S., Kanel, S. R., and Khan, S. P. (2007). Application of water quality indices and dissolved oxygen as indicators for river water classification and urban impact assessment. Environ. Monit. Assess. 132, 93–110. doi:10.1007/s10661-006-9505-1
Kraemer, B. M., Seimon, A., Adrian, R., and McIntyre, P. B. (2020). Worldwide lake level trends and responses to background climate variation. Hydrology Earth Syst. Sci. 24 (5), 2593–2608. doi:10.5194/hess-24-2593-2020
Li, B., Yang, Z., Cai, Y., and Li, Bo (2021c). The frontier evolution and emerging trends of hydrological connectivity in river systems: a scientometric review. Front. Earth Sci. 15, 81–93. doi:10.1007/s11707-020-0852-y
Li, W. P., Zhang, Y. J., Tan, W., Yang, Q., and Huo, S. L. (2023). Status of dissolved oxygen in surface water in China and related standard research. Environ. Prot. 51 (15), 46–51. doi:10.14026/j.cnki.0253-9705.2023.15.011
Li, X. X., Yang, W., Sun, T., Cui, B. S., and Shao, D. D. (2021a). Relationship between complexity and diversity in a aquatic food webs. Acta Ecol. Sin. 41 (10), 3856–3564.
Li, Y. L., Tan, Z. Q., Zhang, Q., Liu, X. G., Chen, J., and Yao, J. (2021b). Refining the concept of hydrological connectivity for large floodplain systems: framework and implications for eco-environmental assessments. Water Res. 195 (59), 117005. doi:10.1016/j.watres.2021.117005
Liu, J. P., Du, B. J., Sheng, L. X., and Tian, X. Z. (2017). Dynamic patterns of change in marshes in the Sanjiang Plain and their influential factors. Adv. Water Sci. 28 (1), 10.
Liu, J. P., Zhao, D. D., Tian, X. Z., Zhao, L., and Liu, J. F. (2014). Landscape pattern dynamics and driving forces analysis in the Sanjiang Plain from 1954 to 2010. Acta Ecol. Sin. 34 (12), 3234–3244. doi:10.5846/stxb201306101639
Mao, D., Zhou, Y., and Zhou, Y. (2023). Analysis of spatiotemporal variation and driving factors of water quality in the xiangjiang river basin from 1990 to 2016. Environ. Sci. 1-18.
Milly, P. C., Wetherald, R. T., Dunne, K. A., and Delworth, T. L. (2002). Increasing risk of great floods in a changing climate. Nature 415, 514–517. doi:10.1038/415514a
Palmer, M. A., Reidy Liermann, C. A., Nilsson, C., Flörke, M., Alcamo, J., Lake, P. S., et al. (2008). Climate change and the world's river basins: anticipating management options. Front. Ecol. Environ. 6, 81–89. doi:10.1890/060148
Peng, X. Y., Zhang, H. Y., Dai, J. F., Xu, J. X., Bai, K. H., Xu, B. L., et al. (2023). Analysis of variation of surface in core area of huixian karst wetland based on multi-source data. Water Resour. Power . Sci 41 (04), 52–55+26. doi:10.20040/j.cnki.1000-7709.2023.20220841
Perkin, J. S., Gido, K. B., Cooper, A. R., Turner, T. F., Osborne, M. J., Johnson, E. R., et al. (2015). Fragmentation and dewatering transform Great Plains stream fish communities. Ecol. Monogr. 85, 73–92. doi:10.1890/14-0121.1
Reckendorfer, W., and Schiemer, F. (2001). “Eco-hydrological indicators for assessing the ecological effects of floodplainrestoration [R]. Dept,” in Of limnology, institute of ecology and conservation biology. University of Vienna.
Shen, M. H., and Liu, X. Q. (2021). Assessing the effects of lateral hydrological connectivity alteration on freshwater ecosystems: a meta-analysis. Ecol. Indic. 125, 107572. doi:10.1016/j.ecolind.2021.107572
Sun, C., Chen, L., Zhu, H., Xie, H., Qi, S. S., and Shen, Z. Y. (2021). New framework for natural-artificial transport paths and hydrological connectivity analysis in an agriculture-intensive catchment. Water Res. 196, 117015. doi:10.1016/j.watres.2021.117015
Thoms, M. C., Southwell, M., and McGinness, H. M. (2005). Floodplain-river ecosystems: fragmentation and water resources development. Geomorphology 71 (71), 126–138. doi:10.1016/j.geomorph.2004.10.011
Tong, Y., Chao, C., Liu, Q., Li, J. Y., and Li, Z. H. (2004). Progress in molecular biology of plant nitrate nitrogen uptake. J. Plant Nutr. Fertil. 10, 433–440. doi:10.11674/zwyf.2004.0418
Van der Valk, A., Volin, J., and Wetzel, P. (2015). Predicted changes in interannual water-level fluctuations due to climate change and its implications for the vegetation of the Florida Everglades. Environ. Manag. 55, 799–806. doi:10.1007/s00267-014-0434-4
Wayne, A., Wurtsbaugh, , Null, S. E., DeRose, R. J., Wilcock, P., Hahnenberger, M., et al. (2017). Decline of the world's saline lakes. Nat. Geosci. 10 (11), 816–821. doi:10.1038/ngeo3052
Woolway, R. I., Kraemer, B. M., Lenters, J. D., Merchant, C. J., O’Reilly, C. M., and Sharma, S. (2020). Global lake responses to climate change. Nat. Rev. Earth and Environ. 1 (8), 388–403. doi:10.1038/s43017-020-0067-5
Wu, H., Chen, J., Zeng, G., Xu, J., Sang, L., Liu, Q., et al. (2019). Effects of early dry season on habitat suitability for migratory birds in China’s two largest freshwater lake wetlands after the impoundment of three Gorges dam. J. Environ. Inf. 36, 82. doi:10.3808/jei.201900411
Wu, X. B. (2014). Conservation and restoration of karst wetland resources in huixian of Guilin. Wetland science and mangement, Guilin. Wetl. Sci. Manag. 10, 20–22.
Wu, Y., Zhang, Y. H., Dai, L. Y., Xie, L. M., Zhao, S. Q., Liu, Y., et al. (2021). Hydrological connectivity improves soil nutrients and root architecture at the soil profile scale in a wetland ecosystem. Sci. Total Environ. 762, 143162. doi:10.1016/j.scitotenv.2020.143162
Xie, T., Wang, Q., Ning, Z., Chen, C., Cui, B., Bai, J., et al. (2021). Artificial modification on lateral hydrological connectivity promotes range expansion of invasive Spartina alterniflora in salt marshes of the Yellow River delta, China. Sci. Total Environ. 769, 144476. doi:10.1016/j.scitotenv.2020.144476
Yin, Y. Z., Xia, R., Liu, X. Y., Chen, Y., Song, J. X., and Dou, J. H. (2024). Spatial response of water level and quality shows more significant heterogeneity during dry seasons in large river-connected lakes. Sci. Rep. 14, 8373. doi:10.1038/s41598-024-59129-w
Zhang, Y. (2023). Analysis of influencing factors of dissolved oxygen in offshore watersheds. Compr. Util. China's Resour. 41, 111–113.
Zhao, Y. L., Wen, X. P., and Wang, Y. X. (2024). Eesearch on the ecological environment changes in dianchi lake wetlands based on landscape patterns. J. Geol. Hazards Environ. Preserv. 35 (04), 118–126. doi:10.3969/j.issn.1006-4362.2024.04.017
Keywords: lake-type wetland, water level changes, water body connectivity, water quality, comprehensive water quality pollution index
Citation: Lin Y, Dai J, Peng X, Li Z and Wan Z (2025) Effects of water level changes on the hydrological connectivity and water quality of a lake-type wetland. Front. Environ. Sci. 13:1531893. doi: 10.3389/fenvs.2025.1531893
Received: 21 November 2024; Accepted: 17 January 2025;
Published: 04 February 2025.
Edited by:
Miao Zhang, Shaanxi Normal University, ChinaReviewed by:
Indira Khurana, Tarun Bharat Sangh, IndiaMonika Verma, University of Naples Parthenope, Italy
Chi Zhang, Wuhan University, China
Copyright © 2025 Lin, Dai, Peng, Li and Wan. This is an open-access article distributed under the terms of the Creative Commons Attribution License (CC BY). The use, distribution or reproduction in other forums is permitted, provided the original author(s) and the copyright owner(s) are credited and that the original publication in this journal is cited, in accordance with accepted academic practice. No use, distribution or reproduction is permitted which does not comply with these terms.
*Correspondence: Junfeng Dai, d2h1ZGpmQDE2My5jb20=