 Boyao Song
 Xiao Han1
 Yueying Li
 Xueyong Ren
- 1School of Economics and Management, Beijing Forestry University, Beijing, China
- 2College of Forestry, Beijing Forestry University, Beijing, China
- 3Institute of Agricultural Science and Technology Information, Shanghai Academy of Agricultural Sciences, Shanghai, China
- 4National Forestry and Grassland Engineering Technology Center for Wood Resources Recycling, School of Materials Science and Technology, Beijing Forestry University, Beijing, China
Introduction: Green waste is the second largest organic solid waste beyond of household waste in Chinese cities. Clarifying green waste generation is significant for efficient management and utilization.
Methods: Unlike previous studies that mainly concentrated on quantifying green waste at a single time point and within a particular region, this research is grounded in the urban greening data of 30 provinces in China spanning from 2003 to 2022. It systematically computes and analyzes the overall green waste generation scenario and its spatio - temporal distribution traits in China. Moreover, it innovatively employs the adjusted IPAT - LMDI (Environmental Impact = Population × Affluence × Technology - Logarithmic Mean Divisia Index) model to probe into the key driving factors influencing green waste production.
Results and Discussions: Research has found that: 1) From 2003 to 2022, the total amount of landscaping waste resources in China showed an overall upward trend, with a total of 10.7134 million tons in 2003 and an increase of nearly 5 times to 60.9705 million tons in 2022; 2) The overall density of resource generation shows a fluctuating upward trend, with a characteristic of high in the east and low in the west, gradually evolving into high in the southeast and low in the northwest; 3) The factors of population size, economic development, and environmental pressure all have a positive driving effect on the total increase of green waste resources, but urban development shows a negative effect of decreasing the number of green waste resources; 4) Anticipated against the backdrop of global warming, urban sprawl, and improving urban green space management standards, China’s green waste production is projected to persistently rise, with forecasting an increase to between 83.35 million and 91.48 million tons in total by 2030. Although this study has achieved some progress in quantifying and analyzing the spatial - temporal characteristics and driving forces of China’s green waste, there is still room for further improvement in terms of research accuracy and scope in future studies.
1 Introduction
In recent decades, the progression of urbanization and the enlargement of green areas have significantly escalated the generation of green waste worldwide (UN-habitat, 2022). In 2023, approximately 2.3 billion tons of solid waste were generated globally, with green waste accounting for 11% (Kaza et al., 2018; UNEP, 2024). China, as one of the world’s most populous nation, has undergone a period of intensive urban landscaping and green space expansion over the past 2 decades concurrent with economic progress and escalating resident demands. This dynamic has resulted in a sustained augmentation of green cover, which, in turn, has led to a marked rise in green waste output (Xin et al., 2023). Presently, green waste ranks as the second-largest contributor to organic solid waste within Chinese cities, generating between 40 and 70 million tons annually, thereby accentuating the pressing concerns surrounding its treatment and disposal (Song et al., 2023). The persistent escalation in the volume of green waste is imposing a discernible strain on urban ecosystems, rendering it an integral component of urban development that cannot be neglected. Therefore, there exists an exigent necessity for the implementation of scientifically rigorous disposal and utilization strategies for this burgeoning challenge (Shi et al., 2013a).
Distinct from other categories of urban solid waste, green waste exhibits a diverse array of origins and is generally considered cleaner (Raja and Purushothaman, 2023; Reyes Torres et al., 2018). Its composition encompasses a broad spectrum of plant residuals generated through natural senescence, human intervention such as pruning, or harsh weather conditions impacting landscaping vegetation, including discarded twigs, fallen foliage, grass clippings, decomposing flowers, and tree/shrub pruning remnants (NAWDO, 1998; Inghels et al., 2019; Liu et al., 2020a). Relative to other types of solid waste like municipal and industrial refuse, green waste boasts ample organic content, high energy density, and unique characteristics of being high in carbon but low in nitrogen, qualifying it as a relatively clean energy source endowed with considerable ecological, economic, and energy utilization potential (Ahmed et al., 2018). Presently, the avenues for utilizing green waste resources are continually broadening, leading to the emergence of various utilization methods, such as composting for fertilizer, physical mulching, material recycling, and energy conversion (Suryawan et al., 2022; Wang Y. M. et al., 2022; Mahari et al., 2020; Pan et al., 2024). However, there is still a certain gap between the efficiency of green waste disposal and the level of resource utilization in developed countries. In fact, the generation of green waste is influenced by multiple factors, including natural and socio-economic factors (Shu et al., 2021). However, natural factors are exogenous and difficult to change through changes in management strategies and behaviors. Therefore, Therefore, clarifying green waste generation and exploring their socio-economic driving factors holds immense significance for optimizing the green waste management system. (Xin et al., 2023).
In previous studies, the quantitative methods for assessing green waste primarily encompass direct measurement (Lelicińska-Serafin et al., 2024; Ma et al., 2017) and indirect estimation (Shu et al., 2021; Yu et al., 2009). Direct measurement techniques, such as Springer’s (2012) calculation of green waste generated from 445 square meters of green space annually, and Eades et al. s (2020) house-to-house interview survey conducted in Hampshire, UK—which compared variations in green waste generation between urban and rural areas—yield accurate and real-time data for specific locales. However, due to high costs, extended research cycles, and geographical constraints, these methods are challenging to implement on a large scale. Conversely, the indirect estimation method relies on secondary data sources. For instance, Liu et al. (2020b) estimated national garden waste generation in 2018 based on national greening statistics. Schmidt and Pahl-Wostl (2007) comprehensively utilized literature reviews and statistical data while considering factors such as population density and types of green spaces to calculate per capita green waste production in Germany. Nonetheless, this approach is contingent upon the accuracy and completeness of the underlying data; discrepancies in statistical standards across different regions can lead to significant errors. Moreover, with advancements in machine learning technologies, recent studies have employed mathematical models (Adeogba et al., 2019) and remote sensing techniques (Fu et al., 2020) to quantify green waste yield. While these methodologies facilitate rapid acquisition of large-scale information, challenges remain regarding the classification accuracy of green spaces within complex urban environments; accurately distinguishing between various sources of green waste continues to be problematic.
In terms of research methodologies concerning influencing factors, several scholars have employed techniques such as PEST analysis, Analytic Hierarchy Process (AHP), and grey correlation analysis to investigate the degree of correlation between green waste production and its influencing factors (Mi et al., 2011; Li et al., 2015). While these methods can effectively analyze the relationships among various factors and identify key influencers in scenarios with limited data and incomplete information, they fall short in quantitatively decomposing the influence exerted by each factor. Additionally, other researchers have utilized regression analysis to establish a correlational model linking vegetation coverage with green waste generation (Timilsina et al., 2014). However, this approach has specific requirements regarding data distribution and linearity. It struggles to account for interactions among multiple factors and faces limitations when addressing complex variables that affect green waste production. Furthermore, some studies have applied artificial neural network models with time delays to examine the relationship between green waste production and temperature (Vu et al., 2019). This method is capable of identifying nonlinear relationships between variables; however, it demands a substantial amount of data. Moreover, it poses challenges in elucidating internal change mechanisms, thereby limiting its decision-support value in policy-making contexts.
Based on this, this study adopts the IPAT-LMDI(Impact = Population * Affluence * Technology - Logarithmic Mean Divisia Index)model, which can decompose the environmental impact (green waste generation) into the influence of multiple factors such as population, wealth level, and technology, thus clearly quantifying the contribution of each factor to green waste generation, and better handling the interaction of multiple factors. Meanwhile, the model is relatively concise in mathematical principles, easy to understand and apply, and has been widely validated and applied in the field of environmental science, with high reliability and comparability. For example, Zaman and Moemen (2017) used this model to confirm the relationship between economic growth, energy consumption, and carbon dioxide emissions in countries at different stages of development. Ren et al. (2023) used its extended version to evaluate the impact of various technological interventions on China’s wastewater emissions. Although some emerging machine learning models, such as random forests and neural networks, have advantages in handling complex nonlinear relationships, they often require a large amount of data for training. In the current situation of insufficient green waste production data, it is difficult to intuitively reveal the intrinsic relationship between various factors and the amount of green waste generated. Therefore, considering the research objectives, data availability, and interpretability of the model, this study selects the IPAT-LMDI model to quantitatively analyze the driving factors of changes in green waste generation.
Currently, one of the crucial tasks in advancing the treatment and resource utilization of green waste in China is to gain a comprehensive understanding of the current state of urban green waste, ascertain its total volume, distribution, and developmental trends. Nevertheless, there is currently no official data available on the total quantity of garden waste resources. Despite several studies exploring the quantification and analysis of green waste, challenges persist, including limited research scope, inconsistent methodologies, and inadequate attention to dynamic shifts. Regarding research scope, there is a notable absence of comprehensive and comparative regional studies at the national level. Most research efforts are centered on individual cities or regions (Liu et al., 2020c; Peng et al., 2018; Li, 2018). In terms of methodology, current studies typically employ surveys, estimations, or a combination of both (Cai, 2019; Chun et al., 2009). The lack of consensus on statistical methods and standards impedes comparability across different regions. From a research standpoint, existing studies primarily concentrate on single-point analysis (Liu X. et al., 2020), with limited focus on the dynamic changes in the quantity of green waste resources. Moreover, most existing research remains at the stage of estimating green waste production and qualitatively analyzing its influencing factors, with few studies quantitatively assessing the impact of different factors. Therefore, there is an urgent need to systematically and objectively elucidate the dynamic changes and spatiotemporal characteristics of green waste resources, conduct an in-depth analysis of the driving factors behind these changes, and establish a foundation for scientific disposal and resource utilization.
Based on this, this paper quantified the green waste generation in China (excluding Tibet, Hong Kong, Macau, and Taiwan) from 2003 to 2022 and established an analytical framework encompassing national, regional, and provincial levels. This framework explores the dynamic spatiotemporal patterns of green waste output across China at different spatial scales. Building on this foundation, we improved the IPAT model and applied the enhanced IPAT-LMDI model to quantitatively decompose the socioeconomic drivers of changes in green waste resources. The methodology aims to identify the key factors influencing the generation of green waste and provides references for enhancing the scientific disposal and utilization of green waste, thereby fostering cleaner and more sustainable urban environments.
The remaining parts of this study are as follows. The second part elaborates on the research methods and data sources in detail. The third part presents the calculation results of green waste production, analyzes the spatiotemporal characteristics and driving factors, and discusses them. The fourth part summarizes the research results and proposes targeted suggestions.
2 Methods and data
2.1 Calculation of green waste
Due to the serious lack of statistics on the amount of green waste generation in China, existing statistics mostly focus on individual cities or regions, with significant differences in statistical methods and caliber. Based on literature review and field interviews, this article defines green waste as the dead branches, fallen leaves, grass debris, and trimmings generated during the growth and management of trees, shrubs, and lawns used for urban greening and beautification within the built-up area. Using the yield factor method, the calculation formula for the annual generation of green waste (in 10,000 tons) is set as Equation 1:
Among them, GA (km2) is the green space area of urban built-up areas;
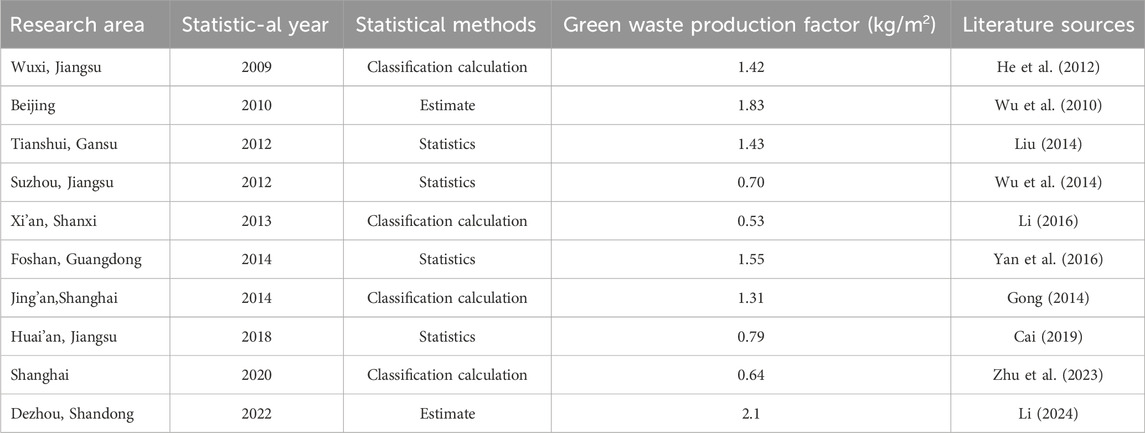
Table 1. Green waste production factors in public literature.
In the formula,
2.2 IPAT model construction and inference
Green waste, as an organic solid waste generated during urban landscaping construction, if not scientifically disposed of, will bring certain pressure to the ecological environment. To illustrate the impact of socio-economic factors on the ecological environment, (Ehrlich and Holdrens, 1971), indicating that environmental pressure (I) is determined by population size (P), affluence (A), and technological level (T). As shown in Equation 3:
To further explore the driving factors of green waste generation, we considered the amount of green waste resources as environmental pressure I in the IPAT model, with richness A expressed in per capita gross domestic product (G/P) and technological level expressed in green waste generation intensity (GW/G), which is the amount of green waste resources per unit of economic output. As shown in Equation 4:
Among them, the intensity of green waste generation can be further decomposed into the product of green waste production factor, urban green space rate, and unit output built-up area, As shown in Equation 5:
Therefore, the IPAT model can evolve into:
In the formula, P represents population, G represents regional gross domestic product, GW represents annual green waste resources, GA represents urban green space area, and BA represents urban built-up area.
2.3 Decomposition of driving factors
Based on field research and previous research, and based on the construction and evolution of the IPAT model mentioned earlier, Utilizing the Logarithmic Mean Divisia Index (LMDI) method to decompose the driving factors of green waste generation enables efficient elimination of residual terms and a thorough breakdown of the overall impact. Accordingly, the driving factors for the variation in green waste generation can be decomposed into four factors
In Equation 7, the driving factors affecting the generation of green waste resources are decomposed into population size factor P, denoted by the regional population count; economic development factor A, enoted by the per capita economic output value (G/P); environmental pressure factor S, expressed as the product of the green waste generation factor and the urban green space ratio, which is the amount of green waste generated per unit area (GW/BA); and urban development factor U, reflected by the reciprocal of the output per unit area of built-up areas (BA/G). The specific meanings of indicators are shown in Table 2.
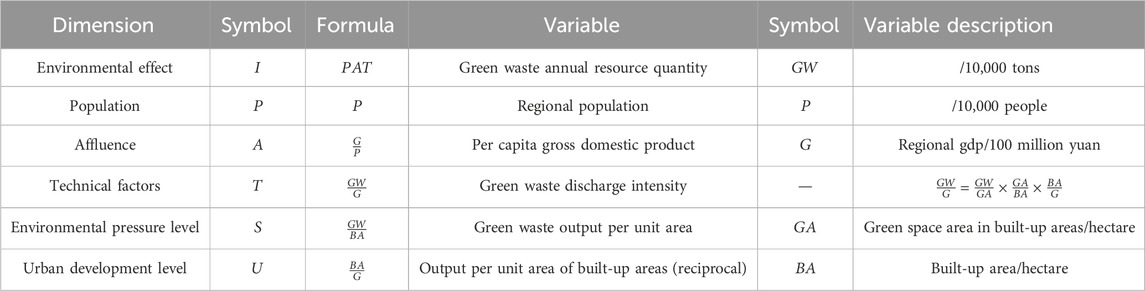
Table 2. Variable description table.
Based on Equation 6 above, the change in green waste production in year t relative to the base period is:
In Equation 8,
Using LMDI to decompose the changes in per capita green waste production, the decomposition results of each factor are shown in Equation 9:
Among them The value of W is shown in Equation 10:
2.4 Data sources and visualization
This study focuses on 30 provinces, autonomous regions, and municipalities in mainland China from 2003 to 2022. Due to the complex geographical environment, Tibet was excluded from the study due to difficulties and gaps in data statistics in some years, which made it challenging to ensure the integrity and accuracy of the data. Additionally, Hong Kong, Macao Special Administrative Region, and Taiwan were also excluded due to differences in statistical systems and data collection standards compared to mainland China. To ensure the consistency and comparability of the research data, they were not included in this study. This research meticulously investigates the spatial-temporal patterns and underlying driving factors associated with the green waste resources within these regions. Data pertaining to population size, GDP, and green space area utilized in the study were obtained from authoritative sources such as the China Statistical Yearbook (covering the years 2003–2022) and the Urban Construction Statistical Yearbook (also covering the same period). Among them, some missing data were filled in using linear interpolation method.
ArcGIS, a geographic information system (GIS) software crafted by the American firm Environmental Systems Research Institute (ESRI), holds a prominent position as one of the most extensively used tools in the global GIS sector. Our research employed this powerful software to map and visualize the generation and spatial distribution of green waste, capitalizing on a series of official urban boundary datasets disseminated by China’s Ministry of Natural Resources for the years 2003, 2008, 2012, 2017, and 2022. This analytical endeavor illuminated temporal shifts and regional disparities in green waste production across China.
Advancing our investigation, we also adopted prospective urban expansion boundary data for the period of 2022–2030, as proposed by Huang et al. (2022a), which encompass diverse socioeconomic scenarios and alternative models of urban sprawl. This adoption allowed for a nuanced discussion on the prospective trends in green waste generation in China, considering the compounding effects of urban growth patterns under various development frameworks.
3 Results
Considering the vastness of China’s territory, which encompasses a multitude of terrains, climates, cultures, economies, and political structures, this study delves deeper into the temporal and spatial distribution patterns of green waste resources across the nation (excluding Tibet, Hong Kong, Macao, and Taiwan). Leveraging a scientific and multidimensional approach that incorporates factors such as geography, history, and ethnicity, the country is divided into six distinct regions: North China (Beijing, Tianjin, Hebei Province, Shanxi Province, Inner Mongolia), Northeast (Liaoning, Jilin, Heilongjiang), East China (Shanghai, Jiangsu, Zhejiang, Anhui, Fujian, Jiangxi, Shandong), Central South (Henan, Hubei, Hunan, Guangdong, Guangxi, Hainan), Southwest (Chongqing, Sichuan, Guizhou, Yunnan), and Northwest (Shaanxi, Gansu, Qinghai, Ningxia, Xinjiang). To investigate the changes in green waste generation over time, the years 2003–2022 are segmented into four phases, each consisting of 5-year intervals.
3.1 Total amount and distribution of green waste
3.1.1 Total amount of green waste
Employing the production factor approach, an estimated 60.97 million tons of green waste were generated across the nation in the year 2022. At the same time, considering the differences in climate and vegetation conditions in different regions, the yield factors in the northwest, northeast, and north China regions were reduced by 30%, 20%, and 10% respectively, while the yield factors in the southwest, central southern, and east China regions were increased by 30%, 20%, and 10% respectively. Sensitivity coefficients were calculated, and the range and sensitivity coefficients of green waste production obtained are shown in Table 3.
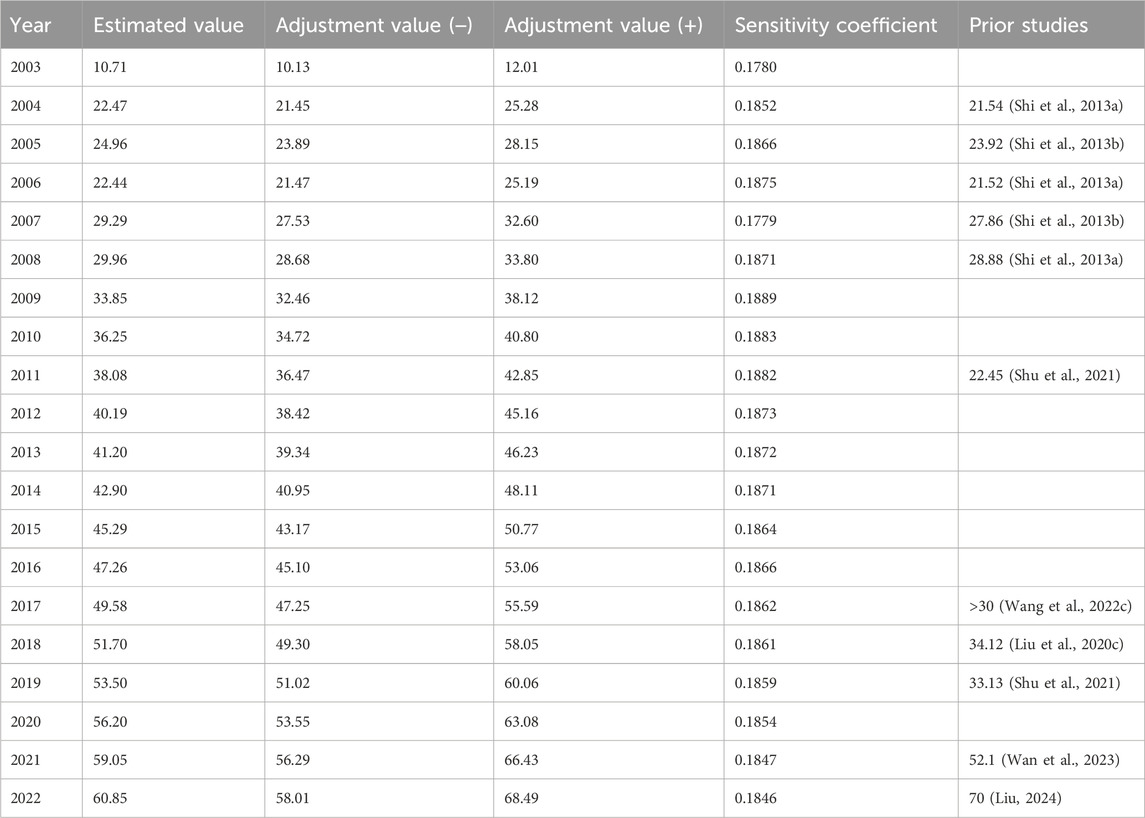
Table 3. Comparison of green waste generation in public literature with our study.
The calculated sensitivity coefficient of the yield factor is approximately 0.18. This indicates that for every 1% change in the yield factor based on 1.7 kg/㎡, the generation amount of green waste will change by approximately 0.18%. The green waste generation is not very sensitive to minor changes in the yield factor, which means that the shift in the yield coefficient within a certain range will not have a significant impact on the generation amount of green waste.
To further validate the effectiveness of the research results, in Table 3, this study systematically compared the estimation results based on the yield factor method with the actual values of green waste production reported in previous studies. Given that most of the previous related research focused on single-time points and lacked long-term and coherent data monitoring, resulting in the absence of data for some years, this study conducted a precise comparative analysis only for the years with complete data.
The comparison results show that the prior studies values of green waste production are basically consistent with the estimated values and the adjusted value ranges of this study (Shi et al., 2013a; Wan et al., 2023; Liu, 2014). This result strongly validates the rationality of the selection of the yield factor and the accuracy of the calculation results in this study, providing reference data support and method verification for the quantitative research on green waste generation.
3.1.2 Distribution of green waste
Figure 1 illustrates the provincial heterogeneity of green waste generation across China in 2022. The chromatic scale reflects total annual green waste yield, with darker hues corresponding to higher production intensities. The geographical dispersion of green waste generation within China demonstrates a prevailing trend of higher volumes in the southeastern regions and relatively lower quantities in the northwestern territories. Notably, East China and Central South China collectively account for the most substantial amount of total resources, topping the national distribution chart. Following closely behind are the northeastern, northern, and southwestern regions of the country. In contrast, the northwest region registers the least overall volume of green waste production.
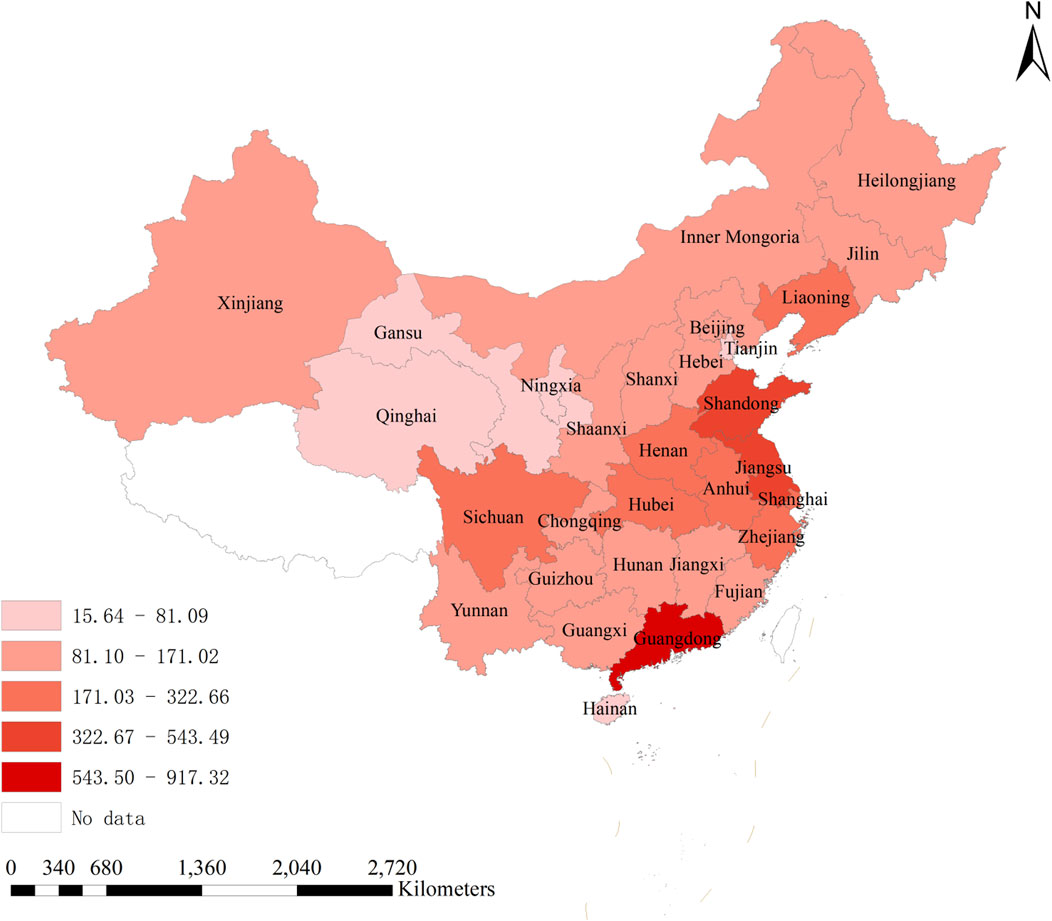
Figure 1. Spatial distribution of green waste generation across Chinese provinces in 2022 (Unit: 10,000 tons).
3.2 Dynamic evolution of spatiotemporal pattern of green waste generation
3.2.1 National green waste generation
Over the past 20 years, China has witnessed a steady overall increase in the cumulative volume of green waste resources. In the year 2003, the nationwide production of green waste stood at 10.71 million tons, which escalated to a staggering 60.97 million tons by 2022, representing an almost quintuple increase. The changes in the amount of green waste generated and growth rate are shown in Figure 2.
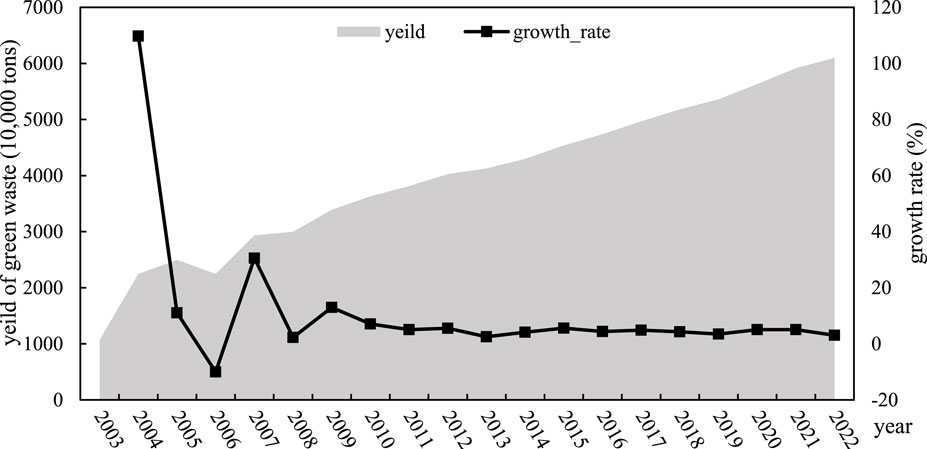
Figure 2. Time series changes in total resource quantity and growth rate.
The growth rate of total green waste resources initially exhibited a pattern of fluctuation followed by stabilization. Post-2010, the growth rate steadied. The pronounced fluctuations during this initial phase might be attributed to the revisions made by the Ministry of Construction to the “Urban Construction Statistical Reporting System” in 2006. These revisions included adjustments to the urban boundaries and statistical standards, which likely impacted the comparability and interpretability of the data during those years. Currently, the annual growth rate of total green waste resources in China maintains a stable trajectory, hovering between 3% and 5%.
3.2.2 Regional green waste generation
(1) Dynamic changes in regional green waste generation
From the absolute value of annual green waste production, the green waste production in different regions has shown an increasing trend over time (Figure 3A). In the early phase (2003–2007), East China topped the list with the highest average annual green waste resources, followed by Central South, Northeast, North China, Southwest, and Northwest respectively. However, during the middle period (2008–2012), there was a notable surge in the green waste production in East and North China, overtaking Central South and Northeast regions. The new hierarchy, based on average annual resource levels, shifted to Central South > East China > North China > Northeast > Southwest > Northwest. Moving into the next phase (2013–2017), the growth rate of green waste resources in Northeast China slowed down, with its average annual resource quantity marginally exceeding that of the Southwest region. Finally, in the latest segment (2018–2022), the Southwest region saw a significant increase in green waste production, eventually surpassing the Northeast region, securing the position as the third-highest producer of green waste resources in the country.
(2) Dynamic changes in the growth of regional green waste generation
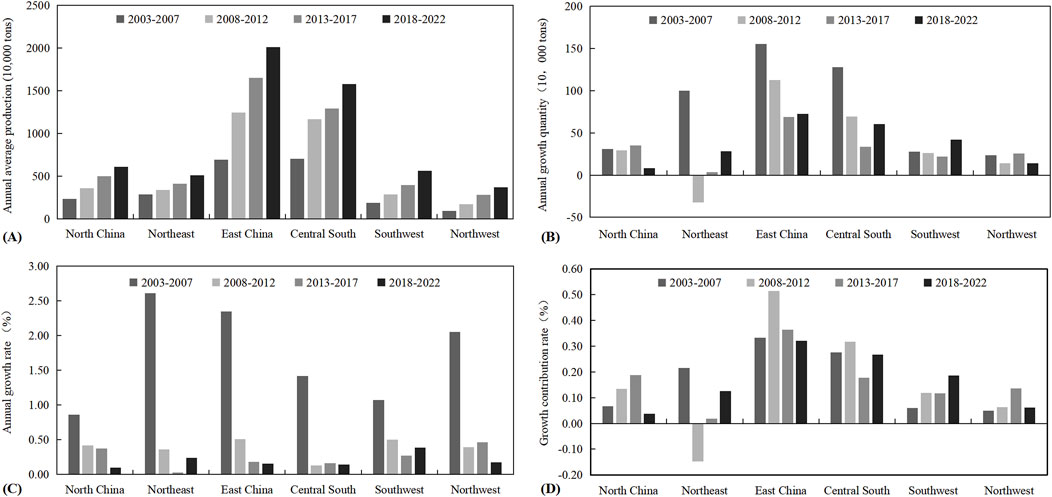
Figure 3. Changes in the amount of green waste resources in the region (A) Dynamic changes in regional green waste generation; (B) Dynamic changes in the growth of regional green waste generation; (C) Dynamic changes in the growth rate of regional green waste generation; (D) Dynamic changes in the contribution rate of regional green waste generation growth to national growth.
In terms of the annual growth of green waste resources across China, the general pattern reflects a fluctuating yet declining tendency (Figure 3B). While most regions have been witnessing an increase in the number of green waste resources every year, the Northeast region uniquely registered a negative annual growth rate between 2008 and 2012, signifying a decrease in its green waste production. During the period from 2003 to 2007, the East China, Central South, and Northeast regions demonstrated relatively high average annual growth rates, with increases surpassing 1 million tons. Conversely, North China, Southwest, and Northwest China experienced more modest increments, adding roughly 200,000 to 300,000 tons annually. Between 2008 and 2012, the average annual growth rates in all regions declined to differing extents. The Northeast region saw the sharpest drop, entering negative growth territory. From 2013 to 2017, the average annual growth rate in North China, Northeast China, and Northwest China rose compared to the preceding period, whereas there was a minor dip in the growth rates for East China, Central South China, and Southwest China. Lastly, in the final period from 2018 to 2022, the Northeast, Central South, and Southwest regions experienced an upturn in their average annual growth rates compared to the previous period. However, North China, East China, and Northwest regions noted a decrease in their respective average annual growth rates.
(3) Dynamic changes in the growth rate of regional green waste generation
Overall, while the annual growth rate of green waste resources across China has generally decreased over time, there are variations in the changing trends among different regions (Figure 3C). Specifically, the annual growth rates in North China and Northeast China have consistently decreased over the years, aligning with the overarching national trend of diminishing annual growth in green waste resources. In contrast, the Northeast and Southwest regions display a pattern of decline followed by an upturn. Their average annual growth rates dropped from 2003 to 2017, but then slightly recovered from 2018 to 2022. Meanwhile, the Central, Southern, and Northwestern regions exhibit a fluctuating downward trend. Their growth rates dipped from 2003 to 2012, and then showed a temporary rise followed by another decline between 2013 and 2017.
(4) Dynamic changes in the contribution rate of regional green waste generation growth to national growth
The analysis reveals that nearly 60% of the overall growth in green waste resources in China can be attributed to the expansion in the East China and Central South regions (Figure 3D). However, in recent years, East China’s contribution rate to this growth has been on a declining path, while the Central South region’s contribution has stayed relatively constant but with some fluctuations. The Southwest region is emerging as a significant contributor, with its share in the growth of national green waste resources increasing and showing a rising trend. By 2018 to 2022, the Southwest region’s contribution rate reached 19%. In contrast, the contribution rates of growth for North China and Northwest China were on the rise prior to 2018, but they experienced a substantial decline afterward. From 2018 to 2022, North China’s contribution rate fell to 4%, while Northwest China’s contribution dropped to 6%. The Northeast region displays a highly variable contribution rate. Between 2003 and 2007, it accounted for 22% of the total national green waste resource growth. Nevertheless, from 2008 to 2012, the decline in green waste resources in the Northeast negatively impacted the overall national figure. Starting from 2013, however, the Northeast region’s contribution rate began to steadily recover, reaching 13% by 2018–2022.
3.2.3 Provincial green waste generation
When examining the situation province by province, from 2018 to 2022, the six provinces with the highest average annual green waste resources were Guangdong, Jiangsu, Shandong, Zhejiang, Shanghai, and Liaoning—all situated along the coastlines (Table 4-Rank A). Notably, Guangdong Province recorded an average of 8.1917 million tons of green waste annually between 2018 and 2022, while Jiangsu Province generated an average of 5.2095 million tons per year, placing them firmly at the forefront of the nation. The elevated green waste production in these coastal provinces could be attributed to their high levels of economic development. As a result, residents have a higher demand for quality living environments, leading to increased investment by local governments in urban landscaping construction and upkeep. This emphasis on landscaping has led to a larger scale of green space development and consequently, a higher volume of green waste being produced. Moreover, inland provinces such as Sichuan, Henan, Anhui, Hubei, and Hebei also reported relatively high amounts of green waste resources over the past 2 decades.
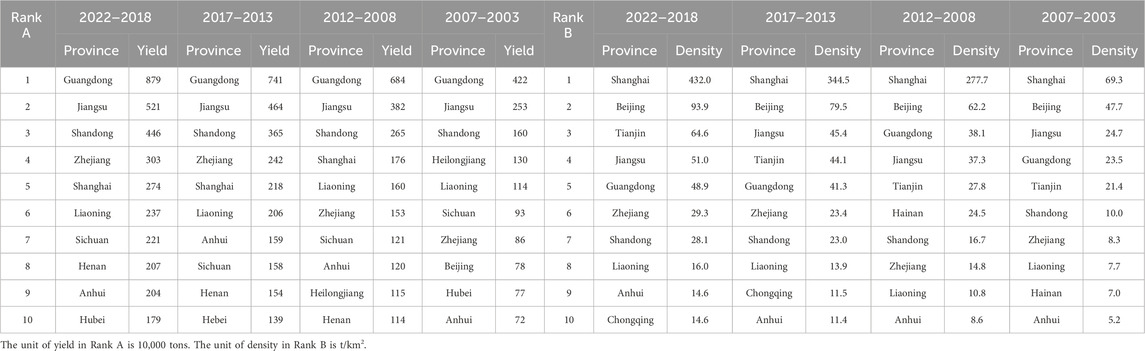
Table 4. Top 10 provinces with annual green waste generation and density.
3.3 Spatiotemporal patterns of green waste generation density
3.3.1 National green waste density
The density of green waste resources, defined as the ratio of green waste generated to the total built-up area, has displayed a predominantly fluctuating yet ascending trend over time. Between 2003 and 2010, this growth rate was particularly brisk. Initially, in 2003, the green waste generation density in China’s built-up areas stood at 378.46 tons per square kilometer, which soared to 905.89 tons per square kilometer by 2010—a significant leap. From 2010 to 2013, there was a noticeable decline in the volatility of this growth rate, after which it resumed a steady climb. By 2022, the density of green waste generated within China’s built-up areas hit 935.91 tons per square kilometer, reflecting an average annual growth rate of approximately 1%–2% over the years. The temporal variation of green waste generation density is shown in Figure 4.
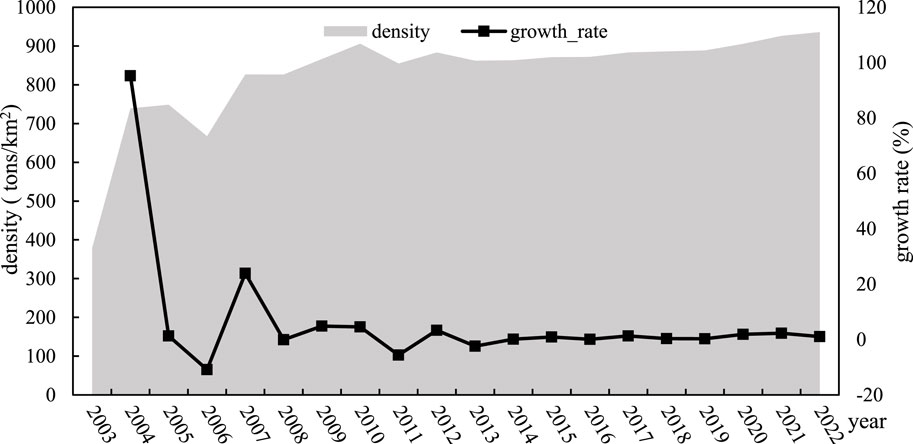
Figure 4. Time series variation of green waste generation density and growth rate.
3.3.2 Regional and provincial green waste density
Figures 5A–E illustrate annual green waste generation density (tons/km2/year) across provinces for 2003, 2007, 2012, 2017, and 2022. Color intensity scales with production density (see legend), where dark green indicates high-intensity zones and light green represents low-density regions. The spatial distribution of green waste resource generation density follows a clear pattern where it is significantly higher in the eastern part of China and lower in the western regions. Over time, the resource density in the southern areas has escalated rapidly, creating a geographic distinction where the southeast holds a higher density, while the northwest remains relatively low.
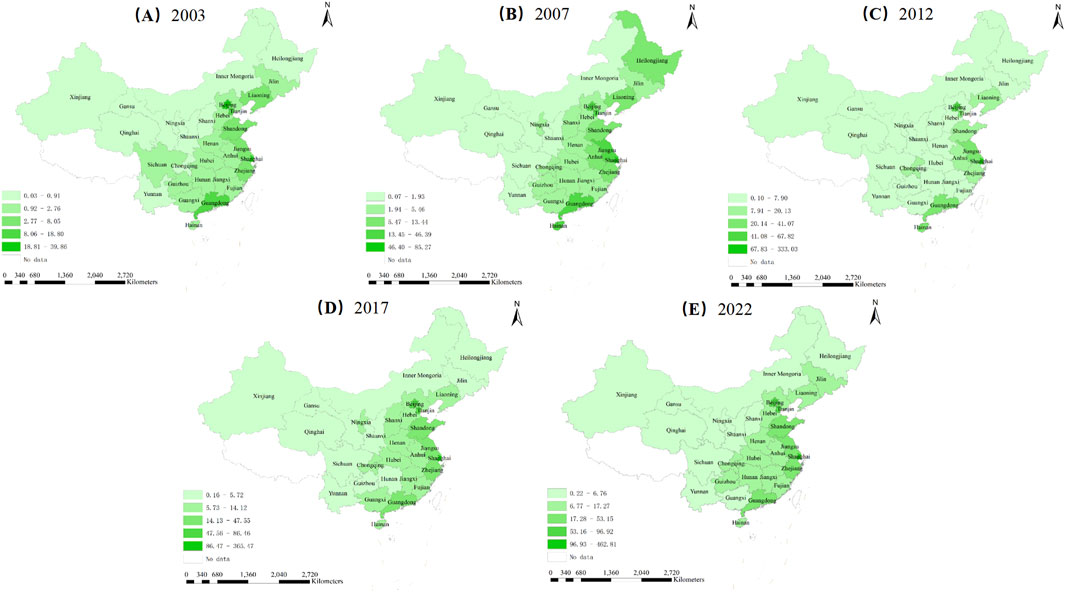
Figure 5. Spatial distribution of green waste resource density (Unit: t/km2). (A) 2003, (B) 2007, (C) 2012, (D) 2017, (E) 2022.
3.3.3 Provincial green waste density
Provinces with the highest green waste resource generation per unit area are primarily concentrated in eastern coastal regions, including Beijing and Tianjin in North China, Heilongjiang and Liaoning in Northeast China, Shanghai, Jiangsu, Shandong, Zhejiang, and Anhui in East China, Hainan in Central South China, and Chongqing in Southwest China (Table 4-Rank B). This uneven distribution can be attributed to the rapid economic development of the eastern coastal provinces. These areas initiated urban landscaping projects earlier and have maintained a high standard of management and conservation. Consequently, they have a larger volume of green waste resources per unit area and a faster growth rate over time.
3.4 Analysis of driving factors for changes in green waste production
The LMDI model was employed to decompose the driving factors of green waste production, with the results presented in Table A1 (in the Appendix). As illustrated in Figure 6, from 2003 to 2022, population size, economic development, and environmental pressure exhibited relatively stable positive impacts on green waste generation. Among these factors, economic development emerged as the most significant driver, contributing 143.05% to the increase in green waste generation. The contribution rates of environmental pressure and population size were 39.75% and 10.16%, respectively. Conversely, urban development exerted a consistently negative influence, contributing 92.97% to the reduction of green waste generation. Specifically, the economic development effect contributed the most to the total effect of the change of green waste resources, which was the most important driving factor, indicating that the increase of per capita GDP had a strong explanatory ability for the increase of green waste resources, and showed an accelerating trend over time. The environmental pressure effect positively drove the increase of green waste production, but the contribution rate fluctuated greatly in different years. The driving effect of population size on the increase of green waste production was small and relatively stable, and the driving effect showed an inverted U-shape over time. On the whole, the effect of urban development is negative, that is, the decrease of the measured value of urban development level and the increase of actual urbanization level have a negative driving effect on green waste resources, and the driving effect is first enhanced and then weakened.
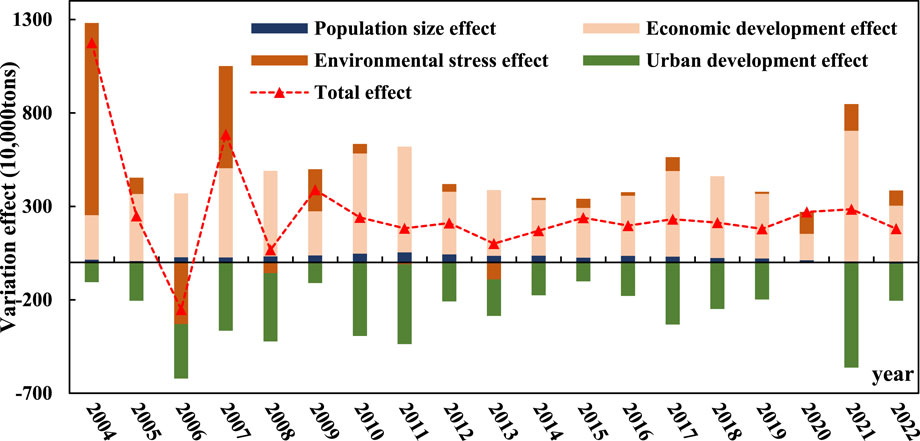
Figure 6. Decomposition of driving factors for changes in green waste resources.
4 Discussions and policy recommendations
4.1 Discussions
4.1.1 Spatiotemporal heterogeneity of green waste generation
The analysis reveals a persistent upward trajectory in China’s green waste generation from 2003 to 2022, aligning with the temporal patterns identified by Shi et al. (2013b). This trend likely reflects synergistic effects of rapid urbanization and population growth, which have elevated environmental quality standards nationwide. Consequently, municipal authorities have substantially increased investments in urban greening infrastructure, resulting in both spatial expansion of green areas and enhanced maintenance practices that collectively contribute to amplified green waste outputs.
Our quantification methodology yields higher estimates than those reported by Shu et al. (2021) and Liu et al. (2019), primarily due to expanded parameter definitions encompassing herbaceous residues (grass clippings, leaf litter, etc.). This comprehensive approach positions our 49.58 million tonne estimate for 2017 within the broader spectrum of Wang et al. (2022b) 30-million-tonne threshold projection. While Shi et al. (2013b) documented dry-weight biomass equivalents for 2004–2008 through field-calibrated literature synthesis, our moisture-adjusted calculations demonstrate temporal consistency with their baseline data, though offering superior temporal resolution and contemporary relevance.
Spatiotemporal analysis identifies distinct geographic disparities, mirroring regional economic gradients. Southeastern provinces exhibit disproportionately high waste generation (58.7% national total), attributable to their advanced urbanization, substantial green space investments, and favorable subtropical climates that accelerate plant metabolism. This spatial pattern corroborates regional studies (Shu et al., 2021), yet our longitudinal analysis reveals previously unquantified dynamics in growth trajectories.
Notably, the southwestern region emerged as an accelerated growth pole post-2015, its national contribution rising from 8.2% to 13.6% within the study period. This surge correlates with western development initiatives (Go West Policy) and parallel increases in municipal greening budgets (+214% 2015–2020). Conversely, northeastern provinces displayed cyclical fluctuations–rapid early growth (2003–2007: +12.8% p. a.) followed by recessionary declines (2008–2012: 3.1% p. a.) and subsequent recovery (2013–2022: +5.4% p. a.). These oscillations mirror regional economic restructuring phases, where industrial slowdowns precipitated reduced green space maintenance, later counterbalanced by ecological restoration mandates under the Northeast Revitalization Strategy.
4.1.2 Discussion on influencing factors of green waste generation
The IPAT-LMDI model was employed to decompose the driving factors behind changes in green waste generation. The findings indicated that economic development, environmental pressure, and population size exerted positive influences on green waste generation, whereas urban development acted as a restraining factor, inhibiting the increase in green waste generation. These results align with the study by Shu et al. (2021), but this research further elucidates the temporal variations in the degree of influence exerted by different factors.
The scale of the population has a positive driving effect on the resource utilization of green waste, which is consistent with the findings of Han et al. (2018) in developing countries. However, this study further reveals that over time, the impact of population size on green waste resource utilization exhibits an inverted U-shaped trend, with a turning point identified in 2011. This phenomenon can be attributed to the relatively rapid population growth prior to 2011, where the annual growth rate was approximately 6‰. To meet the production and living needs of urban residents, built-up areas gradually expanded and green space increased, resulting in greater amounts of green waste generated. After 2011, influenced by changes in fertility concepts and awareness, national population growth rates slowed down to an average annual rate of 4‰; nevertheless, residents’ demand for urban green spaces continued to rise alongside increasing urban greenery area. Consequently, despite slow population growth during this period still exerting a positive influence on green waste resources. However, as urban space became increasingly saturated and population numbers declined by 2022, changes in population size began to exert a negative driving effect on variations in green waste resources.
Economic development serves as the most significant driving force behind increases in green waste generation (Wang Z. et al., 2022). As GDP per capita rises, residents’ expectations regarding environmental quality also increase—prompting governments to enhance investments in urban landscaping—which subsequently leads to higher volumes of generated green waste. For instance, between 2008 and 2012 China actively responded to economic crises by promoting technological innovation and ecological construction; during this period there were notable improvements in urban greening infrastructure and management levels leading economic development’s impact on green waste output to reach its peak value. Nonetheless, current challenges facing resource utilization from organic wastes include poor product sales performance and high costs among others. Future research should focus on optimizing industrial chains related to organic waste recycling while improving resource efficiency through cost reduction strategies aimed at enhancing market competitiveness for products derived from such processes.
The relationship between environmental pressure and quantities of generated organic wastes is complex. Previous studies have indicated that increased vegetation cover can suppress overall refuse generation (Wang et al., 2020a), whereas most research concerning organic wastes suggests a significant positive correlation between their volume produced relative expansion within vegetative areas (Shu et al., 2021). During periods characterized by rapid city expansion (2003–2013), contributions made towards generating organic refuse fluctuated considerably due largely because when built-up zones expand faster than new greenspace developments do then temporary reductions occur; conversely increases arise under opposite conditions instead. From years spanning across both intervals ranging from year fourteen until twenty-two however,with limited available spatial capacity now existing,urban greening efforts shifted focus onto upgrading pre-existing landscapes thus creating sustained positive influences stemming forth via heightened pressures upon environment impacting total outputs seen here. This indicates how shifts occurring within developmental models along with respective greening strategies significantly affect relationships observed amongst these variables moving forward into future investigations exploring dynamic interactions present amidst differing forms taken up throughout various cities providing more targeted recommendations applicable towards planning initiatives surrounding both aspects mentioned earlier.
Urban development levels negatively influence quantities associated with produced organics (Yu et al., 2024; Wang et al.,2020b), meaning improved efficiencies achieved through advancements made will ultimately lead lessened outputs being recorded overall. As land-use effectiveness improves across metropolitan regions available spaces become increasingly allocated toward commercial/residential purposes thereby indirectly constraining expansions witnessed previously around public parks reducing resultant figures accordingly too. Simultaneously though emphasis placed upon maintaining balance found amid ecological/economic pursuits encourages innovations emerging within greener industries fostering betterment seen throughout landscape management practices influencing outcomes experienced here once again yet another layer needing exploration remains evident going forward whereby effective controls could potentially emerge allowing rationalized utilizations taking place concurrently alongside enhanced operational efficacies realized thereafter.
In addition beyond four factors analyzed herein other studies indicate natural elements including temperature fluctuations types exhibited among local flora precipitation patterns extreme weather events policy guidance resident awareness pertaining eco-friendly practices all contribute likewise affecting totals reported concerning organics produced (Lu et al.,2022; Shi et al.,2021). Therefore when formulating policies directed towards managing said materials sustainably implementing interventions necessitates comprehensive considerations encompassing multiple interacting influences ensuring scientific efficient governance achieved effectively overall.
4.1.3 Scenarios for variations in green waste generation factor
The Intergovernmental Panel on Climate Change (IPCC, 2023)’s Sixth Assessment Report (AR6), “Climate Change 2023,” highlights a 1.1°C increase in global mean temperature compared to pre-industrial levels, emphasizing the severity of climate change. This is accompanied by a rise in extreme weather events. Research by Lin et al. (2010) shows that global warming has led to an 8.4%–16.3% increase in terrestrial plant biomass, suggesting a corresponding rise in green waste yield per unit area. This indicates that current estimates of green waste production may be conservative. Moreover, with economic development and growing environmental awareness, the management and maintenance of urban green spaces are expected to improve. Optimized urban greening strategies, with intensified maintenance and higher vegetation densities, could lead to increased green waste yields.
Considering the changes in plant biomass, the production of green waste per square meter of green space is likely to rise to 1.84–1.98 kg in the near future. For example, in 2022, the recalculated amount of green waste generated in China was estimated to be between 65.96 million and 70.876 million tons, with the production density in urban built-up areas rising to 1.01–1.09 kg per square meter. These shifts pose new challenges for managing green waste but also provide opportunities for more efficient and sustainable practices, contributing to the circular economy and reducing carbon emissions.
Globally, green waste, as a significant biomass resource, exhibits distinct generation patterns across nations and regions, closely tied to socioeconomic structures, environmental policies, and statistical frameworks. In China, green waste mainly comes from urban public areas and is collected by municipal departments. Based on this, the output per unit of green area becomes a reasonable measurement parameter. However, in other countries, part of the green waste originates from privately - owned areas, making it difficult to accurately calculate the green area. Thus, the per - capita green waste output has become a commonly used calculation parameter. This difference makes it challenging to directly compare green waste data among different countries and also reflects the necessity of unifying the definition and statistical methods of green waste at the global level.
In terms of per - capita green waste output, there are obvious imbalances among different countries and regions. The calculation by Lu et al. (2022) shows that the global green waste generation ranges from 1 to 336 kg/cap/year, with a weighted average of 47 kg/cap/year. Maldives, Puerto Rico, and Denmark rank among the top three in per - capita green waste output, reaching 336, 246, and 240 kg/cap/year respectively. Western Europe and the United States have relatively high per - capita green waste output, while Asia and South America have relatively low per - capita green waste output. For example, the per - capita green waste output in the United States increased from 74 kg/cap/year in 2008 to 97.8 kg/cap/year in 2014 (EPA, 2016; MacFarlane, 2009). The average generation rate of per - capita green waste in the European Union is estimated to be between 61.5–77.0 kg/cap/year, while in India it is only 20 kg/cap/year, which is much lower than that in Europe and the United States.
Green waste generation also has obvious seasonal characteristics. Taking Denmark as an example, the study by Boldrin and Christensen (2010) distinguished the green waste generation coefficients in winter and summer in Denmark. The summer coefficient can reach 19.4 kg/cap/month, much higher than 2.5 kg/cap/month in winter. In addition, there are differences in green waste output between rural and urban households. The study by Eades et al. (2020) found that rural households produce 1.96 ± 1.35 kg per day, while urban households produce 0.64 ± 0.46 kg per day. This is mainly because rural households usually have larger yards and more private green spaces and may engage in certain agricultural production activities, all of which lead to higher green waste generation in rural households than in urban households.
Overall, the global green waste generation situation is complex and diverse, affected by a combination of various factors. In future research and practice, on the one hand, it is necessary to further clarify a unified definition and statistical standard for green waste to enable more accurate international comparison and analysis. On the other hand, it is necessary to fully consider the actual situations of different countries and regions, formulate local - specific green waste management strategies, improve the resource utilization efficiency of green waste, and achieve sustainable development.
4.1.4 Projected trends in green waste generation in the future
While urban territories occupy merely 3% of the Earth’s total land area, they accommodate over half of the global population (Nations, 2018), positioning them as pivotal drivers of numerous environmental and societal transformations (Gao and O’Neill, 2020). Numerous scholars have ventured predictions on the expansion trajectory of urban built-up areas under diverse socioeconomic scenarios and varying modes of spatial growth.
Urban green spaces constitute a vital component of urban ecological environments, playing a pivotal role in beautifying city landscapes, providing leisure spaces for residents, and maintaining ecological balance (Chen et al., 2021). As outlined in the “National Land Greening Plan Outline (2022–2030)” issued by the National Greening Committee of China (2022), China aims to significantly enhance urban greening by 2030, targeting a 43% green coverage rate in urban constructed areas. This goal underscores the nation’s steadfast commitment to fostering green and livable urban environments.
According to in-depth projections by Huang et al. (2022b), in tandem with accelerating urbanization, China’s urban built-up areas are projected to expand to a range of 105,500 to 107,500 square kilometers by 2030 (Huang et al., 2022a). Consequently, urban green space is anticipated to witness a remarkable increase, spanning an area of 45,300 to 46,200 square kilometers. While this expansion symbolizes progress towards sustainable urban development, it also forecasts a substantial rise in green waste generation, estimated to reach between 83.35 million and 91.48 million tons. This anticipated upsurge in green waste not only imposes heightened demands on municipal solid waste management systems but also opens avenues for resource recovery and utilization.
4.2 Policy recommendations
To effectively address the challenges faced by China’s green waste management and achieve scientific treatment and resource utilization of green waste, it is imperative to establish a comprehensive and targeted policy framework. This should involve fully leveraging international best practices while adapting them to domestic conditions through innovative implementation, thereby overcoming obstacles in policy execution.
(1) Differentiated regional governance frameworks will be constructed to enhance local adaptation of international experiences.
Given China’s vast territory and significant regional development disparities, multi-level green waste management strategies must be designed according to regional development gradients. In highly urbanized eastern coastal areas, characterized by developed economies, dense populations, and large volumes of green waste, an urban agglomeration green waste (GW) metabolism network can be established by emulating Germany’s Rhine-Ruhr region cross-city collaborative model. For instance, within the Guangdong-Hong Kong-Macao Greater Bay Area, leveraging the existing carbon trading mechanism, cities with strong processing capabilities like Shenzhen can treat green waste generated in Dongguan and convert it into local carbon allowances for Shenzhen. This approach not only alleviates disposal pressures on individual cities but also optimizes resource allocation via market mechanisms, promoting coordinated regional green waste treatment.
In ecologically fragile western regions, greater emphasis should be placed on ecological protection during green waste treatment. Drawing from Japan’s Kanto Plain urban-rural complementarity mechanism, green waste treatment and ecological restoration can be closely integrated. For example, following Inner Mongolia’s Kubuqi model, enterprises could receive management rights to 1 mu of desertified land for every 10 tons of green waste resources processed, attracting social capital to participate in ecological construction and green waste treatment in the west. To ensure smooth implementation of these regional-specific policies and support corresponding financial incentives, it is recommended that the central government establish a “Western GW Governance Transfer Payment Fund” for equipment procurement, sharing local financial burdens.
(2) Innovative cost control mechanisms across the entire chain are essential to address financing and benefit coordination issues.
High costs remain a key bottleneck in green waste management. By integrating Singapore’s DBO model with California’s SB 1383 act experience, a “risk-sharing - pollution payment” strategy can be implemented. In financially robust regions such as the Yangtze River Delta, adopting the design-construction-operation (DBO) integrated bidding model would require successful bidders to bear 50% of investment and financing risks, thus leveraging corporate expertise while reducing initial government investment. Considering the lagging infrastructure in county areas, promoting simple composting and other low-cost green waste recycling models can effectively meet local treatment needs. Additionally, improving reward and punishment mechanisms, including implementing “waste reduction performance rewards,” can resolve conflicts of interest among stakeholders in green waste management.
(3) A dynamic regulatory system will be enhanced to lay the foundation for efficient use.
Based on the EU Circularity Check and New York’s Local Law 77 mandatory disclosure principle, a multi-level monitoring network will be established. Cities at or above the municipal level will be required to publish a biennial green waste metabolism audit report, with non-compliant areas losing eligibility for ecological compensation funds. Data sharing and collaboration among various regulatory links will be strengthened. A unified green waste management information platform will integrate data on green waste sources, transportation processes, and treatment facility operations, enabling real-time access to accurate information for government departments, enterprises, and the public, ensuring transparent supervision throughout the process. Combining this with green waste production prediction models will forecast trends in different regions and seasons, providing a scientific basis for planning treatment capacity and resource allocation in advance.
5 Conclusion and prospect
5.1 Conclusion
This study employed the yield factor method to quantify and analyze the spatiotemporal characteristics of green waste across 30 provinces in Chinese mainland (excluding Tibe) from 2003 to 2022. Quantify the actual impact of population size, economic development, environmental pressure, and urbanization on the total amount of green waste based on the IPAT-LMDI model framework. The main conclusions are as follows.
(1) From 2003 to 2022, China’s total green waste resources exhibited an overall upward trend, with an initial production total of 10.71 million tons in 2003, escalating to 608.53 million tons by 2022, marking a nearly five-fold increase. Presently, the annual growth rate of total green waste hovers stably between 3% and 5%.
(2) The distribution of green waste resources shows a clear pattern of higher volumes in the southeast and lower in the northwest, with a faster growth rate observed in western regions compared to slower growth in eastern and northern parts. Provincially, from 2018 to 2022, the top six provinces in terms of annual average resource volume—Guangdong, Jiangsu, Shandong, Zhejiang, Shanghai, and Liaoning—were all coastal provinces.
(3) The production density of green waste resources has demonstrated an overall fluctuating yet ascending trend, reaching 935.91 tons per square kilometer in built-up areas nationally by 2022. Spatially, the resource density is characterized by higher values in the east and lower in the west, with southern regions experiencing a more rapid increase over time, leading to a gradient of higher densities in the southeastern regions and lower in the northwest.
(4) The LMDI analysis revealed that, collectively, population size, economic development, and environmental pressures exert positive influences on the increment of green waste resources. Conversely, the urbanization effect (operating negatively) serves to mitigate the increase in green waste quantities to some extent.
(5) Anticipated against the backdrop of global warming, urban sprawl, and improving urban green space management standards, China’s green waste production is projected to persistently rise, with estimates forecasting an increase to between 83.35 million and 91.48 million tons by 2030.
These conclusions underscore the imperative for strategic planning and adaptive management strategies to address the growing challenge of green waste amidst ongoing urbanization and climate change.
5.2 Limitations and future perspectives
While this study advances the quantification of China’s green waste dynamics, several limitations must be acknowledged to guide future research.
(1) The estimation of green waste production in this study is based on municipal statistical reports and relatively stable production factors. However, this approach may overlook the heterogeneity among different cities within the province as well as the green waste generated from private areas. Future research should aim to enhance measurement accuracy by incorporating remote sensing technology to develop a more precise model for estimating green waste output.
(2) The generation of green waste is influenced by a multitude of factors. While this study quantitatively decomposed the social and economic factors impacting green waste production, it did not account for natural factors such as climate, temperature, and vegetation type, which also significantly influence green waste output, nor did it consider human factors like construction frequency. Future research should delve deeper into the complex mechanisms affecting green waste production and develop a more robust predictive model for green waste yield by integrating machine learning methodologies.
Data availability statement
The raw data supporting the conclusions of this article will be made available by the authors, without undue reservation.
Author contributions
BS: Data curation, Software, Visualization, Writing – original draft, Writing – review and editing. XH: Data curation, Methodology, Writing – original draft. YL: Formal Analysis, Software, Writing – original draft. WH: Software, Visualization, Writing – review and editing. XR: Conceptualization, Writing – review and editing. HL: Conceptualization, Writing – review and editing. QF: Methodology, Formal analysis, Validation, Writing - review & editing
Funding
The author(s) declare that financial support was received for the research and/or publication of this article. This work was supported by Central Finance Forestry Science and Technology Promotion Project, Demonstration of Thermal Cracking and Refining of Activated Carbon Technology from Forest and Fruit Waste (Ji TG [2022] 004).
Conflict of interest
The authors declare that the research was conducted in the absence of any commercial or financial relationships that could be construed as a potential conflict of interest.
Generative AI statement
The author(s) declare that no Generative AI was used in the creation of this manuscript.
Publisher’s note
All claims expressed in this article are solely those of the authors and do not necessarily represent those of their affiliated organizations, or those of the publisher, the editors and the reviewers. Any product that may be evaluated in this article, or claim that may be made by its manufacturer, is not guaranteed or endorsed by the publisher.
References
Adeogba, E., Barty, P., O’Dwyer, E., and Guo, M (2019). Waste-to-Resource transformation: gradient boosting modeling for organic fraction municipal solid waste projection. ACS Sustain. Chem. Eng. 7 (12), 10460–10466. doi:10.1021/acssuschemeng.9b00821
Ahmed, Y. O., Ries, J. M., and Northrop, F. W. (2018). Emissions factors from distributed, small-scale biomass gasification power generation: comparison to open burning and large-scale biomass power generation. Atmos. Environ. 200, 200221–200227. doi:10.1016/j.atmosenv.2018.12.024
Boldrin, A., and Christensen, T. H. (2010). Seasonal generation and composition of garden waste in Aarhus (Denmark). Waste Manage. 30 (4), 551–557. doi:10.1016/j.wasman.2009.11.031
Cai, W. (2019). Research on green disposal and innovative utilization of landscape waste: taking the landscape waste treatment project in huai'an city as an example. Sci. Technol. Innovation Prod. (12), 52–54. doi:10.3969/j.issn.1674-9146.2019.12.052
Chen, C., Bi, L., and Zhu, K. (2021). Study on spatial-temporal change of urban green space in Yangtze River economic belt and its driving mechanism. Int. J. Environ. Res. Public Health 18, 12498. doi:10.3390/ijerph182312498
Chun, J., Liu, H., Liang, S., Zeng, J., and Wu, X. (2009). The current situation and disposal strategies of garden and greening waste generation and collection in Shenzhen. Environ. Sanit. Eng. 17 (1), 47–49. doi:10.3969/j.issn.1005-8206.2009.01.015
Eades, P., Kusch-Brandt, S., Heaven, S., and Banks, C. J. (2020). Estimating the generation of garden waste in England and the differences between rural and urban areas. Resources 9, 8. doi:10.3390/resources9010008
Ehrlich, P. R., and Holdrens, J. P. (1971). Impact of Population Growth: complacency concerning this component of man's predicament is unjustified and counterproductive. Science 171, 1212–1217. doi:10.1126/science.171.3977.1212
EPA (Environmental Protection Agency) (2016). Advancing sustainable materials management: 2014 tables and figures. United States: Environmental Protection Agency.
Fu, T., Ke, J., Zhou, S., and Xie, G. H. (2020). Estimation of the quantity and availability of forestry residue for bioenergy production in China. Resour. Conserv. Recycl. 162, 104993. doi:10.1016/j.resconrec.2020.104993
Gao, J., and O’Neill, B. C. (2020). Mapping global urban land for the 21st century with data-driven simulations and Shared Socioeconomic Pathways. Nat. Commun. 11, 2302. doi:10.1038/s41467-020-15788-7
Gong, M. (2014). Site selection planning for landscaping waste collection points: a case study of Jing'an District, Shanghai. China Urban For. 12 (03), 50–52. doi:10.3969/j.issn.1672-4925.2014.03.016
Han, Z., Liu, Y., Zhong, M., Shi, G., Li, Q., Zeng, D., et al. (2018). Influencing factors of domestic waste characteristics in rural areas of developing countries. Waste Manag. 72, 45–54. doi:10.1016/j.wasman.2017.11.039
He, J., Zhou, Z., Mao, F., Wang, X., and Zhao, X. (2012). “Investigation on the current situation of greening waste in wuxi city and exploration of recycling strategies Chinese society of environmental sciences,” in Proceedings of the 2012 academic annual meeting of the Chinese society of environmental sciences (volume 4). Nanning, Guangxi, China: China Agricultural University Press, 6.
Huang, M., Wang, Z., Pan, X., Gong, B., Tu, M., and Liu, Z. (2022a). Dataset of China's urban expansion and urban growth boundaries (2021-2100) V1.0. A Big Earth Data Platf. Three Poles. doi:10.11888/HumanNat.tpdc.272852
Huang, M., Wang, Z., Pan, X., Gong, B., Tu, M., and Liu, Z. (2022b). Delimiting China's urban growth boundaries under localized shared socioeconomic pathways and various urban expansion modes. Earth's Future 10, e2021EF002572. doi:10.1029/2021EF002572
Inghels, D., Dullaert, W., Aghezzaf, E., and Heijungs, R. (2019). Towards optimal trade-offs between material and energy recovery for green waste. Waste Manag. 93, 93100–93111. doi:10.1016/j.wasman.2019.05.023
IPCC (2023). “Climate change 2023: synthesis report,” in Contribution of working groups I, II and III to the Sixth assessment report of the intergovernmental Panel on climate change core writing team. Editors H. Lee, and J. Romero (Geneva, Switzerland: IPCC), 35–115. doi:10.59327/IPCC/AR6-9789291691647
Kaza, S., Yao, L., Bhada-Tata, P., and Woerden, F. V. (2018). What a waste 2.0: a global snapshot of solid waste management to 2050. Washington DC, USA: World Bank.
Lelicińska-Serafin, K., Rolewicz-Kalińska, A., and Manczarski, P. (2024). Challenges in the valorization of green waste in the central European region: case study of warsaw. Energies 17, 5056. doi:10.3390/en17205056
Li, J. (2018). Analysis of the application status of garden waste in taiyuan city. China Hortic. Dig. 34 (2), 107–108.
Li, N. (2024). Exploration of resource utilization approaches for landscape greening waste in dezhou city. Mod. Hortic. 47 (08), 163–165. doi:10.14051/j.cnki.xdyy.2024.08.046
Li, P. (2016). Research on the current situation and reuse strategies of green plant waste treatment in xi'an city. Environ. Sustain. Dev. 41 (01), 145–147. doi:10.19758/j.cnki.issn1673-288x.2016.01.043
Li, Y., Ma, M., and Lu, L. (2015). Prediction of domestic waste quantity in xi'an based on multi-model fitting. Comput. Eng. Appl. 51 (06), 222–226. doi:10.3778/j.issn.1002-8331.1402-0148
Lin, D., Xia, J., and Wan, S. (2010). Climate warming and biomass accumulation of terrestrial plants: a meta-analysis. New Phytol. 188 (1), 187–198. doi:10.1111/j.1469-8137.2010.03347.x
Liu, Q. (2014). Preliminary exploration of scientific disposal and recycling of urban greening waste in tianshui city. Agric. Dev. Equip. (03), 30–31. doi:10.3969/j.issn.1673-9205.2014.03.025
Liu, X., Ren, X., Song, S., Lv, X., Ding, Z., and Duan, S. (2024). Research progress on resource utilization of landscape greening waste under dual-carbon background. Anhui Agric. Sci. 52 (09), 1–4+24. doi:10.3969/j.issn.0517-6611.2024.09.001
Liu, X., Xie, Y., and Sheng, H. (2023c). Green waste characteristics and sustainable recycling options. Resour. Environ. Sustain. 11, 100098. doi:10.1016/j.resenv.2022.100098
Liu, X., Zhang, Y., and Zhong, Y. (2020d). Research on the generation and disposal of garden and greening waste in the main urban area of Chongqing. Low. Carbon World 10 (3), 1–2.
Liu, Y., Qi, Z., Zhao, J., Zhang, D., Lin, W., Wang, H., et al. (2020a). Current situation of urban garden waste and its resource utilization in China. Renew. Resour. Circular Econ. 13 (08), 38–44. doi:10.3969/j.issn.1674-0912.2020.08.009
Liu, Y., Zhao, J., Zhou, W., and Qi, Z. (2020b). Research progress on the resource utilization of urban landscaping waste. Environ. Sci. Technol. 43 (04), 32–38. doi:10.19672/j.cnki.1003-6504.2020.04.006
Lu, W., Huo, W., Gulina, H., and Pan, C. (2022). Development of machine learning multi-city model for municipal solid waste generation prediction. Front. Environ. Sci. Eng. 16, 119. doi:10.1007/s11783-022-1551-6
Ma, M. D., Yan, R., Du, Y. J., Ma, X., Cai, W., and Xu, P. (2017). A methodology to assess China's building energy savings at the national level: an IPAT-LMDI model approach. J. Clean. Prod. 143, 784–793. doi:10.1016/j.jclepro.2016.12.046
MacFarlane, D. W. (2009). Potential availability of urban wood biomass in Michigan: implications for energy production, carbon sequestration and sustainable forest management in the USA. Biomass Bioenerg. 33 (4), 628–634. doi:10.1016/j.biombioe.2008.10.004
Mahari, W. A. W., Peng, W. X., Nam, W. L., Yang, H., Lee, X. Y., Lee, Y. K., et al. (2020). A review on valorization of oyster mushroom and waste generated in the mushroom cultivation industry. J. Hazard. Mater. 400, 123156. Article 123156. doi:10.1016/j.jhazmat.2020.123156
Mi, F., Xie, D., Wu, W., Zhang, D., and Wang, W. (2011). “Analysis of influencing factors on the development of the utilization industry of garden green waste: a case study of Beijing [C]//Intelligent information technology application association,” in Proceedings of the 2011 international conference on software engineering and multimedia communication (SEMC 2011 V4). Qingdao, Shandong, China: College of Economics and Management, Beijing Forestry University; College of Economics and Management, Beijing University of Chemical Technology, 4.
National Greening Committee of China (2022). National land greening plan outline (2022-2030). Available online at: https://www.gov.cn/xinwen/2022-09/13/content_5709591.htm.
Nations, U. (2018). Revision of world urbanization prospects. New York, NY, USA: United Nations, 799.
NAWDO (National Association of Waste Disposal Officers) (1998). Composting green waste: a guidance to local authority client officers. British, Northampton: Institute of Wastes Management Business Services Ltd.
Pan, S., Shi, Z., Mao, X., Dong, Z., Yuan, F., and Luo, Y. (2024). The effects of composition and thickness of garden waste cover on soil bacterial community structure and function. J. Environ. Sci. 44 (02), 386–395. doi:10.13671/j.hjkxxb.2023.0301
Peng, Q., Chen, X., and Zhao, X. (2018). Current situation and countermeasures of resource utilization of garden waste in wuhan city. Jiangxi Agric. (24), 69–72.
Raja, N. C., and Purushothaman, P. (2023). Impact of sequential hybrid pretreatment in anaerobic digestion of food waste and garden waste co-digestion on waste characteristics and biogas production. J. Material Cycles Waste Manag. 25 (5), 2937–2950. doi:10.1007/s10163-023-01727-3
Ren, W. Z., Ye, L. F., Sun, Y. Q., Lyu, S., Wang, Y., and Zhang, Z. (2023). Decomposing the effect of technology on wastewater and related pollutants discharges in China. Resour. conservation Recycl. 198, 107206. doi:10.1016/j.resconrec.2023.107206
Reyes-Torres, M., Oviedo Ocana, E. R., Dominguez, I., Komilis, D., and Sánchez, A. (2018). A systematic review on the composting of green waste: feedstock quality and optimization strategies. Waste Manage 77, 486–499. doi:10.1016/j.wasman.2018.04.037
Schmidt, S., and Pahl-Wostl, C. (2007). Modeling biowaste flows for life-cycle assessment - calculation of the potential and collected weight of kitchen and garden waste. J. Ind. Ecol. 11 (1), 181–199. doi:10.1162/jiec.2007.1141
Shi, Y., Du, Y. Y., Yang, G. F., Tang, Y., Fan, L., Zhang, J., et al. (2013a). The use of green waste from tourist attractions for renewable energy production: the potential and policy implications. Energy Policy 62, 410–418. doi:10.1016/j.enpol.2013.07.126
Shi, Y., Ge, Y., Chang, J., Shao, H., and Tang, Y. (2013b). Garden waste biomass for renewable and sustainable energy production in China: potential, challenges and development. Renew. Sustain. Energy Rev. 22, 432–437. doi:10.1016/j.rser.2013.02.003
Shi, Y., Wang, Y., Yue, Y., Zhao, J., Maraseni, T., and Qian, G. (2021). Unbalanced status and multidimensional influences of municipal solid waste management in Africa. Chemosphere 281, 130884. doi:10.1016/j.chemosphere.2021.130884
Shu, T., Cai, W., Guo, H., Li, X., and Nie, X. (2021). Study on influencing factors and temporal and spatial characteristics of garden greening waste production in China based on IPAT model. Chin. Gard. 5 (6), 20–25. doi:10.19775/j.carolcarrollla
Shu, T., Tong, L., Guo, H., Li, X., Bai, B., Chen, Y., et al. (2021). Research status of generation and management of garden waste in China: a case of Shanghai. IOP Conf. Ser. Earth Environ. Sci. 766, 012074. doi:10.1088/1755-1315/766/1/012074
Song, B., Ren, X., Ding, Z., Li, H., and Song, S. (2023). Research on the current situation and policy of landscape greening waste disposal and utilization. For. Ind. 60 (08), 78–83. doi:10.19531/j.issn1001-5299.202308014
Springer, L. T. (2012). Biomass yield from an urban landscape. Biomass Bioenergy 37, 82–87. doi:10.1016/j.biombioe.2011.12.029
Suryawan, I. W. K., Septiariva, I. Y., Fauziah, E. N., Ramadan, B. S., Qonitan, F. D., Zahra, N. L., et al. (2022). Municipal solid waste to energy: palletization of paper and garden waste into refuse derived fuel. J. Ecol. Eng. 23 (4), 64–74. doi:10.12911/22998993/146333
Timilsina, N., Staudhammer, C. L., Escobedo, F. J., and Lawrence, A. (2014). Tree biomass, wood waste yield, and carbon storage changes in an urban forest. Landsc. Urban Plan. 127, 18–27. doi:10.1016/j.landurbplan.2014.04.003
UNEP(United Nations Environment Programme) (2024). Global waste management outlook 2024. Nairobi, Kenya: International Solid Waste Association.
UN-habitat (United Nations Human Settlements Programme) (2022). World cities report 2022:envisaging the future of cities. Katowice, Poland: United Nations Human.
Vu, H. L., Ng, K. T. W., and Bolingbroke, D. (2019). Time-lagged effects of weekly climatic and socio-economic factors on ANN municipal yard waste prediction models. Waste Manage. 84, 129–140. doi:10.1016/j.wasman.2018.11.038
Wan, Y., Liu, J., Deng, F., Xie, Z., Chen, Y., Li, J., Wang, W., and Zhao, T. (2023). Screening of lignin-degrading fungi and bioaugmentation on the directional humification of garden waste composting. Industrial Crops Prod. 203, 117208. doi:10.1016/j.indcrop.2023.117208
Wang, Y., Li, Y., Zhang, Y., Song, Y., Yan, B., Wu, W., et al. (2022c). Hydrothermal carbonization of garden waste by pretreatment with anaerobic digestion to improve hydrohcar performance and energy recovery. Sci. Total Environ. 807, 151014. doi:10.1016/j.scitotenv.2021.151014
Wang, Y. M., Tang, Y., and Yuan, Z. W. (2022a). Improving food waste composting efficiency with mature compost addition. Bioresour. Technol. 349, 126830. doi:10.1016/j.biortech.2022.126830
Wang, Z., Xie, W., and Liu, J. (2022b). Regional differences and driving factors of construction and demolition waste generation in China. Eng. Constr. Archit. Manag. 29 (6), 2300–2327. doi:10.1108/ECAM-10-2020-0887
Wu, W., Mi, F., Zhang, D., Wang, W., and Zhao, T. (2010). Development model of landscape greening waste resource utilization industry: a case study of beijing. World For. Res. 23 (05), 77–80. doi:10.13348/j.cnki.sjlyyj
Wu, Y., Mei, J., Dong, Y., and Xu, L. (2014). Study on composting technology of growing garden waste in the Yangtze River Delta region - taking suzhou as an example. Mod. Agric. (06), 91–93. doi:10.14070/j.cnki.15-1098.2014.06.091
Xin, L., Yuancheng, X., and Hu, S. (2023). Green waste characteristics and sustainable recycling options. Resour. Environ. Sustain. 11, 100098. doi:10.1016/j.resenv.2022.100098
Yan, H., Lu, H., Zhang, J., and Lv, H. (2016). Exploring the resource utilization of garden waste in foshan new city. Guangdong Landsc. Archit. 38 (01), 17–19. doi:10.3969/j.issn.1671-2641.2016.01.005
Yu, T., Liao, C., Stanisavljevic, N., Li, L., Peng, X., Gao, X., et al. (2024). Four-decades evolutionary development of municipal solid waste management in China: implications for sustainable waste management and circular economy. Waste Manag. and Res. 42 (12), 1143–1154. doi:10.1177/0734242X231221083
Yu, X., Sun, X., Xu, J., Du, J., Zhang, H., and Wang, H. (2009). Investigation on the current situation of landscape greening waste in Beijing and exploration of reuse strategies. Shandong For. Sci. Technol. 39 (04), 5–7+11. doi:10.3969/j.issn.1002-2724.2009.04.002
Zaman, K., and Moemen, M. A. E. (2017). Energy consumption, carbon dioxide emissions and economic development: evaluating alternative and plausible environmental hypothesis for sustainable growth. Renew. and Sustain. energy Rev. 74, 1119–1130. doi:10.1016/j.rser.2017.02.072
Zhu, Y., He, P., and Zhang, H. (2023). Analysis of the current situation, difficulties, and countermeasures of the generation and utilization of garden waste in Shanghai. Environ. Sanit. Eng. 31 (03), 15–23. doi:10.19841/j.cnki.hjwsgc
Appendix
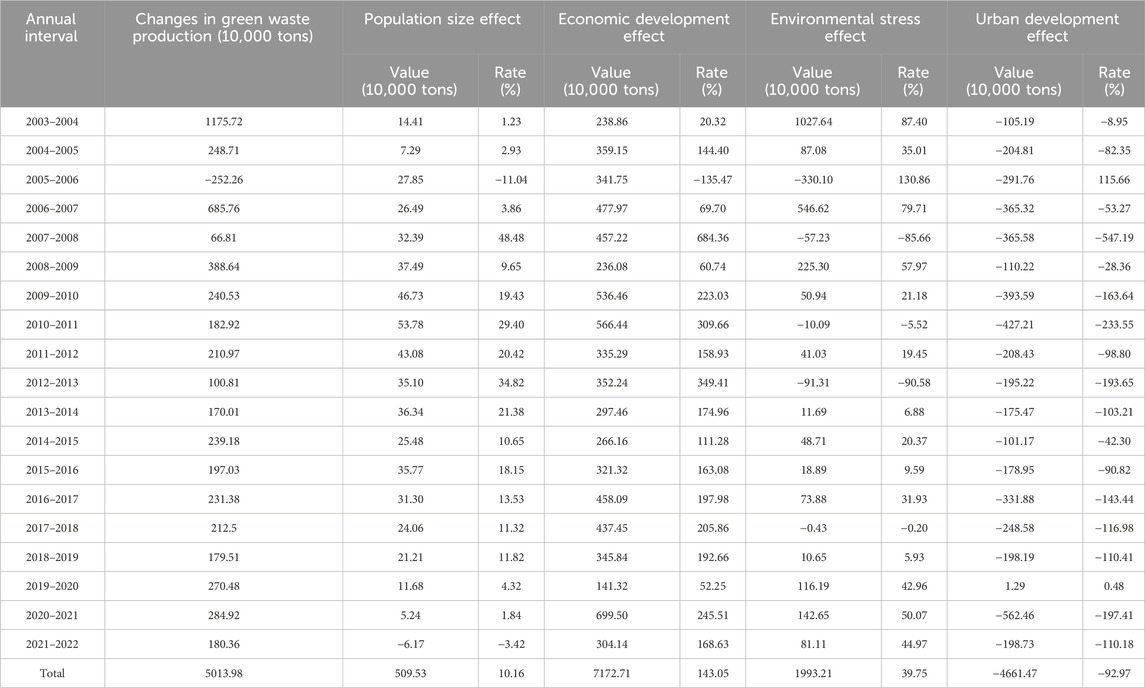
TABLE A1. Contribution of driving factors for changes in green waste resource quantity.
Keywords: green waste, resource quantity, spatiotemporal characteristics, IPAT-LMDI, driving factors
Citation: Song B, Han X, Li Y, Huang W, Fang Q, Ren X and Li H (2025) Dynamic spatio-temporal patterns and driving factors of green waste generation based on provincial panel data in China. Front. Environ. Sci. 13:1530769. doi: 10.3389/fenvs.2025.1530769
Received: 06 January 2025; Accepted: 24 March 2025;
Published: 09 April 2025.
Edited by:
Monika Jakubus, Poznan University of Life Sciences, PolandReviewed by:
Lakshmi Raghupathy, TERI School of Advanced Studies (TERI SAS), IndiaAbdullah Addas, King Abdulaziz University, Saudi Arabia
Copyright © 2025 Song, Han, Li, Huang, Ren and Li. This is an open-access article distributed under the terms of the Creative Commons Attribution License (CC BY). The use, distribution or reproduction in other forums is permitted, provided the original author(s) and the copyright owner(s) are credited and that the original publication in this journal is cited, in accordance with accepted academic practice. No use, distribution or reproduction is permitted which does not comply with these terms.
*Correspondence: Qiushuang Fang, cXNmYW5nQHNhYXMuc2guY24=