
94% of researchers rate our articles as excellent or good
Learn more about the work of our research integrity team to safeguard the quality of each article we publish.
Find out more
ORIGINAL RESEARCH article
Front. Environ. Sci., 08 April 2025
Sec. Environmental Citizen Science
Volume 13 - 2025 | https://doi.org/10.3389/fenvs.2025.1527855
 Priyanka deSouza1,2*
 Peter C. Ibsen3
 Daniel M. Westervelt4,5Ralph Kahn6
 Benjamin F. Zaitchik7
 Patrick L. Kinney8
Growing concerns about heat in urban areas paired with the sparsity of weather stations have resulted in individuals drawing on data from citizen science sensor networks to fill in data gaps. In the past decade, a proliferation of crowd-sourced sensors has provided low-cost local air quality and temperature, with one brand having over 14,000 sensors deployed in the United States between 1 January 2017 and 20 July 2021. Although the air quality data from PurpleAir sensors have been widely studied, less attention has been paid to reported temperature. Gridded modeled temperature datasets are widely used in epidemiologic studies. The spatial granularity of the crowd-sourced sensor data captures local temperature variation which existing gridded datasets cannot, and can potentially be used to generate exposure assessments for health research. We compare temperature metrics reported by the dominantly used crowd-sourced sensor in the United States with a gridded temperature product, the North American Land Data Assimilation System (NLDAS)-2, which although not a gold-standard measure of temperature, is widely used in epidemiologic research. We evaluate the lag between indoor and outdoor sensor temperatures. We report associations of the difference between outdoor sensor temperatures and NLDAS-2 temperatures, an indicator of degradation, and the duration of sensor operation. Finally, based on the temperature range recorded by the outdoor sensors vis-a-vis NLDAS-2 temperatures, we provide a list of 271 (2.5%) sensors potentially misclassified as outdoor and likely located indoors. We observed that the outdoor sensors agreed well with NLDAS-2 (R2 > 0.82). This association broke down under warm conditions (daily average NLDAS ≥21.1oC). Our comparison suggests that a radiative-correction needs to be applied to use crowd-sourced data reliably. However, the spatial granularity of the continental sensor network can reduce the measurement error in exposure assignment compared to the NLDAS-2. Indoor sensor temperatures lagged hourly NLDAS temperatures by 2 hours across almost all climate zones. The mean difference in hourly sensor and NLDAS-2 temperatures increased by 0.57oC for every operational year, suggesting that careful attention must be paid to degradation. Overall, we found that researchers should be aware of the limitations in crowd-sourced sensor air temperatures when examining extreme heat, or when aggregating sensor data across multiple years.
There is substantial evidence of associations between extreme heat and human physiological (Basu and Samet, 2002; Curriero et al., 2002; Guo et al., 2014; Son et al., 2019) and mental health (Lõhmus, 2018; Thompson et al., 2018; Liu et al., 2021), and livelihoods (Burke et al., 2015; Burke et al., 2023; Flouris et al., 2018). However, these associations are often derived from using temperature data from a single weather station as proxies for county- or city-level averages (Madrigano et al., 2015a; Madrigano et al., 2015b). Although this approach relies on actual measurements, many stations are located at airports which tend to be far from population-dense parts of cities, have considerably different surrounding land covers compared to where individuals reside, and may underestimate temperatures experienced as urban centers are often substantially warmer than surrounding areas (Spangler et al., 2019; Weinberger et al., 2019).
In recent years, modeled weather datasets at global and local levels have been used to estimate exposure to temperature. Modeled exposure datasets incorporate mixed methods and spatial interpolation to estimate temperature at resolutions more relevant to human activities. Although such gridded datasets can be extremely useful for health-related research, they cannot be fully validated at locations without monitors and may have large measurement errors in remote areas or settings of complex topography or land cover.
With multiple gridded temperature datasets available, recent efforts have been made to compare metrics from the variety of modeled temperature outputs. For example, researchers compared daily weather estimates from two gridded datasets, Parameter-elevation Regressions on Independent Slopes Model (PRISM) and Daymet (Spangler et al., 2019). They found that both datasets provide accurate temperature and the mean heat index at weather stations, but PRISM outperformed Daymet for assessments of the maximum daily heat index. A study observed that the ERA-5 product, in general, was reliably able to capture mean and extreme temperatures over Europe (Velikou et al., 2022). Behnke et al. (2016) compared air temperature from products: the North American Land Data Assimilation System (NLDAS)-2, PRISM, Daymet, among others, and found that mean temperatures from each product agreed well.
The rise of crowd-sourced air temperature data, especially in urban areas, has also been explored as a promising way to improve ground-based air temperature measurements’ spatial and temporal coverage (Meier et al., 2017; Feichtinger et al., 2020; Ibsen et al., 2024) and for generating down-scaled estimates of temperature to study intra-urban microclimates (Venter et al., 2020; Potgieter et al., 2021). However, the data quality of such measurements has been an important topic of concern due to 1) calibration issues, 2) design flaws such as overheating of the thermometer caused by inadequate shielding, 3) communication and software errors, 4) incomplete metadata, 5) unsuitable/unrepresentative installation locations of general population exposure, 6) instrument aging and poor maintenance (Bell et al., 2015).
In the present paper, we aim to clarify if crowdsourced air temperature data can be used to assess the health impacts of heat exposure by comparing hourly temperature recorded from the network of PurpleAir sensors (referred to as crowd-sourced sensors henceforth) in the United States (US) with air temperature data from a commonly used gridded meteorological product: the NLDAS-2, which is one of the few products that provides hourly-data. Although the NLDAS-2 is not a reference or ‘gold standard’ product, it has been extensively used in epidemiologic research (Rowland et al., 2020; Rowland et al., 2022; Shearston et al., 2023). We compare the two imperfect temperature datasets to understand the value highly spatially resolved crowd-sourced temperature measurements can add to existing exposure assessments, and understand under what circumstances this dataset can be used for health-related research.
The PurpleAir network is one of the most widely used low-cost air quality monitors in the United States (deSouza and Kinney, 2021; Considine et al., 2022; deSouza et al., 2022). Researchers have used the PM2.5 measurements from this network for different purposes (Barkjohn et al., 2022; deSouza, 2022). In addition to measuring fine particulate matter concentrations, the sensors also records air temperature. As of 7 July 2021, there were 14,777 PurpleAir sensors across the contiguous United States (Supplementary Figure S1–S3). As this network can provide more spatially-resolved temperature estimates than existing products in the United States, it is important to evaluate the data from this network for use in epidemiologic research.
Moreover, the PurpleAir network is one of the few citizen science networks with widespread indoor coverage, allowing for the investigation of home environments’ temperatures. Indoor temperatures can vary widely across different types of residences, particularly during heat waves. Previous research has found increased heat-related health risks for residents living a) on the top floor, b) in older buildings, and c) in buildings lacking insulation during heat waves (Quinn et al., 2017). The presence of air conditioners (ACs) can play a significant role in controlling temperature variability (Quinn et al., 2017; Romitti et al., 2022). Our work addresses issues of indoor heat exposure by comparing the temperature lag between indoor hourly crowd-sourced sensor temperatures and outdoor hourly temperatures from the NLDAS-2 product as a first step to define critical windows of exposure to the temperature in epidemiologic research.
Finally, no study to our knowledge has evaluated degradation in low-cost temperature sensors. We provide the first associations between the divergence in hourly outdoor sensor temperatures from NLDAS-2 with the duration of operation of the sensors. We disaggregate our results by climate zone and landcover type to identify regional and local-scale sources of potential error. Our analyses can be used to develop protocols to routinely replace the PurpleAir temperature sensors to ensure the collection of accurate temperature data. Finally, we also report the IDs of sensors likely misclassified as ‘outdoor’ when in reality they may be located indoors. These sensors may need to be reconsidered for use in analyses of ambient air pollution or temperature.
The PurpleAir reports air temperatures using a Bosch-BME280 pressure-temperature-humidity sensor. For this study, data from 14,920 PurpleAir sensors operating in the United States (excluding US territories) between 1 January 2017 and 20 July 2021 were downloaded from the API at a 15-min resolution. A small number of PurpleAir sensors were operational before 2017. However, given that the number of PurpleAir sensors increased dramatically from 2017 onwards, we chose 1 January 2017, as the start date of our analysis.
We removed all records with missing air temperature (T) and relative humidity (RH) data. We also removed measurements where T was ≤ −50 °C or ≥100 °C or RH was >99% as these corresponded to conditions beyond the sensor operational range, comprising ∼2.6% of all data. The 15-min data were averaged to 1 h intervals. A 75% data completeness threshold was used (at least 3 15-min measurements in an hour). This methodology ensures that the averages used are representative of hourly averages.
We calculated hourly mean T and RH from the 15-min averaged data from each crowd-sourced sensor. Overall, the dataset included 130,299,670 valid hourly averaged measurements with non-missing T data corresponding to 14,777 sensors (Supplementary Figure S1–S3; 29,136,655 measurements from 3,871 indoor sensors and 101,163,015 measurements from 10,906 outdoor sensors).
The NLDAS-2 is an hourly temperature product available at a 0.125o grid throughout the contiguous U.S. It has been widely used in epidemiologic research (Rowland et al., 2020; Rowland et al., 2022; Shearston et al., 2023). We merged each hourly PurpleAir sensor with the corresponding hourly NLDAS-2 data from the grid cell the sensor fell into. NLDAS-2 was used for this study because it provides hourly temperature information. More details on the NLDAS-2 product can be found in S1 in Supplementary Information.
International Energy Conservation Code (IECC) Climate Zones (https://codes.iccsafe.org/content/IECC2021P1/chapter-3-ce-general-requirements, last accessed 7 May 2024) represent different T and RH conditions (Supplementary Figure S1). We joined crowd-sourced sensors with the corresponding climate zone. Note that when joining climate zones with the complete dataset of sensor IDs, a handful of sensors did not fall within a climate zone as they appeared to be located on water bodies. We removed data corresponding to these sensors when evaluating climate zone-specific associations, corresponding to 2.9% of all data records (Supplementary Figure S2).
We joined each sensor with the corresponding landcover type using data from the National Land Cover Database (NLCD) for the year 2021 (Dewitz, 2023), available at 30 m spatial resolution (https://www.mrlc.gov/data/type/land-cover, Last accessed 7 May 2024) (Supplementary Figure S3).
We conducted linear regression analyses to assess the relationship between the crowd-sourced sensor data (independent variable) and NLDAS-2 data (dependent variable), disaggregated by sensor location type: indoor and outdoor), for epidemiologically significant temperature metrics: hourly temperature, daily mean, minimum, and maximum temperatures, and nighttime temperature for different nighttime definitions: 1) Between 4 a.m. and 8 a.m., 2) Between 6 p.m. and 6 a.m., and 3) Between 9 p.m. and 6 a.m., as these exposures are relevant to epidemiologic research (Basu and Samet, 2002; Murage et al., 2017). Moreover, previous research has shown that if citizen science weather stations are exposed to direct sunlight, measurements can be subject to radiative errors due to solar heating. Comparing nighttime temperatures allows us to compare the crowd-sourced sensor with NLDAS-2 measurements without the impact of the radiative error (Nakamura and Mahrt, 2005).
We report goodness of fit (adjusted R2), slope, intercept of the regression line of best fit, as well as the root mean square errors (RMSE). Higher R2 values, lower RMSEs, and slopes closer to one and y-intercepts closer to zero were considered better estimations of the observed data.
To evaluate the agreement of the temperature metrics in hot conditions, we repeated the comparisons under conditions where the average daily temperature exceeds 21.1°C, a threshold used in previous research (Atalla et al., 2018; Spangler et al., 2019; Kennard et al., 2022). We conducted this analysis using only days where the daily sensor network temperatures were ≥21.1°C; and separately days where the daily NLDAS-2 temperatures were ≥21.1°C. When performing these comparisons, we only used one nighttime temperature metric (between 4 a.m. and 8 a.m.) due to the similarity between the three nighttime temperatures considered.
This study repeated the comparison of NLDAS-2 and sensor network temperature metrics disaggregated by climate zone and landcover type. We used likelihood ratio tests to evaluate whether climate zone or landcover type were significant modifiers of the association between crowd-sourced sensor and NLDAS-2 temperatures.
We carried out an Analysis of Variance (ANOVA) test to determine which factors: sensor temperature (to account for the possibility that the error was temperature dependent), elevation, cubic spline of the hour of the day (for the hourly temperature metric only), month and year, landcover type, and climate region most explain variation in the difference between outdoor sensor and NLDAS-2 hourly-temperatures.
We compared indoor sensor data with outdoor temperatures from the corresponding NLDAS-2 grid cell by calculating cross-correlations between lagged hourly indoor sensor temperatures with NLDAS-2 measurements as proposed in Leichtle et al. (2023) to determine the relationship and dependency of indoor and outdoor temperatures. For an initial evaluation, we evaluated the sample cross-correlation based on the mean value of all outdoor and indoor temperature measurements to describe the general temporal dependency of indoor temperatures on outdoor temperatures. However, given the strong local variation of urban microclimates, we repeated this analysis disaggregated by: a) climate zone and b) landcover type.
We evaluated the dependence of the difference between the hourly outdoor crowd-sourced sensor network and NLDAS-2 temperatures on the duration of operation by regressing the difference against the duration of operation (unit: hours). Although the NLDAS-2 data have uncertainties, they are consistent over time. The difference between the sensor network and the NLDAS-2 temperatures can thus indicate degradation in the sensors. In supplementary analyses, we considered the absolute difference between the two hourly temperatures and the ratio between the two temperatures:
We used likelihood ratio tests to evaluate if climate zone and landcover type were significant modifiers of the association between the difference in temperatures and duration of operation. We report overall associations between the difference in temperatures and duration of operation, and climate zone and land-cover specific associations, by interacting hour of operation with each of these potential modifiers in turn.
We adapted a widely used method to evaluate potential misclassifications of crowd-sourced sensors assigned as outdoor instead of indoor sensors. Indoor sensors will likely show less diurnal and annual temperature variation than corresponding outdoor sensors. Therefore, if an outdoor sensor was set up inside a building, we would expect the monthly averages of daily minimum air temperature to be significantly lower due to the thermal inertia of buildings. To evaluate potential misclassifications of the sensor location, we followed the methodology discussed by Meier et al. (2017).
a) First, we calculated the standard deviation between monthly averages of daily minimum air temperatures (Tn) from outdoor sensors and the NLDAS-2 dataset. For the summer month of July and the winter month of December, we plotted mean Tn versus standard deviation of Tn from the outdoor sensors. We drew an ellipse on the plot, where the axes of the ellipse were defined as 5 x mean Tn,NLDAS-2, and 5 x standard deviation of Tn,NLDAS-2. We flagged stations outside the ellipse and removed them from further analyses, as they were likely misclassified.
b) We evaluated histograms of mean Tn,NLDAS-2 and the standard deviation of Tn,NLDAS-2. We defined bin sizes of the histogram based on minimum and maximum values of mean Tn,NLDAS-2, and the standard deviation of Tn,NLDAS-2 inside the ellipse, and a fixed number of ten bins. For every combination of bins in the histograms of mean Tn,NLDAS-2 and the standard deviation of Tn,NLDAS-2 (two-dimensional density), the relative frequency was computed and all sensors inside a two-dimensional bin with a relative frequency ≤0.01 were flagged as likely misclassified.
To summarize, all stations outside a specific range were flagged as potentially misclassified based on their position relative to the ellipse for summer and winter, respectively in step a). We then identified sensors that displayed a smaller temperature range relative to others in step b). The sensors identified using this method need to be validated in future research.
We used a p-value of 0.05 as the threshold for statistical significance in this study.
Results from regressing crowd-sourced sensors (independent) against the NLDAS-2 (dependent) metrics that have epidemiologic significance (hourly temperatures, daily mean, daily minimum, daily maximum, nighttime temperatures) disaggregated by location type (indoor/outdoor) are displayed in Table 1 and Supplementary Figures S4–S10.
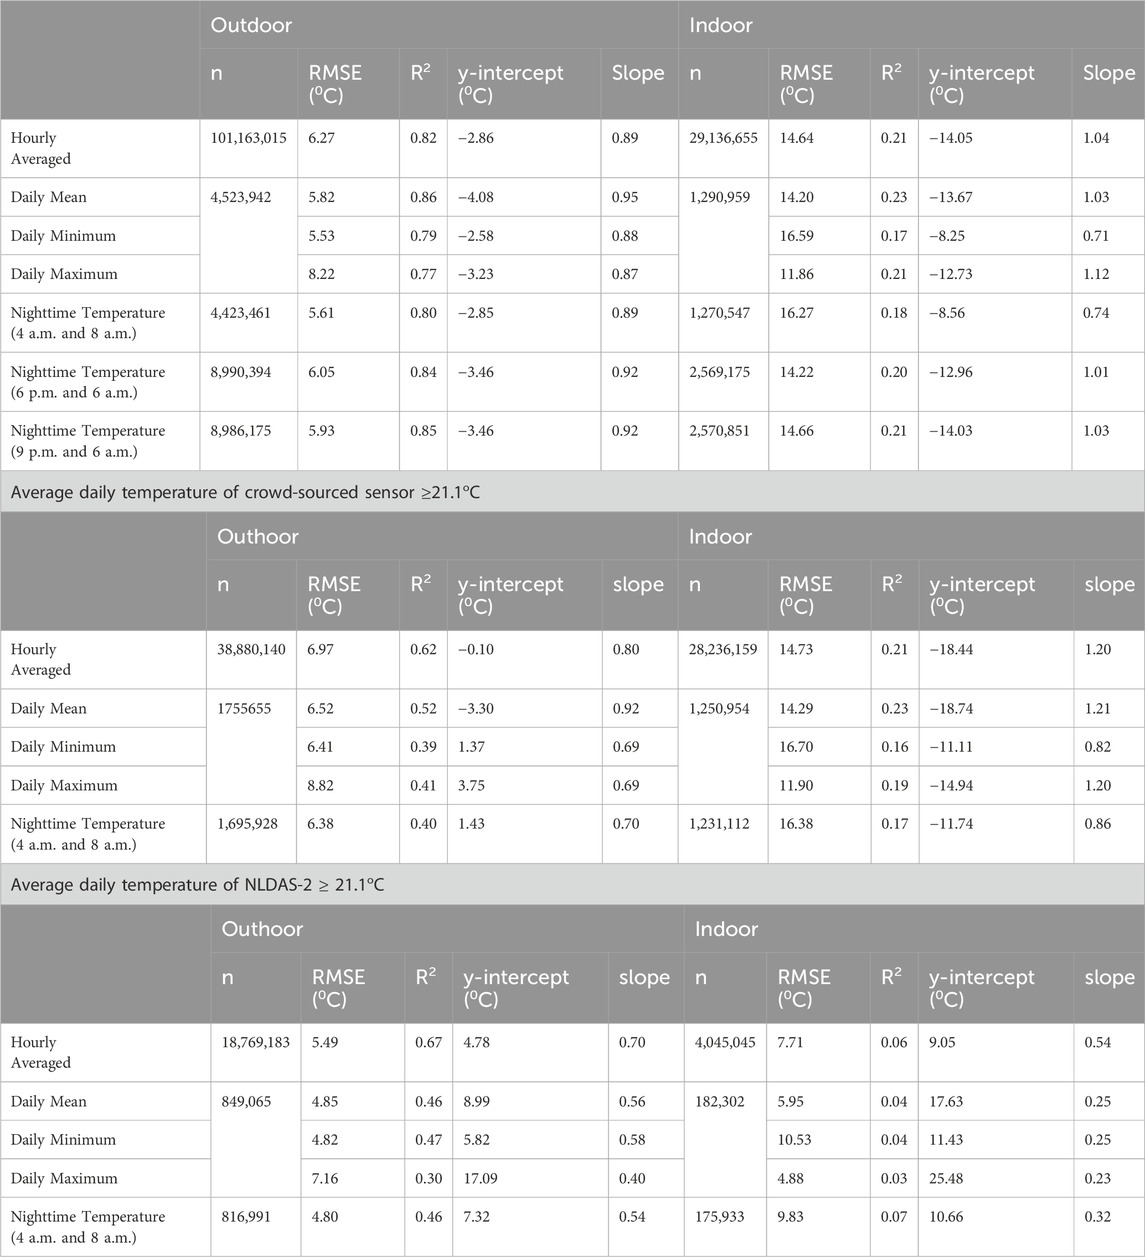
Table 1. Comparing epidemiologically relevant crowd-sourced sensor and NLDAS temperature metrics by regressing purpleAir against the corresponding NLDAS-2 data.
Overall, we observed good agreement between the different temperature metrics derived from outdoor sensors with the corresponding NLDAS-2 data (R2 ranged between 0.77 and 0.86; RMSE ranged between 5.53°C and 6.27°C; Table 1; Supplementary Figure S1). The outdoor sensor temperatures were higher than the NLDAS-2 measurements. Specifically, hourly NLDAS-2 measurements are on average lower than the sensor measurements by −2.86°C (Table 1; Supplementary Figure S4). This is supported by the fact that the slopes between sensor and NLDAS-2 temperatures are <1 (Table 1). We observed this result for the other temperature metrics considered. There were more than twice as many (38,880,140) hourly measurements where the daily mean sensor measurements were ≥21.1°C, vs. those for NLDAS-2 (18,769,183) (Table 1).
Among the daily aggregated measures, the daily means of the outdoor sensors displayed the best agreement R2 (0.86 compared to 0.79 and 0.72 for the daily min and max, respectively). However, the bias of the daily mean temperature metric was higher than the daily minimum and maximum temperatures (y-intercept: −4.08°C compared with −2.58°C and −3.23°C, respectively; Table 1; Supplementary Figures S5–S7). The RMSE of the daily minimum temperature was the lowest: 5.53°C compared to the daily mean (RMSE: 5.82°C) and daily maximum (RMSE: 8.22°C) (Table 1). The difference in the order of the RMSE and R2 metrics is likely driven by a subset of high sensor measurements (sensor daily temperature metrics >50°C, where corresponding NLDAS-2 temperature metrics are ∼25°C; Supplementary Figures S5–S7).
We observed good agreement between the nighttime temperature metrics between the outdoor sensors and NLDAS-2 measurements (R2 ranged between 0.80 and 0.85; RMSE ranged between 5.61°C and 6.05°C; Table 1; Supplementary Figure S8–S10). Poorer agreement between sensor network and NLDAS-2 metrics was observed on days with higher mean temperatures (average daily sensor or NLDAS-2 ≥ 21.1°C; Table 1; Supplementary Figures S11–S19).
Unsurprisingly, the hourly indoor sensor network measurements displayed poorer agreement (RMSE: 14.64°C, R2: 0.21) than outdoor measurements. The bias of the indoor sensor network temperature metrics compared to the NLDAS-2 had higher absolute values and was negative (y-intercept comparing hourly measurements was −14.05°C; Table 1; Supplementary Figure S4).
The agreement between sensors and NLDAS-2 temperature metrics during days when daily averaged sensor temperatures ≥21.1°C, were similar, but poorer, compared with the overall results (Table 1; Supplementary Figures S11, S12, S14, S16, S18). There was no agreement (R2 ∼ 0) between indoor sensor metrics and NLDAS-2, likely because indoor spaces in this dataset were regulated (kept cool) during hot days. Indeed, we observed that the bias of indoor sensor temperature metrics compared to NLDAS-2 on these days is positive, suggesting that NLDAS-2 temperature metrics are higher during these days. Importantly, we also observed a much poorer agreement between outdoor sensor and NLDAS-2 metrics on days where daily NLDAS-2 ≥ 21.1°C (Table 1; Supplementary Figures S11, S13, S15, S17, S19).
Likelihood ratio tests revealed that climate and land cover were significant modifiers of the association between sensor and NLDAS-2 temperature metrics. When evaluating these agreements disaggregated by climate zone, we observed that the best agreements between hourly outdoor sensor and NLDAS-2 metrics were in humid environments (mixed-humid: R2: 0.88, hot-humid: R2: 0.87), with the poorest agreement for marine climates (R2: 0.70; Figure 1). Note, however, that the plurality of measurements (36,194,357 measurements, 35.8%) observed were in marine environments compared with the hot-humid (3,089,309 measurements, 3.1%) and mixed-humid (6,435,901 measurements, 6.4%) environments (Supplementary Table S1). Similar results were observed when evaluating agreements with other temperature metrics (Supplementary Figures S20–S28; Supplementary Table S2).

Figure 1. Heatmap representing the relationship between (A) Outdoor and (B) Indoor crowd-sourced sensor hourly temperatures and the corresponding NLDAS-2 measurements, disaggregated by climate zone. The fitted regression line, equation, and regression fit (R2 value) are also displayed.
When evaluating the agreement between outdoor PurpleAir and NLDAS-2 temperature metrics, disaggregated by landcover type, we observed the best agreements in wetlands (R2 ∼ 0.9; <1% of all measurements) and deciduous forests (R2 ∼ 0.9; <1% of all measurements). Most of the measurements were on developed low (26,612,991, 26.3% of all measurements), medium (35,245,868, 34.8% of all measurements), and high intensity (12,065,927, 11.9% of all measurements) landcover. The lowest agreement observed was in developed high- and medium-intensity areas (R2: 0.81), compared with low-intensity areas (R2: 0.83) (Supplementary Figures S29, S30; Supplementary Table S1). Comparison between the sensor network and NLDAS-2 for other temperature metrics disaggregated by landcover type were similar (Supplementary Figures S31–S44; Supplementary Tables S2–S4).
The results from the ANOVA analysis revealed that most of the difference (∼66–80%) between outdoor hourly crowd-sourced sensor data and NLDAS-2 temperature remained unexplained (Table 2).
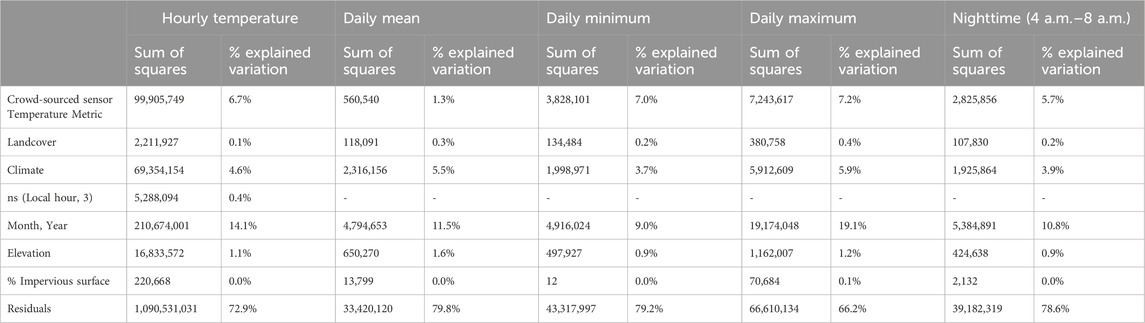
Table 2. Sum of Squares (Explained variation (%) in the difference between outdoor crowd-sourced sensor and NLDAS-2 temperature metrics.
For the hourly temperature metric, month-year (seasonality), sensor temperature, climate zone, and elevation (m) explained a significant 14.1%, 6.7%, 4.6%, and 1.1% of the variation, respectively. Landcover type, a natural cubic spline of the local hour of the day, % of impervious surface, each explained a small (<1%) but a significant portion of the overall variation.
Similar results were observed for the difference in nighttime temperatures. For the daily temperature metrics, month-year (seasonality) explained between ∼9 % and 19% of the total variation in the difference between the sensor network and NLDAS-2 data. Seasonality explained a larger % in variation in the difference between the daily maximum temperatures.
Our cross-correlation analysis revealed that overall, indoor crowd-sourced sensor hourly temperatures lagged the NLDAS-2 temperatures by 2 h (Supplementary Figure S45; Table 3), i.e., the highest correlations were observed between NLDAS-2 temperatures and sensor temperatures 2 hours later. We observed that this lag period was robust to disaggregating the data by climate zone (Supplementary Figure S46), except for the marine and very-cold climate zones where the indoor sensor measurements lagged the NLDAS-2 by three, and 4 hours, respectively. The 2-h lag held true when restricting measurements considered to the fall and winter (heating periods). We note that in the spring and summer (cooling season), a lag of two and 3 hours yielded similar correlations. In the spring, a lag of 3 hours performed marginally better than a lag of 2 hours. We note that the correlation between indoor and outdoor temperatures was unsurprisingly lowest in the winter when heaters are used (Table 3).
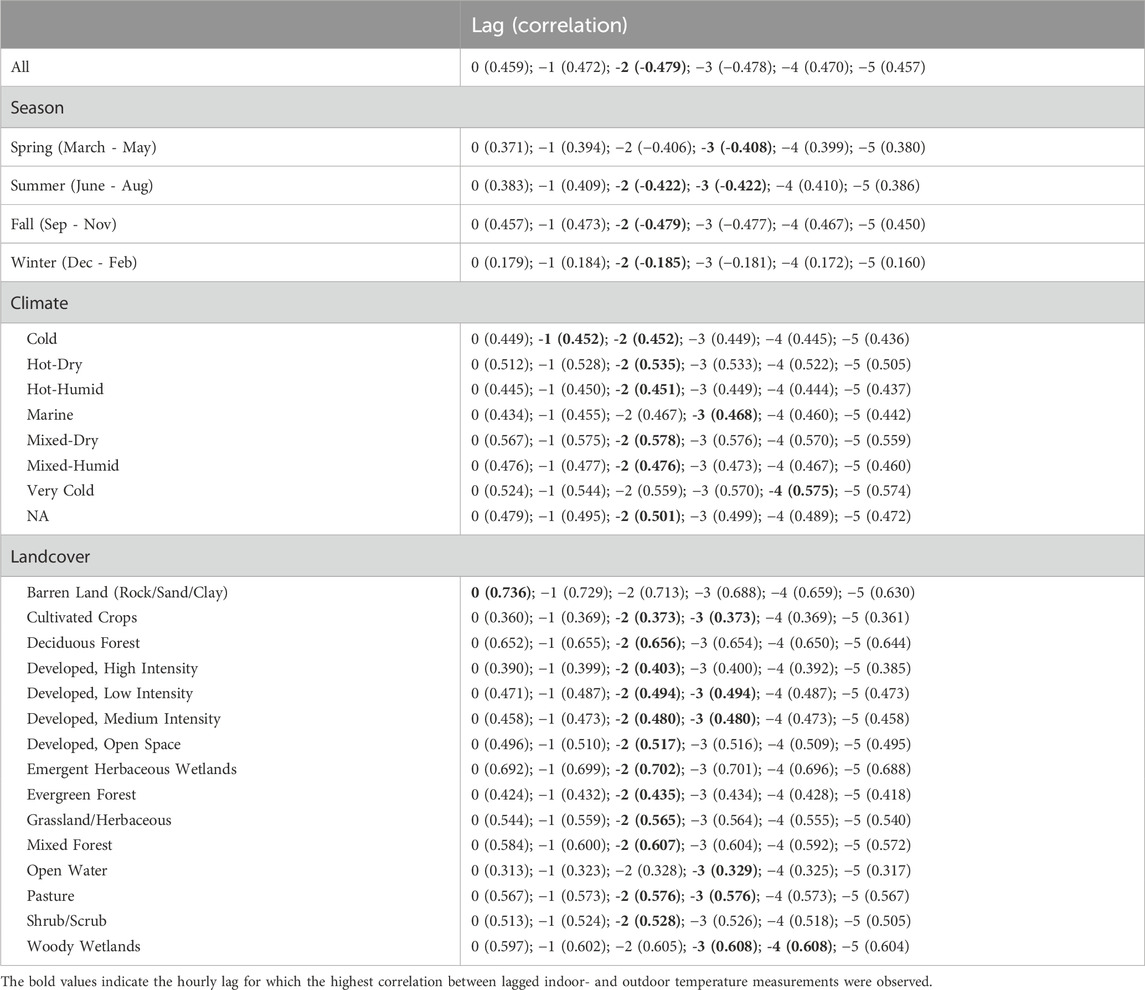
Table 3. Correlations between all hourly NLDAS-2 measurements and lagged indoor PurpleAir data (ranging between 0–5 h), and measurements disaggregated by climate zone and landcover type.
The 2-h lag between the indoor sensor hourly measurements and the NLDAS-2 data was also robust to disaggregating landcover type (Supplementary Figure S47), except for barren land where we observed no lag; open water where the lag observed was 3 hours; woody wetlands, where lags of three and 4 hours provided the same correlations. For developed, low intensity, developed, medium intensity, cultivated crops, and pasture lands, a 3-h lag window appeared to have the same performance as a 2-h lag (Table 3).
We observed significant associations between the simple difference in the hourly outdoor crowd-sourced sensor and NLDAS-2 temperatures with duration of operation corresponding to 6.5 × 10⁻⁵ °C/h of operation, or 0.57 °C/year of operation. This means that on average, across all 10,906 outdoor sensors, the sensor network overpredicted hourly temperature compared to NLDAS-2 hourly temperatures by an additional 0.57oC annually.
Likelihood ratio tests indicated that land cover and climate zones were significant modifiers of the association between the difference in temperatures and hours of operation (Table 4). Maximum degradation occurred in cold climates: 0.54 °C/year of operation, with the least degradation in very cold climates: 0.17 °C/year of operation. Maximum degradation occurred on pasture land: 0.89 °C/year of operation, with minimum degradation: 0.37 °C/year of operation in shrubland.
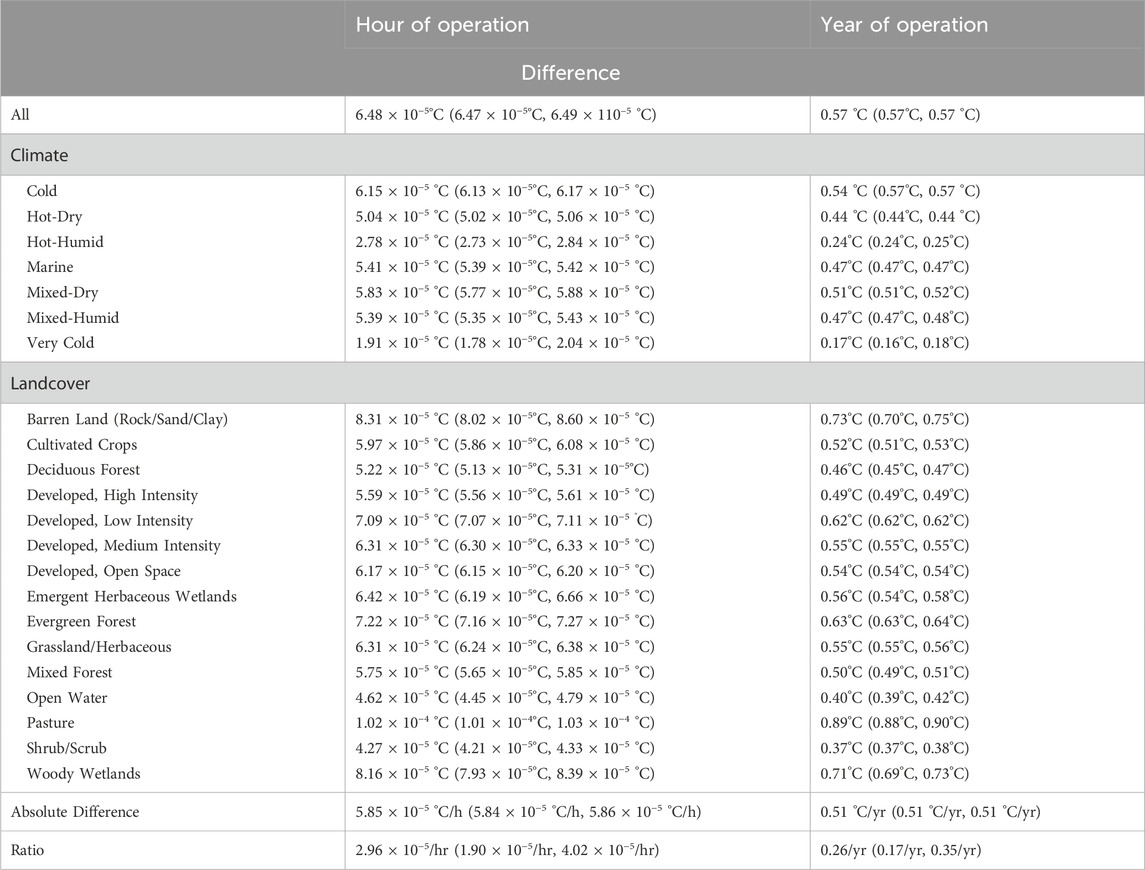
Table 4. Associations (95% CI) between degradation metrics: difference (disaggregated by climate zone and landcover), absolute difference, and the ratio between hourly outdoor crowd-sourced sensor and NLDAS-2 temperatures and duration of operation (hour of operation and year of operation).
We observed significant associations between the absolute difference, and the ratio of the crowd-sourced sensor and NLDAS-2 hourly temperatures with the duration of operation corresponding to 5.85 × 10⁻⁵ °C/h of operation or 0.51 °C/year of operation, 2.96 × 10⁻⁵/hour of operation or 0.26/year of operation (Table 4). For the metric, absolute difference, just like for the metric: difference, maximum degradation occurred in cold climates: 0.50 °C/year of operation, while minimum degradation occurred in very cold climates: 0.17 °C/year of operation; maximum degradation occurred in pasture land: 0.83 °C/year of operation with minimum degradation in shrubland: 0.35 °C/year of operation (Supplementary Table S5). For the metric, the ratio, the majority of the disaggregated degradation metrics were not significant and the 95% CI widely overlapped with 0 (Supplementary Table S5).
When determining which crowd-sourced sensors were mistakenly classified as ‘outdoor’, Step a) identified 13 sensors displaying smaller temperature variations relative to the NLDAS variation, which likely indicated that they were indoors (Supplementary Figure S48). Using Step b), we further identified 258 sensor IDs displaying smaller variations (Supplementary Figures S49, S50). Figure 2 displays the locations of all 271 (out of 10,906; 2.5%) potentially misclassified sensors.

Figure 2. Potentially misclassified outdoor sensors (271) that are likely indoors. The sensor IDs are listed on the map.
Overall, outdoor crowd-sourced temperature compared favorably (R2 > 0.82) with corresponding NLDAS-2 temperature data for the different temperature metrics considered (hourly temperatures, daily mean, minimum, maximum temperatures, and nighttime temperatures), suggesting that outdoor sensor temperatures could potentially be used as exposure assessments in epidemiologic research.
Of all the temperature metrics considered, the best agreement (R2: 0.86) between the outdoor sensor and NLDAS-2 temperatures was observed for the daily mean temperature metric (Table 1). Surprisingly, the agreement was slightly lower when comparing nighttime temperatures (R2: 0.80–0.85) where the radiative error in temperature measurement (described in more detail below) is expected to be less (Table 1).
The RMSE observed when comparing the sensor network and NLDAS-2 temperatures is between 5 and 7oC and higher than that observed in previous research (Table 1). Bell et al. (2015) compared measurements made by seven crowdsourced weather stations with a professionally managed station in Birmingham, UK over a year. They observed a mean bias between sensors ranging from - 0.5oC to 2.1oC (RMSE was not reported). Other research that evaluated the performance of other crowdsourced temperature sensors such as the Netatmo vis. a.vis. reference stations observed that the sensors exhibited a warm bias between 1 and 6oC across different sites in London in the summer (Chapman et al., 2017).
One of the reasons for the poor RMSE compared to other studies is that the crowd-sourced sensors appear to overpredict temperatures on hot days compared to NLDAS data, suggesting that outdoor sensors cannot reliably assess warm temperatures for epidemiologic research (Table 1). Specifically, on days where the daily-averaged NLDAS temperatures were ≥21.1oC, the R2 when comparing daily-averaged NLDAS and sensor-network data was 0.46. This bias could be due to the location of the temperature sensor within the sensor unit. During extreme heat, the units themselves could retain excess heat from exposure to solar radiation. This excess heat is likely re-radiated to the sensor resulting in an overprediction of outdoor temperatures. Similar effects have been seen with other covered air temperature sensors deployed in specific research settings (Terando et al., 2017). Researchers have stressed the importance of correcting for systematic radiative error in low-cost sensors for their use in different applications (Bell et al., 2015; Chapman et al., 2017). Future experiments are needed to bias-correct the sensor temperature sensors by co-locating them with accurate reference monitors and using additional local climatic information on wind speed, relative humidity, shade, and solar radiation.
Another potential reason for the relatively high RMSE observed in this study is the mismatch in the spatial scale of the NLDAS-2 temperatures (12 km × 12 km) compared to the point sensor temperature data. Most sensors were deployed in urban areas that have highly heterogeneous land cover (Supplementary Table S3). Research has shown that temperature varies significantly across local climate zones that have spatial resolutions of ∼100 m - 10,000 m (Stewart and Oke, 2012). Recent work has found that an urban land cover at a 60 m2 resolution contributes between 15% and 56% of intraurban temperature variation at high temperatures (Ibsen et al., 2024). The crowd-sourced sensors thus capture the local variation in temperature, which NLDAS-2 is too coarse to capture.
Indeed, we found that climate zone and landcover type were significant modifiers of the relationship between outdoor (and indoor) sensor temperature measurements and NLDAS-2 data. Unsurprisingly, based on our hypothesis above, the poorest agreement between the sensor network and NLDAS-2 was observed in high- and medium-intensity developed areas (R2 ∼ 0.82) in urban areas where most sensors were located (Figure 1). The best agreement between outdoor sensors and NLDAS temperatures was observed for humid climates (R2 ∼ 0.87) and the poorest agreement in marine climates (R2 ∼ 0.70; where most of the sensor network were located). The relatively small number of sensors in non-developed land cover areas (<2%) makes drawing robust conclusions on the impact of such land cover on PurpleAir temperature sensor performance difficult (Supplementary Table S3).
A third reason for the poor RMSE compared to other studies could be a combination of heterogeneous land cover and the poorer performance of the crowd-sourced sensors at high temperatures. Our ANOVA analysis indicates that 6.7% of the variation in the difference between the sensor temperature and the NLDAS-2 temperatures was explained by sensor temperatures recorded, as opposed to 0.1% by land cover and 4.6% by climate zone. Higher temperatures are observed in urban areas due to the urban heat island effect. The interaction between temperature and land cover is complex as the higher temperatures recorded are both a reflection of the local environment, but also coincide with a greater potential error.
However, the strong R2 (0.86) between the sensor network and the NLDAS temperature datasets suggests that crowd-sourced sensors adequately capture the regional trends in temperature that the NLDAS-2 dataset provides, and they likely capture intra-urban temperature variations that the NLDAS-2 is too coarse to capture. Overall, our results indicate that after systematic radiative error correction, the high spatial resolution of the crowd-sourced sensor networks can provide added value in developing exposure assessments for epidemiologic research in the future, especially when using local daytime mean air temperature as the exposure of interest.
Unsurprisingly, the indoor sensor network sensors showed poorer agreement with the NLDAS-2 temperatures than the outdoor sensors (Table 1). Given that outdoor temperatures are widely assigned as exposure, despite Americans spending a substantial amount of time indoors, such a comparison provides an estimate of the measurement error based on existing exposure assignments. Indoor sensor hourly temperatures lagged the NLDAS temperatures by 2 hours across climate zones, seasons, and landcover types, suggesting that this lag be considered in epidemiologic research investigating the relationship between temperature and health outcomes. For smaller geographic areas where data are available, future research can consider the impact of building type and the use of heating and cooling by users on these findings. Future research can also consider using indoor-outdoor sensor pairs where available to confirm our results.
We observed that the mean difference between hourly outdoor sensor and NLDAS-2 temperatures increased by 0.57oC for every operational year, suggesting that degradation should be an important consideration in the maintenance of these devices. We also observed that the rates of degradation varied significantly by climate zone and landcover type, with the highest rates of degradation observed in cold climates. This result highlights how when using crowdsourced air temperature data in epidimological studies, research must take into account the age and location of the sensors being used. By taking a “kitchen-sink” approach and aggregating as much available sensor data as possible, researchers run the risk of erroneously adding a heteroscedastic pattern to their results.
Finally, we also list IDs of 271 (∼2.5%) crowd-sourced sensors that have been potentially misclassified as ‘outdoors’ when they were in reality located indoors. Using the methods described in our work, data from these sensors may need to be investigated in analyses focused on integrating sensor networks air pollution data with other datasets to obtain down-scaled air pollution products in the United States (Lu et al., 2021; Lu et al., 2022). Like other studies, we found that a rigorous data quality assessment is necessary for using this dataset in different applications.
This is the first study that has comprehensively evaluated the air temperature data reported by the U.S. national crowd-sourced sensor network focusing on using these data in epidemiologic studies to assess the impact of temperature on health outcomes. As a necessary first step, this work is not without limitations. More research is needed to compare crowd-sourced sensor temperature data with ground-based ‘gold-standard’ monitors to evaluate the use of this data for other applications, such as determining local temperature variations and in urban climate research. Furthermore, due to the coarse spatial scale, the NLDAS-2 dataset does not adequately capture the within-city urban heat island effect. In the future, research would benefit by comparing the temperature from crowd-sourced sensors in dense, urban areas, with more spatially resolved temperature products such Daymet or PRISM.
Extreme heat threatens human health. Temperature data from a single weather station is often used as a proxy for city- or county-level averages. However, such stations tend to be in sparsely populated locations near airports and may underestimate temperatures experienced in urban centers. Although modeled weather datasets have been used in recent years to estimate exposures at the local and global levels, these data cannot be validated at locations without monitors. These datasets may have large errors in settings of complex topography. The rise of crowd-sourced sensors can potentially improve the spatiotemporal coverage of ground-based air temperature measurements for developing exposure assessment for health research. Accordingly, we provide results of the first comparison of temperature reported by 14,777 crowd-sourced sensors in the contiguous United States with that of a gridded temperature product, the NLDAS-2, that is not the gold-standard for temperature, but is widely used in epidemiologic research. Although temperature metrics from the sensors and NLDAS-2 products agreed well, this agreement broke down on warm days. Our comparison showed that a radiative-correction needs to be applied to the sensor data to reliably use its measurements for health research. However, the spatial granularity of the continental sensor network can reduce the measurement error in exposure assignment compared to the NLDAS-2. Indoor sensor temperatures lagged outdoor temperatures by 2 hours across climate zones and landcover types. This suggests that considering such lags in epidemiological studies may be important for defining critical windows of exposure to temperature. We identified 271 (2.5%) crowd-sourced sensors that were likely misclassified as outdoor and may need to be reconsidered in analyses of ambient temperature and air quality. Finally, we observed that the mean difference between sensor and NLDAS-2 temperatures increased by 0.57oC for every operational year.
NLDAS-2 data are openly available and were downloaded using Google Earth Engine. The PurpleAir data were downloaded via the PurpleAir website in 2021 when the data were publicly available.
PD: Conceptualization, Data curation, Formal Analysis, Funding acquisition, Investigation, Methodology, Project administration, Resources, Software, Supervision, Validation, Visualization, Writing–original draft, Writing–review and editing. PI: Funding acquisition, Resources, Writing–review and editing. DW: Writing–review and editing. RK: Writing–review and editing. BZ: Conceptualization, Writing–review and editing. PK: Writing–review and editing.
The author(s) declare that financial support was received for the research and/or publication of this article. PD and PI were funded by a NASA ROSES award, EEJ21-0064.
The authors declare that the research was conducted in the absence of any commercial or financial relationships that could be construed as a potential conflict of interest.
The author(s) declare that no Generative AI was used in the creation of this manuscript.
All claims expressed in this article are solely those of the authors and do not necessarily represent those of their affiliated organizations, or those of the publisher, the editors and the reviewers. Any product that may be evaluated in this article, or claim that may be made by its manufacturer, is not guaranteed or endorsed by the publisher.
Any use of trade, firm, or product names is for descriptive purposes only and does not imply endorsement by the U.S. Government.
The Supplementary Material for this article can be found online at: https://www.frontiersin.org/articles/10.3389/fenvs.2025.1527855/full#supplementary-material
Atalla, T., Gualdi, S., and Lanza, A. (2018). A global degree days database for energy-related applications. Energy 143, 1048–1055. doi:10.1016/j.energy.2017.10.134
Barkjohn, K. K., Holder, A. L., Frederick, S. G., and Clements, A. L. (2022). Correction and accuracy of PurpleAir PM2.5 measurements for extreme wildfire smoke. Sensors 22, 9669. doi:10.3390/s22249669
Basu, R., and Samet, J. M. (2002). Relation between elevated ambient temperature and mortality: a review of the epidemiologic evidence. Epidemiol. Rev. 24, 190–202. doi:10.1093/epirev/mxf007
Behnke, R., Vavrus, S., Allstadt, A., Albright, T., Thogmartin, W. E., and Radeloff, V. C. (2016). Evaluation of downscaled, gridded climate data for the conterminous United States. Ecol. Appl. 26, 1338–1351. doi:10.1002/15-1061
Bell, S., Cornford, D., and Bastin, L. (2015). How good are citizen weather stations? Addressing a biased opinion. Weather 70, 75–84. doi:10.1002/wea.2316
Burke, M., Hsiang, S. M., and Miguel, E. (2015). Global non-linear effect of temperature on economic production. Nature 527, 235–239. doi:10.1038/nature15725
Burke, M., Tanutama, V., Heft-Neal, S., Hino, M., and Lobell, D. (2023). Game, sweat, match: temperature and elite worker productivity. doi:10.3386/w31650
Chapman, L., Bell, C., and Bell, S. (2017). Can the crowdsourcing data paradigm take atmospheric science to a new level? A case study of the urban heat island of London quantified using Netatmo weather stations. Int. J. Climatol. 37, 3597–3605. doi:10.1002/joc.4940
Considine, E. M., Braun, D., Kamareddine, L., Nethery, R. C., and deSouza, P. (2022). Investigating use of low-cost sensors to increase accuracy and equity of real-time air quality information. doi:10.48550/arXiv.2205.03499
Curriero, F. C., Heiner, K. S., Samet, J. M., Zeger, S. L., Strug, L., and Patz, J. A. (2002). Temperature and mortality in 11 cities of the eastern United States. Am. J. Epidemiol. 155, 80–87. doi:10.1093/aje/155.1.80
deSouza, P., et al. (2021). On the distribution of low-cost PM 2.5 sensors in the US: demographic and air quality associations. J. Expo. Sci. Environ. Epidemiol. 31, 514–524. doi:10.1038/s41370-021-00328-2
deSouza, P., Barkjohn, K., Clements, A., Lee, J., Kahn, R., Crawford, B., et al. (2022). An analysis of degradation in low-cost particulate matter sensors. doi:10.48550/arXiv.2210.14759
deSouza, P. N. (2022). Key concerns and drivers of low-cost air quality sensor use. Sustainability 14, 584. doi:10.3390/su14010584
Feichtinger, M., de Wit, R., Goldenits, G., Kolejka, T., Hollósi, B., Žuvela-Aloise, M., et al. (2020). Case-study of neighborhood-scale summertime urban air temperature for the City of Vienna using crowd-sourced data. Urban Clim. 32, 100597. doi:10.1016/j.uclim.2020.100597
Flouris, A. D., Dinas, P. C., Ioannou, L. G., Nybo, L., Havenith, G., Kenny, G. P., et al. (2018). Workers’ health and productivity under occupational heat strain: a systematic review and meta-analysis. Lancet Planet. Health 2, e521–e531. doi:10.1016/S2542-5196(18)30237-7
Guo, Y., Gasparrini, A., Armstrong, B., Li, S., Tawatsupa, B., Tobias, A., et al. (2014). Global variation in the effects of ambient temperature on mortality: a systematic evaluation. Epidemiology 25, 781–789. doi:10.1097/EDE.0000000000000165
Ibsen, P. C., Crawford, B. R., Corro, L. M., Bagstad, K. J., McNellis, B. E., Jenerette, G. D., et al. (2024). Urban tree cover provides consistent mitigation of extreme heat in arid but not humid cities. Sustain. Cities Soc. 113, 105677. doi:10.1016/j.scs.2024.105677
Kennard, H., Oreszczyn, T., Mistry, M., and Hamilton, I. (2022). Population-weighted degree-days: the global shift between heating and cooling. Energy Build. 271, 112315. doi:10.1016/j.enbuild.2022.112315
Leichtle, T., Kühnl, M., Droin, A., Beck, C., Hiete, M., and Taubenböck, H. (2023). Quantifying urban heat exposure at fine scale - modeling outdoor and indoor temperatures using citizen science and VHR remote sensing. Urban Clim. 49, 101522. doi:10.1016/j.uclim.2023.101522
Liu, J., Varghese, B. M., Hansen, A., Xiang, J., Zhang, Y., Dear, K., et al. (2021). Is there an association between hot weather and poor mental health outcomes? A systematic review and meta-analysis. Environ. Int. 153, 106533. doi:10.1016/j.envint.2021.106533
Lõhmus, M. (2018). Possible biological mechanisms linking mental health and heat—a contemplative review. Int. J. Environ. Res. Public. Health 15, 1515. doi:10.3390/ijerph15071515
Lu, T., Bechle, M. J., Wan, Y., Presto, A. A., and Hankey, S. (2022). Using crowd-sourced low-cost sensors in a land use regression of PM2.5 in 6 US cities. Atmos. Health 15, 667–678. doi:10.1007/s11869-022-01162-7
Lu, T., Marshall, J. D., Zhang, W., Hystad, P., Kim, S.-Y., Bechle, M. J., et al. (2021). National empirical models of air pollution using microscale measures of the urban environment. Environ. Sci. Technol. 55, 15519–15530. doi:10.1021/acs.est.1c04047
Madrigano, J., Ito, K., Johnson, S., Kinney, P. L., and Matte, T. (2015a). A case-only study of vulnerability to heat wave–related mortality in New York city (2000–2011). Environ. Health Perspect. 123, 672–678. doi:10.1289/ehp.1408178
Madrigano, J., Jack, D., Anderson, G. B., Bell, M. L., and Kinney, P. L. (2015b). Temperature, ozone, and mortality in urban and non-urban counties in the northeastern United States. Environ. Health 14, 3. doi:10.1186/1476-069X-14-3
Meier, F., Fenner, D., Grassmann, T., Otto, M., and Scherer, D. (2017). Crowdsourcing air temperature from citizen weather stations for urban climate research. Urban Clim. 19, 170–191. doi:10.1016/j.uclim.2017.01.006
Murage, P., Hajat, S., and Kovats, R. S. (2017). Effect of night-time temperatures on cause and age-specific mortality in London. Environ. Epidemiol. Phila. Pa 1, e005. doi:10.1097/EE9.0000000000000005
Nakamura, R., and Mahrt, L. (2005). Air temperature measurement errors in naturally ventilated radiation shields. J. Atmos. Ocean. Technol. 22, 1046–1058. doi:10.1175/JTECH1762.1
Potgieter, J., Nazarian, N., Lipson, M. J., Hart, M. A., Ulpiani, G., Morrison, W., et al. (2021). Combining high-resolution land use data with crowdsourced air temperature to investigate intra-urban microclimate. Front. Environ. Sci. 9. doi:10.3389/fenvs.2021.720323
Quinn, A., Kinney, P., and Shaman, J. (2017). Predictors of summertime heat index levels in New York City apartments. Indoor Air 27, 840–851. doi:10.1111/ina.12367
Romitti, Y., Sue Wing, I., Spangler, K. R., and Wellenius, G. A. (2022). Inequality in the availability of residential air conditioning across 115 US metropolitan areas. PNAS Nexus 1, pgac210. doi:10.1093/pnasnexus/pgac210
Rowland, S. T., Boehme, A. K., Rush, J., Just, A. C., and Kioumourtzoglou, M.-A. (2020). Can ultra short-term changes in ambient temperature trigger myocardial infarction? Environ. Int. 143, 105910. doi:10.1016/j.envint.2020.105910
Rowland, S. T., Chillrud, L. G., Boehme, A. K., Wilson, A., Rush, J., Just, A. C., et al. (2022). Can weather help explain “why now?”: the potential role of hourly temperature as a stroke trigger. Environ. Res. 207, 112229. doi:10.1016/j.envres.2021.112229
Shearston, J. A., Rowland, S. T., Butt, T., Chillrud, S. N., Casey, J. A., Edmondson, D., et al. (2023). Can traffic-related air pollution trigger myocardial infarction within a few hours of exposure? Identifying hourly hazard periods. Environ. Int. 178, 108086. doi:10.1016/j.envint.2023.108086
Son, J.-Y., Liu, J. C., and Bell, M. L. (2019). Temperature-related mortality: a systematic review and investigation of effect modifiers. Environ. Res. Lett. 14, 073004. doi:10.1088/1748-9326/ab1cdb
Spangler, K. R., Weinberger, K. R., and Wellenius, G. A. (2019). Suitability of gridded climate datasets for use in environmental epidemiology. J. Expo. Sci. Environ. Epidemiol. 29, 777–789. doi:10.1038/s41370-018-0105-2
Stewart, I. D., and Oke, T. R. (2012). Local climate zones for urban temperature studies. Bull. Am. Meteorol. Soc. 93, 1879–1900. doi:10.1175/bams-d-11-00019.1
Terando, A. J., Youngsteadt, E., Meineke, E. K., and Prado, S. G. (2017). Ad hoc instrumentation methods in ecological studies produce highly biased temperature measurements. Ecol. Evol. 7, 9890–9904. doi:10.1002/ece3.3499
Thompson, R., Hornigold, R., Page, L., and Waite, T. (2018). Associations between high ambient temperatures and heat waves with mental health outcomes: a systematic review. Public Health 161, 171–191. doi:10.1016/j.puhe.2018.06.008
Velikou, K., Lazoglou, G., Tolika, K., and Anagnostopoulou, C. (2022). Reliability of the ERA5 in replicating mean and extreme temperatures across Europe. Water 14, 543. doi:10.3390/w14040543
Venter, Z. S., Brousse, O., Esau, I., and Meier, F. (2020). Hyperlocal mapping of urban air temperature using remote sensing and crowdsourced weather data. Remote Sens. Environ. 242, 111791. doi:10.1016/j.rse.2020.111791
Keywords: temperature, citizen science, sensor degradation, purpleair, Epidemiology
Citation: deSouza P, Ibsen PC, Westervelt DM, Kahn R, Zaitchik BF and Kinney PL (2025) A nationwide evaluation of crowd-sourced ambient temperature data. Front. Environ. Sci. 13:1527855. doi: 10.3389/fenvs.2025.1527855
Received: 13 November 2024; Accepted: 04 March 2025;
Published: 08 April 2025.
Edited by:
James Kevin Summers, Office of Research and Development, United StatesReviewed by:
Tobias Leichtle, German Aerospace Center (DLR), GermanyCopyright © 2025 deSouza, Ibsen, Westervelt, Kahn, Zaitchik and Kinney. This is an open-access article distributed under the terms of the Creative Commons Attribution License (CC BY). The use, distribution or reproduction in other forums is permitted, provided the original author(s) and the copyright owner(s) are credited and that the original publication in this journal is cited, in accordance with accepted academic practice. No use, distribution or reproduction is permitted which does not comply with these terms.
*Correspondence: Priyanka deSouza, cHJpeWFua2FkZXNvdXphQGdtYWlsLmNvbQ==
Disclaimer: All claims expressed in this article are solely those of the authors and do not necessarily represent those of their affiliated organizations, or those of the publisher, the editors and the reviewers. Any product that may be evaluated in this article or claim that may be made by its manufacturer is not guaranteed or endorsed by the publisher.
Research integrity at Frontiers
Learn more about the work of our research integrity team to safeguard the quality of each article we publish.