 Xiaoyan Wang
 Jinjuan Gao
94% of researchers rate our articles as excellent or good
Learn more about the work of our research integrity team to safeguard the quality of each article we publish.
Find out more
ORIGINAL RESEARCH article
Front. Environ. Sci., 21 February 2025
Sec. Water and Wastewater Management
Volume 13 - 2025 | https://doi.org/10.3389/fenvs.2025.1524894
Ecological civilization construction is an important way to achieve sustainable development in China. To reconcile the contradictions between water resources and rapid economic growth in China, it is essential to establish a scientific and rational evaluation index system for water resources carrying capacity (WRCC) based on the concept of ecological civilization. This study first delves into the connotation of WRCC and constructs a theoretical framework for the WRCC evaluation index system under the guidance of ecological civilization. Then, correlation analysis and information contribution rate analysis are employed to optimize the index system. Finally, a comprehensive and representative evaluation index system for WRCC is formed. Taking the Henan section of the Yellow River Basin as an example, the results are as follows: (1) A WRCC evaluation index system with 4 target layers, 10 criterion layers, and 43 indicator layers is established; (2) The WRCC in the study area exhibits a general upward trend; (3) Key obstacles to WRCC development include water resources per capita (X2), precipitation (X1), groundwater resources per unit area (X3), ecological water use rate (X19) and forest coverage rate (X20). Future efforts should prioritize mitigating water resource pressure and enhancing ecological environment protection. This study provides a reference for establishing an effective WRCC evaluation index system and holds significant practical implications for guiding the sustainable development of regional water resources.
With the rapid economic growth and urbanization in China, human exploitation of natural resources has reached an unprecedented level, leading to socio-environmental problems such as resource scarcity and environmental pollution (Dong et al., 2014; Li et al., 2017). These issues pose a serious threat to public health and sustainable societal development (Salehi, 2022). To achieve the sustainable development goals and to reconcile the contradictions among resource utilization, environmental protection and socioeconomic development, China has introduced the concept of ecological civilization within the framework of sustainable development. Subsequently, during the 18th National Congress of the Communist Party of China (CPC), considerable emphasis was placed on advancing ecological civilization construction, fully highlighting its importance, necessity and urgency. The report of the 18th National Congress also outlined the overall requirements for vigorously promoting ecological civilization initiatives by integrating them into all aspects and the whole processes of economic, political, cultural and social development.
As the principles of environmental protection and sustainable development have become firmly established in public consciousness, the construction of ecological civilization has emerged as a shared mission and objective for all nations. Currently, examples of ecological civilization construction can be observed both domestically and internationally. For example, the city of Erfurt in Germany serves as a prime example of a circular economy industrial park in Europe. Adhering to the principles of resource recycling and environmental sustainability, the city has established multiple circular economy industrial parks. Within these parks, through the establishment of industrial chains and resource-sharing mechanisms, waste reduction, resource utilization, and harmless treatment have been successfully realized. Beijing, the capital of China, has achieved significant success in ecological city planning by enforcing stringent environmental protection regulations and implementing green development strategies, effectively integrating environmental governance with urban development. Therefore, the concept of ecological civilization, which is capable of addressing the complex challenges in China’s development process, can be a viable pathway to achieve sustainable development (Gu et al., 2013; Xue et al., 2023).
To achieve efficient and sustainable economic growth, China’s ecological civilization construction should strictly adhere to the top line of resource utilization, the bottom line of environmental quality and the red line of ecological protection. Therefore, it is imperative to restrict various development activities within the carrying capacity of resources and the environment (CPC Central Committee and State Council, 2015). The core of ecological civilization construction is to build a resource-saving and environment-friendly society based on the carrying capacity of resources and the environment, with the goals of realizing sustainable development governed by the objective laws of nature. Water resources carrying capacity (WRCC), as a specific area within resource and environment carrying capacity research, plays an essential role in advancing ecological civilization initiatives (Wang and Hu, 2018). In 2013, the Ministry of Water Resources emphasized that developing water ecological civilization is not only a crucial component but also a fundamental guarantee of ecological civilization. Furthermore, it serves as a significant initiative aimed at fostering human-water harmony and promoting the construction of ecological civilization (Ministry of Water Resources, 2013). At the same time, the Ministry of Water Resources clarified the core position of water ecological civilization construction and proposed to integrate the concept of ecological civilization into all aspects of the development, utilization, allocation and protection of water resources.
WRCC is a crucial metric for assessing the coordinated development of society, economy and ecology as supported by regional water resources (Chen et al., 2023; Chen et al., 2022). The concept of WRCC was first introduced by the Xinjiang Water Resources Soft Science Research Group in 1989 and has attracted significant attention and discussion among scholars. Due to the different understandings of scholars, a unified concept of WRCC has not yet been formed. Currently, three predominant interpretations are widely used based on the connotations of the WRCC, namely, the maximum capacity of water resources for development, the maximum number of people it can support and the maximum scale or capacity for supporting economic and social development (Magri and Berezowska-Azzag, 2019; Naimi Ait-Aoudia and Berezowska-Azzag, 2016; Wang Y. F. et al., 2022). Despite these differing interpretations, it is important to note that WRCC represents a complex integrated system encompassing both natural and social dimensions. This complexity allows it to reflect the relationship between water resources and environmental conditions pertinent to human activities.
A scientific and reasonable evaluation index system is essential for accurately assessing the WRCC (Wang et al., 2019; Zuo et al., 2021). The constructed WRCC evaluation index system should not only reflect the current situation of regional water resources and ecological environment, but also determine whether human social and economic activities are within the carrying capacity of regional resources and environment. Currently, the construction of the WRCC evaluation index system primarily relies on a certain theoretical framework, followed by the selection of representative indicators. For example, Liao et al. (2020) developed a WRCC evaluation index system based on the carrier and load theory by selecting 33 indexes to assess the WRCC of 31 provinces in China. Fu et al. (2020) established an evaluation index system of resources and environmental carrying capacity comprising 26 indicators by using the pressure-state-response (PSR) model to conduct a comprehensive analysis of the Haihe River Basin. Bai et al. (2022) selected 15 evaluation indexes based on the support and pressure subsystems to evaluate the WRCC in Anhui province using both the cloud model and the coupling coordination degree model. Zhang et al. (2019) constructed an index system containing three subsystems of water resources, social economy and ecological environment with a total of 16 indicators and analyzed the changing trend of WRCC in Yuetang District.
Currently, there is a great number of research focused on the connotation interpretations and index system establishment of WRCC, which has significantly contributed to its development. However, further research is still needed considering that (1) during the new development period, WRCC has acquired richer connotations and new requirements due to its dynamic nature and timeliness; therefore, the establishment of the WRCC index system should incorporate the latest development concepts and requirements; (2) previous studies have seldom addressed the potential strong correlation between evaluation indicators and the relative importance of information contained within those indicators, which may reduce the accuracy of the evaluation results. Therefore, the primary objectives and contributions of this study are as follows: (1) to integrate the concept of ecological civilization throughout the construction of the WRCC evaluation index system, ensuring its dynamism and timeliness; (2) to optimize the evaluation index system by conducting correlation analysis and information contribution rate analysis, thereby eliminating redundant indicators and improving the system’s efficiency. This study offers theoretical guidance for developing a carrying capacity index system and holds significant practical implications for promoting regional sustainable development.
Based on the existing WRCC research theory, this study establishes a comprehensive evaluation index system stemming from the concept of ecological civilization and closely combining with the specific application of system theory within the domain of water resources. This system has great theoretical significance and effectively reflects the coordinated development of regional water resources, ecological environment and social economy. It provides both a theoretical framework and practical basis for the scientific planning and management of regional water resources. Specifically, the construction of the WRCC evaluation index system includes three main components: preliminary construction based on the concept of ecological civilization, screening of the evaluation indicators and final determination of the evaluation index system. The specific process is shown in Figure 1 below.
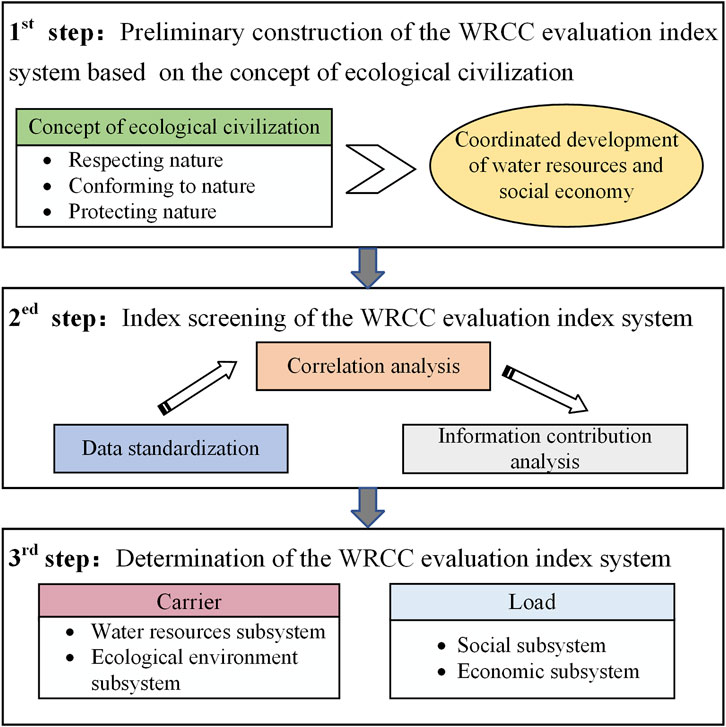
Figure 1. Construction steps of the WRCC evaluation index system.
Since the evaluation indicators are featured in different attributes and magnitudes, they are not suitable for direct computational analysis (Gao et al., 2019; Peng and Deng, 2020; Zhang et al., 2014). Therefore, it is necessary to first standardize the original indicator data before conducting the analysis. Generally speaking, a larger original data value that exerts a stronger positive effect is classified as a positive indicator, whereas a smaller original data value with a stronger positive effect is categorized as a negative indicator. The standardization formulas for both the positive and negative indicators are shown in Equations 1, 2, respectively (Wang et al., 2021).
For positive indicator:
for negative indicator:
where yij denotes the standardized value of xij; xij denotes the jth indicator of the ith evaluation object; and
Correlation analysis involves the examination of two or more variables that exhibit correlation, primarily aimed at assessing the degree of correlation between these variables (Zhou et al., 2015). When constructing an evaluation index system, consideration should be given to the potential strong correlations among the selected evaluation indicators, which may lead to the duplication of indicator information and increase the complexity of the evaluation process. Therefore, it is necessary to conduct a correlation analysis in constructing an evaluation index system to identify and eliminate indicators that demonstrate multicollinearity and redundancy. In this study, correlation analysis is conducted by calculating the Pearson correlation coefficient using Equation 3 (Bermudez-Edo et al., 2018).
where r is the correlation coefficient between index x and index y; n is the total number of indicator samples;
To construct a scientific and representative WRCC evaluation index system, the information contribution rate method is employed to further optimize the evaluation index system. This approach quantifies the proportion of information that each key factor contributes relative to the total information in the original indicator set. Specifically, it assesses how much of the original indicator set’s information can be explained by each individual indicator. A higher information contribution rate indicates a greater explanatory power regarding the original indicator set. Therefore, indicators with a high information contribution rate should be retained in the screening process. The index screening method based on the information contribution rate can overcome the limitations of the factor analysis method by providing a comprehensive reflection of the information level of the evaluation indicators, rather than solely relying on a factor load of the index to explain the original index set. The specific calculation steps of this method are as follows (Chen H. H. et al., 2020).
The information contribution rate analysis method is derived from factor analysis. Therefore, it is essential to conduct the Kaiser-Meyer-Olkin (KMO) test and Bartlett sphericity test on the indicator data to ensure the structural validity of the indicator system. It is generally accepted that the applicability test is passed when the KMO statistic exceeds 0.5 and the significance probability of the Bartlett’s sphericity test statistic is less than 0.05.
Principal component analysis is utilized to extract key factors that can effectively capture all the information contained in the original indicator set. In this study, key factors with eigenvalues exceeding 1 are extracted, and those with a cumulative variance contribution rate surpassing 70% are employed to represent all the information contained within the original indicator set. The mathematical computations for determining the eigenvalues of the indicator correlation matrix and calculating the cumulative variance contribution rate are detailed in Equations 4, 5, respectively.
where X is the normalized index matrix; XT is the transpose of the matrix X;
where Vp is the cumulative variance contribution rate of the p factors;
The factor load matrix is formulated using the extracted key factors, and its calculation method is outlined in Equation 6.
where A is the factor load matrix;
The indicator information contribution rate, which represents the interpretation proportion of the indicator to the original indicator set information, is calculated by Equation 7.
where
The relative importance ranking of each indicator can be determined by the magnitude of its information contribution rate. To ensure that the selected indicators adequately represent all the information contained within the original indicator set, the cumulative information contribution rate is introduced to further elucidate the proportion of information contributed by these indicators. The calculation method for determining the cumulative information contribution rate is presented in Equation 8.
where
If the cumulative information contribution rate
The retained indicators after screening are X1, X2, X3, … … , and Xk, with corresponding information contribution rates of I1, I2, I3, … … , and Ik. The weights of the indicators Xi (
This study utilizes an improved technique for order preference by similarity to ideal solution (TOPSIS) and gray correlation analysis model to accurately evaluate the WRCC and subsystem carrying capacity. The proposed model improves the TOPSIS method by assigning weights to the evaluation indicators and measures the dynamic development trend of the evaluation object through coupled gray correlation analysis. For detailed calculations, please refer to our previous research findings (Wang X. Y. et al., 2023). The values of the WRCC and subsystem carrying capacity range from 0 to 1, with a higher value indicating stronger carrying capacity. As WRCC serves as a characterization of relative carrying capacity, it can be used not only for comparing the carrying capacity among different subsystems but also for analyzing temporal trends in carrying capacity over time.
The obstacle degree model is utilized in this study to identify the main obstacle factors hindering the improvement of WRCC. The indicators involved in the obstacle degree model primarily encompass factor contribution degree, indicator deviation degree and obstacle degree (Chen et al., 2021). The factor contribution degree signifies the weight of an individual indicator relative to the total target value; the indicator deviation degree represents the disparity between an individual indicator and the target value; whereas the obstacle degree denotes the impact level of a single indicator on the research object. Typically, the main obstacle factors are determined based on the magnitude of the obstacle degree, as detailed in Equation 10 (Wang X. Y. et al., 2022):
where Pi denotes the index obstacle degree; Fi denotes the factor contribution degree, i.e., the weight of the ith index; Si denotes the index deviation degree, Si = 1 - Xi; and Xi denotes the standardized index value.
The Henan section of the Yellow River Basin, situated in the mid-lower reaches of the Yellow River Basin, comprises 10 municipal administrative districts within Henan Province, including Sanmenxia, Luoyang, Jiyuan, Jiaozuo, Zhengzhou, Xinxiang, Kaifeng, Hebi, Anyang and Puyang (Figure 2). Relying on the national strategy of the Yellow River and the construction of the Central Plains City Cluster, this area serves as a traditional agricultural region and a key grain production hub in China. The sustainable water resource management has becoming increasingly critical in this area to facilitate high-quality economic and social development while ensuring ecological security and promoting sustainable development (Wang S. S. et al., 2023). Consequently, due to its limited and uneven spatial-temporal distribution of water resources, the Henan section of the Yellow River Basin is selected as the focal point for relevant research studies.
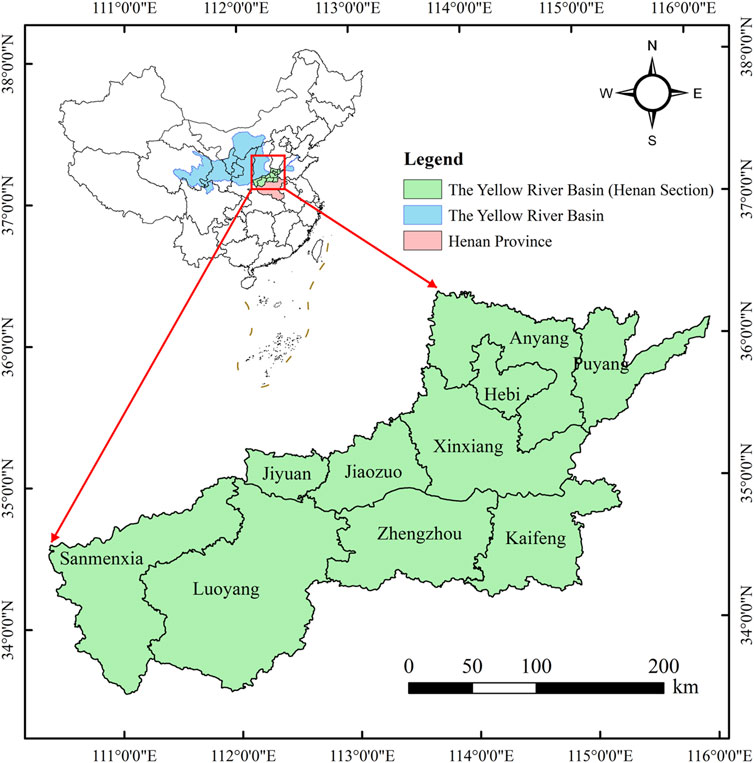
Figure 2. Geographical location of the study area.
The social, economic, water resources and ecological environmental statistics in the Henan section of the Yellow River Basin from 2010 to 2022 are used for this study. Statistics are primarily sourced from the Henan Statistical Yearbook (2010-2022), Henan Water Resources Bulletin (2010-2022), China Urban Statistical Yearbook (2010-2021), Henan Ecological and Environmental Status Bulletin (2009-2020), National Economic and Social Development Statistical Bulletin, as well as relevant statistics from each city within this region.
The concept of ecological civilization presents higher demands on the models of economic and social development, aiming to realize the harmonious coexistence between human beings and nature through respecting, adapting to and protecting nature, rather than simply focusing on resource conservation and environmental protection. Therefore, the construction of a WRCC index system based on the concept of ecological civilization seeks to realize the harmonious development of human beings and nature by addressing the inherent contradiction between socioeconomic growth and resource-environmental protection. This means that the constructed WRCC index system not only reflects the regional water resources level and ecological environment condition but also assesses whether human activities remain within the carrying capacity of regional resources and environment. The WRCC represents the water resources conditions and environmental quality level related to human activities; thus, it is imperative to incorporate human activities into discussions regarding carrying capacity. Therefore, the construction of the WRCC index system should focus on four aspects: water resources support capacity, ecological environment level, social and economic development status. In addition, the requirements of the “three red lines” of China’s strictest water resource management policies should also be considered when constructing the WRCC index system, with a focus on regional water resources utilization and environmental quality evaluation.
Against the backdrop of the concept of ecological civilization, this study initially identifies the four target layers of the WRCC evaluation index system, including the water resources, social, economic and ecological environment subsystems. Subsequently, through a systematic analysis of each target layer and in conjunction with the relevant contents of the “three red lines” of China’s strictest water resource management policies, the criteria layers including water resources endowment, water resources development and utilization efficiency, water use efficiency and ecological and environmental pressure are established. Finally, representative evaluation indicators are selected based on the principles of scientific, systematic, dynamic, feasible and comparable with existing research results at home and abroad. Overall, the WRCC evaluation index system preliminarily constructed in this study consists of 4 target layers, 10 criterion layers and 43 index layers.
The water resources subsystem is the primary focus of the WRCC research. As a fundamental natural resource essential for human survival and social production activities, water resources play a crucial role in supporting regional socioeconomic development and ecological environmental protection (Chen L. et al., 2020; Kummu et al., 2016). The water resources subsystem reflects the ability of regional water resources to support human activities, that the extent of exploitation and utilization of regional water resources as well as the level of sustainable utilization are greatly determined by the quality and quantity of regional water resources (Yang et al., 2021). Therefore, in this study, water resource endowment, water production and supply capacity and water utilization status are used as criterion layers to measure the carrying capacity of regional water resources. Based on the existing research results, 5 indicators are chosen to represent the regional water resources endowment, namely, precipitation, total water resources, water resources per capita, surface water resources per unit area and groundwater resources per unit area. Then, 3 indicators are selected to reflect the water production and supply capacity, namely, water production modulus, water production coefficient and water supply modulus. Furthermore, 3 indicators are identified to depict the water utilization status, namely, utilization rate of water resources, utilization rate of surface water resources and utilization rate of groundwater resources. In brief, the water resources subsystem consists of 3 criterion layers and 11 index layers.
The social subsystem is the main object of WRCC research, with the development of regional society being intricately linked to the water resources system (Zhang and Dong, 2022). Given that water resources are indispensable to the daily life of the residents, the impact of the social dimension on the water resources system primarily stems from the population (Yang et al., 2019). Population serves as the core of the social subsystem; both its structure and size, along with residents’ lifestyle and living standards, directly affect the sustainable utilization of regional water resources (Sinding, 2009). Therefore, this study utilizes regional population composition and domestic water use level as the criterion layers to assess the pressure exerted by human social activities on the water resources system. Specifically, 5 indicators, including population density, urbanization rate, Permanent population, population growth rate and the number of students enrolled in higher education, are chosen to represent the population composition of the region. Another 5 indicators, including per capita domestic water use, per capita water use, proportion of domestic water, urban water access rate and the per capita retail sales of consumer goods, are selected to reflect the domestic water use capacity of regional residents. In general, the social subsystem is composed of 2 criterion layers and 10 index layers.
The economic subsystem is an important link in the WRCC evaluation. Regional economic development is closely tied to water resource support, and both the development scale and industrial structure can directly influence the water resource demand (Zhang et al., 2019). Higher levels of economic development are associated with increased levels of water resources reuse, water resources protection and water pollution treatment. The development of the economic subsystem relies heavily on both the economic development scale and the water use efficiency within economic activities (Zhang et al., 2016). The economic development scale can be assessed by 7 indicators: GDP, proportion of secondary industry, proportion of tertiary industry, GDP per capita, per capita disposable income of urban residents, industrial water use ratio and R&D expenditure; while the water use efficiency of economic development is evaluated by 5 indicators: farmland irrigation water per mu, water use per 104 yuan industrial added value, water use per 104 yuan GDP, water consumption rate and irrigation rate of cultivated land. Overall, the economic subsystem is comprised of 2 criterion layers and 12 index layers.
The ecological environment subsystem is the basis of human survival and development, closely intertwined with the social and economic progress, as well as the water resources and water environment of a given region (Kilkis, 2016). There is an interdependent relationship and mutual constraints between the regional ecological environment system and the water resources system. On the one hand, the ecological environment system plays a crucial role in water and soil conservation, providing strong support for regional WRCC; on the other hand, the expansion of urbanization, occupation of arable land and discharge of pollutants from agriculture, industry and life due to rapid socioeconomic development have exerted significant pressure on the ecological environment, thereby restricting the development of the WRCC. Therefore, this study selects the ecological environment status, ecological environmental management level and ecological environment pressure as the criterion layer to evaluate the ecological environment subsystem. To assess the regional ecological environment status, 5 indicators, including ecological water use rate, forest coverage rate, proportion of cultivated land, green coverage rate and per capita green park area are selected. Additionally, 2 indicators, namely, sewage treatment rate and harmless treatment rate of household garbage, are chosen to demonstrate the regional ecological environment management level. Furthermore, 3 indicators, including wastewater discharge, sewage discharge per 104 yuan GDP and fertilizer application amount are used to reflect the regional ecological environment pressure. Briefly, the ecological environment subsystem comprises a total of 3 criterion layers and 10 indicator layers.
The evaluation index data for the WRCC across 10 cities in the Henan section of the Yellow River Basin are standardized using the data standardization method. Subsequently, Pearson bivariate correlation analysis is conducted for each subsystem of WRCC, eliminating the indexes with multicollinearity within each subsystem based on the standardized index data. The principles for screening the evaluation indicators based on the correlation coefficient are as follows: (1) if the absolute value of the correlation coefficient between an indicator and multiple other indicators exceeds 0.8, those latter indicators are generally removed; (2) if the absolute value of the correlation coefficient between an indicator and other individual indicators does not exceed 0.8 but approaches a certain value, the former is considered for removal; (3) if the absolute value of the correlation coefficient between the two indicators exceeds 0.8, the indicator frequently used in the relevant reference is retained. Following these principles for indicator screening, a total of 9 WRCC indicators are deleted by analyzing their correlations within each WRCC subsystem, as shown in Table 1.
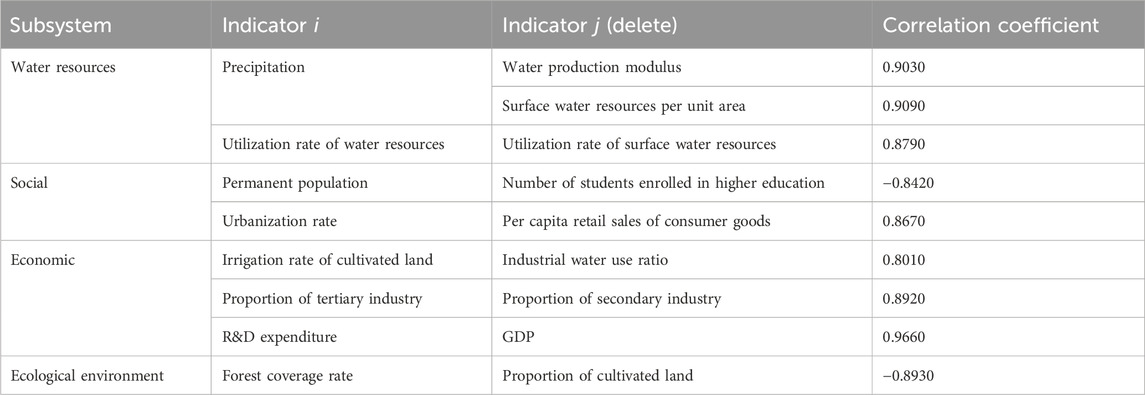
Table 1. Indicator screening results based on the correlation coefficient analysis.
In the analysis of information contribution rate, it is essential to conduct the KMO and Bartlett tests on each indicator data to confirm its validity. The results of the KMO and Bartlett tests for each subsystem indicator, following screening through correlation analysis, are shown in Table 2. It can be observed that the KMO values for all WRCC subsystems exceeds 0.5, while the significance probability of the Bartlett test statistical value is less than 0.05. This indicates that the screened evaluation indicators demonstrate structural validity and are suitable for factor analysis.
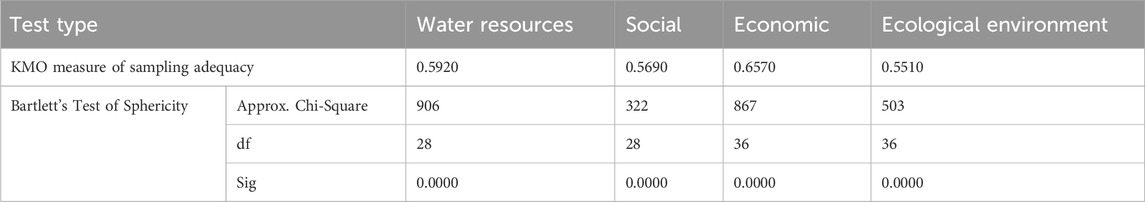
Table 2. KMO and Bartlett’s Test for WRCC subsystem.
The cumulative information contribution rate is determined by calculating the information contribution rate of each indicator and arranging them in descending order. Taking the water resources subsystem as an example, the cumulative information contribution rate for each indicator is shown in Table 3. In accordance with relevant research and considering the specific requirements of this study, a threshold value of 0.7 is set for R0. As a result, the top 6 indicators with the highest cumulative information contribution rate are retained for analysis within the water resources subsystem, and their weights are calculated using the weight calculation method.
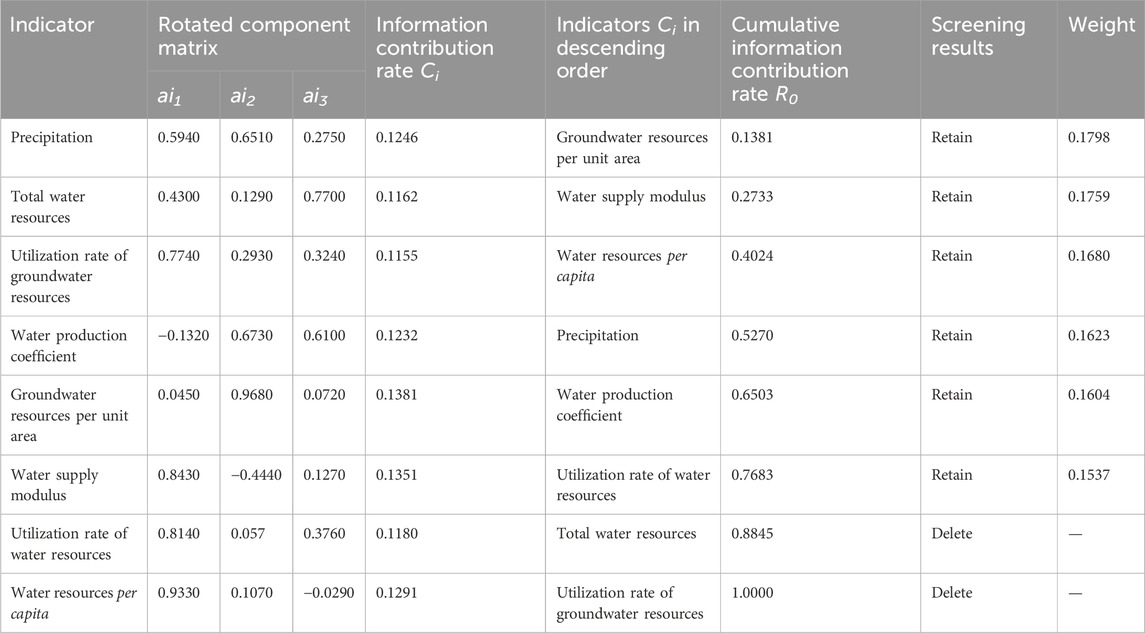
Table 3. Indicator screening and weighting of water resources subsystem.
Similarly, the indicators that need to be retained or eliminated from the other three subsystems are identified through the aforementioned calculation method. The weights of each retained indicator are also calculated and assigned, as presented in Table 4. Overall, a total of 10 evaluation indicators are excluded based on the analysis of information contribution rate across the four subsystems, and there are 24 evaluation indicators are selected for further analysis.
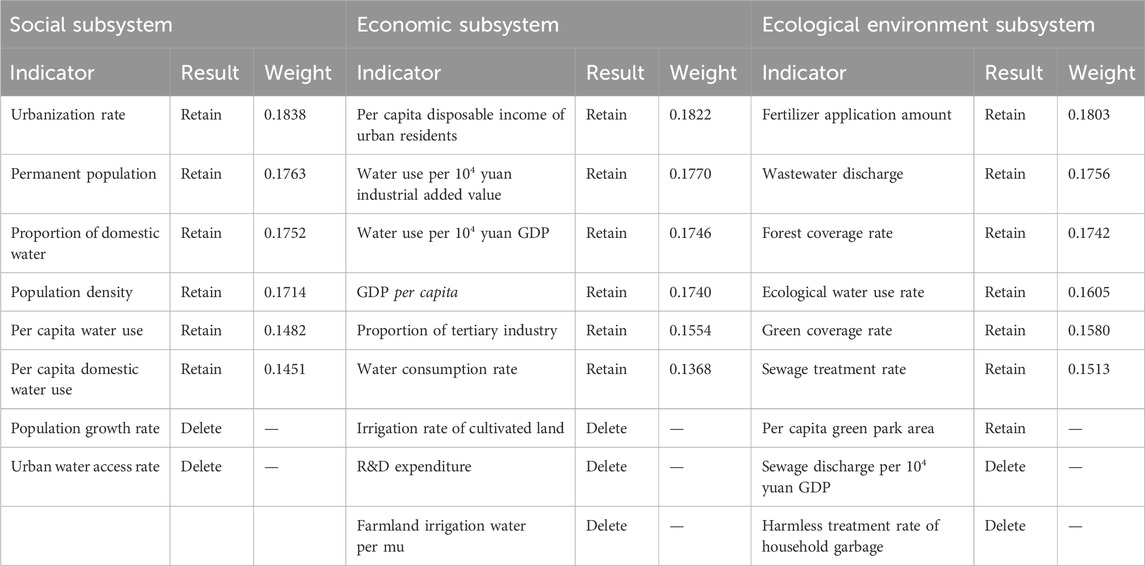
Table 4. Indicator screening and weighting of social, economic and ecological environment subsystems.
After conducting the correlation analysis and information contribution rate analysis on the initially constructed WRCC evaluation index system, a total of 19 evaluation indicators are eliminated. This study ultimately establishes a WRCC evaluation index system consisting of 4 target layers, 10 criterion layers and 24 index layers, as presented in Table 5. The four WRCC subsystems are considered equally important, with their weight values set at 0.25. Consequently, the final weights of the 24 indicators within the entire WRCC system can be determined by multiplying the index weights of each subsystem by 0.25 (Table 5).
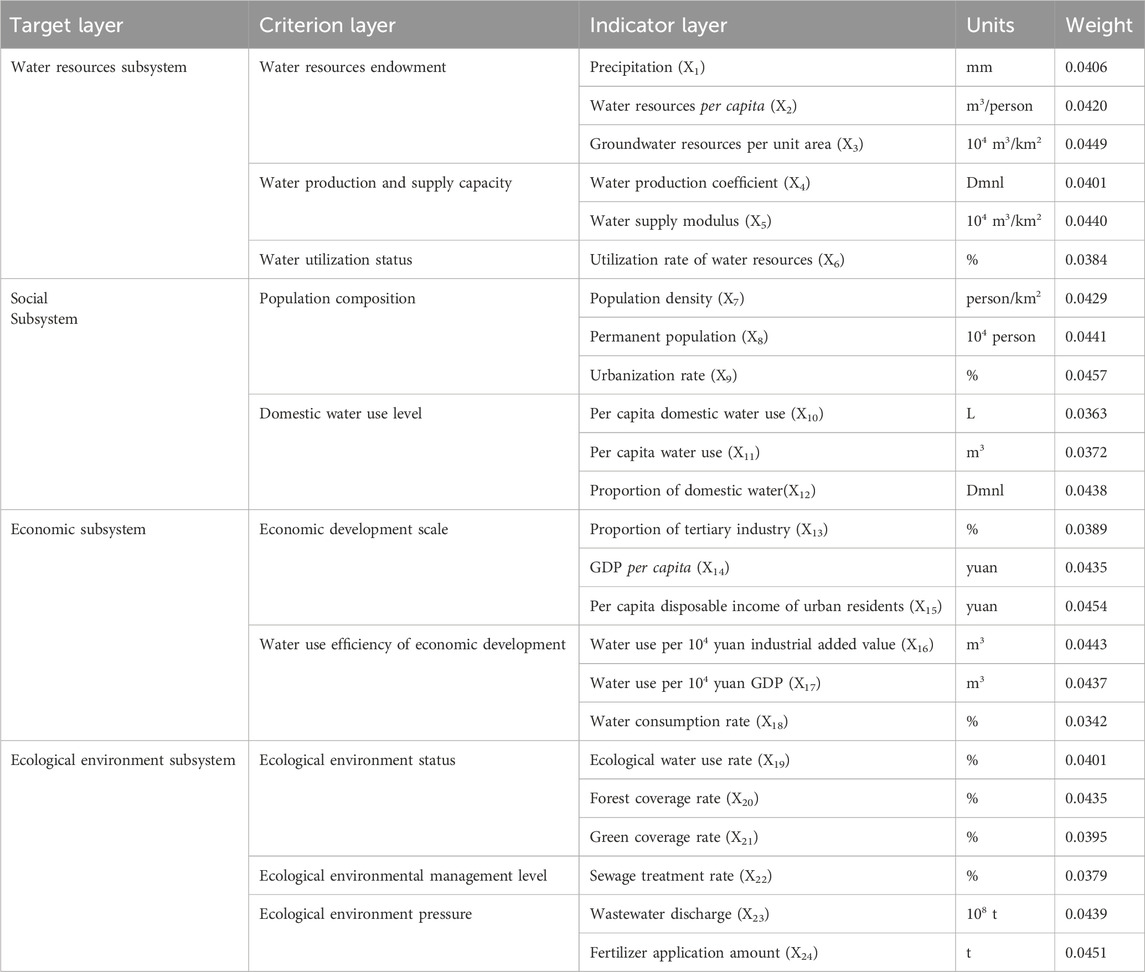
Table 5. Evaluation index system of WRCC.
The WRCC and subsystem carrying capacity of the Henan section of the Yellow River Basin are assessed using the WRCC evaluation index system and the evaluation model constructed in this study. As illustrated in Figure 3, a notable increase in WRCC is observed in the Henan section of the Yellow River Basin, rising from 0.47 in 2010 to 0.59 in 2022, with a growth rate of 25.53%. The significant improvement in WRCC is closely linked to the effective improvement in both the ecological environment and the high-quality economic development. In 2021, the State Council issued the Outline of the Plan for Ecological Protection and High-Quality Development of the Yellow River Basin, which further promotes the ecological protection and high-quality development of the Yellow River Basin to a new level. This progress indicates that under the concept of ecological protection and high-quality development in the Yellow River Basin, there have been initial achievements in both the protection and rational utilization of water resources.
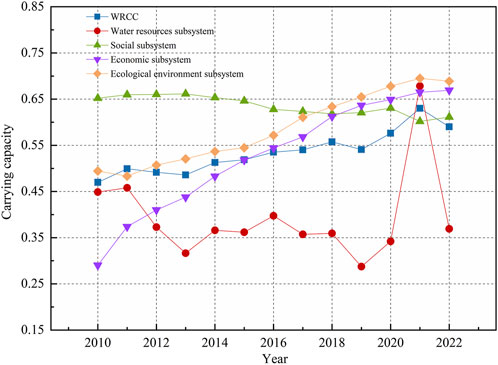
Figure 3. Changes of the WRCC and subsystem carrying capacity in the Henan section of the Yellow River Basin from 2010 to 2022.
From the perspective of subsystems, the water resources subsystem carrying capacity fluctuates significantly from 2010 to 2022, ranging between 0.29 and 0.68. This variation demonstrates the substantial impact of natural precipitation on the basin’s water resources status. Particularly in 2021, extreme precipitation events in Henan Province led to a notably higher water resources subsystem carrying capacity in this basin than other years. In contrast, the social subsystem carrying capacity exhibits a relatively minor variations, decreasing from 0.65 in 2010 to 0.61 in 2022 at a rate of 7.15%. This decline can primarily be attributed to the population growth and increased water consumption by residents. The economic subsystem carrying capacity and the ecological environment subsystem carrying capacity exhibit relatively consistent development trends, indicating a stable growth in both economy and ecological environment. However, it is worth noting that the economic subsystem carrying capacity experiences a significant increase, rising from 0.29 in 2010 to 0.67 in 2022, with a growth rate of 131.03%. This surge is largely due to the accelerated economic development within the basin over recent years and the continuous improvement of water consumption capacity. During this same period, the ecological environment subsystem carrying capacity grows from 0.49 to 0.69, at a rate of 40.82%, which underscores the ongoing enhancement of infrastructure in the Henan section of the Yellow River Basin and its notable improvement in sewage treatment capacity. Furthermore, with an increasing emphasis on the ecological environmental protection, a significant increasing trend is observed in both the ecological water use rate and the green coverage rate of built-up areas.
The obstacle degree model is utilized to identify the main obstacle factors in the WRCC evolution in the Henan section of the Yellow River Basin. Statistical analysis of the top 5 obstacle factors for 10 cities in this region is conducted, and the results are shown in Figure 4. The predominant obstacle factors influencing the WRCC improvement in the Henan section of the Yellow River Basin are water resources per capita (X2), precipitation (X1), groundwater resources per unit area (X3), ecological water use rate (X19) and forest coverage rate (X20), with frequencies of 9, 7, 7, 6 and 5, respectively. It is evident that these obstacle factors are predominantly concentrated within the water resources subsystem and ecological environment subsystem. Although there has been a noticeable increasing trend in overall WRCC for the basin in recent years, the development within the Yellow River basin is still facing with resource and environmental pressure such as water resources scarcity and a fragile ecological environment. In future development, it is imperative to prioritize the protection of water resources and the ecological environment.
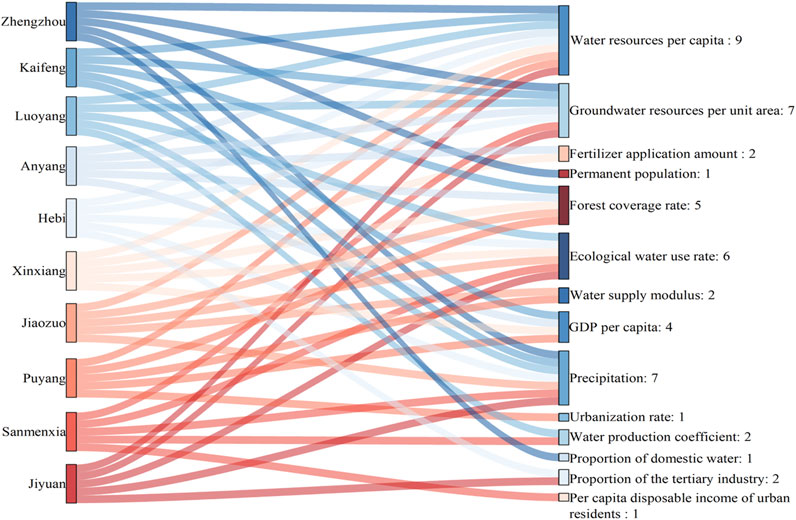
Figure 4. Main obstacle factors of WRCC development in the Henan section of the Yellow River Basin.
This study proposes a method for constructing an evaluation index system of the WRCC based on the concept of ecological civilization. This method fully considers the development concepts and requirements associated with ecological civilization, rendering the index system developed in this study both dynamic and time-effective. Specifically, during the construction of the index system, this study incorporates the requirements of the “three red lines” of China’s strictest water resource management policies. Consequently, indicators such as water resources development and utilization efficiency, socioeconomic water use levels and water pollution discharge are included. Although the study by Yang et al. (2019) considered indicators related to economic water use level and water pollution discharge, it overlooked crucial indicators such as water resource development and utilization efficiency, as well as domestic water use levels. Similarly, Zhang et al. (2019) also failed to incorporate these significant factors in their study. Furthermore, through conducting correlation and information contribution analysis, the construction process of the evaluation index system in this study is rendered more scientific and reasonable, thereby effectively reducing the redundancy of index information. For instance, Song et al. (2024) included both water resources and precipitation in the evaluation system of the water resources subsystem without conducting a rigorous screening and analysis of the indicators. This inclusion led to redundant information and unnecessarily complicated the computational process. The index system construction method employed in this study is both comprehensive and streamlined, effectively balancing the complexity of the WRCC system while ensuring the selection of representative evaluation indicators.
However, due to limitations in data acquisition, the selection of indicators in this study remains imperfect compared with existing relevant research. For instance, Zhang et al. (2018) included indicators such as river proportion worse than Grade V, seawater desalination volume and reclaimed water proportion in the assessment of resource and environmental carrying capacity. Hu et al. (2021) incorporated the guarantee rate of ecological water demand, as well as nitrogen and phosphorus pollutant discharge in the study of water environment carrying capacity. In future research, it is essential to implement appropriate measures to further improve these issues.
This study delves deeply into the connotation of WRCC based on the concept of ecological civilization and develops a preliminary WRCC evaluation index system centered around the coupled system of water resources, social, economic and ecological environment. Furthermore, correlation analysis and information contribution rate analysis are employed to screen and optimize the evaluation index system. This approach aims to construct a scientific and reasonable evaluation index system that can comprehensively reflect the current status of regional WRCC. Finally, using the constructed evaluation index system, an appropriate evaluation model is applied to determine the evolution trend of WRCC and identify its developmental weakness. This study plays a crucial role in guiding the sustainable utilization of regional water resources.
Taking the Henan section of the Yellow River Basin as the study area, the main findings are as follows: (1) Through a systematic analysis of the connotation of WRCC, 10 criterion layers and 43 indicator layers corresponding to the 4 target layers of the WRCC evaluation index system are initially determined. (2) By conducting the correlation analysis and information contribution rate analysis, a total of 19 indicators are removed, resulting in a final WRCC evaluation index system consisting of 4 target layers, 10 criterion layers and 24 index layers. (3) Empirical research indicates that the WRCC in the Henan section of the Yellow River Basin generally shows an increasing trend. The primary obstacle factors identified include water resources per capita (X2), precipitation (X1), groundwater resources per unit area (X3), ecological water use rate (X19) and forest coverage rate (X20).
Through the analysis and summary of this study, to further promote the WRCC in the Henan section of the Yellow River Basin, it is recommended that relevant government departments prioritize alleviating water resource pressure and enhancing ecological environment protection. Currently, the shortage of water resources per capita is the main obstacle factor restricting the improvement of the WRCC in the study area. To address this challenge, it is imperative to implement scientific and rational water resource management measures. This includes the optimal allocation of water resources, the establishment of water usage plans, and the enforcement of quantitative controls. A comprehensive water resource management system should be developed to ensure the sustainable utilization and protection of water resources. Furthermore, the ecological environment issue remains a significant constraint on the high-quality development of the study area. Future development should prioritize ecology and green growth by intensifying efforts in ecological restoration and protection, steadfastly promoting the development of green industries and circular economy, and fostering the sustainable utilization of ecosystems.
The datasets presented in this article are not readily available because Data will be available from the corresponding author upon reasonable request. Requests to access the datasets should be directed to SL, bGlzaHFAaWdzLWhhcy5jbg==.
XW: Formal Analysis, Methodology, Writing–original draft. JG: Validation, Writing–review and editing. HJ: Writing–review and editing, Supervision. SL: Writing–review and editing.
The author(s) declare that financial support was received for the research, authorship, and/or publication of this article. This work was supported by the Scientific and Technological Research Project of Henan Province (No. 242102320227), Joint Fund of Henan Province Science and Technology R&D Program (No. 235200810068), Scientific Research Start-up Funds of Henan Academy of Sciences (No. 241801093).
The authors declare that the research was conducted in the absence of any commercial or financial relationships that could be construed as a potential conflict of interest.
The author(s) declare that no Generative AI was used in the creation of this manuscript.
All claims expressed in this article are solely those of the authors and do not necessarily represent those of their affiliated organizations, or those of the publisher, the editors and the reviewers. Any product that may be evaluated in this article, or claim that may be made by its manufacturer, is not guaranteed or endorsed by the publisher.
Bai, X., Jin, J. L., Zhou, R. X., Wu, C., Zhou, Y., Zhang, L., et al. (2022). Coordination evaluation and obstacle factors recognition analysis of water resource spatial equilibrium system. Environ. Res. 210, 112913. doi:10.1016/j.envres.2022.112913
Bermudez-Edo, M., Barnaghi, P., and Moessner, K. (2018). Analysing real world data streams with spatio-temporal correlations: entropy vs. Pearson correlation. Constr. 88, 87–100. doi:10.1016/j.autcon.2017.12.036
Chen, H. H., Wang, H., and Sui, X. (2020a). Evaluation indicator screening and weighting method based on information contribution ratio. Sci. Res. Manag. 41 (8), 240–247. doi:10.19571/j.cnki.1000-2995.2020.08.025
Chen, L., Huang, K. D., Zhou, J. Z., Duan, H. F., Zhang, J., Wang, D., et al. (2020b). Multiple-risk assessment of water supply, hydropower and environment nexus in the water resources system. J. Clean. Prod. 268, 122057. doi:10.1016/j.jclepro.2020.122057
Chen, Q. Y., Zhu, M. T., Zhang, C. J., and Zhou, Q. (2023). The driving effect of spatial-temporal difference of water resources carrying capacity in the Yellow River Basin. J. Clean. Prod. 388, 135709. doi:10.1016/j.jclepro.2022.135709
Chen, S. Y., He, Y. H., Tan, Q., Hu, K., Zhang, T., and Zhang, S. (2022). Comprehensive assessment of water environmental carrying capacity for sustainable watershed development. J. Environ. Manag. 303, 114065. doi:10.1016/j.jenvman.2021.114065
Chen, Y. Z., Lu, H. W., Li, J., Yang, Y., and Xia, J. (2021). Multi-criteria decision making and fairness evaluation of water ecological carrying capacity for inter-regional green development. Environ. Sci. Pollut. R. 28 (6), 6470–6490. doi:10.1007/s11356-020-10946-2
CPC Central Committee and State Council (2015). Opinions on accelerating the construction of ecological civilization.
Dong, H. J., Geng, Y., Fujita, T., Fujii, M., Hao, D., and Yu, X. (2014). Uncovering regional disparity of China's water footprint and inter-provincial virtual water flows. Sci. Total Environ. 500-501, 120–130. doi:10.1016/j.scitotenv.2014.08.094
Fu, J. Y., Zang, C. F., and Zhang, J. M. (2020). Economic and resource and environmental carrying capacity trade-off analysis in the Haihe River basin in China. J. Clean. Prod. 270, 122271. doi:10.1016/j.jclepro.2020.122271
Gao, S., Sun, H. H., Zhao, L., Wang, R., Xu, M., and Cao, G. (2019). Dynamic assessment of island ecological environment sustainability under urbanization based on rough set, synthetic index and catastrophe progression analysis theories. Ocean. Coast. Manag. 178, 104790. doi:10.1016/j.ocecoaman.2019.04.017
Gu, S. Z., Hu, Y. J., and Zhou, H. (2013). Ecological cvilization construction: scientific connotation and basic paths. Resour. Sci. 35 (1), 2–13.
Hu, G. Z., Zeng, W. H., Yao, R., Xie, Y., and Liang, S. (2021). An integrated assessment system for the carrying capacity of the water environment based on system dynamics. J. Environ. Manag. 295, 113045. doi:10.1016/j.jenvman.2021.113045
Kilkis, S. (2016). Sustainable development of energy, water and environment systems index for Southeast European cities. J. Clean. Prod. 130, 222–234. doi:10.1016/j.jclepro.2015.07.121
Kummu, M., Guillaume, J. H. A., de Moel, H., Eisner, S., Flörke, M., Porkka, M., et al. (2016). The world’s road to water scarcity: shortage and stress in the 20th century and pathways towards sustainability. Sci. Rep. 6 (1), 38495. doi:10.1038/srep38495
Li, J. W., Liu, Z. F., He, C. C., Yue, H., and Gou, S. (2017). Water shortages raised a legitimate concern over the sustainable development of the drylands of northern China: evidence from the water stress index. Sci. Total Environ. 590-591, 739–750. doi:10.1016/j.scitotenv.2017.03.037
Liao, X., Ren, Y. T., Shen, L. Y., Shu, T., He, H., and Wang, J. (2020). A “carrier-load” perspective method for investigating regional water resource carrying capacity. J. Clean. Prod. 269, 122043. doi:10.1016/j.jclepro.2020.122043
Magri, A., and Berezowska-Azzag, E. (2019). New tool for assessing urban water carrying capacity (WCC) in the planning of development programs in the region of Oran, Algeria. Sustain. Cities Soc. 48, 101316. doi:10.1016/j.scs.2018.10.040
Ministry of Water Resources (2013). Opinions of the Ministry of water resources on accelerating the construction of water ecological civilization. Gazette Ministry Water Resour. People's Repub. China (1), 22–25.
Naimi Ait-Aoudia, M., and Berezowska-Azzag, E. (2016). Water resources carrying capacity assessment: the case of Algeria's capital city. Habitat Int. 58, 51–58. doi:10.1016/j.habitatint.2016.09.006
Peng, T., and Deng, H. (2020). Comprehensive evaluation on water resource carrying capacity based on DPESBR framework: a case study in Guiyang, southwest China. J. Clean. Prod. 268, 122235. doi:10.1016/j.jclepro.2020.122235
Salehi, M. (2022). Global water shortage and potable water safety; Today's concern and tomorrow's crisis. Environ. Int. 158, 106936. doi:10.1016/j.envint.2021.106936
Sinding, S. W. (2009). Population, poverty and economic development. Philosophical Trans. R. Soc. B-biological Sci. 364 (1532), 3023–3030. doi:10.1098/rstb.2009.0145
Song, Q. R., Wang, Z. C., and Wu, T. H. (2024). Risk analysis and assessment of water resource carrying capacity based on weighted gray model with improved entropy weighting method in the central plains region of China. Ecol. Indic. 160, 111907. doi:10.1016/j.ecolind.2024.111907
Wang, J. H., and Hu, P. (2018). The connotation, evaluation criteria and experience model of water ecological civilization construction in China. J. China Inst. Water Resour. Hydropower Res. 16 (5), 430–436. doi:10.13244/j.cnki.jiwhr.2018.05.011
Wang, S. S., Yang, R. J., Shi, S., Wang, A., Liu, T., and Yang, J. (2023a). Characteristics and influencing factors of the spatial and temporal variability of the coupled water-energy-food nexus in the Yellow River Basin in henan province. Sustainability 15 (18), 13977. doi:10.3390/su151813977
Wang, X. Y., Liu, L., and Zhang, S. L. (2021). Integrated model framework for the evaluation and prediction of the water environmental carrying capacity in the Guangdong-Hong Kong-Macao Greater Bay Area. Ecol. Indic. 130, 108083. doi:10.1016/j.ecolind.2021.108083
Wang, X. Y., Zhang, S. L., Tang, X. P., and Gao, C. (2022a). Research on water resources environmental carrying capacity (WRECC) based on support-pressure coupling theory: a case study of the Guangdong-Hong Kong-Macao Greater Bay Area. J. Environ. Manag. 320, 115805. doi:10.1016/j.jenvman.2022.115805
Wang, X. Y., Zhang, S. L., Tang, X. P., and Gao, C. (2023b). Spatiotemporal heterogeneity and driving mechanisms of water resources carrying capacity for sustainable development of Guangdong Province in China. J. Clean. Prod. 412, 137398. doi:10.1016/j.jclepro.2023.137398
Wang, Y. F., Sun, K., Li, L., Lei, Y., Wu, S., Wang, F., et al. (2022b). The optimal allocation and the evaluation of water resources carrying capacity in Shendong mining area. Res. Policy 77. doi:10.1016/j.resourpol.2022.102738
Wang, Y. X., Wang, Y., Su, X. L., Qi, L., and Liu, M. (2019). Evaluation of the comprehensive carrying capacity of interprovincial water resources in China and the spatial effect. J. Hydrol. 575, 794–809. doi:10.1016/j.jhydrol.2019.05.076
Xue, B., Han, B., Li, H. Q., Gou, X., Yang, H., Thomas, H., et al. (2023). Understanding ecological civilization in China: from political context to science. AMBIO 52 (12), 1895–1909. doi:10.1007/s13280-023-01897-2
Yang, G., Dong, Z. C., Feng, S. N., Li, B., Sun, Y., and Chen, M. (2021). Early warning of water resource carrying status in Nanjing City based on coordinated development index. J. Clean. Prod. 284, 124696. doi:10.1016/j.jclepro.2020.124696
Yang, Z. Y., Song, J. X., Cheng, D. D., Xia, J., Li, Q., and Ahamad, M. I. (2019). Comprehensive evaluation and scenario simulation for the water resources carrying capacity in Xi'an city, China. J. Environ. Manag. 230, 221–233. doi:10.1016/j.jenvman.2018.09.085
Zhang, B., Chen, Z. M., Zeng, L., and Qiao, H. (2016). Demand-driven water withdrawals by Chinese industry: a multi-regional input-output analysis. Front. Earth. Sci. 10 (1), 13–28. doi:10.1007/s11707-015-0505-8
Zhang, J., Zhang, C. L., Shi, W. L., and Fu, Y. (2019). Quantitative evaluation and optimized utilization of water resources-water environment carrying capacity based on nature-based solutions. J. Hydrol. 568, 96–107. doi:10.1016/j.jhydrol.2018.10.059
Zhang, J. T., and Dong, Z. C. (2022). Assessment of coupling coordination degree and water resources carrying capacity of Hebei Province (China) based on WRESP2D2P framework and GTWR approach. Sustain. Cities Soc. 82, 103862. doi:10.1016/j.scs.2022.103862
Zhang, M., Liu, Y. M., Wu, J., and Wang, T. (2018). Index system of urban resource and environment carrying capacity based on ecological civilization. Environ. Impact. Asses. 68, 90–97. doi:10.1016/j.eiar.2017.11.002
Zhang, Z., Lu, W. X., Zhao, Y., and Song, W. (2014). Development tendency analysis and evaluation of the water ecological carrying capacity in the Siping area of Jilin Province in China based on system dynamics and analytic hierarchy process. Ecol. Model. 275, 9–21. doi:10.1016/j.ecolmodel.2013.11.031
Zhou, Y., Zhang, Q., Singh, V. P., and Xiao, M. (2015). General correlation analysis: a new algorithm and application. Stoch. Env. Res. Risk A 29 (3), 665–677. doi:10.1007/s00477-014-0970-8
Keywords: water resources carrying capacity (WRCC), ecological civilization, evaluation index system, index screening, sustainable development
Citation: Wang X, Gao J, Jiang H and Li S (2025) Construction of evaluation index system of water resources carrying capacity based on ecological civilization. Front. Environ. Sci. 13:1524894. doi: 10.3389/fenvs.2025.1524894
Received: 08 November 2024; Accepted: 03 February 2025;
Published: 21 February 2025.
Edited by:
Carmen Teodosiu, Gheorghe Asachi Technical University of Iași, RomaniaReviewed by:
Marco Carnevale Miino, University of Insubria, ItalyCopyright © 2025 Wang, Gao, Jiang and Li. This is an open-access article distributed under the terms of the Creative Commons Attribution License (CC BY). The use, distribution or reproduction in other forums is permitted, provided the original author(s) and the copyright owner(s) are credited and that the original publication in this journal is cited, in accordance with accepted academic practice. No use, distribution or reproduction is permitted which does not comply with these terms.
*Correspondence: Shuangquan Li, bGlzaHFAaWdzLWhhcy5jbg==
Disclaimer: All claims expressed in this article are solely those of the authors and do not necessarily represent those of their affiliated organizations, or those of the publisher, the editors and the reviewers. Any product that may be evaluated in this article or claim that may be made by its manufacturer is not guaranteed or endorsed by the publisher.
Research integrity at Frontiers
Learn more about the work of our research integrity team to safeguard the quality of each article we publish.