
94% of researchers rate our articles as excellent or good
Learn more about the work of our research integrity team to safeguard the quality of each article we publish.
Find out more
ORIGINAL RESEARCH article
Front. Environ. Sci., 11 March 2025
Sec. Drylands
Volume 13 - 2025 | https://doi.org/10.3389/fenvs.2025.1524400
 Pingping Zhou1,2†
 Zilong Liao1,3†
 Xiaoyan Song2*Wenya Li1,3Yaru Feng1,3Wenyi Sun4Xingmin Mu4
 Jun Zhai5*Haili Zhou5
Extreme climate events significantly impact vegetation ecosystems in dry regions, particularly in areas adjacent to the northern foothills of Yinshan Mountain (NYSM). However, there remains limited understanding of how vegetation responds to such events. Analyzing the response of vegetation in dry regions to drought is beneficial for the protection and restoration of the vegetation ecosystem. This study analyzes the spatiotemporal variation characteristics of extreme climate events and NDVI. By employing correlation analysis and geographic detectors, it explores the response of vegetation NDVI to extreme climate events. The findings indicate a recent decline in extreme temperature events and a concurrent rise in extreme precipitation events. From 2000 to 2020, NDVI demonstrated consistent improvement, a trend expected to persist in the future. Extreme temperature events exhibited a strong negative correlation with NDVI, whereas extreme precipitation events demonstrated a strong positive correlation. Furthermore, extreme precipitation events possess greater explanatory power for NDVI variability compared to extreme temperature events. The research findings provide a theoretical basis for the different vegetation types in NYSM to respond to extreme climate events, and they inform targeted ecological restoration measures based on the varying responses of different vegetation types to these extreme climate events.
As global warming persists, the increasing frequency and intensity of extreme climate events worldwide have become an undeniable trend. High temperatures and droughts, driven by extreme heat and precipitation events, significantly and adversely affect ecosystems and human societies (Mishra and Singh, 2010; Xue et al., 2024). A series of adverse effects, including ecosystem degradation, land desertification, and heightened poverty, driven by future high temperatures and droughts, are expected to become increasingly prominent (Lesk et al., 2016; Huang et al., 2016). Moreover, extreme high temperatures reduce vegetation’s photosynthetic rate, accelerate transpiration, and lead to excessive water loss, potentially causing vegetation to wither or die (Zhang et al., 2017). In general, high temperatures and drought conditions result in reduced productivity, inhibited plant growth and development, and elevated mortality rates (McDowell et al., 2008; Ciais et al., 2005; Xiang et al., 2024).
Different vegetation types exhibit distinct physiological characteristics, resulting in diverse responses and adaptive mechanisms to drought conditions. Furthermore, the response patterns of the same vegetation type vary depending on geographical location. For instance, in the eastern region of the same grassland in northern China, vegetation activity is more sensitive to high temperatures and drought compared to the western region (Hua et al., 2017; Xu et al., 2018). The relationship between temperature and vegetation NDVI is not consistently negative; it varies depending on factors influencing vegetation development, such as energy availability (determined by latitude and altitude), water supply, and seasonal changes (Karnieli et al., 2010; Yin et al., 2024). Most studies utilize correlation analysis to examine the response mechanisms of vegetation changes to extreme events. In contrast, this research integrates Pearson correlation analysis with the Geodetector model to investigate the relationships between extreme temperature events, extreme precipitation events, and vegetation NDVI, as well as to analyze the response mechanisms of vegetation to extreme climate events.
Situated in the northern Yinshan Mountains, NYSM lies in the central-northern part of the Inner Mongolia Autonomous Region, an area characterized by hilly terrain and grasslands. Summers are short, hot, and dry, with high evaporation rates and annual precipitation below 400 mm, resulting in aridity and low rainfall as the region’s dominant climatic features. Research indicates a significant rise in extreme high-temperature events in Inner Mongolia between 1960 and 2015, alongside an increase in the frequency of extreme precipitation events in both the eastern and western regions. Vegetation dynamics in the region are strongly affected by these extreme precipitation and temperature events (Su et al., 2023; Ya et al., 2020). This study employs Pearson correlation analysis and the Geodetector model to examine the relationship between vegetation in NYSM and extreme precipitation and temperature events. Based on the findings, the study proposes recommendations for ecological restoration and management strategies.
This study investigates the temporal and spatial variation patterns of extreme climate in NYSM using remote sensing data. The geographical and temporal characteristics of these variations were analyzed, the relationship between vegetation NDVI and extreme climate events was examined, and the future evolution trend of vegetation was predicted. Additionally, the impact of extreme climate events on vegetation was evaluated.
The NYSM, located in the central part of China’s Inner Mongolia Autonomous Region, serves as a significant climatic boundary between the northern and southern regions of Inner Mongolia (Figure 1). This mountain range comprises the Daqing, Wula, and Lang Mountains. Situated between 105°19′∼119°98′ E and 40°18′∼46°77′ N, the NYSM falls within the temperate grassland climate zone. Its topography is predominantly mountainous and hilly, with higher elevations in the south and west and lower elevations in the north and east. Administratively, the area encompasses the cities of Bayannur, Ulaanqab, Xilin Gol League, and Chifeng, covering a total area of 300,500 km2.
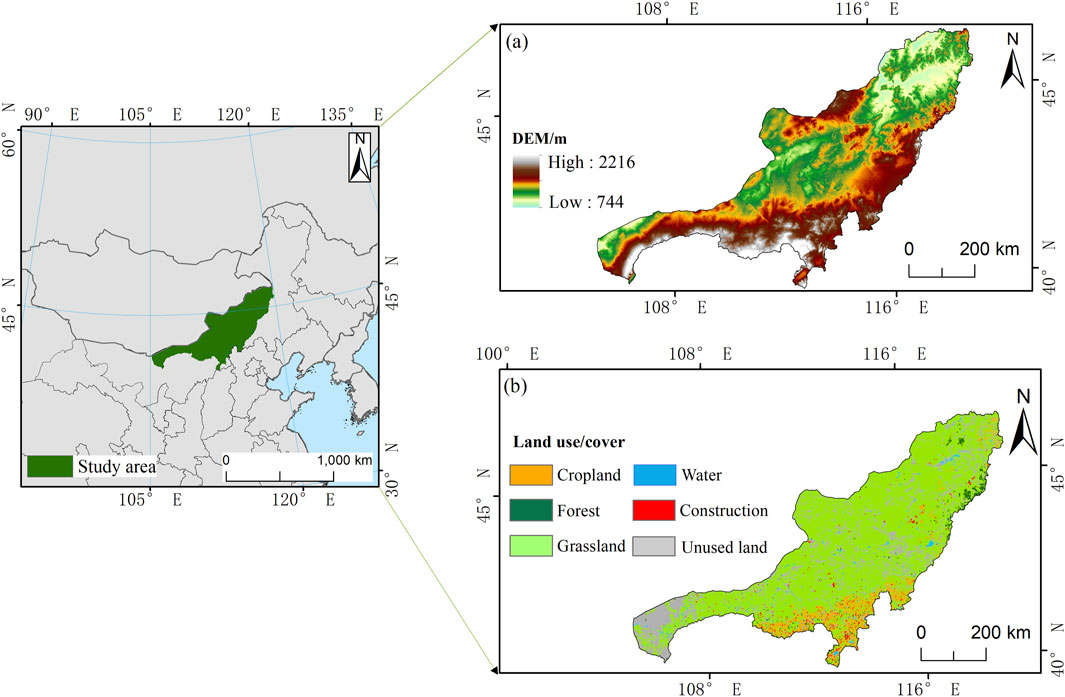
Figure 1. Geographical overview of the NYSM. (A) DEM (B) Land use/cover.
NYSM, characterized by an arid and semi-arid continental climate, experiences low precipitation with an annual average ranging from 100 mm to 350 mm, where the southeast receives more rainfall while the northwest remains drier. The primary vegetation in NYSM consists predominantly of grassland, with unused land being the second most common type. The region’s climate is arid, characterized by low annual precipitation, which accentuates the occurrence of extreme climate events. This creates an ideal natural experimental setting for examining the effects of extreme climate on vegetation. Furthermore, the area’s natural environmental conditions are relatively harsh, and its ecosystem is notably fragile. Extreme climate events can significantly impact vegetation growth and ecological balance, making the study of their response mechanisms ecologically and managerially significant.
The meteorological data are based on gridded data interpolated from daily observations of more than 2,400 meteorological stations of the National Meteorological Information Centre (http://www.nmic.cn/en/) (Xu et al., 2009). The data are interpolated and superimposed by the anomaly approach from the climatological field and the anomaly field, respectively, with a spatial resolution of 250 m for the daily data.
This study is based on the Google Earth Engine cloud computing platform, utilizing the surface reflectance data from Landsat 5, Landsat 7, and Landsat 8 provided by the United States Geological Survey (USGS), with a spatial resolution of 30 m. The imagery data selected spans from 2000 to 2020. The accuracy of this dataset has been confirmed by Wang (2023), who validated its applicability in the Inner Mongolia region through field surveys.
The digital elevation data (DEM) is derived from the geospatial data cloud, using GDEMV 30M data, which is ASTER‘s satellite optical data production (https://www.gscloud.cn/search). The data set has high spatial resolution and can accurately show the terrain features.
The pixel-based dynamic extreme value method was employed to identify extreme temperature and precipitation events for this study (Lu et al., 2018). A 21-day period from 2000 to 2020, centered on the same date, was chosen, making a total of 420 days, and it was sorted. Based on the ranking results, 90% of temperature and 10% of precipitation, respectively, were set as thresholds for deciding extreme events. For example, if the precipitation on the center date of a year is below the threshold or the temperature is above the threshold, an extreme event is identified to have occurred on that date. In the notion, the frequency of extreme climate events is equal to the cumulative number of extreme event days in a year.
Theil-Sen median trend analysis is employed to examine trend variations in long-term time series, as its accuracy remains robust against outliers. The formula is as in Equation 1 (Gong et al., 2024):
In the formula,
The Coefficient of Variation (CV) is a statistical metric that quantifies the relative dispersion within a dataset. It is calculated as the ratio of the standard deviation to the mean and is commonly expressed as a percentage. The formula is as in Equation 2 (Alharbi et al., 2019):
where n is the number of years of study, xi is the NDVI value of the ith year, and
The Hurst exponent serves as a critical tool for analyzing time series data, enabling the measurement of long-term memory and self-similarity within such datasets (Equation 3) (Gu et al., 2023):
where RSi is the Hurst index, Ri is the NDVI range of vegetation, and Si is the standard deviation of NDVI of vegetation. H value between 0.5 and 1 indicating memory enhancement, that is, a time series suggesting long-term memory, which is continuous, an H value between 0 and 0.5 indicating a weakened memory and anti-persistence, and an H value equal to 0.5 indicating that the time series can be described by random walk.
The Pearson correlation coefficient is employed to quantify the linear relationship between two variables (Equation 4) (Li Z. K. et al., 2024):
where Rxy represents the correlation coefficient between NDVI and drought frequency, x and y represent NDVI and drought frequency, respectively.
The geographical detector assesses the extent to which the independent variable explains the dependent variable by analyzing the geographical and spatial variability of both variables (Yin and Lin, 2024). In this study, the frequency of extreme temperature and precipitation events serves as independent variables, analyzed using the factor detection module of the geographic detector, while NDVI is the dependent variable (Equation 5) (Zhu and Ling, 2024):
where q is the explanatory power of the independent variable factor to the dependent variable;
The long-term average frequency of extreme precipitation events is 230 days, exhibiting a slight overall growth trend at an average rate of 0.13 days/year (Figure 2). The highest frequency occurred in 2003 (247 days), whereas the lowest was recorded in 2007 (222 days).

Figure 2. Temporal and spatial variation characteristics of extreme precipitation and extreme temperature events from 2000 to 2020.
The extreme temperature events exhibits significant variability from 2000 to 2020, contrasting with the trend observed in extreme precipitation events. The multi-year average stands at 14 days, indicating an overall downward trend with a decline rate of 0.32 days/year. The minimum extreme temperature events occurred in 2018, followed by 2003, the same year as the peak extreme precipitation events. Compared to the average frequency, the maximum frequency in 2010 reached 25 days, reflecting an increase of 11 days.
The extreme climate events in 2000, 2010, and 2020 exhibit a similar spatial distribution pattern. High-value areas are predominantly located in the northeastern region of the NYSM, and the extent of areas exceeding the multi-year average of extreme events from 2000 to 2020 demonstrates a gradual upward trend (Figure 3). Specifically, the areas surpassing the multi-year average accounted for 52.3%, 56%, and 62.4% of the NYSM in 2000, 2010, and 2020, respectively. Conversely, the central and western regions of the NYSM are identified as low-frequency zones for extreme precipitation events.
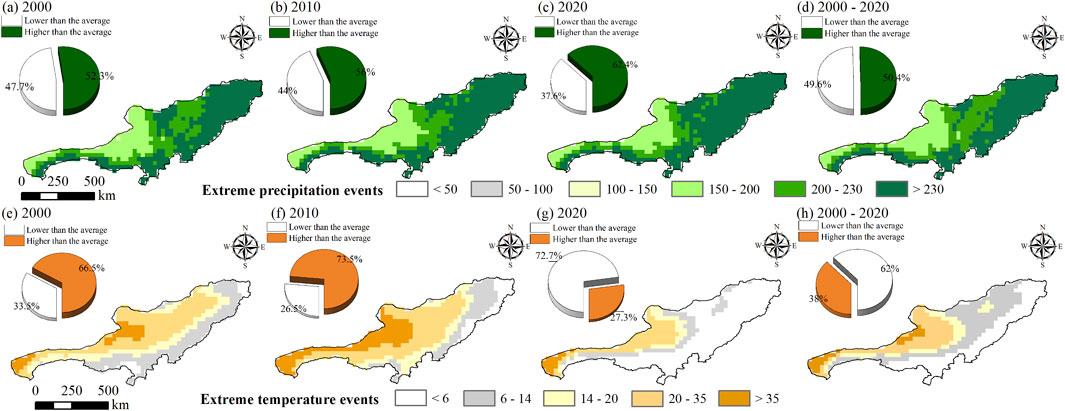
Figure 3. Spatial variation characteristics of extreme climate events from 2000 to 2020. (A) 2000 (B) 2010 (C) 2020 (D) 2000–2020 (E) 2000 (F) 2010 (G) 2020 (H) 2000–2020.
During the period from 2000 to 2020, areas with frequent extreme temperature events were distributed in the central and western regions, of which 38% of the area was higher than the multi-year average. The northeastern portion of the research region is characterized by a low-frequency area of extreme temperature events. Over time, the extent of this low-value area initially decreases before subsequently increasing. A spatial comparative analysis of extreme temperature and precipitation events reveals that the low-value area of extreme precipitation events corresponds to the high-value area of extreme temperature events. This phenomenon may be attributed to a corresponding reduction in precipitation within high-temperature regions.
Between 2000 and 2020, the vegetation quality of NYSM exhibited a progressive greening trend (Figure 4). The annual average NDVI was 0.35, with an average growth rate of 0.003. Over this period, the NDVI exceeded the multi-year average for 10 years, reaching a peak of 0.44 in 2018, followed by 0.43 in 2012. The lowest NDVI value, recorded at 0.29 in 2009, was also observed in 2001 and 2007 at 0.30.
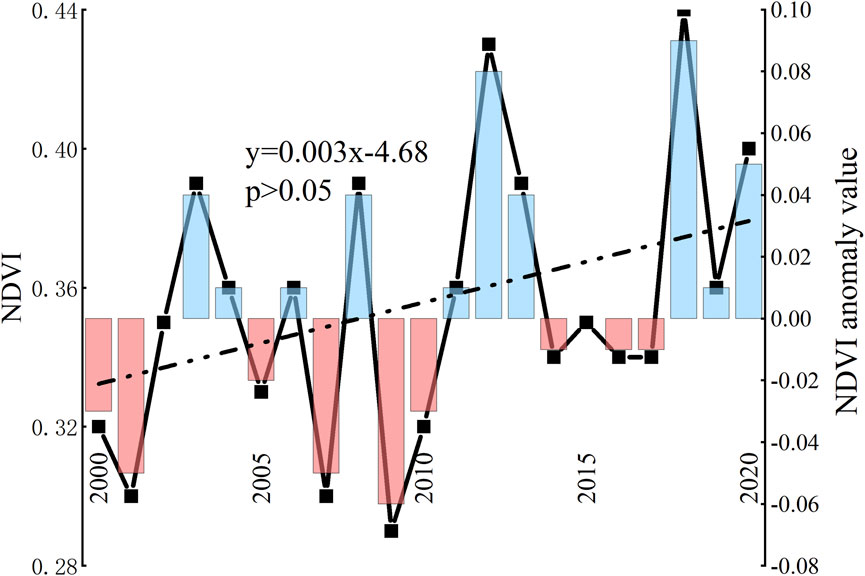
Figure 4. Time variation and anomaly characteristics of NDVI from 2000 to 2020.
An analysis of the spatial variation trend in vegetation NDVI revealed a general upward trend, with areas exhibiting growth accounting for 85% of the NYSM (Figure 5). The central and northeastern regions of NYSM, however, showed a decline in NDVI, constituting 14.8% of the total area. Overall, between 2000 and 2020, a greening trend was observed in the vegetation surrounding the NYSM.
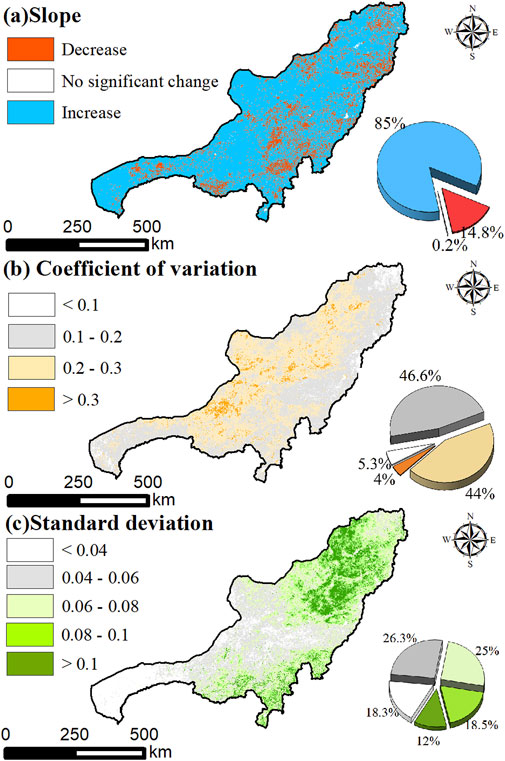
Figure 5. Characteristics of NDVI trend, variation coefficient and standard deviation from 2000 to 2020. (A) Slope (B) coefficient of variation (C) standard deviation.
According to the analysis of vegetation NDVI growth stability, areas with a coefficient of variation below 0.2 constitute 51.9% of the NYSM, predominantly located in its western and northeastern regions. This indicates that vegetation development in these areas is highly stable, resilient to extreme climate events, and exhibits significant tolerance to adverse climatic conditions. In contrast, the central region of the NYSM comprises the majority of areas with a relatively high coefficient of variation, suggesting that vegetation in this region is more vulnerable to extreme events.
Areas with a vegetation NDVI standard deviation below 0.04 are predominantly located in the western part of the study area, accounting for 18.3% of the NYSM. This indicates minimal vegetation variability in this region, likely due to the prevalence of unused land and sparse vegetation distribution, which results in a low standard deviation. In contrast, the northeastern region, comprising 13% of the NYSM, contains the majority of areas with a standard deviation exceeding 0.1, reflecting significant vegetation heterogeneity.
Across most of the NYSM, vegetation displayed a continuous state, with areas having a Hurst value greater than 0.5 comprising 12.17% of the region (Figure 6), while those with a Hurst index below 0.5 accounted for 87.83%. Combined with an analysis of vegetation NDVI trend changes (Table 1), the results revealed that 10.21% of the region showed consistent improvement, primarily in the northeast, the western Gobi region, and the southern vegetation restoration area. Conversely, 10.86% of the vegetation exhibited anti-sustainable degradation, predominantly in the Hunshandake Sandy Land and sporadically in the northeast of the NYSM. Random changes were observed in 0.53% of the area, while continuous degradation accounted for 1.9%. Notably, 76.5% of the region demonstrated anti-continuous improvement, nearly encompassing the entire NYSM.
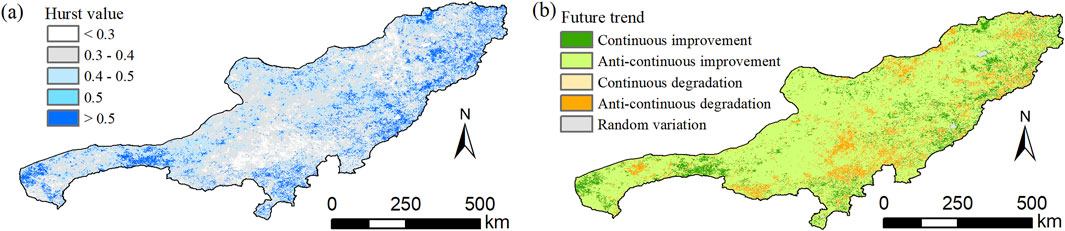
Figure 6. Hurst value change and future trend characteristics of NDVI. (A) Hurst value (B) future trend.

Table 1. Characteristics of Hurst index based on NDVI trend analysis.
The frequency of extreme precipitation events exhibits a positive correlation with NDVI (Figure 7). Within the NYSM, which is predominantly concentrated in the central and northeastern regions, areas showing a positive correlation constitute 93.7%. Notably, the northeastern region includes areas with correlation values exceeding 0.5. Conversely, the negative correlation between extreme precipitation event frequency and NDVI is primarily observed in the western region, representing 6.3% of the NYSM. Correlation analysis reveals that 25.5% of the NYSM passed the significance test, while 74.6% did not. These findings indicate that, although not highly significant, extreme precipitation events exert a measurable influence on vegetation.
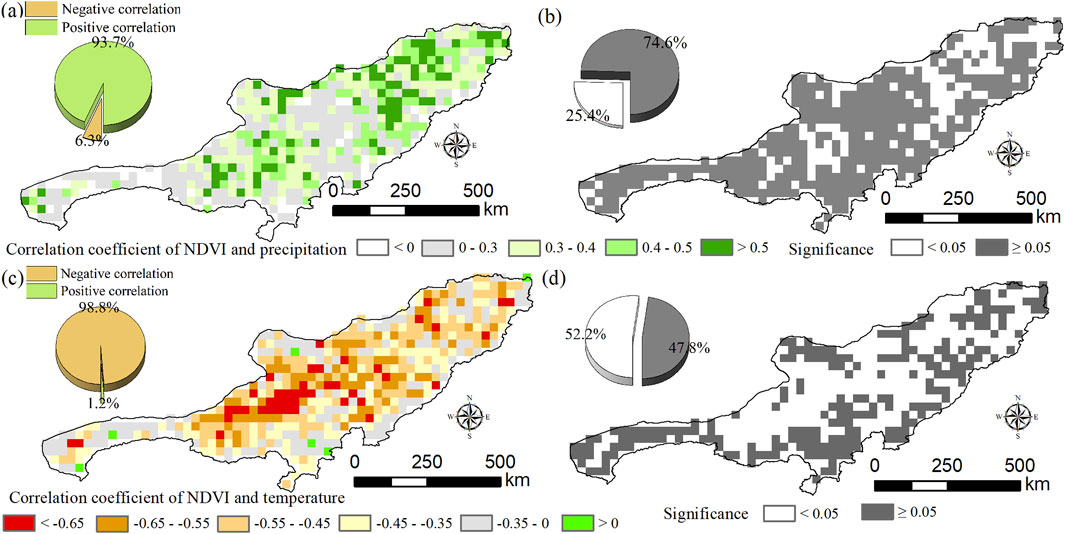
Figure 7. Spatial variation characteristics of correlation. (A) Correlation coefficient of NDVI and precipitation (B) Significance of NDVI and precipitation (C) Correlation coefficient of NDVI and temperature (D) Significance of NDVI and temperature.
A negative association was observed between the NDVI and extreme temperature events. This negative correlation explained a substantial portion of the NDVI variation, covering nearly the entire NYSM with an area ratio of 98.8%. Compared to precipitation, the significance test results more clearly demonstrate a significant relationship between the NDVI and extreme temperature events. Specifically, 47.8% of the NYSM failed the significance test, while the remaining areas, constituting more than half, passed.
The analysis of correlations between vegetation NDVI and extreme climate events across different land use types indicates that the six land use types predominantly exhibit significant positive correlations with extreme precipitation events, with no significant negative correlations observed. Conversely, extreme temperature events demonstrate negative correlations with most land use types, with significant negative correlations ranging from 21.9% to 60.1% across these types. Notably, no significant positive correlations are observed between extreme temperature events and land use types (Figure 8).
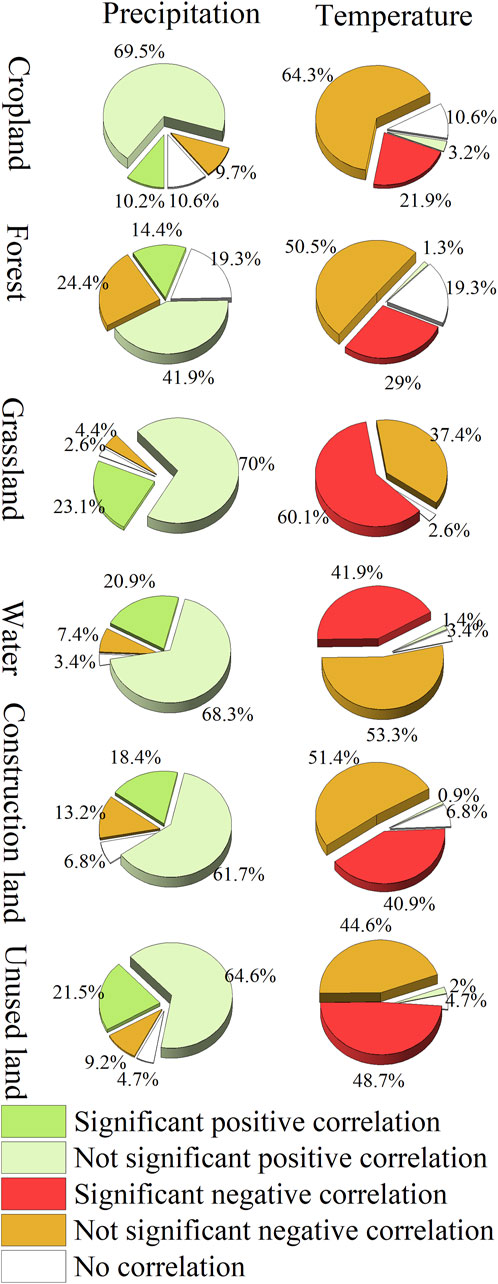
Figure 8. Correlation between NDVI and extreme climate events across different land use types.
The geographic detector’s factor detector was employed to analyze the effects of extreme temperature and precipitation events on vegetation NDVI in the NYSM (Table 2). Between 2000 and 2020, the frequency of extreme precipitation events exhibited higher explanatory power for NDVI (0.45–0.52) compared to that of extreme temperature events (0.44–0.49). Both types of extreme events demonstrated significant explanatory power for NDVI, as evidenced by their passing the significance level test (p < 0.05) (Xu et al., 2019). Moreover, the relatively high explanatory power of extreme precipitation events underscores their substantial influence on NDVI.
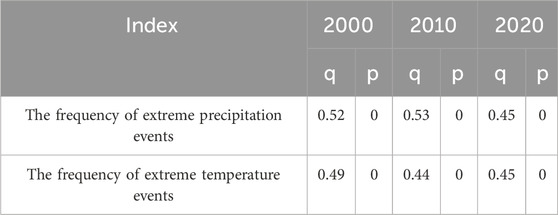
Table 2. Detection results of vegetation impact factors in the NYSM.
This study examines the response of NDVI to extreme climate events across various land use types (Table 3). The explanatory power of extreme precipitation and temperature events on the NDVI of the six land use types is statistically significant (p < 0.05). Notably, extreme climate events exhibit the strongest explanatory power for the NDVI of grassland and unused land, with q-values exceeding 0.5. Specifically, the explanatory power of extreme precipitation events on the NDVI of cultivated land, forest land, and grassland surpasses that of extreme temperature events. Conversely, the explanatory power of extreme precipitation events on the NDVI of water bodies, construction land, and unused land is lower than that of extreme temperature events.

Table 3. Explanatory power of extreme climate events on NDVI for different land use types.
Since the early 21st century, the frequency and intensity of extreme climate events have exhibited a gradual upward trend, significantly affecting the structure and functionality of global vegetation ecosystems (Li H. et al., 2024). This study identifies that areas with high occurrences of extreme precipitation events are predominantly located in the northeastern part of the study area, whereas regions with high occurrences of extreme temperature events are primarily distributed in the central and western parts. These findings align with those of Tong et al. (2019), who reported that regions with elevated extreme precipitation index values are concentrated in northeastern Inner Mongolia, while areas with high extreme temperature index values are mainly found in the western regions.
Our study reveals that vegetation has progressively greened from 2000 to 2020, a trend likely attributable to afforestation initiatives, such as the conversion of farmland to forest, which have been actively promoted in Inner Mongolia in recent years. This finding aligns with the research of Gong et al. (2020). Moreover, the results demonstrate that 93.7% of the study area exhibits a positive correlation betweenNDVI and extreme precipitation events. Given that NYSM is situated in an arid to semi-arid region characterized by low and sporadic annual rainfall, extreme precipitation events may temporarily enhance soil moisture, thereby fostering vegetation growth. Notably, a significant positive correlation between extreme precipitation and NDVI in forested areas accounts for 41.9% of the total study area. Furthermore, geographic detector analysis indicates that the explanatory power of extreme precipitation is lower for forested areas compared to grasslands and unused land. This discrepancy arises from the deeper root systems of forests, which enable access to deeper soil moisture reserves, supporting their growth and development. In contrast, grasslands and unused lands rely primarily on shallow soil moisture. Under prolonged drought conditions, extreme precipitation events can sustain the growth and development of herbaceous plants, such as those in grasslands. This conclusion is consistent with the findings of Li H. et al. (2024). Additionally, geographic detector results suggest that the explanatory power of extreme precipitation and temperature for NDVI in croplands and water bodies is relatively low. This may be attributed to the ample water supply available to water body vegetation and the significant influence of human activities, such as irrigation, on croplands. Consequently, the NDVI of croplands and water bodies exhibits reduced sensitivity to extreme climate events (Tian et al., 2015).
Although the accuracy of the NDVI dataset used in this study has been validated by Wang (2023), confirming its suitability for assessing vegetation changes in Inner Mongolia, some unavoidable errors may persist. Future research could improve the accuracy of the remote sensing dataset through methods such as field surveys or parameter calibration (Huang et al., 2021). Given that the spatial resolution of NDVI is 30m, while meteorological data resolution is 250 m, we standardized the resolution to a common level for analyzing the correlation between extreme climate events and NDVI. However, this approach may constrain our ability to examine the impact of extreme climate events on NYSM’s NDVI at a finer scale of 30 m or less.
This study examines the impact of NDVI on extreme climate events across six land use types, revealing that croplands demonstrate lower sensitivity to such events. Future research could leverage machine learning techniques to further investigate the degree to which crops are influenced by extreme climate events, thereby enabling farmers and policymakers to implement timely measures to mitigate these impacts (Guo et al., 2021; Guo et al., 2022; Guo et al., 2023).
This study employs NYSM as a case study to examine the spatiotemporal variations in vegetation and extreme climate events between 2000 and 2020. Building on this analysis, it investigates the effects of extreme precipitation and extreme temperature events on NDVI. The key findings of the research are as follows:
(1) Extreme precipitation events exhibit a year-by-year increasing trend, whereas extreme temperature events show a gradual decline over time. The spatial distribution of high-frequency zones for extreme precipitation events and low-frequency zones for extreme temperature events is similar, with both predominantly located in the northeastern region of NYSM.
(2) Over the years, the vegetation in NYSM has demonstrated a gradual greening trend, with the NDVI values in the western and mid-northern regions remaining relatively stable and showing minimal variation.
(3) The increase in extreme precipitation promotes vegetation greening, whereas the rise in extreme temperatures generally suppresses it. Moreover, the influence of extreme precipitation on vegetation is more pronounced compared to that of extreme temperatures.
The original contributions presented in the study are included in the article/supplementary material, further inquiries can be directed to the corresponding authors.
PZ: Methodology, Resources, Writing–original draft. ZL: Formal Analysis, Writing–original draft. XS: Resources, Writing–review and editing. WL: Formal Analysis, Software, Writing–original draft. YF: Formal Analysis, Software, Writing–original draft. WS: Methodology, Software, Writing–original draft. XM: Formal Analysis, Software, Writing–review and editing. JZ: Methodology, Resources, Writing–review and editing. HZ: Formal Analysis, Software, Writing–original draft.
The author(s) declare that financial support was received for the research, authorship, and/or publication of this article. This study was funded by the Open Research Fund of Yinshanbeilu Grassland Eco-hydrology National Observation and Research Station (grant number: YSS202303), National Natural Science Foundation of China (grant number: 42477530), Inner Mongolia Department of Science and Technology 2024 major projects to prevent and control sand demonstration “unveiled marshal” project (grant number: 2024JBGS0016), Regular Remote Sensing Survey and Assessment of National Ecological Status of China (grant number: 22110499001001).
The authors declare that the research was conducted in the absence of any commercial or financial relationships that could be construed as a potential conflict of interest.
The author(s) declare that no Generative AI was used in the creation of this manuscript.
All claims expressed in this article are solely those of the authors and do not necessarily represent those of their affiliated organizations, or those of the publisher, the editors and the reviewers. Any product that may be evaluated in this article, or claim that may be made by its manufacturer, is not guaranteed or endorsed by the publisher.
Alharbi, S., Raun, W. R., Arnall, D. B., and Zhang, H. L. (2019). Prediction of maize (Zea mays L.) population using normalized-difference vegetative index (NDVI) and coefficient of variation (CV). J. Plant Nutr. 42 (6), 673–679. doi:10.1080/01904167.2019.1568465
Ciais, P., Reichstein, M., Viovy, N., Granier, A., Ogée, J., Allard, V., et al. (2005). Europe-wide reduction in primary productivity caused by the heat and drought in 2003. Nature 437 (7059), 529–533. doi:10.1038/nature03972
Gong, H. X., Wang, G. Y., Wang, X. Y., Kuang, Z. X., and Cheng, T. T. (2024). Trajectories of terrestrial vegetation productivity and its driving factors in China's drylands. Geophys. Res. Lett. 51 (20), e2024GL111391. doi:10.1029/2024GL111391
Gong, Z., Kawamura, K., Ishikawa, N., Goto, M., Tuya, W., Alateng, D., et al. (2020). Vegetation dynamics and phenological shifts in long-term NDVI time series in Inner Mongolia, China. Jarq-japan Agric. Res. Q. 54 (1), 101–112. doi:10.6090/jarq.54.101
Gu, F. Y., Xu, G. C., Wang, B., Jia, L., and Xu, M. Z. (2023). Vegetation cover change and restoration potential in the Ziwuling Forest Region, China. Ecol. Eng. 187, 106877. doi:10.1016/j.ecoleng.2022.106877
Guo, Y. H., Chen, S. Z., Li, X. X., Cunha, M., Jayavelu, S., Cammarano, D., et al. (2022). Machine learning-based approaches for predicting SPAD values of maize using multi-spectral images. Remote Sens. 14 (6), 1337. doi:10.3390/rs14061337
Guo, Y. H., Fu, Y. S., Hao, F. H., Zhang, X., Wu, W. X., Jin, X., et al. (2021). Integrated phenology and climate in rice yields prediction using machine learning methods. Ecol. Indic. 120, 106935. doi:10.1016/j.ecolind.2020.106935
Guo, Y. H., Xiao, Y., Hao, F. H., Zhang, X., Chen, J. H., de Beurs, K., et al. (2023). Comparison of different machine learning algorithms for predicting maize grain yield using UAV-based hyperspectral images. Int. J. Appl. Earth Observation Geoinformation 124, 103528. doi:10.1016/j.jag.2023.103528
Hua, T., Wang, X. M., Zhang, C. X., Lang, L. L., and Li, H. (2017). Responses of vegetation activity to drought in northern China. Land Degrad. and Dev. 28 (7), 1913–1921. doi:10.1002/ldr.2709
Huang, J. P., Yu, H. P., Guan, X. D., Wang, G. Y., and Guo, R. X. (2016). Accelerated dryland expansion under climate change. Nat. Clim. change 6 (2), 166–171. doi:10.1038/NCLIMATE2837
Huang, X. J., Xiao, J. F., Wang, X. F., and Ma, M. G. (2021). Improving the global MODIS GPP model by optimizing parameters with FLUXNET data. Agric. For. Meteorology 300, 108314. doi:10.1016/j.agrformet.2020.108314
Karnieli, A., Agam, N., Pinker, R. T., Anderson, M., Imhoff, M. L., Gutman, G. G., et al. (2010). Use of NDVI and land surface temperature for drought assessment: merits and limitations. J. Clim. 23 (3), 618–633. doi:10.1175/2009JCLI2900.1
Lesk, C., Rowhani, P., and Ramankutty, N. (2016). Influence of extreme weather disasters on global crop production. Nature 529 (7584), 84–87. doi:10.1038/nature16467
Li, H., Hu, Y. F., and Batunacun, (2024b). Responses of vegetation low-growth to extreme climate events on the Mongolian Plateau. Glob. Ecol. Conservation 56, e03292. doi:10.1016/j.gecco.2024.e03292
Li, Z. K., Xu, B., Tian, D. L., Wang, J., and Zheng, H. X. (2024a). Long-term analysis of regional vegetation correlation with climate and phenology in the Midsection of Maowusu Sandland. Water 16 (5), 623. doi:10.3390/w16050623
Lu, Y., Hu, H. c., Li, C., and Tian, F. Q. (2018). Increasing compound events of extreme hot and dry days during growing seasons of wheat and maize in China. Sci. Rep. 8 (1), 16700. doi:10.1038/s41598-018-34215-y
McDowell, N., Pockman, W. T., Allen, C. D., Breshears, D. D., Cobb, N., Kolb, T., et al. (2008). Mechanisms of plant survival and mortality during drought: why do some plants survive while others succumb to drought? New phytol. 178 (4), 719–739. doi:10.1111/j.1469-8137.2008.02436.x
Mishra, A. K., and Singh, V. P. (2010). A review of drought concepts. J. hydrology 391 (1-2), 202–216. doi:10.1016/j.jhydrol.2010.07.012
Su, R. H., Guo, E. L., Wang, Y. F., Yin, S., Gu, X. L., Kang, Y., et al. (2023). Extreme climate changes in the Inner Mongolia and their impacts on vegetation dynamics during 1982—2020. Acta Ecol. Sin. 43 (01), 419–431. doi:10.5846/stxb202112073469
Tian, H. J., Cao, C. X., Chen, W., Bao, S. N., Yang, B., and Myneni, R. B. (2015). Response of vegetation activity dynamic to climatic change and ecological restoration programs in Inner Mongolia from 2000 to 2012. Ecol. Eng. 82, 276–289. doi:10.1016/j.ecoleng.2015.04.098
Tong, S. Q., Li, X. Q., Zhang, J. Q., Bao, Y. H., Bao, Y. B., Na, L., et al. (2019). Spatial and temporal variability in extreme temperature and precipitation events in Inner Mongolia (China) during 1960-2017. Sci. Total Environ. 649, 75–89. doi:10.1016/j.scitotenv.2018.08.262
Wang, X. D. (2023). Study on the productivity and community dynamics of grassland vegetation in inner Mongolia and their response to climate. PhD dissertation. Inner Mongolia, China: Inner Mongolia Agricultural University. doi:10.27229/d.cnki.gnmnu.2023.000007
Xiang, X. H., Li, Y. X., Wu, X. L., Cao, H. W., and Lin, X. (2024). Delineating the predominant impact of rising temperature on the enhancement of severity in compound drought-hot events in China: an empirical Copula and path analysis-based approach. J. Hydrology Regional Stud. 53, 101769. doi:10.1016/j.ejrh.2024.101769
Xu, H. J., Wang, X. P., Zhao, C. Y., and Yang, X. M. (2018). Diverse responses of vegetation growth to meteorological drought across climate zones and land biomes in northern China from 1981 to 2014. Agric. For. Meteorology 262, 1–13. doi:10.1016/j.agrformet.2018.06.027
Xu, H. J., Zhao, C. Y., and Wang, X. P. (2019). Spatiotemporal differentiation of the terrestrial gross primary production response to climate constraints in a dryland mountain ecosystem of northwestern China. Agric. For. Meteorology 276, 107628. doi:10.1016/j.agrformet.2019.107628
Xu, Y., Gao, X. J., Shen, Y., Xu, C. H., Shi, Y., and Giorgi, F. (2009). A daily temperature dataset over China and its application in validating a RCM simulation. Adv. Atmos. Sci. 26 (4), 763–772. doi:10.1007/s00376-009-9029-z
Xue, R. F., Sun, B., Li, W. L., Li, H. X., Zhou, B. T., Luo, X., et al. (2024). Future projections of meteorological, agricultural and hydrological droughts in China using the emergent constraint. J. Hydrology Regional Stud. 53, 101767. doi:10.1016/j.ejrh.2024.101767
Ya, R., Li, N., Yin, S., and Bao, Y. H. (2020). Characteristics of temporal and spatial variation of extreme climate events in Inner Mongolia during the period 1960-2015. Res. Soil Water Conservation 27 (03), 106–112. doi:10.13869/j.cnki.rswc.2020.03.016
Yin, G. Y., He, W., Liu, W. B., Liu, X. Y., Xia, Y., and Zhang, H. (2024). Drought stress and its characteristics in China from 2001 to 2020 considering vegetation response and drought creep effect. J. Hydrology Regional Stud. 53, 101763. doi:10.1016/j.ejrh.2024.101763
Yin, X. Q., and Lin, K. (2024). Spatial-temporal characteristics and driving factors of carbon emissions from the construction industry in the Belt and Road region of China. Front. Environ. Sci. 12, 1398328. doi:10.3389/fenvs.2024.1398328
Zhang, J. T., Yang, J., An, P. L., Ren, W., Pan, Z. H., Dong, Z., et al. (2017). Enhancing soil drought induced by climate change and agricultural practices: observational and experimental evidence from the semiarid area of northern China. Agric. For. Meteorology 243, 74–83. doi:10.1016/j.agrformet.2017.05.008
Keywords: extreme climate events, NDVI, correlation, geodetector, northern foothills of Yinshan
Citation: Zhou P, Liao Z, Song X, Li W, Feng Y, Sun W, Mu X, Zhai J and Zhou H (2025) Impacts of extreme climate events on vegetation succession at the northern foothills of Yinshan mountain, inner Mongolia. Front. Environ. Sci. 13:1524400. doi: 10.3389/fenvs.2025.1524400
Received: 08 November 2024; Accepted: 21 February 2025;
Published: 11 March 2025.
Edited by:
Heping Liu, Washington State University, United StatesCopyright © 2025 Zhou, Liao, Song, Li, Feng, Sun, Mu, Zhai and Zhou. This is an open-access article distributed under the terms of the Creative Commons Attribution License (CC BY). The use, distribution or reproduction in other forums is permitted, provided the original author(s) and the copyright owner(s) are credited and that the original publication in this journal is cited, in accordance with accepted academic practice. No use, distribution or reproduction is permitted which does not comply with these terms.
*Correspondence: Jun Zhai, emhhaWpAbHJlaXMuYWMuY24=; Xiaoyan Song, eGlhb3lhbnNvbmdAbndzdWFmLmVkdS5jbg==
†These authors have contributed equally to this work
Disclaimer: All claims expressed in this article are solely those of the authors and do not necessarily represent those of their affiliated organizations, or those of the publisher, the editors and the reviewers. Any product that may be evaluated in this article or claim that may be made by its manufacturer is not guaranteed or endorsed by the publisher.
Research integrity at Frontiers
Learn more about the work of our research integrity team to safeguard the quality of each article we publish.