 Ziqi Yue
 Qingqing Fang
 Shanghong Zhang
 Le Wang
94% of researchers rate our articles as excellent or good
Learn more about the work of our research integrity team to safeguard the quality of each article we publish.
Find out more
ORIGINAL RESEARCH article
Front. Environ. Sci., 04 March 2025
Sec. Freshwater Science
Volume 13 - 2025 | https://doi.org/10.3389/fenvs.2025.1524086
This article is part of the Research TopicEffects of Climate Change on Urban Streams in the Anthropocene: How Ready Are We to Tackle This Looming Danger?View all articles
Introduction: In recent years, river ecosystem stability has been increasingly threatened by human activities and climate change. Comprehensive quantification of river ecosystem stability and systematic analysis of its response to human activities and climate change are essential for effective conservation and management.
Methods: Thus, this study proposed a novel quantitative approach to integrating the stability of river ecosystem and its driving factors. The Han River Basin in China was selected as the study area due to its distinctive climate characteristics and significant anthropogenic impact. Both external factors, including urbanization, dam construction, and precipitation, and internal factors, such as TP, DO, and EC, were considered as driving factors.
Results: The results revealed that compared to the upstream, resilience in the lower reaches decreased by 35.75% and the resistance decreased by 8.2%, suggesting that the stability decreased from upstream to downstream. Urbanization had the most significant negative impact on ecosystem stability, followed by precipitation and dam construction. Among the internal factors, TP, DO, and EC were the three main factors affecting ecosystem stability and the increases in these factors contributed positively to enhancing ecosystem stability.
Discussion: These findings highlight the need for targeted conservation strategies to mitigate human-induced disturbances and enhance river ecosystem stability. Based on the results, specific recommendations were proposed to support watershed management and ecological restoration, providing valuable insights for sustainable river conservation.
As an essential unit for the storage and regulation of Earth’s freshwater resources, rivers not only serve as habitats for various aquatic organisms but also represent a critical source of water for human life and production (Jiang et al., 2021; Khatri et al., 2021). However, human activities and climatic change are significantly affecting the health of rivers, leading to eutrophication and biodiversity loss, which severely threaten the stability of river ecosystems (Kumar et al., 2020; Ma et al., 2023). Research on river ecosystem stability helps to elucidate the relationship between physical habitats and aquatic organisms in rivers, thereby providing effective management and conservation measures for degraded rivers (Schirpke et al., 2017; Liu et al., 2024a).
Ecosystem stability is the ability of an ecosystem to remain stable and to recover from an undesirable state to a desirable state following a disturbance (de Vries et al., 2012). Asymptotic stability, variability, persistence, resilience, and resistance are five commonly used dimensions to characterize ecosystem stability (Donohue et al., 2016). Among these, resilience and resistance measure the capacity of river ecosystems to withstand external disturbances (Connell and Ghedini, 2015; Fan et al., 2021). Given the significant increase in the frequency and intensity of disturbances to river ecosystems caused by external factors such as human activities and climate change in recent years, this study evaluates river ecosystem stability using resilience and resistance. Numerous studies use abiotic indicators to evaluate ecosystem health, however, these methods have limitations (Behboudian and Kerachian, 2021). Jaiswal and Pandey (2021) used changes in dissolved oxygen concentration, sediment phosphorus release, and denitrification to characterize changes in the resilience of the Ganges River. Similarly, Mirauda et al. (2021) and Li et al. (2023) used a variety of water quality indexes to quantify the resilience and resistance of rivers. Given the variability in water quality of rivers, it is essential to modify the indicator system according to the specific conditions of each river. Some researchers also used biological indicators such as aquatic biodiversity and biomass to assess resilience and resistance. Baho et al. (2014) investigated ecosystem resilience using phytoplankton as indicator species. Blaszczak et al. (2023) used biomass of primary producers as a proxy for system resilience and discussed thresholds for resilience under different flow conditions. Although these methods have incorporated multispecies indicators to reflect the importance of aquatic organisms in river ecosystem, they may still face limitations in capturing the full complexity of the trophic structure within the river ecosystems. Hence, a more comprehensive approach should be taken when using aquatic organisms to evaluate ecosystem stability.
The composition of aquatic organisms in river ecosystems is complex and diverse, commonly including phytoplankton, zooplankton, and zoobenthos. As the foundation of food chain, changes in phytoplankton abundance can directly impact the structure and abundance of its predators (Lv et al., 2014). Zooplankton communities, by consuming primary producers, provide food to higher trophic level consumers and play a vital role in the food chain (Whitfield and Elliott, 2002). Zoobenthos play a critical role in nutrient cycling, energy flow, and sediment decomposition (Li et al., 2020; Xu et al., 2023). Because they are diverse, easily collected, and sensitive to environmental changes, they have been widely employed as indicators for assessing the impacts of environmental disturbances on river ecosystems (Liu et al., 2024a). As critical components of aquatic ecosystems, the community structures of zoobenthos, phytoplankton, and zooplankton are vital for maintaining the functional integrity of river ecosystems. Therefore, a comprehensive approach to estimate river ecosystem stability was proposed in this study, considering the community structures of zoobenthos, phytoplankton, and zooplankton.
In the context of global climate change and rapid social development, understanding the mechanisms by which climatic conditions and human activities impact the river ecosystem stability is crucial for implementing targeted management measures to protect river ecosystem (de Bello et al., 2021). However, these mechanisms remain unclear (Wang S. et al., 2021). Evidence indicates that external factors such as human activities and climatic conditions influence river ecosystem stability by affecting the internal variables. For example, climatic conditions affect aquatic biodiversity by influencing the hydrological and hydrodynamic condition of rivers (Liu et al., 2022). Human activities such as the rapid expansion of urban land has led to soil pollution and an increase in runoff into rivers (Uchida et al., 2021). Also, the construction of dams has led to the fragmentation of habitats (Moi et al., 2022). The impact of these external variables on internal variables of rivers, such as total nitrogen and total phosphorus, can be described as a chain-like process. For example, human activities first affect the physical habitat and water quality of rivers, and changes in the physical habitat and water quality then influence the community structure of aquatic organisms, ultimately affecting the stability of river ecosystem. Consider this, we use the structural equation model to explore how external variables and internal variables affect resilience and resistance.
In summary, to comprehensively assess the river ecosystem stability and explore the chain-like relationships among external variables, internal variables, and stability, this study proposes a novel approach to calculating river ecosystem stability and employs a structural equation model to quantify the contributing factors. This new method was applied to the Han River Basin, a region undergoing significant anthropogenic land use changes and exhibiting pronounced spatial heterogeneity in climatic characteristics, making it an ideal area to investigate the driving mechanisms of climatic conditions and human activities on river ecosystem stability (Li et al., 2019). This study set out to achieve the following objectives: (1) to reveal the spatial characteristics of driving factors (external variables and internal variables) and aquatic organism communities; (2) to comprehensively evaluate ecosystem stability based on the diversity of aquatic organisms across different trophic levels; and (3) to investigate the effects of driving factors on ecosystem stability.
The Han River Basin (106°12′–114°14′E, 30°8′–34°11′N) is located in the transition zone between the northern subtropical zone and the warm temperate zone of China. This unique geographical position contributes to its diverse landscape, making it one of the most important biodiversity hotspots in China (Wang and Tan, 2017).
This basin features a complex topography characterized by distinct geomorphological divisions. The upper reaches are predominantly mountainous, whereas the middle and lower reaches consist primarily of plains. The significant elevation gradient along the main river channel results in abundant hydropower resources, offering substantial potential for energy development.
The basin is situated within the subtropical monsoon zone, it is characterized by a distinctly seasonal climate. The region experiences an annual mean temperature ranging from 15°C to 17°C, with annual precipitation fluctuating between 700 mm and 1,200 mm.
The main types of vegetation in the Han River Basin include crops, grasslands, evergreen coniferous forests, evergreen broadleaf forests, deciduous coniferous forests, and deciduous broadleaf forests. The primary growing season for the vegetation is from April to October.
The Han River Basin features a well-developed fluvial system characterized by numerous tributaries and sinuous river channels. The flood season occurs from May to October, while the dry season lasts from December to February of the following year.
As the largest tributary of the Yangtze River, the Han River holds significant economic value. It provides essential water resources for domestic and industrial use to dozens of towns and cities. In addition, it serves as the water source for several major water diversion projects, such as the Middle Route of the South-to-North Water Diversion Project and the Hanjiang-to-Weihe River Water Diversion Project. The Middle Route of the South-to-North Water Diversion Project draws water from the Danjiangkou Reservoir to supply Beijing, Tianjin, Hebei and other areas along the route, with an annual water transfer capacity of approximately 9.5 billion cubic meters. In contrast, the Hanjiang-to-Weihe Water Diversion Project channels water from the Huangjinxia Reservoir to the Wei River, with an annual transfer capacity of 1.5 billion cubic meters. The Han River functions as a crucial hub, connecting the southern and northern regions and facilitating east–west integration.
However, in recent years, the construction of water conservancy projects and the increase in the proportion of urban land use have increased rates of pollution and caused frequent algal blooms, and these have led to further habitat fragmentation (Li et al., 2008). Therefore, considering the habitat condition, intensity of human activities, and vertical connectivity, a total of 20 zoobenthos sampling sites were set up along the Han River mainstem from upstream to downstream. Sampling was conducted in May 2023. Because various types of aquatic organisms can reflect the health of the ecosystem more comprehensively, we also collected plankton at 12 of the selected zoobenthos sampling sites (Figure 1).
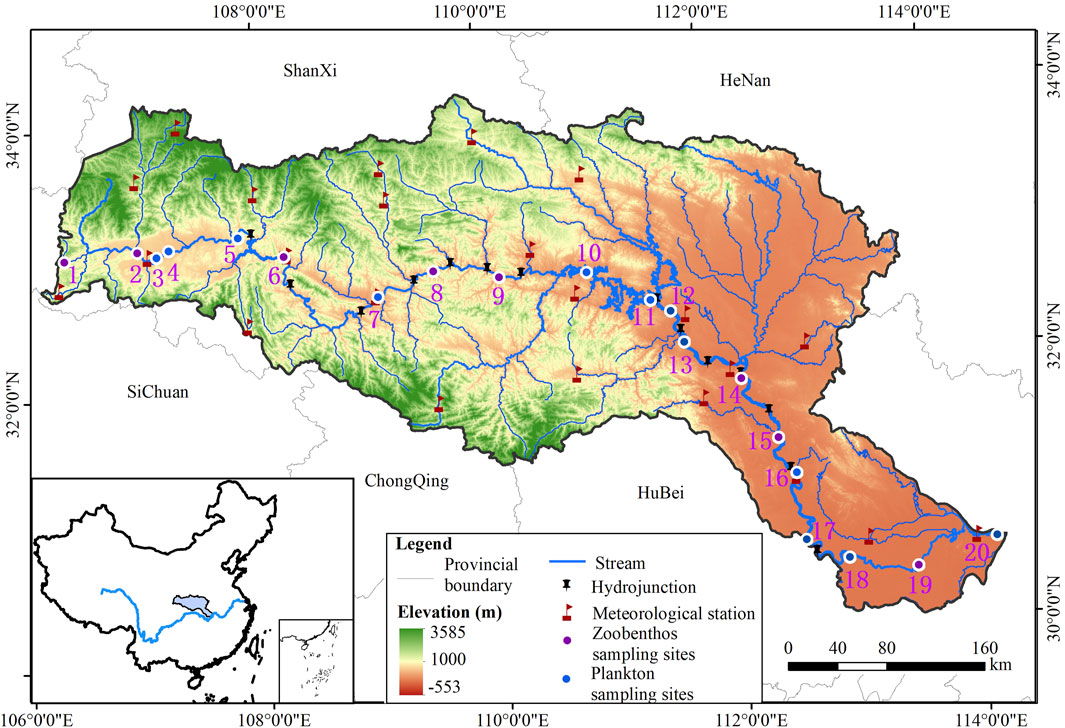
Figure 1. Map of the study area showing the locations of the 20 sampling sites, meteorological stations, and hydrological junctions.
The data used in this study are shown in Table 1. Water temperature (WT), electrical conductivity (EC), dissolved oxygen (DO), and pH were determined on site using YSI. The LS300-A portable flow velocity meter was used to measure the water velocity (WV) and water depth (DTW). Each parameter was measured three times to minimize errors, and the mean value was used for analysis. Additionally, we collected 1.5 L water samples at each sampling site to measure total nitrogen (TN), total phosphorus (TP), ammonia nitrogen (NH3-N), and chemical oxygen demand (COD). All parameters were analyzed in the laboratory following standard laboratory procedures.

Table 1. Data used in the study.
For zoobenthos, quantitative sampling was performed using a Surber net and the samples were preserved with 10% formalin in 100 mL bottles. For phytoplankton, a 5 L water sampler was used to collect 1.5 L of water, which was then fixed with 20 mL Lugol’s reagent. For zooplankton, a 5 L water sampler was used to collect a total of 50 L of water, which was then filtered through a No. 13 mesh silk net and concentrated to 100 mL in a sampling bottle, fixed with 10% formalin. All samples were sent to the laboratory under controlled conditions for the acquisition of aquatic organism density and biomass data.
To obtain the urbanization level and climatic conditions of the sampling sites, land use data and meteorological data were processed using ArcGIS (ESRI, Redlands, CA). The accuracy of the land use data was 30 m and the extracted land cover types included cropland, woodland, grassland, shrubland, water bodies, artificial surfaces, bare ground, and wetland. Multi-year average precipitation was calculated based on the daily precipitation of 23 meteorological stations in the Han River Basin from 1979 to 2019 and interpolated using the inverse distance weighting method to obtain precipitation at different sampling sites.
The diversity of communities was represented by the Shannon-Wiener index (H), Margalef index (d), Pielou index (J), and Simpson index (D), which are calculated by using Equations 1–4, respectively.
where pi is the ratio of the number of genus i to the total number of all kinds of genus, N is the total number of all kinds of genera, and S is the number of the genus.
In this study, we estimated the resilience and resistance of river ecosystems based on the spatial distribution of biodiversity. We quantified resilience in terms of the degree of changes in biodiversity at the sampling sites compared with a reference site. If the difference in biodiversity between the sampling site and the reference site is small, then the resilience is high. The reference sites of rivers are areas that are unaffected or only slightly affected by human activities so that they have a more natural physical morphology and an intact aquatic community structure. On the basis of the “Guidelines for River and Lake Health Assessment”, this study chose S4 as the reference site. The resilience (RSLij) of different aquatic organisms at each sampling site were calculated using Equation 5:
The comprehensive resilience (RSLi) at each sampling site were calculated using Equation 6:
Then, we used the range of variation in diversity to quantify resistance. Resistance can be quantified as the sensitivity of an ecosystem to disturbances, whereby more sensitivity to disturbances is reflected by a greater variation in diversity and a lower level of resistance. River ecosystems that exhibited high resilience and high resistance were generally regarded as more stable.
The resistance (RSTij) of different aquatic organisms at each sampling site were calculated using Equation 7:
The comprehensive resistance (RSTi) at each sampling site were calculated using Equation 8:
In this study, we considered three types of aquatic organisms including zoobenthos, zooplankton, and phytoplankton, so the total number of organism types (n) is 3. P represents the number of sampling sites, in this study, it equals to 20. Hij refers to the diversity of the j th aquatic organism at i th sampling site. Hjmax and Hjmin are the maximum and minimum diversity index of the j th aquatic organism, respectively; and H4j is the diversity index of the j th aquatic organism at site 4.
Firstly, environmental variables with a variance inflation factor <10 were selected. Secondly, on the basis of the result of detrended correspondence analysis, redundancy analysis (RDA) was performed to examine the relationship between aquatic communities and various physical and chemical environmental variables. To achieve the best performance, all environmental variables except pH were log (x+1) transformed. Then, a forward selection and Monte Carlo simulation were used to identify the factors that significantly impacted the aquatic communities (P < 0.05).
Pearson correlation analysis was used to explore the relationships between resilience, resistance, and environmental variables, identifying variables that had significant effects on resilience and resistance. Finally, a structural equation model (SEM) was used to show the linkage between resilience, resistance, environmental variables, human activities (urbanization level and vertical connectivity), and climatic conditions (precipitation).
The urbanization level was calculated using Equation 9:
where M is the urbanization level; C1 is the artificial surface area within a 10 km radius of the sampling site; and C is the total area of all land types within the region.
The vertical connectivity was calculated using Equation 10:
where G is the vertical connectivity (a higher value of G indicates poorer river connectivity); N is the number of hydraulic engineering structures; and L is the length of the river measured in units of 10 km.
Figure 2 presents the spatial characteristics of internal variables along the river. The red labeled points in the horizontal coordinates are sampling sites where all three types of aquatic organisms (zoobenthos, zooplankton, and phytoplankton) were collected. There were significant differences in pH and EC between upstream and downstream, with the mean value of pH upstream being greater than downstream, while the mean value of EC upstream was less than downstream. In contrast, other internal factors did not differ significantly between upstream and downstream. The external variables, including urbanization level and vertical connectivity, were significantly smaller upstream than downstream, while the difference in the multi-year average precipitation was not significant.
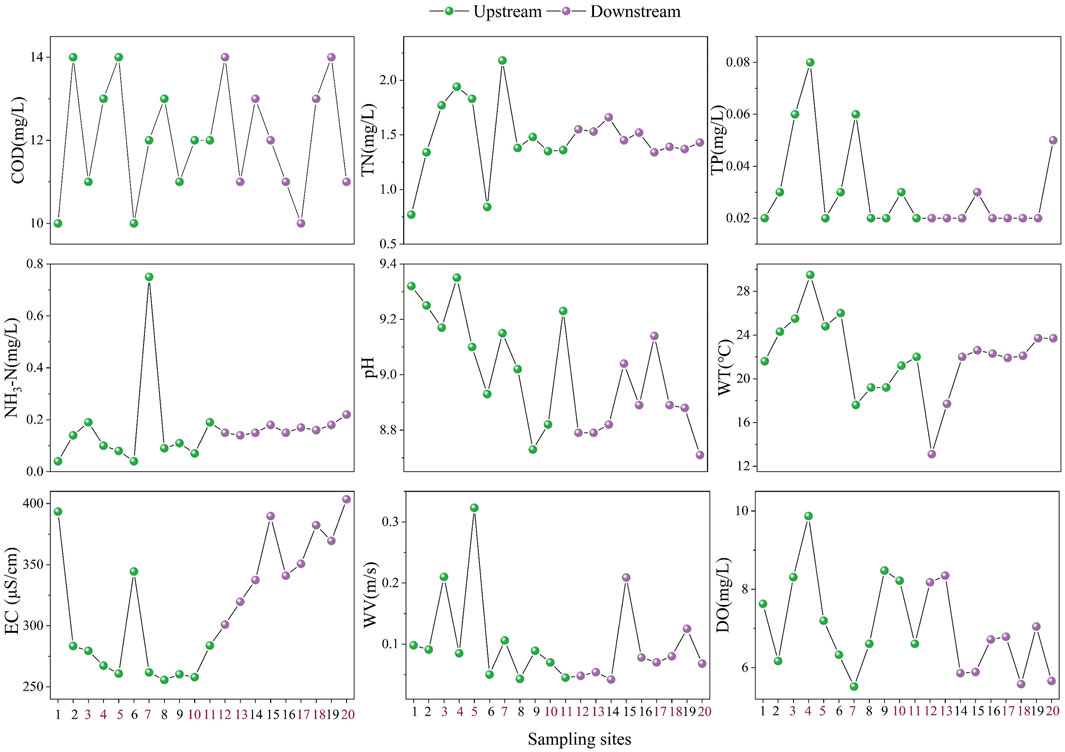
Figure 2. The spatial variation of internal environmental factors.
The result of Pearson correlation analysis showed that TN was positively correlated with TP (r = 0.53, P < 0.05) and NH3-N (r = 0.60, P < 0.01) and negatively correlated with EC (r = −0.5, P < 0.05). In addition, TP was positively correlated with WT (r = 0.37, P < 0.05).
Figure 3 shows the changes in relative abundance at the phylum level of different types of aquatic organisms. A total of 75 zoobenthos species belonging to 4 phyla, 41 families, and 70 genera occurred in 18 sampling sites. The density of zoobenthos ranged from 24 ind/m2 to 912 ind/m2, with an average of 264 ind/m2. The sampling site with the lowest density was S10, which was located in the reservoir area of Danjiangkou Reservoir and the sampling site with the highest density was S1, which was the closest to the headwater. The biomass of zoobenthos varied from 2.02 mg/L to 241.13 mg/L, with an average biomass of 43.81 mg/L. The site with the smallest biomass was S11 and the one with the highest biomass was S14. We found a significant difference in zoobenthos community composition between upstream and downstream. The proportion of Mollusca gradually increased and the proportion of Arthropoda gradually decreased from the headwater to the river mouth. Moreover, Arthropoda accounted for the highest percentage at 70.72% while Platyhelminthes accounted for the lowest percentage and were only found at S1.
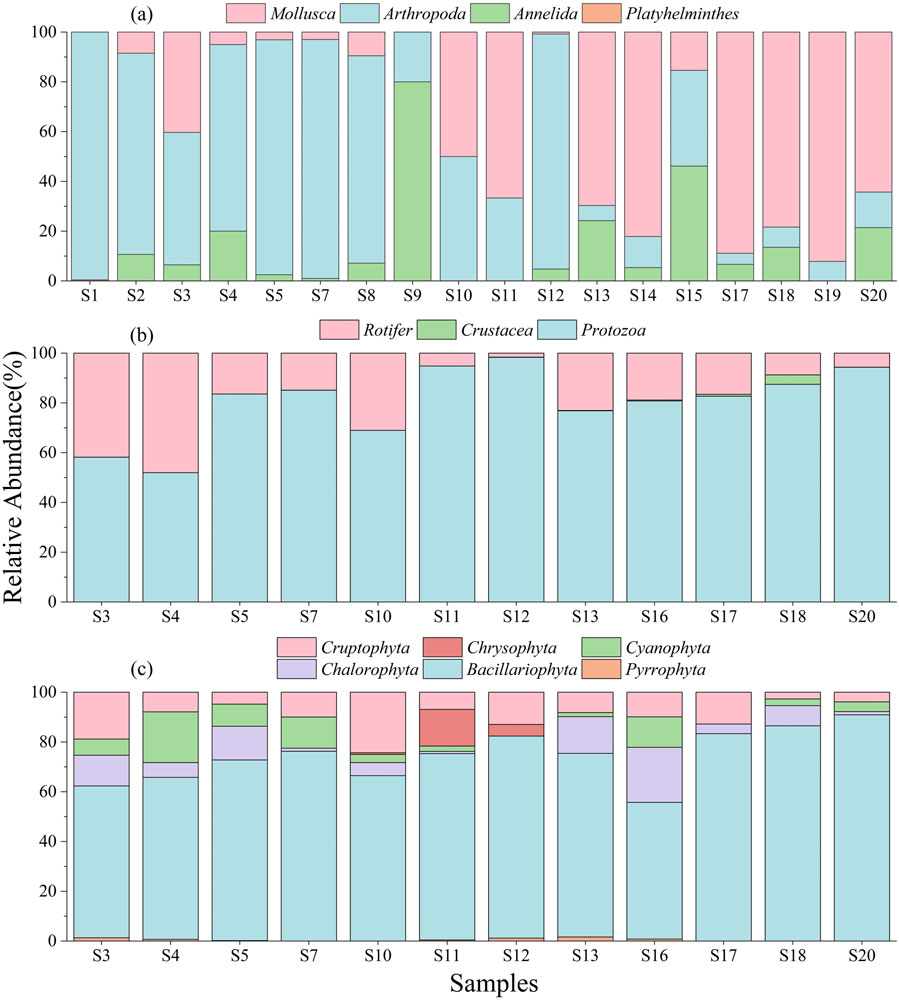
Figure 3. The relative abundance of (A) zoobenthos, (B) zooplankton, and (C) phytoplankton at phyla level.
A total of 63 zooplankton species belonging to 3 phyla, 29 families, and 50 genera were found in 12 sampling sites. The zooplankton community was dominated by Protozoa, with a relative abundance higher than 70%. The density of zooplankton ranged from 216.93 ind/L to 12,366.73 ind/L, with an average of 4,358.34 ind/L. S13 was the sampling site with the lowest zooplankton density while S5 had the highest density. The biomass of zooplankton ranged from 0.005 mg/L to 4.03 mg/L, with an average of 1.27 mg/L. The sampling site with the lowest biomass was S13 and the highest was S5. Similar to the zoobenthos community, the zooplankton community composition differed between upstream and downstream, with the abundance of Rotifer gradually decreasing.
A total of 64 phytoplankton species belonging to 6 phyla, 23 families, and 40 genera were found in the 12 sampling sites. The phytoplankton community was dominated by Bacillariophyta which accounted for 68.26% of the community. The density of phytoplankton varied from 7.95
The local diversity showed a clear trend from the headwater to the river mouth (Figure 4). Interestingly, the four diversity indexes of zoobenthos, zooplankton, and phytoplankton exhibited similar trends from upstream to downstream, initially decreasing, then increasing, and finally decreasing again. However, the Margalef index of zooplankton showed a distinctly different trend compared with the other three diversity indexes. The discrepancy is likely due to the significantly higher richness of zooplankton in the midstream and downstream, resulting in a sharp increase in the Margalef index.
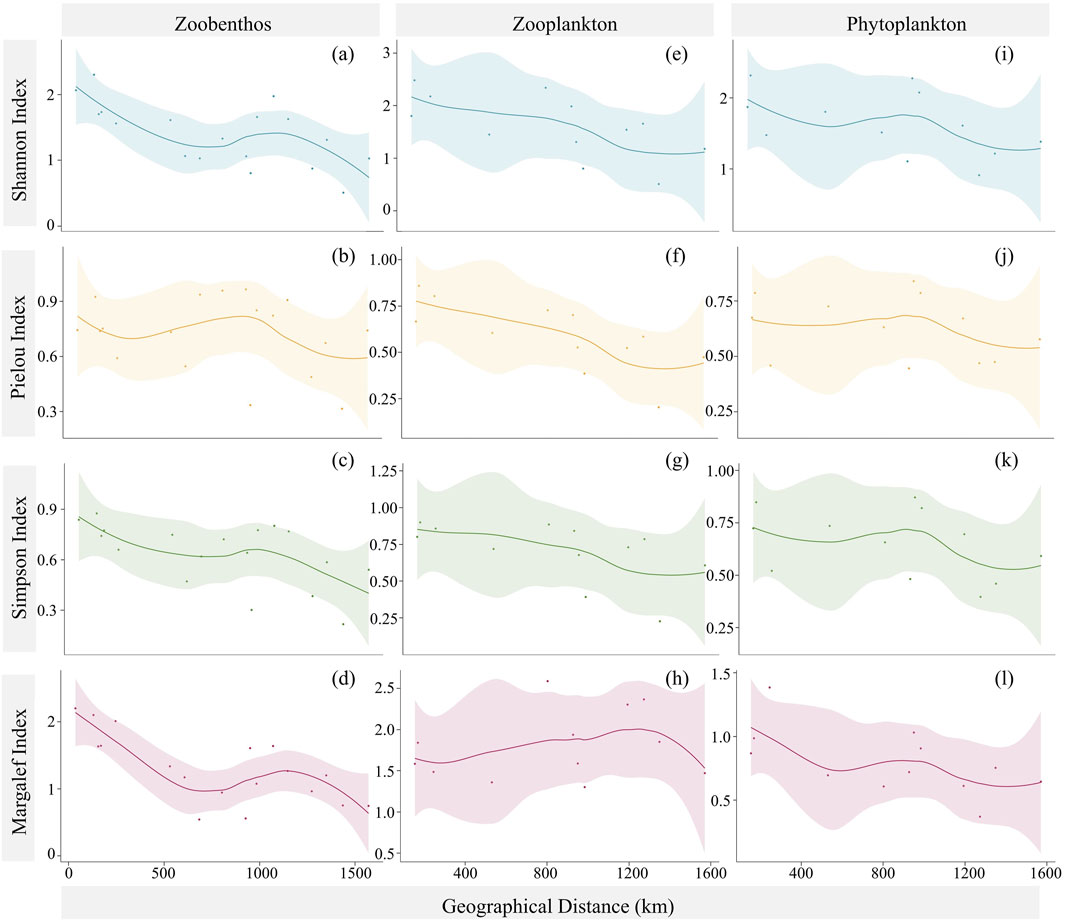
Figure 4. Spatial distribution of local diversity of (A–D) zoobenthos, (E–H) zooplankton, and (I–L) phytoplankton. (A, E, I) are Shannon–Wiener indexes; (B, F, J) are Pielou indexes; (C, G, K) are Simpson indexes; (D, H, L) are Margalef indexes.
The maximum Shannon–Wiener indexes for zoobenthos, phytoplankton, and zooplankton occurred at S2 (2.30), S12 (2.60), and S4 (2.61), respectively, and the minimum occurred at S17 (0.88), S17 (0.94), and S18 (0.51), respectively. Normally, a higher Shannon–Wiener index indicates higher biodiversity at the sampling site. Similar to the Shannon–Wiener index, the maximum Simpson indexes for zoobenthos, phytoplankton, and zooplankton occurred at S2 (0.88), S12 (0.90), and S4 (0.91), respectively, and the minimum occurred at S19 (0.22), S17 (0.40), and S18 (0.22), respectively. The Simpson index indicates higher diversity with larger values and emphasizes the relative abundance of dominant species. The maximum Pielou indexes for the three types of aquatic organisms were found at S11 (0.97), S12 (0.84), and S4 (0.86), respectively, while the minimum were at S19 (0.32), S11 (0.44), and S18 (0.20), respectively. Unlike the Shannon–Wiener index and Simpson index, the Pielou index measures the evenness of species distribution, with higher values indicating a more even distribution. We also found that the maximum Margalef indexes for the three types of aquatic organisms occurred at S1 (2.20), S12 (1.55), and S10 (2.59), respectively. The minimum indexes occurred at S9 (0.54), S17 (0.43), and S13 (1.30), respectively. The Margalef index considers the number of species and the total number of individuals at the sampling site, with larger values indicating a site with fewer individuals but more species. Overall, the mean diversity indexes of the three types of aquatic organisms showed a geographical pattern of being highest upstream, followed by the midstream, and lowest downstream.
Figure 5 shows the results of zoobenthos, zooplankton, and phytoplankton resilience. The resilience of zoobenthos and zooplankton showed an obvious trend of higher values upstream compared with downstream, while the resilience of phytoplankton did not show significant variations. Excluding the reference site, the resilience of zoobenthos ranged from 0.46 to 0.98 and had an average value of 0.77, while the resilience of zooplankton ranged from 0.20 to 0.90, with an average value of 0.62. We also calculated the resilience of phytoplankton which varied within the range of 0.38–0.96 and had an average value of 0.70. The results indicated that the biodiversity loss due to disturbance is greatest for zooplankton, followed by phytoplankton, and the least for zoobenthos. We found that the maximum resilience value always occurred upstream and the minimum resilience value always occurred downstream. For instance, the maximum resilience values of zoobenthos and zooplankton were found at S3 and S10, respectively, while the minimum values were found at S12 and S18, respectively.

Figure 5. The spatial variation of resilience (RSL).
However, significant differences were observed in the resilience values of the three types of aquatic organisms. At S12, the resilience value of zoobenthos was 0.46, indicating low resilience, while the resilience value of phytoplankton was 0.96, indicating high resilience. Thus, the resilience of a single type of aquatic organism could not reflect the real status of ecosystem resilience. On the basis of the variability of the three aspects of resilience, comprehensive resilience was adopted to represent the state of ecosystem resilience. Comprehensive resilience ranged from 0.48 to 0.82, showing a pattern of higher values upstream compared with downstream. This indicated that upstream experienced lower disturbance intensity compared with downstream.
Figure 6 shows the resistance results of the three types of aquatic organisms and there is an obvious decreasing trend from upstream to downstream. The average resistance of zoobenthos, zooplankton, and phytoplankton were 0.57, 0.53, and 0.50, respectively. Although the average resistance of the three types of aquatic organisms was relatively similar, there were substantial discrepancies among different types of aquatic organisms at the same sampling site, especially downstream. Different types of aquatic organisms showed varying sensitivities to disturbance, resulting in changes in biodiversity and resistance. Therefore, we adopted the measure of comprehensive resistance which ranged from 0.21 to 0.98 and had an average of 0.53. Comprehensive resistance showed a decreasing trend from upstream to downstream, similar to the pattern of resilience. The results suggested that the intensity of disturbance was lower upstream compared with downstream.
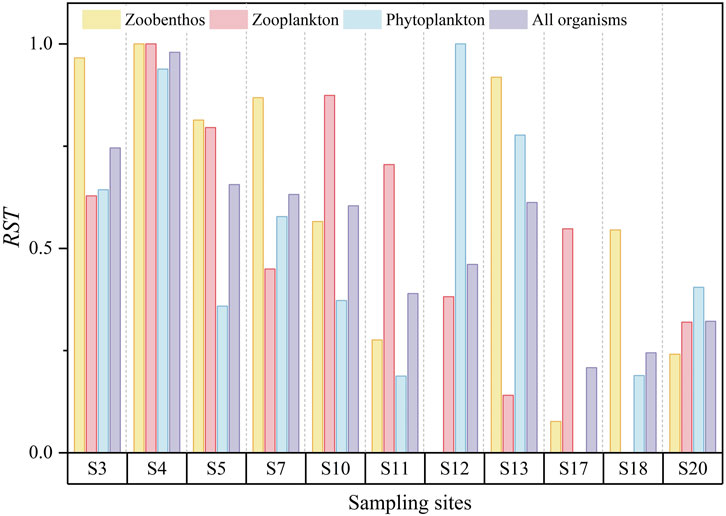
Figure 6. The spatial variation of resistance (RST).
Comprehensive resilience and resistance showed a significant correlation with each other (r = 0.99) (Figure 7). The main environmental factors that affected resilience and resistance were TN, TP, EC, and DO. Among them, comprehensive resilience was positively correlated with TN (r = 0.71), TP (r = 0.66), and DO (r = 0.72), while it was negatively correlated with EC (r = −0.77). Similarly, comprehensive resistance was positively correlated with TN (r = 0.69), TP (r = 0.67), and DO (r = 0.72), while it was negatively correlated with EC (r = −0.74).
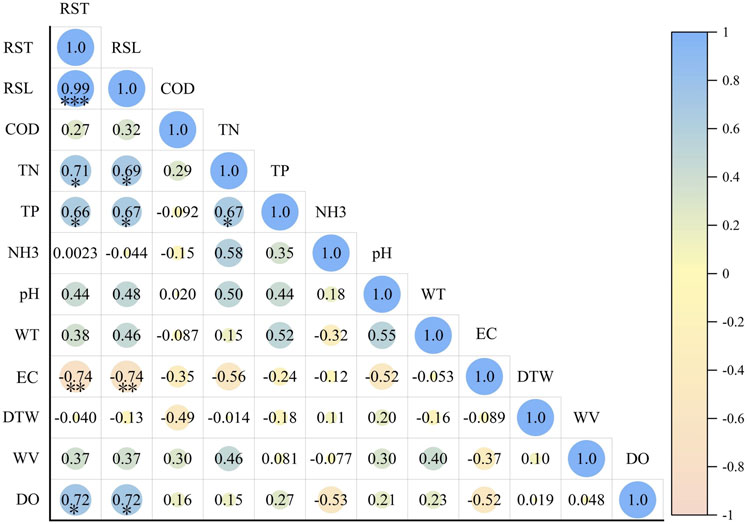
Figure 7. The correlation between resilience, resistance, and the environmental factors.
The RDA model showed a significant relationship overall between internal and the spatial distribution of zoobenthos, zooplankton, and phytoplankton (P < 0.05) (Figure 8). The spatial distribution of zoobenthos was affected by six environmental factors, including DO, TN, WV, TP, EC, and WT. The distribution of Mollusca was positively correlated with EC, and the distribution of Arthropoda was positively correlated with WV. The first and second axes explained 56.16% and 3.94% of the variation in the zoobenthos distribution, respectively. TN, TP, EC, DTW, WV, and DO were the main environmental factors affecting the distribution of zooplankton with the first and second RDA axes explaining 64.39% and 14.51% of the community variation, respectively. EC, DTW, and WV explained significant proportions of the total variation in the zooplankton community, with Protozoa mainly influenced positively by DTW and WV and negatively influenced by EC. The environmental factors affecting phytoplankton biomass were relatively numerous, with the first and second axes explaining 64.72% and 15.28% of the community variation, respectively. The distribution of Bacillariophyta was positively correlated with TN, TP, and pH. Among the various environmental factors, EC, DO, and TP were the main factors affecting the communities of the three types of aquatic organisms.
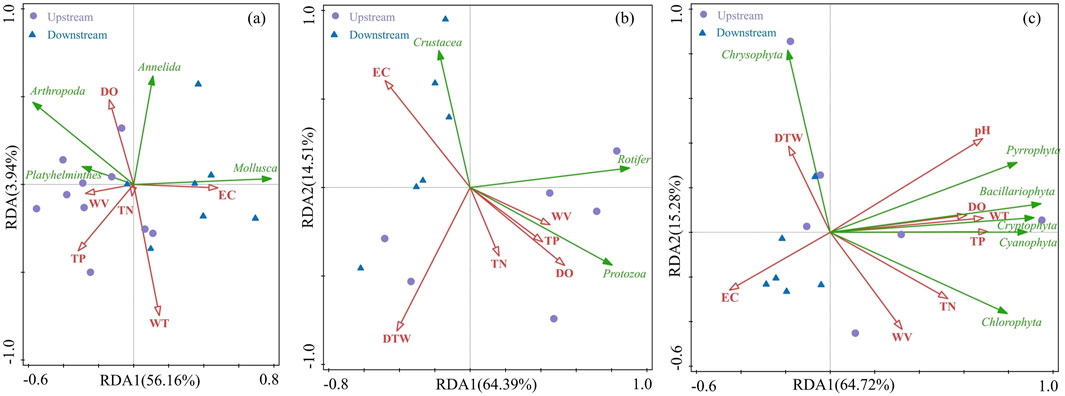
Figure 8. Key environmental factors explaining the distribution of (A) zoobenthos, (B) zooplankton, and (C) phytoplankton identified using RDA.
On the basis of the RDA results and the Pearson correlation analysis results between resilience, resistance, and environmental factors, we selected TP, EC, and DO as the three main environmental factors. Through the urbanization level, precipitation, dam construction, and the selected environmental factors, the SEM explained 96.7% and 93.5% of the spatial variation in resilience and resistance, respectively (Figure 9). The model’s Goodness of Fit Index (GFI) and Comparative fit index (CFI) were greater than 0.95, and the Standardized Root Mean Square Residual (SRMR) was equal to 0.05, indicating a good fit. Urbanization level, hydraulic engineering construction, and precipitation had significant negative impacts on ecosystem stability, and urbanization was the most influential factor. Moreover, hydraulic engineering could indirectly affect resilience and resistance by altering environmental variables. Of all the environmental factors, TP was the most significant factor with an impact coefficient of 0.729 on resilience and 0.811 on resistance. The elevations of TP, DO, and EC contributed to enhancing the ecosystem stability, which was characterized by high resilience and high resistance.
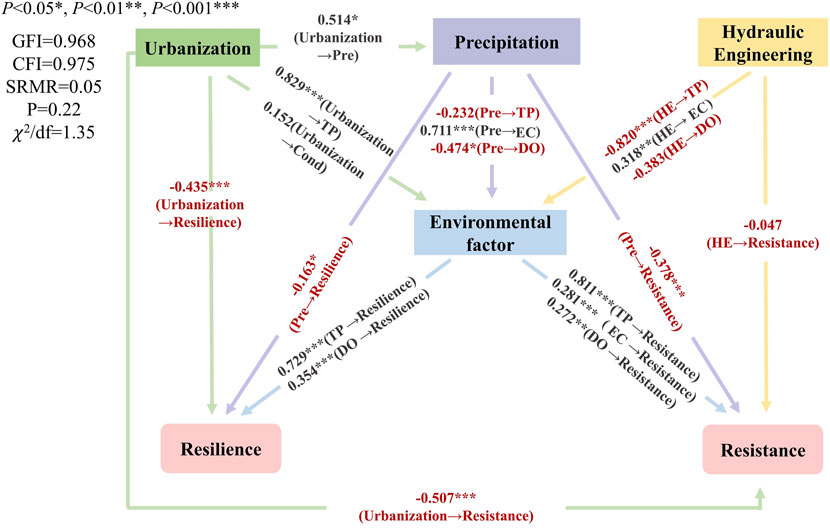
Figure 9. The structural equation model showing the relationships between urbanization, precipitation, hydraulic engineering, environmental factors, resilience, and resistance.
Quantifying ecosystem stability is vital for sustainable ecosystem management. In this study, we applied the methods for calculating the resilience and resistance of terrestrial ecosystems to river ecosystems and used changes in biodiversity to reflect the stability of river ecosystem. Considering the continuity of river ecosystems, we redefined resilience and resistance. Resilience indicates the ability of an ecosystem to recover to its original state after disturbance. In this study, it referred to the difference in biodiversity between other sampling sites and the reference site. Resistance usually refers to the ability of an ecosystem to withstand external disturbances while maintaining its structure and function (Domínguez-García et al., 2019). We used the range of biodiversity changes as a measure of sensitivity to quantify resistance. Correlation analysis results in 3.4 showed a positive relationship between resilience and resistance (r = 0.99), indicating that for an ecosystem, the smaller the degree of recovery needed, the stronger its resistance when disturbed (Domínguez-García et al., 2019). Interestingly, we found that sampling sites with high resilience and high resistance always occurred upstream (S3 and S4) rather than downstream (S18 and S20). This aligned with the general trend that upstream areas typically have better natural environments and experience less human interference compared with downstream (Wang J. et al., 2021).
We proposed a comprehensive method for evaluating resilience and resistance to disturbance based on biodiversity. In previous studies, the stability of river ecosystems was calculated based on the biomass variation of a single species. However, in our study, we found that the average resilience value calculated using zoobenthos was 0.77, which was higher than the values obtained using phytoplankton and zooplankton, at 0.70 and 0.62, respectively. Interestingly, a similar pattern was observed in the results of resistance. The average resistance value calculated using zoobenthos was 0.57, which also exceed the values for phytoplankton and zooplankton, at 0.50 and 0.53, respectively. This indicates that the diversity of zoobenthos exhibits smaller variations compared to phytoplankton and zooplankton. We speculate that this may be related to the differences in the mobility of species. Most of the zoobenthos we collected during this period were aquatic insects belonging to Diptera, Ephemeroptera, and Trichoptera. In spring with subtropical regions, these insects are predominantly in their aquatic larval stage, with limited movement confined to river channels and relatively weak migration and reproductive capacities (Krajenbrink et al., 2019). However, during the summer, they develop into terrestrial adults with enhanced aerial migration capabilities, allowing them to travel long distances by flight (Li et al., 2023).
Moreover, we also found that there are differences in the resilience and resistance of different types of aquatic organisms at the same point. At S13, the resistance calculated using zooplankton was 0.14 while the value for zoobenthos and phytoplankton was 0.92 and 0.78, respectively. Similarly, at S18, the resilience calculated using zooplankton was 0.20 while the value for zoobenthos and phytoplankton was 0.76 and 0.50, respectively. These results supported the notion that the ecosystem stability cannot be assessed solely based on a single type of organism. Therefore, when using biodiversity to quantify resilience and resistance, it is essential to select types of aquatic organisms from different trophic levels to comprehensively reflect the status of the ecosystem.
The results of SEM revealed that urbanization and hydraulic engineering in human activities, as well as precipitation among climatic factors, not only directly affect ecosystem resilience and resistance but also exert indirect impacts by altering internal variables of river ecosystem. Moreover, urbanization was the most significant factor affecting ecosystem stability with a direct impact coefficient of 0.435 on resilience and 0.507 on resistance. Urbanization-driven changes in land use will alter the nature and structure of the underlying surface. Following up, increased impermeable surfaces reduce vegetation cover along the river, leading to increased surface runoff that carries non-point source pollutants into the river, thereby resulting in the deterioration of water quality (Liao et al., 2018). Our results showed that increasing urbanization levels can increase nutrient levels (TP) in the river which is one of the main environmental factors influencing phytoplankton biomass, particularly affecting Bacillariophyta. Excessive nutrient inputs can lead to eutrophication, causing rapid proliferation of phytoplankton and the formation of algal blooms, which result in oxygen depletion in the water environment and mass mortality of other aquatic organisms (Andersen et al., 2020; dos Santos et al., 2023). In the downstream of the Han River, Bacillariophyta is the dominant species and the frequent occurrence of Bacillariophyta blooms is one of the most prominent ecological problems (Xin et al., 2020). Therefore, nutrient emissions caused by urbanization should be controlled to prevent algal blooms. Also, correlation analysis results showed that urbanization was negatively correlated with the biomass, abundance, and richness of the three types of aquatic organisms. In this study, we did not find any zoobenthos at site 16 which surrounded by extremely high urbanization levels. Previous studies indicated that increasing urbanization levels could reduce species richness. Yang et al. (2022) found that in the Houxi River increasing urbanization levels could significantly reduce phytoplankton species richness and resource use efficiency. Yang et al. (2024) and Qiao et al. (2022) also found that increasing the level of urbanization decreased the taxonomic diversity and functional diversity of fishes. These results are consistent with our findings because the richness and diversity of the three types of aquatic organisms decreased with increasing urbanization levels in the Han River.
The construction of dams also affects the level of nutrients in rivers because hydraulic engineering alters the hydrodynamic conditions of water, limiting the transport of nutrients from upstream to downstream (Maavara et al., 2020). We found that the construction of reservoirs in the Han River increased the retention of TP, leading to a decrease in TP fluxes downstream. For example, the average TP content of the sampling sites below the Danjiangkou Reservoir was 0.026 mg/L, which was only half of that upstream. Moreover, the construction of dams also fragments river integrity, alters hydrological conditions, and affects aquatic community structure (Cheng et al., 2015). Around reservoirs and dams with lower flow velocity, a large number of Chironomidae and Oligochaeta species, which prefer still water, appeared. Results in 3.1 and 3.2 showed that the upstream of the Han River, with fast flow and high DO, created a suitable living environment for Ephemeroptera, Plecoptera, Trichoptera (EPT) taxa. Therefore, EPT taxa were mostly found in sampling sites near the headwater without reservoir construction. In addition to the cascade reservoirs, the operation of water diversion projects along the Han River has changed the hydrological factors, exacerbating environmental pollution. Hydrological factors such as flow velocity and discharge can directly influence aquatic organisms and can indirectly disrupt community structure by affecting habitats, thus influencing the ecosystem stability (Descy et al., 2017). Therefore, the impacts of these hydrological factors on resilience and resistance should be considered.
Besides human activities, changes in climatic conditions can also affect ecosystem stability. Increased precipitation leads to higher river velocity and flow, enhancing water exchange and diffusion, which in turn introduces organic pollutants such as nitrogen and phosphorus from the land into the river (Liu et al., 2024b). As a result, the levels of DO, nutrients, and conductivity decrease (Liu Y. et al., 2024). However, this depletion tends to be in excess of nutrient inputs (Smith, 2003). Therefore, increased precipitation negatively impacts the diversity of aquatic organisms, and reduces ecosystem stability. Our findings are consistent with the findings of Kim et al. (2016). Our findings were also related to the severe non-point source pollution in the Han River. Pollutants from non-point sources, such as fertilizers used in agricultural production and heavy metals emitted from vehicle exhaust, are washed into the river by rain and snowmelt runoff, leading to a deterioration in water quality and aquatic biodiversity loss (Sadiqi et al., 2024).
Unraveling how ecosystem stability responds to external variables, such as human activities and climatic factors, is beneficial for the conservation and restoration of river ecosystems. Our findings support the adoption of targeted management strategies based on the resilience and resistance mechanisms to human activities, precipitation, and water quality parameters. For instance, we found that urbanization is the most significant factors affecting ecosystem stability. To reduce urbanization-induced changes in the natural shape of riparian zones, restoring river morphology should follow the “bend where appropriate” principle. Additionally, we can reduce artificial water barriers and expand habitat areas for aquatic organisms to maintain ecosystem stability. Reintroduce large aquatic plants can address biodiversity loss from urbanization and dam construction and enhance the self-purification capacity of rivers as they can not only absorb heavy metals and pollutants but also provide essential habitats (Favas et al., 2018; Xiao et al., 2021).
Moreover, our results indicate that TP is also an important factor influencing ecosystem stability, and the input of non-point source pollution in rivers can lead to elevated TP concentration. Thus, to manage non-point source pollution caused by runoff from rainfall, which is closely related to land use and urban domestic and industrial water use, it is necessary to control urban sewage discharge and the rate of urban expansion to maintain good water quality.
We also found that hydraulic engineering increases nutrient accumulation in reservoir areas and reduces nutrient levels in the lower reaches of rivers, which may lead to algal blooms. Therefore, we suggest improving river flow velocity in reservoir areas and reducing nitrogen and phosphorus loads. In the Han River, the abundance and biomass of toxic cyanobacteria, such as Microcystis, are extremely high. Their toxins, however, can affect water safety, necessitating the monitoring of toxic cyanobacteria trends to ensure the safety of drinking water.
In this study, we proposed a novel and comprehensive method based on the diversity of zoobenthos, zooplankton, and phytoplankton to evaluate the resilience and resistance of river ecosystems. We examined how external variables such as human disturbances, climatic factors, and internal variables affect the stability of river ecosystems. The main outcomes are:
(1) Significant differences were observed in driving factors such as pH, EC, urbanization level, and vertical connectivity between upstream and downstream. The diversity of zoobenthos, zooplankton, and phytoplankton showed a geographical pattern where diversity was higher upstream compared with downstream.
(2) Compared with the upstream, the comprehensive resilience of the downstream decreased by 49.38% and the comprehensive resistance decreased by 8.2%, suggesting that stability, gradually decreased from upstream to downstream.
(3) Ecosystem resilience and resistance were negatively affected by external variables, including urbanization, precipitation, and dam construction, with urbanization having the most significant impact. Among the internal factors, increases in TP, DO, and EC contributed to enhancing ecosystem stability.
The original contributions presented in the study are included in the article/supplementary material, further inquiries can be directed to the corresponding author.
ZY: Data curation, Formal Analysis, Methodology, Writing–original draft. QF: Conceptualization, Writing–review and editing. SZ: Funding acquisition, Supervision, Writing–review and editing. CW: Data curation, Writing–review and editing. LW: Methodology, Writing–review and editing.
The author(s) declare that financial support was received for the research, authorship, and/or publication of this article. This research was supported by the National Key Research and Development Program of China (2022YFC3202003) and the National Natural Science Foundation of China (52379065).
We thank Leonie Seabrook, PhD, Liwen Bianji (Edanz) (www.liwenbianji.cn), for editing the language of a draft of this manuscript.
The authors declare that the research was conducted in the absence of any commercial or financial relationships that could be construed as a potential conflict of interest.
The author(s) declare that no Generative AI was used in the creation of this manuscript.
All claims expressed in this article are solely those of the authors and do not necessarily represent those of their affiliated organizations, or those of the publisher, the editors and the reviewers. Any product that may be evaluated in this article, or claim that may be made by its manufacturer, is not guaranteed or endorsed by the publisher.
Andersen, I. M., Williamson, T. J., González, M. J., and Vanni, M. J. (2020). Nitrate, ammonium, and phosphorus drive seasonal nutrient limitation of chlorophytes, cyanobacteria, and diatoms in a hyper-eutrophic reservoir. Limnol. Oceanogr. 65, 962–978. doi:10.1002/lno.11363
Baho, D. L., Drakare, S., Johnson, R. K., Allen, C. R., and Angeler, D. G. (2014). Similar resilience attributes in lakes with different management practices. PLOS One 9, e91881. doi:10.1371/journal.pone.0091881
Behboudian, M., and Kerachian, R. (2021). Evaluating the resilience of water resources management scenarios using the evidential reasoning approach: the Zarrinehrud river basin experience. J. Environ. Manag. 284, 112025. doi:10.1016/j.jenvman.2021.112025
Blaszczak, J. R., Yackulic, C. B., Shriver, R. K., and Hall, R. O. (2023). Models of underlying autotrophic biomass dynamics fit to daily river ecosystem productivity estimates improve understanding of ecosystem disturbance and resilience. Ecol. Lett. 26, 1510–1522. doi:10.1111/ele.14269
Cheng, F., Li, W., Castello, L., Murphy, B. R., and Xie, S. (2015). Potential effects of dam cascade on fish: lessons from the Yangtze River. Rev. Fish. Biol. Fish. 25, 569–585. doi:10.1007/s11160-015-9395-9
Connell, S. D., and Ghedini, G. (2015). Resisting regime-shifts: the stabilising effect of compensatory processes. Trends Ecol. Evol. 30, 513–515. doi:10.1016/j.tree.2015.06.014
Descy, J.-P., Darchambeau, F., Lambert, T., Stoyneva-Gaertner, M. P., Bouillon, S., and Borges, A. V. (2017). Phytoplankton dynamics in the Congo river. Freshw. Biol. 62, 87–101. doi:10.1111/fwb.12851
de Bello, F., Lavorel, S., Hallett, L. M., Valencia, E., Garnier, E., Roscher, C., et al. (2021). Functional trait effects on ecosystem stability: assembling the jigsaw puzzle. Trends Ecol. Evol. 36, 822–836. doi:10.1016/j.tree.2021.05.001
de Vries, F. T., Liiri, M. E., Bjørnlund, L., Bowker, M. A., Christensen, S., Setälä, H. M., et al. (2012). Land use alters the resistance and resilience of soil food webs to drought. Nat. Clim. Change 2, 276–280. doi:10.1038/nclimate1368
Domínguez-García, V., Dakos, V., and Kéfi, S. (2019). Unveiling dimensions of stability in complex ecological networks. Proc. Natl. Acad. Sci. 116, 25714–25720. doi:10.1073/pnas.1904470116
Donohue, I., Hillebrand, H., Montoya, J. M., Petchey, O. L., Pimm, S. L., Fowler, M. S., et al. (2016). Navigating the complexity of ecological stability. Ecol. Lett. 19, 1172–1185. doi:10.1111/ele.12648
dos Santos, N. G., Santos, E. F., Morari, P. H. R., Chiarelli, L. J., and Castilho-Noll, M. S. M. (2023). Total nitrogen and pH are key variables for functional structure of zooplanktonic communities in an agropastoral landscape. Sci. Total Environ. 891, 164031. doi:10.1016/j.scitotenv.2023.164031
Fan, X., Hao, X., Hao, H., Zhang, J., and Li, Y. (2021). Comprehensive assessment indicator of ecosystem resilience in central asia. Water 13, 124. doi:10.3390/w13020124
Favas, P. J. C., Pratas, J., Rodrigues, N., D’Souza, R., Varun, M., and Paul, M. S. (2018). Metal(loid) accumulation in aquatic plants of a mining area: potential for water quality biomonitoring and biogeochemical prospecting. Chemosphere 194, 158–170. doi:10.1016/j.chemosphere.2017.11.139
Jaiswal, D., and Pandey, J. (2021). River ecosystem resilience risk index: a tool to quantitatively characterize resilience and critical transitions in human-impacted large rivers. Environ. Pollut. 268, 115771. doi:10.1016/j.envpol.2020.115771
Jiang, Y., Gui, H., Li, C., Chen, J., Chen, C., wang, C., et al. (2021). Evaluation of the difference in water quality between urban and suburban rivers based on self-organizing map. Acta geophys. 69, 1855–1864. doi:10.1007/s11600-021-00631-4
Khatri, N., Raval, K., and Jha, A. K. (2021). Integrated water quality monitoring of Mahi river using benthic macroinvertebrates and comparison of its biodiversity among various stretches. Appl. Water Sci. 11, 143. doi:10.1007/s13201-021-01451-z
Kim, H.-G., Lee, D.-J., Yoon, C.-S., and Cheong, S.-W. (2016). Assessing biodiversity of benthic macroinvertebrates and influences of several environmental factors on the community structure in upo wetland by long-term ecological monitoring. J. Environ. Sci. Int. 25, 459–472. doi:10.5322/JESI.2016.25.4.459
Krajenbrink, H. J., Acreman, M., Dunbar, M. J., Hannah, D. M., Laizé, C. L. R., and Wood, P. J. (2019). Macroinvertebrate community responses to river impoundment at multiple spatial scales. Sci. Total Environ. 650, 2648–2656. doi:10.1016/j.scitotenv.2018.09.264
Kumar, R., Kumari, R., Prasad, C., Tiwari, V., Singh, N., Mohapatra, S., et al. (2020). Phytoplankton diversity in relation to physicochemical attributes and water quality of Mandakini River, Garhwal Himalaya. Environ. Monit. Assess. 192, 799. doi:10.1007/s10661-020-08768-3
Li, F., Altermatt, F., Yang, J., An, S., Li, A., and Zhang, X. (2020). Human activities’ fingerprint on multitrophic biodiversity and ecosystem functions across a major river catchment in China. Glob. Change Biol. 26, 6867–6879. doi:10.1111/gcb.15357
Li, S., Gu, S., Liu, W., Han, H., and Zhang, Q. (2008). Water quality in relation to land use and land cover in the upper Han River Basin, China. Catena 75, 216–222. doi:10.1016/j.catena.2008.06.005
Li, Z., Jiang, X., and Wang, J. (2023). Species diversity and maintenance mechanisms of macroinvertebrates in the water source area of the middle route of the South-to-North Water Diversion Project. J. Lake Sci. 35 (6), 2059–2070. doi:10.18307/2023.0634
Li, Z., Wang, J., Liu, Z., Meng, X., Heino, J., Jiang, X., et al. (2019). Different responses of taxonomic and functional structures of stream macroinvertebrate communities to local stressors and regional factors in a subtropical biodiversity hotspot. Sci. Total Environ. 655, 1288–1300. doi:10.1016/j.scitotenv.2018.11.222
Liao, K., Bai, Y., Huo, Y., Jian, Z., Hu, W., Zhao, C., et al. (2018). Integrating microbial biomass, composition and function to discern the level of anthropogenic activity in a river ecosystem. Environ. Int. 116, 147–155. doi:10.1016/j.envint.2018.04.003
Liu, B., Wu, J., Hu, Y., Wang, G., and Chen, Y. (2022). Seven years study of the seasonal dynamics of zooplankton communities in a large subtropical floodplain ecosystem: a test of the peg model. Int. J. Environ. Res. Public Health 19, 956. doi:10.3390/ijerph19020956
Liu, X., Pan, B., Liu, X., He, H., Zhao, X., Huang, Z., et al. (2024a). Riverine microbial community assembly with watercourse distance–decay patterns in the north–south transitional zone of China. J. Hydrology 628, 130603. doi:10.1016/j.jhydrol.2023.130603
Liu, X., Yang, W., Fu, X., and Li, X. (2024b). Determination of the ecological water levels in shallow lakes based on regime shifts: a case study of China’s Baiyangdian Lake. Ecohydrol. and Hydrobiology 24, 931–943. doi:10.1016/j.ecohyd.2023.08.014
Liu, Y., Guo, W., Wei, C., Huang, H., Nan, F., Liu, X., et al. (2024c). Rainfall-induced changes in aquatic microbial communities and stability of dissolved organic matter: insight from a Fen river analysis. Environ. Res. 246, 118107. doi:10.1016/j.envres.2024.118107
Lv, H., Yang, J., Liu, L., Yu, X., Yu, Z., and Chiang, P. (2014). Temperature and nutrients are significant drivers of seasonal shift in phytoplankton community from a drinking water reservoir, subtropical China. Environ. Sci. Pollut. Res. 21, 5917–5928. doi:10.1007/s11356-014-2534-3
Ma, Y., Yu, Z., Jia, S., Wu, N., Yin, K., Wang, Y., et al. (2023). Multiple anthropogenic stressors influence the taxonomic and functional homogenization of macroinvertebrate communities on the mainstream of an urban-agricultural river in China. J. Environ. Manag. 341, 118017. doi:10.1016/j.jenvman.2023.118017
Maavara, T., Chen, Q., Van Meter, K., Brown, L. E., Zhang, J., Ni, J., et al. (2020). River dam impacts on biogeochemical cycling. Nat. Rev. Earth Environ. 1, 103–116. doi:10.1038/s43017-019-0019-0
Mirauda, D., Caniani, D., Colucci, M. T., and Ostoich, M. (2021). Assessing the fluvial system resilience of the river Bacchiglione to point sources of pollution in Northeast Italy: a novel Water Resilience Index (WRI) approach. Environ. Sci. Pollut. Res. 28, 36775–36792. doi:10.1007/s11356-021-13157-5
Moi, D. A., Lansac-Tôha, F. M., Romero, G. Q., Sobral-Souza, T., Cardinale, B. J., Kratina, P., et al. (2022). Human pressure drives biodiversity–multifunctionality relationships in large Neotropical wetlands. Nat. Ecol. Evol. 6, 1279–1289. doi:10.1038/s41559-022-01827-7
Qiao, J., Liu, Y., Fu, H., Chu, L., and Yan, Y. (2022). Urbanization affects the taxonomic and functional alpha and beta diversity of fish assemblages in streams of subtropical China. Ecol. Indic. 144, 109441. doi:10.1016/j.ecolind.2022.109441
Sadiqi, S. S. J., Nam, W.-H., Lim, K.-J., and Hong, E. (2024). Investigating nonpoint source and pollutant reduction effects under future climate scenarios: a SWAT-based study in a highland agricultural watershed in korea. Water 16, 179. doi:10.3390/w16010179
Schirpke, U., Kohler, M., Leitinger, G., Fontana, V., Tasser, E., and Tappeiner, U. (2017). Future impacts of changing land-use and climate on ecosystem services of mountain grassland and their resilience. Ecosyst. Serv. 26, 79–94. doi:10.1016/j.ecoser.2017.06.008
Smith, V. H. (2003). Eutrophication of freshwater and coastal marine ecosystems a global problem. Environ Sci and Pollut Res 10, 126–139. doi:10.1065/espr2002.12.142
Uchida, K., Blakey, R. V., Burger, J. R., Cooper, D. S., Niesner, C. A., and Blumstein, D. T. (2021). Urban biodiversity and the importance of scale. Trends Ecol. and Evol. 36, 123–131. doi:10.1016/j.tree.2020.10.011
Wang, J., Chen, L., Tang, W., Heino, J., and Jiang, X. (2021). Effects of dam construction and fish invasion on the species, functional and phylogenetic diversity of fish assemblages in the Yellow River Basin. J. Environ. Manag. 293, 112863. doi:10.1016/j.jenvman.2021.112863
Wang, S., Isbell, F., Deng, W., Hong, P., Dee, L. E., Thompson, P., et al. (2021). How complementarity and selection affect the relationship between ecosystem functioning and stability. Ecology 102, e03347. doi:10.1002/ecy.3347
Wang, X., and Tan, X. (2017). Macroinvertebrate community in relation to water quality and riparian land use in a substropical mountain stream, China. Environ. Sci. Pollut. Res. 24, 14682–14689. doi:10.1007/s11356-017-9042-1
Whitfield, A. K., and Elliott, M. (2002). Fishes as indicators of environmental and ecological changes within estuaries: a review of progress and some suggestions for the future. J. Fish Biol. 61, 229–250. doi:10.1111/j.1095-8649.2002.tb01773.x
Xiao, H., Jia, J., Chu, Q., and Liu, L. (2021). Effect of river ecological restoration by symbiotic system of aquatic plants. IOP Conf. Ser. Earth Environ. Sci. 621, 012086. doi:10.1088/1755-1315/621/1/012086
Xin, X., Zhang, H., Lei, P., Tang, W., Yin, W., Li, J., et al. (2020). Algal blooms in the middle and lower Han River: characteristics, early warning and prevention. Sci. Total Environ. 706, 135293. doi:10.1016/j.scitotenv.2019.135293
Xu, X., Su, G., Zhang, P., Wang, T., Zhao, K., Zhang, H., et al. (2023). Effects of multiple environmental stressors on zoobenthos communities in shallow lakes: evidence from a mesocosm experiment. Animals 13, 3722. doi:10.3390/ani13233722
Yang, B., Qu, X., Liu, H., Yang, M., Xin, W., Wang, W., et al. (2024). Urbanization reduces fish taxonomic and functional diversity while increases phylogenetic diversity in subtropical rivers. Sci. Total Environ. 908, 168178. doi:10.1016/j.scitotenv.2023.168178
Keywords: resilience, resistance, human activities, precipitation, aquatic organisms
Citation: Yue Z, Fang Q, Zhang S, Wu C and Wang L (2025) A novel approach to integrating the stability of river ecosystem and its driving factors. Front. Environ. Sci. 13:1524086. doi: 10.3389/fenvs.2025.1524086
Received: 08 November 2024; Accepted: 12 February 2025;
Published: 04 March 2025.
Edited by:
Ovie Edegbene, Federal University of Health Sciences Otukpo, NigeriaReviewed by:
Tan Lu, Chinese Academy of Sciences (CAS), ChinaCopyright © 2025 Yue, Fang, Zhang, Wu and Wang. This is an open-access article distributed under the terms of the Creative Commons Attribution License (CC BY). The use, distribution or reproduction in other forums is permitted, provided the original author(s) and the copyright owner(s) are credited and that the original publication in this journal is cited, in accordance with accepted academic practice. No use, distribution or reproduction is permitted which does not comply with these terms.
*Correspondence: Shanghong Zhang, emhhbmdzaDkyOEAxMjYuY29t
Disclaimer: All claims expressed in this article are solely those of the authors and do not necessarily represent those of their affiliated organizations, or those of the publisher, the editors and the reviewers. Any product that may be evaluated in this article or claim that may be made by its manufacturer is not guaranteed or endorsed by the publisher.
Research integrity at Frontiers
Learn more about the work of our research integrity team to safeguard the quality of each article we publish.