 Ying Chen
 Donglin Chen
 Chenfeng Gao
 Xiaochao Wei
95% of researchers rate our articles as excellent or good
Learn more about the work of our research integrity team to safeguard the quality of each article we publish.
Find out more
ORIGINAL RESEARCH article
Front. Environ. Sci. , 20 February 2025
Sec. Environmental Policy and Governance
Volume 13 - 2025 | https://doi.org/10.3389/fenvs.2025.1519286
This article is part of the Research Topic Urban Carbon Emissions and Anthropogenic Activities View all 17 articles
Introduction: In the era of the booming digital economy and global efforts to reduce carbon emissions, this study investigates how digital economy growth impacts indirect household carbon emissions (IHCEs). Understanding this relationship is critical, as the digital economy has the potential to both drive and mitigate carbon emissions, depending on its stage of development and regional context.
Methods: Using panel data from the 2014–2018 China Family Panel Studies (CFPS), a fixed effects model is applied to analyze the relationship between digital economy growth and IHCEs. The study examines regional variations, levels of digital economy development, and consumption categories to identify heterogeneous effects.
Results: The findings reveal an inverted U-shaped relationship between the digital economy and IHCEs. Initially, IHCEs rise due to increased consumption of energy-intensive products, but as digital technologies mature, emissions decline due to improved efficiency and sustainable consumption. Heterogeneity analysis shows that the inverted U-shaped relationship is more pronounced in less developed digital economy regions, while in advanced regions, the relationship is less significant. Regionally, the eastern region, with its advanced infrastructure and green technologies, effectively curbs IHCEs, whereas the central region experiences increased emissions, and the western region exhibits the inverted U-shaped pattern. In terms of consumption, the digital economy significantly impacts housing and food-related emissions, while other categories show mixed or minor effects.
Discussion: These findings highlight the dual role of the digital economy in both driving and mitigating carbon emissions. Policymakers should adopt region-specific strategies, invest in digital infrastructure, and promote sustainable consumption practices to leverage the digital economy for carbon reduction. The study underscores the importance of managing expectations and addressing discrepancies between digital economy growth and its environmental impacts, offering valuable insights for achieving sustainable development goals.
Consumer consumption activities play a major role in global warming, responsible for nearly 70% of the greenhouse gases emitted from household use (Ma et al., 2022). In several Western countries, household carbon emissions account for 70%–80% of total emissions across all sectors (Hertwich and Peters, 2009; Baiocchi et al., 2010), while in China, residential consumption contributes to over 50% of total carbon emissions. Therefore, understanding and mitigating carbon emissions from household consumption is critical for achieving global emission reduction targets and ensuring sustainable development. Given the rapid economic growth and rising living standards, household carbon emissions in China are expected to continue increasing, highlighting the urgency of addressing this issue. (Sharif et al., 2019).
China’s digital economy has experienced rapid growth, reaching a valuation of 53.9 trillion yuan in 2023—a 3.7 trillion yuan increase from the previous year—and accounting for over 42.8% of the national GDP, according to the 2024 Development Report on China’s Digital Economy by the China Academy of Information and Communication Technology. This expansion has not only lowered the costs of economic activities and improved operational efficiency but also significantly reshaped the landscape of production, distribution, and consumption across the national economy (Goldfarb and Tucker, 2019).
However, the impact of the digital economy on household carbon emissions remains complex and dual-faceted. On one hand, it enhances consumer choice by offering extensive information and unparalleled convenience, which can lead to a comparative mindset, impulsive purchases (Ding et al., 2022; Luo et al., 2022), greater household waste (Frick and Matthies, 2020), and increased overall consumption—factors that ultimately drive production activities and elevate carbon emissions (Wiedmann et al., 2020). On the other hand, it also stimulates green technological innovations, broadens the range of available low-carbon products, optimizes the supply structure, and promotes eco-friendly household consumption, thereby supporting a transition to more sustainable practices (Sarfraz et al., 2022). Furthermore, the digital economy has the potential to significantly lower household carbon emissions by encouraging low-carbon consumption behaviors (Gong et al., 2020; Kim et al., 2020; Li et al., 2021b). Therefore, the digital economy functions as a double-edged sword, with the capacity to both increase and decrease carbon emissions.
Despite the broader discussions around the digital economy’s influence on carbon emissions, its specific effects on household consumption-related emissions are underexplored. Most existing research has either focused on the detrimental or beneficial aspects of the digital economy, but a comprehensive analysis of its dual impact on household carbon emissions remains lacking. This study seeks to fill this gap by examining the relationship between the digital economy and household carbon emissions, focusing on household-level consumption and its underlying mechanisms. Using the entropy weight method to measure the progress of the digital economy and leveraging household tracking survey data, we employ an econometric model to identify the key factors driving increases or decreases in household carbon emissions.
The marginal contributions of this study in the field of the relationship between the digital economy and household carbon emissions are reflected in the following aspects: First, from a theoretical perspective, this study provides an in-depth analysis of the dual impact of the digital economy on household carbon emissions, revealing the dynamic change process and the transmission path of household consumption. This analysis fills the gap in the existing literature, enriches the relevant theoretical framework, and lays a solid foundation for future research. Second, from a methodological standpoint, this study constructs a scientific econometric model, using households as the unit of analysis, to systematically capture the nonlinear relationship between the digital economy and household carbon emissions from the consumption side. This methodological innovation offers a new perspective and paradigm for research in this field, significantly enhancing the reliability and scientific rigor of the study. Finally, from a practical perspective, this study provides policymakers with targeted decision-making support, helping to formulate regional and sectoral policies that promote the synergistic development of the digital economy and the “dual carbon” goals. It also offers market insights for businesses and social organizations, guiding enterprises to adjust strategies, develop low-carbon products, and encouraging social organizations to actively engage in the transformation toward sustainable consumption, thus promoting coordinated economic and environmental development.
The structure of this paper is organized as follows: Section 2 provides a review of the existing literature, while Section 3 outlines the theoretical framework and research hypotheses. Section 4 describes the empirical research design in detail. In Section 5, we present the findings on the impact of the digital economy on IHCEs, with an exploration of heterogeneity across different dimensions. Finally, Section 6 summarizes the research and offers key recommendations and conclusions. The study framework is depicted in Figure 1.
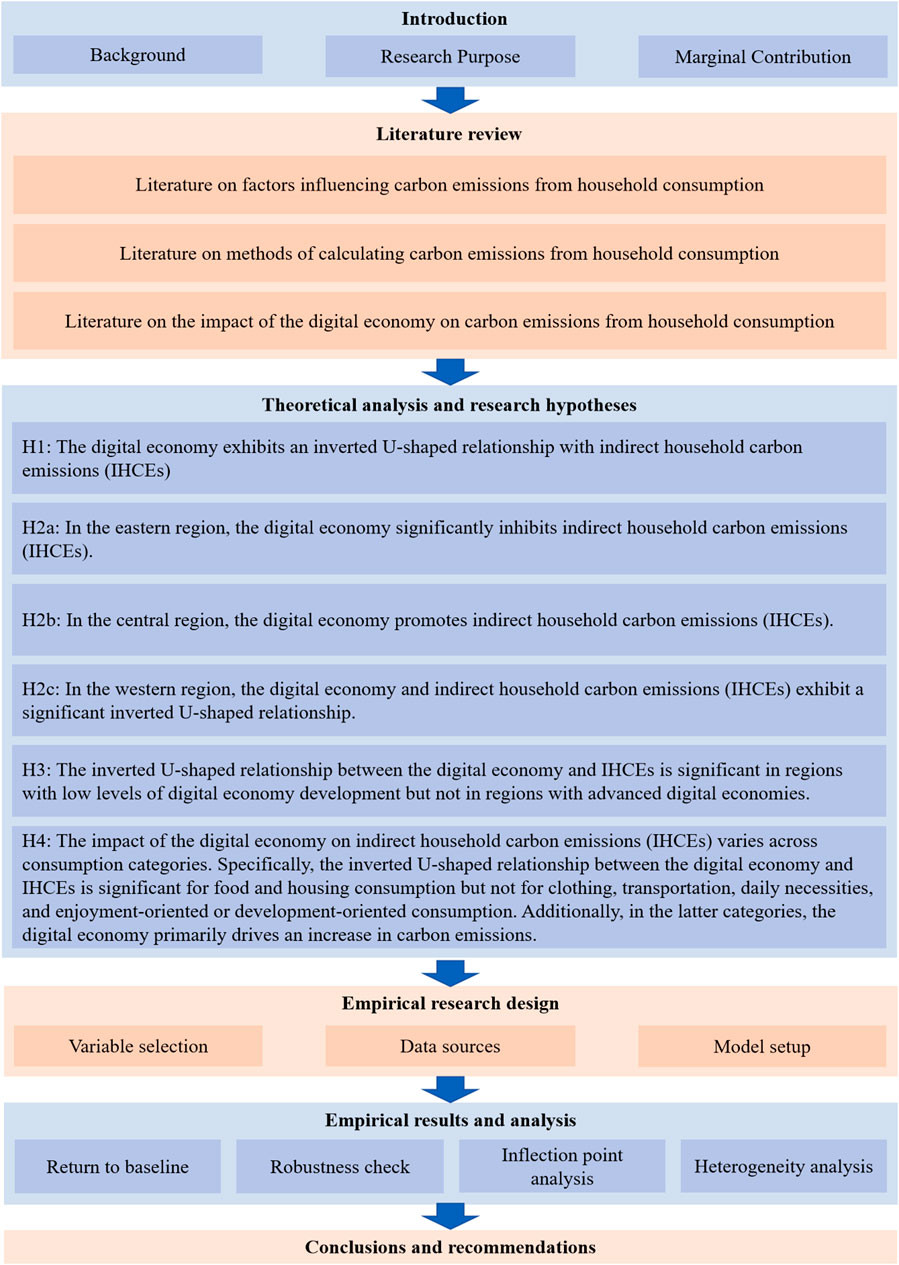
Figure 1. The research framework of this paper.
This study examines the existing literature on the methodologies used to calculate carbon emissions from household consumption, explores the factors that influence these emissions, and analyzes the role of the digital economy in shaping emission patterns.
To accurately assess carbon emissions associated with household consumption, a precise and reliable calculation methodology is essential. The consensus in the literature identifies household consumption emissions as comprising two primary components: direct household carbon emissions (DHCEs), which result from a household’s direct energy use, and indirect household carbon emissions (IHCEs), which stem from the consumption of non-energy goods and services, including their production and processing stages (Ivanova et al., 2016). Evidence consistently suggests that IHCEs exceed DHCEs in magnitude and can be measured with relative ease (Yin et al., 2020). The commonly employed methods for calculating IHCEs include the emission coefficient method (Eggleston et al., 2006), input-output models (Song et al., 2019; Zhang et al., 2020; Guo et al., 2022), the consumer lifestyle approach (Bin and Dowlatabadi, 2005; Wei et al., 2007; Feng et al., 2011; Xu et al., 2016), and life cycle assessment (Heinonen and Junnila, 2011; Shirley et al., 2012; Kim et al., 2019). These methodologies provide a robust foundation for quantifying household consumption emissions and are instrumental in understanding the drivers and implications of such emissions in various contexts.
Household carbon emissions are shaped by various factors that influence consumption behaviors. Among these, education plays a significant yet complex role. While higher education levels can improve energy awareness and encourage environmentally conscious behaviors, thereby reducing emissions (Brand et al., 2013; Cao et al., 2019), other studies suggest that education may elevate aspirations for a better quality of life, leading to greater reliance on modern energy sources and increased emissions (Büchs and Schnepf, 2013; Liu et al., 2013). Similarly, geographical differences significantly affect emissions, with urban households generally exhibiting distinct patterns compared to their rural counterparts (Wang et al., 2021). For example, in China, smaller household sizes are associated with higher per capita carbon emissions, with IHCEs being more strongly affected than DHCEs (Zhang et al., 2023). Demographic factors such as an aging population are also noteworthy, as studies link the rising proportion of elderly individuals to an increase in overall household emissions (Fan et al., 2021; Zheng et al., 2022). Furthermore, access to credit influences consumption patterns and emissions, with the most pronounced effects observed in higher income groups that leverage long-term secured credit to increase their consumption (Xu and Han, 2017). Finally, income and wealth are crucial determinants, as wealthier households and regions typically exhibit higher consumption levels, resulting in a positive correlation between income and carbon emissions (Mi et al., 2020).
The relationship between the digital economy and carbon emissions is inherently complex, reflecting both mitigating and exacerbating effects. On one hand, numerous studies argue that the digital economy fosters low-carbon development by improving resource efficiency, facilitating the adoption of green technologies, and enabling more sustainable consumption practices (Bieser and Hilty, 2018; Zhang et al., 2022). On the other hand, some research indicates that the digital economy exacerbates emissions by promoting higher consumption levels and expanding carbon footprints through digital finance and mobile payments (Li et al., 2021a; Wang et al., 2022). Recent studies also suggest that the digital economy may exhibit an inverted U-shaped relationship with emissions, where initial stages of growth lead to increased emissions, but advanced stages contribute to emission reductions (Li and Wang, 2022; Lei et al., 2023; Yin X et al., 2023; Hou et al., 2024). However, conflicting evidence exists, with some studies finding no discernible effect of the digital economy on carbon emissions (Jin and Yu, 2022).
While existing research has predominantly focused on indirect aspects of the digital economy, such as internet usage, digital finance, and mobile payments, its direct effects on household consumption emissions remain underexplored. Emerging evidence highlights both the potential of digital technologies to mitigate emissions and the risks of exacerbating them. For example, Du et al. (2024) demonstrate that while digital economy growth may increase direct emissions, it simultaneously reduces IHCEs. Similarly, Yin Z et al. (2023) find that mobile payments significantly reduce household consumption emissions, although the effects vary across different emission types. Digital technologies also facilitate the decarbonization of consumer preferences by fostering environmental awareness and promoting innovations in green products (Zhang and Wei 2023). However, the emission-increasing effects of digital advancements should not be overlooked. Mobile payment systems, for instance, encourage higher spending and consumption, which can expand household carbon footprints (Li et al., 2024). Additionally, while digital finance promotes eco-friendly purchasing habits, it often leads to higher overall emissions by augmenting income and expenditure, particularly through its effects on employment and consumption in China (Pu and Fei, 2022; Qin et al., 2022; Feng et al., 2023).
Despite significant progress in understanding the measurement and determinants of household consumption emissions, critical gaps persist regarding the impact of the digital economy on IHCEs. Existing studies primarily focus on either its mitigating or exacerbating effects, offering limited empirical evidence for the existence of an inverted U-shaped relationship between the digital economy and household emissions. Furthermore, the heterogeneity of this relationship across different contexts, including geographical regions and income groups, remains underexplored.
This study seeks to address these gaps by analyzing the dual effects of digital economy development on household carbon emissions, encompassing both its potential to reduce and increase emissions. It aims to elucidate the inverted U-shaped relationship between digital economy growth and IHCEs, quantify the inflection point of this relationship, and explore its variability across different contexts. These findings are expected to contribute to the “dual-carbon” objectives by providing actionable insights into how the digital economy can advance sustainable development. By employing innovative methodologies and offering novel perspectives, this study enriches the theoretical framework on the interplay between carbon emissions and the digital economy, providing valuable guidance for both researchers and policymakers.
The expansion of the digital economy presents a complex duality, with the potential to both exacerbate and mitigate indirect household carbon emissions (IHCEs). On the one hand, the digital economy has significantly increased the flexibility of household consumption patterns. Consumers now have more convenient access to abundant product information, enabling them to fulfill their consumption desires with greater precision. As the digital economy continues to expand, the explosive growth of information exposes consumers to a wider range of choices. However, this phenomenon often triggers a comparison mentality, which increases impulsive purchasing behavior and ultimately leads to a rise in IHCEs. Additionally, the increasing popularity of digital financial products has enhanced household liquidity, encouraging higher household expenditures and thereby driving up carbon emissions.
On the other hand, the digital economy is also expected to improve resource utilization efficiency and promote green consumption, thus contributing to a reduction in IHCEs. For example, the rise of the sharing economy has optimized the use of idle resources, effectively reducing waste in the production process. The widespread adoption of shared bicycles has transformed commuting habits, reducing reliance on traditional high-carbon transportation methods and lowering carbon emissions. Moreover, the internet economy has reshaped consumers’ perceptions of sustainability. Online platforms that encourage virtual low-carbon behaviors have helped raise individual awareness of environmental impacts, thereby fostering low-carbon lifestyles and strengthening green consumption practices. For instance, Alipay’s “Ant Forest” initiative incentivizes users to engage in environmentally friendly consumption habits. These examples illustrate the dual impact of the digital economy on IHCEs and provide a deeper understanding of the relationship between the digital economy and carbon emissions.
During the initial stages of digital economy development, several factors contribute to increased household consumption and rising IHCEs. The rapid growth of online shopping and the widespread adoption of digital payment methods have provided consumers with unprecedented convenience and access to a vast array of product choices. Simultaneously, improved liquidity has further stimulated consumption expenditures. These factors collectively drive an increase in total household consumption, which inevitably leads to higher IHCEs. Furthermore, the rapid dissemination and abundance of information in the digital economy can result in overconsumption, further exacerbating the carbon emissions problem.
However, as the digital economy matures, its impact on IHCEs may evolve. The development of sharing economy models, emphasizing resource sharing and optimal utilization, effectively reduces resource waste and associated emissions. Additionally, the internet economy raises environmental awareness among consumers, encouraging them to choose eco-friendly products. These changes may result in a gradual decline in IHCEs, suggesting an inverted U-shaped relationship between digital economy development and IHCEs. Initially, the digital economy exerts a positive effect on emissions, followed by a negative effect as it advances. This dynamic relationship reflects the intricate interplay between IHCEs and the growth of the digital economy, as illustrated in Figure 2.
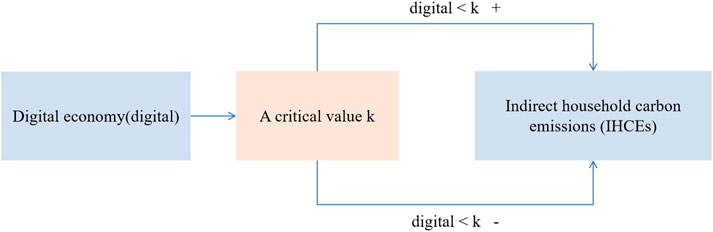
Figure 2. Relationship between the level of development of the digital economy and the impact of indirect household carbon emissions (IHCEs).
Hypothesis H1. Based on this, we propose Hypothesis H1: The digital economy exhibits an inverted U-shaped relationship with indirect household carbon emissions (IHCEs).
The eastern region, characterized by its advanced economy, high development level, and robust digital economy infrastructure, provides a unique foundation for understanding the relationship between the digital economy and IHCEs. From a theoretical perspective, industrial structure optimization theory posits that the eastern region’s strong technological innovation capabilities enable enterprises to deeply integrate digital technologies into production and operational processes, facilitating intelligent and green transformations. Additionally, the region’s comprehensive carbon emission regulatory framework, grounded in externality theory, ensures that enterprises internalize the external costs of carbon emissions through stringent environmental standards and policies, effectively reducing emissions during production. Against this backdrop, the incremental carbon emissions resulting from digital economy development in the eastern region are relatively insignificant. As the digital economy deepens, its inhibitory effect on IHCEs becomes increasingly evident. For example, digital technologies have driven intelligent logistics innovations in e-commerce, optimizing distribution routes and reducing energy consumption during transportation, thereby lowering IHCEs.
Hypothesis H2a. In the eastern region, the digital economy significantly inhibits indirect household carbon emissions (IHCEs).
In contrast, the central region lags behind the eastern region in economic development and the transformation of consumption patterns. Traditional consumption behaviors remain deeply entrenched. According to the theory of unbalanced regional development, the initial stages of digital economy development in the central region, characterized by inadequate digital infrastructure and limited technological application capabilities, provide minimal promotion of low-carbon household consumption. As the digital economy penetrates further, residents’ consumption habits gradually shift toward new consumption patterns, such as online shopping. This shift aligns with consumer behavior theory, which posits that increased exposure to consumption information stimulates demand, driving the development of related industries. Consequently, IHCEs are likely to rise significantly. During the research period, however, the digital economy in the central region has not yet reached a stage where large-scale energy-saving technologies or comprehensive shifts in consumption concepts have been realized. Therefore, IHCEs are expected to remain on an upward trajectory.
Hypothesis H2b. In the central region, the digital economy promotes indirect household carbon emissions (IHCEs).
The western region, with its traditional industrial foundation, is undergoing a critical phase of economic transformation and industrial restructuring, facing numerous challenges. During the initial stages of digital economy development, low levels of digital technology adoption hinder enterprises’ ability to digitally transform production processes, resulting in slow improvements in energy efficiency. Additionally, the inertia of traditional production models, coupled with insufficient attention to environmental management, exacerbates carbon emissions. Over time, however, government policies promoting environmental protection technologies, coupled with increasing public awareness of green consumption, are expected to mitigate emissions. As residents adopt greener behaviors, such as purchasing energy-efficient appliances and utilizing sustainable transportation, IHCEs are likely to decline. Consequently, the relationship between digital economy development and IHCEs in the western region may exhibit a significant inverted U-shaped pattern.
Hypothesis H2c. In the western region, the digital economy and indirect household carbon emissions (IHCEs) exhibit a significant inverted U-shaped relationship.
Regions with low levels of digital economy development, characterized by underdeveloped economies and inefficient industrial structures, often experience rapid increases in IHCEs during the initial stages of digital economy growth. For example, the rise of e-commerce stimulates consumption and drives the development of associated industries, such as logistics and transportation, resulting in higher emissions due to limited technological advancements and environmental protections. As the digital economy develops further, investments in energy-saving technologies and stricter environmental policies help suppress and ultimately reduce IHCEs, forming a distinct inverted U-shaped relationship. In contrast, regions with advanced digital economies, optimized industrial structures, and strong environmental regulations integrate sustainability concepts early, mitigating the inverted U-shaped effect.
Hypothesis H3. The inverted U-shaped relationship between the digital economy and IHCEs is significant in regions with low levels of digital economy development but not in regions with advanced digital economies.
Based on observations of real-world consumption markets and the mechanisms of the digital economy, different consumption categories exhibit unique characteristics and development logics. Compared to basic living needs, the digital economy exerts a more significant impact on enjoyment-oriented and development-oriented consumption (such as household equipment, art, education, and entertainment), often resulting in increased carbon emissions in these areas (Du et al., 2024). For enjoyment-oriented and development-oriented consumption, the digital economy’s impact is more pronounced due to its role in enhancing information dissemination, driving product innovation, and transforming consumption patterns. For instance, the rise of online art exhibitions and smart educational equipment has enriched the consumer experience but also introduced more energy-intensive processes, thereby increasing carbon emissions. In the areas of food and housing consumption, the digital economy initially focuses on breaking spatial and temporal limitations on consumption and improving convenience, which stimulates consumption growth and drives increased carbon emissions in related industries. Subsequently, with technological advancements and industrial upgrades, measures aimed at environmental protection and resource efficiency begin to take effect, leading to an inverted U-shaped trend where carbon emissions initially rise and then fall. By contrast, in areas such as clothing, transportation, and daily necessities, consumption behaviors are constrained by traditional habits, fixed demand structures, and the realities of infrastructure. Even with the penetration of the digital economy, it is difficult to achieve fundamental changes in these consumption patterns or related carbon emissions. As a result, the digital economy has an insignificant impact on IHCEs in these categories.
Hypothesis H4. The impact of the digital economy on indirect household carbon emissions (IHCEs) varies across consumption categories. Specifically, the inverted U-shaped relationship between the digital economy and IHCEs is significant for food and housing consumption but not for clothing, transportation, daily necessities, and enjoyment-oriented or development-oriented consumption. Additionally, in the latter categories, the digital economy primarily drives an increase in carbon emissions.
The dependent variable is the logarithm of IHCEs (lnC). The measurement of Indirect household carbon emissions (IHCEs) involves calculating the carbon emissions produced during the production of eight broad categories of daily consumption items: food, clothing, transportation and communication, pharmaceutical products, household equipment and supplies, culture, education and entertainment, housing, and other purposes. The household’s main eight consumption categories and their corresponding production sectors are shown in Table 1. The indirect carbon emissions from household consumption were calculated using the following formula (Equations 1–4):
where CEi represents the scale of carbon emissions of the ith industry, CEPi represents the energy consumption of the ith industry, and CEC represents the carbon emission coefficient of various energy sources consumed by the corresponding industry. CIi represents the carbon emission intensity per unit of GDP for the ith industry, Gi represents the value added by the ith industry, and CEi represents the carbon emissions of the ith industry. We then classify and analyze the household consumption expenditure items of each industry. By multiplying the amount of household expenditure on item j, consumej, by the carbon emission intensity per unit of value added of the ith industry to which it belongs, CIi, we compute the carbon emissions generated by each household consumption expenditure. The carbon emissions of all consumption items are summed to obtain the total indirect carbon emissions from household consumption (IHCEs). Finally, we take the logarithm of this total to obtain the logarithmic value of IHCEs (lnC).
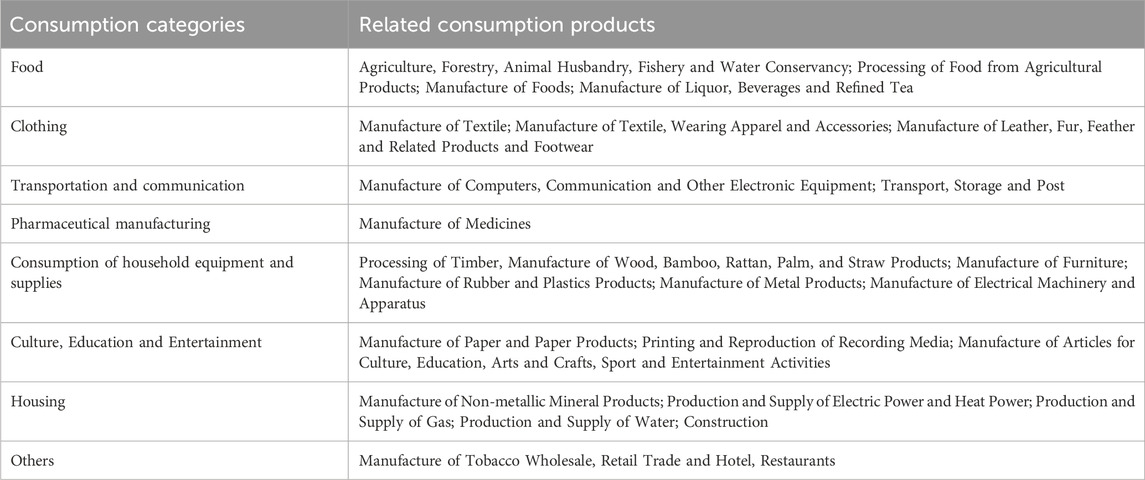
Table 1. The main eight consumption items of households and their related production industry sectors.
The degree of digital economic development (digital) is the primary explanatory variable in this study, and the precise computation method is based on the research by Zhao et al. (2020). In this paper, eight variables are selected to construct the digital economic development index from four aspects: digital infrastructure, digital industrialization, industrial digitization, and digital services and governance. The assessment indexes are weighted using the entropy weighting method to produce a comprehensive assessment index of China’s digital economic development level (refer to Table 2).
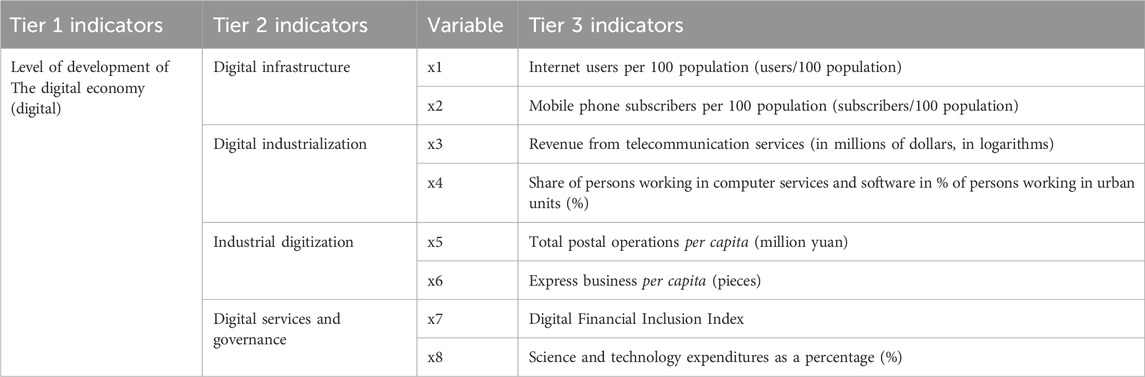
Table 2. Indicator system for evaluating the level of development of the digital economy.
To ensure a comprehensive and robust analysis of the impact of digital economy development on indirect household carbon emissions (IHCEs), this paper incorporates a set of carefully selected control variables at both the individual and household levels, addressing potential confounding factors that influence household consumption and emissions. At the individual level, age (the age of household decision-makers) is included to reflect generational differences in consumption patterns and environmental awareness, as younger decision-makers may adopt energy-intensive lifestyles while older ones might prioritize thriftier consumption. Gender (male = 1, female = 0) accounts for observed differences in consumption preferences, as male decision-makers often exhibit less inclination toward frequent purchases compared to females. Marriage (with spouse = 1, without spouse = 0) captures the effect of household composition, as married households typically exhibit higher resource demands. Education, measured by years of schooling (primary school = 6, lower secondary school = 9, upper secondary school = 12, tertiary and above = 16), is included to reflect the dual effect of education: enhancing income and aspirations for higher living standards while also potentially raising environmental awareness.
At the household level, urban (urban = 1, rural = 0) is controlled for to address structural disparities in access to goods and services and consumption patterns. Familysize reflects economies of scale in resource usage, where larger households often achieve higher efficiency in consumption per capita. The child dependency ratio (child) and elderly dependency ratio (old) (calculated as the ratio of children and elderly dependents to total household members, respectively) account for the impact of demographic structures on consumption priorities, such as expenditures on education or healthcare. House_debts (with housing loans = 1, without housing loans = 0) and nonhousing_debts (with non-housing loans = 1, without non-housing loans = 0) are included to measure financial constraints and their influence on household spending patterns, as households with debt obligations may prioritize essential consumption over discretionary or green purchases. Lastly, lfamilyincome (the logarithmic value of per capita net household income) is incorporated to capture the income effect, as wealthier households tend to consume more goods and services, which directly influences their carbon emissions.
These control variables are critical for isolating the effect of digital economy development on IHCEs by accounting for demographic, financial, and structural heterogeneities across households. For detailed definitions and summary statistics of these variables, see Table 3.
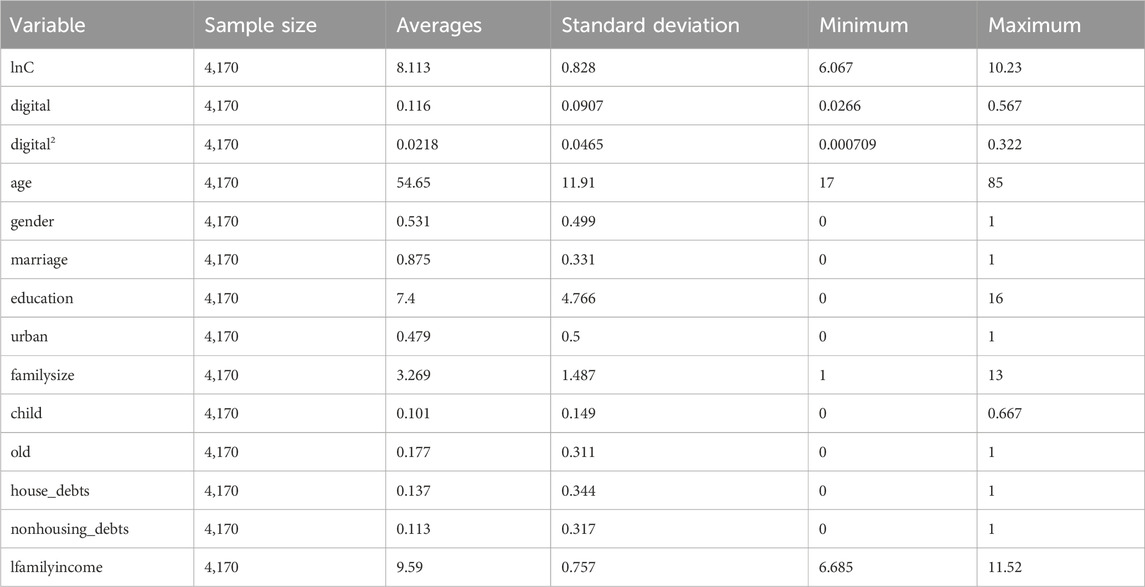
Table 3. Description of variables.
This study utilizes data from multiple authoritative and nationally representative sources to analyze household consumption and carbon emissions. The core dataset is derived from the China Family Panel Studies (CFPS) for the years 2014, 2016, and 2018. CFPS, conducted by Peking University, is a nationally representative, longitudinal household survey that covers urban and rural households across 25 provinces, representing approximately 95% of China’s population. Its comprehensive design ensures representativeness across regional, economic, and demographic dimensions, making it a robust data source for analyzing household behaviors. The dataset includes detailed information on eight distinct categories of household expenditure, ranging from food and housing to transportation and education. The CFPS data for 2020 were excluded from this study for two primary reasons. First, the 2020 dataset lacks detailed data on household consumption, making it inconsistent with earlier rounds of the survey. Second, the COVID-19 pandemic had an unprecedented impact on household consumption patterns, which would have introduced biases and inconsistencies into the analysis. By focusing on pre-pandemic years, this study ensures that the data accurately reflect typical household consumption behavior under stable economic and social conditions.
Energy consumption data, including energy equivalent standard coal coefficients and energy carbon emission coefficients, are sourced from the China Energy Statistics Yearbook and the IPCC Guidelines for National Greenhouse Gas Inventories, two widely recognized and authoritative sources. These datasets provide the energy equivalent standard coal coefficients and energy carbon emission coefficients, which are essential for converting energy consumption into carbon emissions. The accuracy and reliability of these coefficients are critical for ensuring robust and precise calculations of household carbon emissions. Additionally, value-added data for non-industrial sectors are obtained from the National Bureau of Statistics. Since value-added data for industrial sub-sectors have not been updated since 2007, this study estimates the values for 2014, 2016, and 2018 by applying growth rates from 2008 to 2018 to the 2007 baseline, with calculations performed using data from the CSMAR database. The growth rate adjustments for industrial sub-sector value-added are based on the “factory price index of industrial products,” also sourced from CSMAR. For evaluating digital economic development, data from the China City Statistical Yearbook and statistical yearbooks of prefectural-level cities are utilized. Missing data points are interpolated using linear and annual average methods. A one-to-one correspondence between household sample data and city-level digital economy metrics is established, resulting in the selection of 1,157 households surveyed across 2014, 2016, and 2018.
Citing R.F.J. Haans et al. (2016), this study constructs two models: Model (5), which includes the primary terms of the explanatory variables, and Model (6), which includes the secondary terms of the explanatory variables. These models are used to examine the inverted U-shaped relationship between IHCEs and the development level of the digital economy. The econometric model is specified as follows (Equations 5, 6):
where lnCit represents the logarithm of household i’s IHCEs in year t Digitalit represents the level of digital economic development in household i’s city in year t. Controlit is a set of control variables including household decision maker and household characteristics variables, provincei and yeart represent province and year fixed effects, and εit is an unobservable observable error term.
To enhance the robustness of the test results, this study adopts a stepwise methodology that incorporates provincial and temporal fixed effects, the digital economy, its squared term, and additional control variables into the regression model. Table 4 details the outcomes, with each column representing the logarithmic value of IHCEs as the dependent variable. A benchmark regression using the entire sample assesses the impact of the digital economy on IHCEs. Column (1) displays results based exclusively on the core explanatory variable, “digital”. The significantly positive coefficient indicates that as the digital economy advances, the rate of increase in IHCEs also rises. Column (2) introduces the squared term of the digital economy (digital2), revealing an inverted U-shaped relationship between the digital economy and IHCEs. Specifically, the coefficient for “digital” remains significantly positive, while the coefficient for “digital2” is significantly negative. Columns (3), (4), and (5) sequentially incorporate individual, household, and regional control variables. The results continue to show a significantly positive coefficient for “digital” and a significantly negative coefficient for “digital2”, with only slight variations in magnitude and significance. These results substantiate the inverted U-shaped relationship between IHCEs and the digital economy. These results substantiate the inverted U-shaped relationship between IHCEs and the digital economy, suggesting that initially, as the digital economy fosters greater efficiency and consumption, it leads to higher carbon emissions. However, at a certain level of digital development, the relationship reverses due to the potential for more sustainable practices, such as increased efficiency in energy use and the promotion of green technologies. In other words, while the digital economy accelerates growth in carbon emissions at first, its later stages contribute to emissions reductions through innovation and improved resource management.
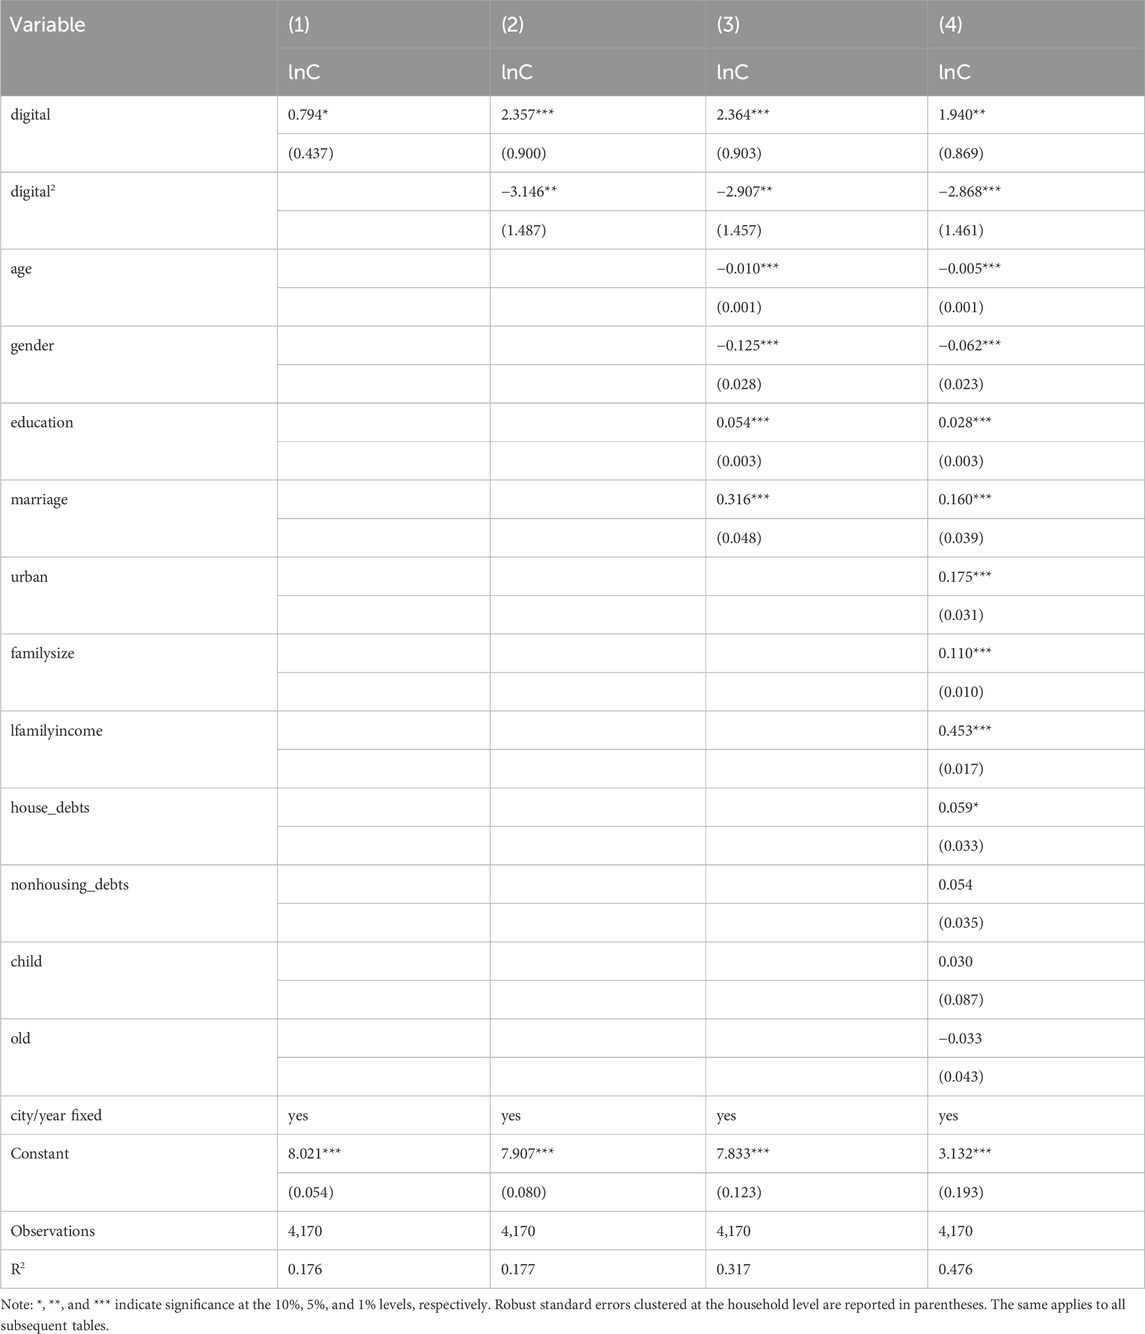
Table 4. Impact of the level of development of the digital economy on IHCEs: baseline regression results.
Column (3) presents the results for individual-level control variables, revealing a significant negative correlation between the age of the household decision-maker and IHCEs. This indicates that older individuals are more likely to display thriftier and more environmentally conscious consumption behaviors. This could be because older individuals may prioritize longevity, financial security, and sustainability, which influence their purchasing decisions and reduce their carbon footprint. However, this association does not hold in Column (4), where the coefficient becomes insignificant. This could indicate that other factors, such as income or family size, might overpower the effect of age on consumption behavior in this specific model, or that age-related effects are moderated by different contextual variables. Male decision-makers experience a slower rate of increase in IHCEs compared to their female counterparts. This difference is likely due to a lower inclination toward purchasing among men, leading to lower consumption and, consequently, fewer carbon emissions. The purchasing behaviors of men may differ from those of women due to socialized norms or differing attitudes toward consumption, which could contribute to this lower rate of increase in emissions. Furthermore, male decision-makers may prioritize cost-effective choices, leading to lower overall consumption. There is a statistically significant correlation between educational attainment and IHCEs. While higher education generally leads to better job prospects and higher income, the increased consumption associated with these higher earnings may counteract the environmental awareness gained through education, resulting in higher carbon emissions. Higher levels of education can often lead to greater financial affluence, which typically translates into greater consumption of goods and services, many of which are energy-intensive and contribute to higher carbon emissions. This highlights a complex relationship between income, consumption, and education. Moreover, the environmental awareness fostered through education may not always translate directly into more sustainable consumption patterns, especially when the financial means to consume more are available. Married households, compared to single-person households, generally exhibit higher carbon emissions due to increased consumption demands driven by larger household sizes. Moreover, their greater economic resources enable the purchase of more goods and services, many of which contribute to higher carbon emissions. Households with decision-makers in good health generally experience higher growth rates in indirect consumption-related carbon emissions. This is likely due to the reduction in healthcare expenditures, which allows for increased spending on other consumption goods and services, typically associated with higher carbon emissions. It is important to note that this effect is only significant in Model (3), indicating that the relationship may be sensitive to the inclusion of other variables or the specific model specification. It is worth noting that this result is only significant in model (3), which suggests that this relationship may be influenced by other variables or vary by model setting. At the household level, regression coefficients for household size, total mortgage, the log of non-mortgage financial liabilities, and urban attributes are all positive and significant. In contrast, coefficients for child dependency and elderly dependency are not significant. A possible reason for this is that larger households typically exhibit higher emissions due to increased resource consumption associated with a larger family size. Similarly, households with substantial mortgages or non-mortgage liabilities tend to prioritize consumption over environmental concerns, driven by financial pressures, thereby contributing to higher emissions. Urban households, with their greater purchasing power and access to energy-intensive goods, also experience higher IHCEs. These findings align with the proposed hypotheses and earlier results.
This study examines the U-shaped relationship between the development level of the digital economy and industrial greenhouse gas emissions (IHCEs). Relying solely on the significance of the quadratic term’s coefficient to establish this relationship lacks sufficient rigor.
First, the U-shaped curve has endpoints with positive and negative slopes, indicating that the curve trends both upward and downward. Second, the main explanatory variables in the model have positive primary coefficients, while the quadratic coefficients are negative, suggesting that the curve rises initially and then declines. Third, the inflection point of the curve should fall within the range defined by the core explanatory variables, specifically the digital economy development level examined in this study.
Table 5 and Figure 3 present the outcomes of the three-step U-test. The graphical representation reveals a curve exhibiting both upward and downward trends, characterized by an initial positive slope followed by a negative one. This pattern implies that the influence of digital economic growth on carbon emissions associated with household consumption is neither exclusively stimulatory nor purely inhibitory. As detailed in Table 3, the coefficients for “digital” and “digital2” are positive and negative, respectively, and are statistically significant at the 1% level. This finding suggests that the effect of digital economy development on household consumption-related carbon emissions initially promotes an increase, which subsequently transitions to a suppressive effect. The inflection point of 0.338 signifies a pivotal threshold in the development of the digital economy. Prior to this inflection point, advancements in digital economic infrastructure are associated with an increase in household consumption carbon emissions. However, once this threshold is surpassed, further development in the digital economy begins to moderate additional increases in these emissions. This observation supports the first Hypothesis H1. Initially, the digital economy’s impact on household consumption is predominant, overshadowing its role in fostering green consumption behaviors and failing to effectively promote sustainable practices. As the digital economy progresses, heightened household consumption—both in volume and frequency—intensifies the growth rate of IHCEs. Nevertheless, during the later stages of digital economy maturation, the availability of environmentally friendly products and heightened awareness of green and low-carbon consumption practices contribute to a deceleration in the growth rate of IHCEs.
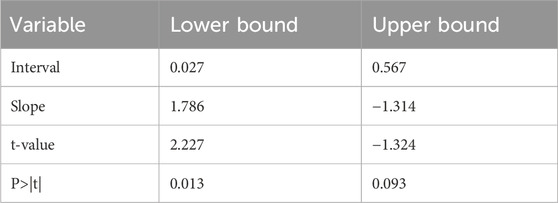
Table 5. Robustness test: inverted U-shaped relationship test results.
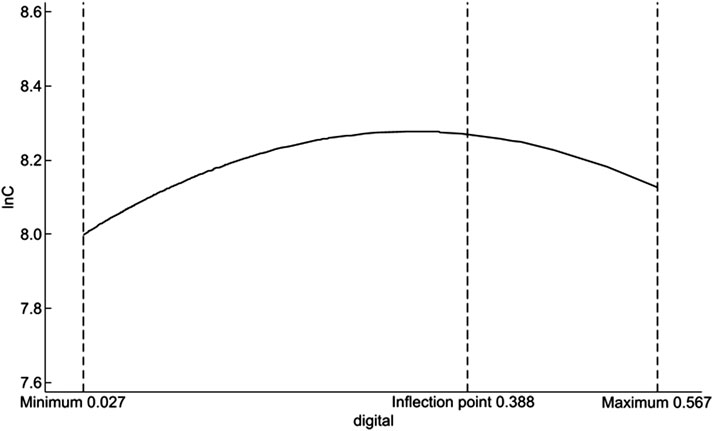
Figure 3. Inverted U-shaped relationship between the digital economy and household consumption carbon emissions.
To enhance the reliability of the estimation results, this paper conducted a stability test. Specifically, the logarithm of per capita indirect household carbon emissions (IHCEs) was used as an explanatory variable instead of the logarithm of total IHCEs. The results, presented in Table 6, show that the coefficient for the digital economy variable is positive, while the coefficient for the squared digital economy variable is negative. All estimated coefficients remain significant after adjusting the explanatory variables. This confirms that the relationship between household carbon emissions and the digital economy remains inverted, thereby validating the robustness of the baseline regression.
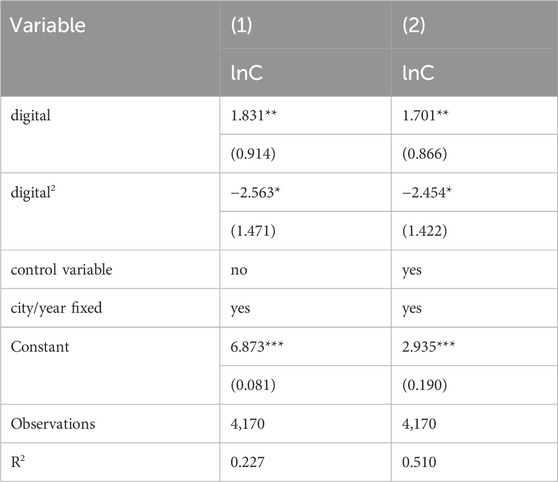
Table 6. Robustness tests: main explanatory variable measures with substitutions.
Where does China’s digital economy development currently fall on the inverted U-shaped curve? Previous analyses have identified an inverted U-shaped relationship between IHCEs and the level of digital economy growth. The question arises: will the ongoing advancement in digitalization lead to a reduction or an escalation in IHCEs? This study leverages empirical estimations to pinpoint the inflection point on this inverted U-shaped curve.
Based on the logarithm of total IHCEs, the inflection point for digital economic development is determined to be 0.338. For the logarithm of average per capita IHCEs, the inflection point is slightly higher at 0.347, as derived from various measurement methodologies (see Tables 3–5). Currently, with a mean score of 0.116, China’s level of digital economic development is positioned to the left of this inflection point. Furthermore, only 3.71% of cities with sample households have surpassed the inflection point in digital economy development, suggesting that most cities have yet to reach it. These results imply that the digital economy in China is still in its developmental phase. Given the mean digital economy development score of 0.116, it is evident that China’s digital economy remains on the lower segment of the inverted U-shaped curve. Therefore, the continued growth of the digital economy is anticipated to further increase IHCEs, and accelerating digital economy development may be crucial for mitigating these emissions.
The analysis divides the country into three distinct regions: the eastern, central, and western regions. Each region has unique characteristics that shape the relationship between the digital economy and indirect household carbon emissions (IHCEs). In the eastern region, boasting advanced digital infrastructure and a robust economic foundation, the digital economy significantly curbs IHCEs. As per Hypothesis H2a, the region’s strong technological innovation, driven by industrial structure optimization, enables enterprises to integrate digital tech into production, reducing emissions. Also, a comprehensive carbon emission regulatory framework, based on externality theory, ensures environmental sustainability. This may have pushed the region past the inverted U - shaped curve’s inflection point, nullifying the digital economy’s initial positive impact on emissions. Turning to the central region, Hypothesis H2b holds true. Here, traditional consumption patterns are deeply ingrained. In the early days of digital economy development, limited digital infrastructure and tech application capabilities meant little promotion of low - carbon consumption. As digital penetration grows, new consumption patterns like online shopping emerge, driving up IHCEs as related industries expand. The western region, with its traditional industrial base, is in a phase of transformation. Initially, low digital technology adoption and traditional production inertia led to more emissions during digital economy growth. But as per Hypothesis H2c, with government - promoted environmental tech and rising public green awareness, the relationship between the digital economy and IHCEs forms an inverted U - shape. As seen in Table 7, these trends confirm Hypotheses H2a, H2b, and H2c, highlighting the diverse impacts of the digital economy on IHCEs across different regions.
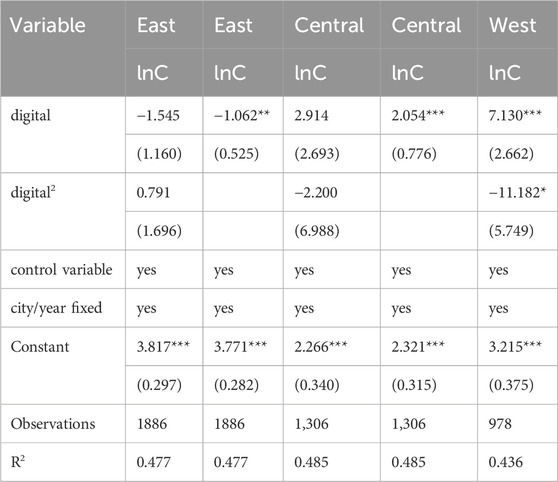
Table 7. Results of heterogeneity test (subregion).
Samples are stratified based on the level of digital economy development. Those below the mean are classified as having a low level of digital economy development, while those above the median are categorized as having a high level of digital economy development. As indicated in Table 8, the inverted U - shaped relationship between household carbon emissions and digital economy development is pronounced in low - development areas. However, in high - development regions, this relationship is not statistically significant. A reasonable explanation for this is as follows. In areas with underdeveloped digital economies, household expenditures are mainly concentrated on essential goods and services such as food, clothing, and housing. These consumption activities generally result in relatively low carbon emissions. When the digital economy starts to develop in these areas, for example, the rise of e − commerce stimulates consumption and drives the development of related industries like logistics and transportation. Due to limited technological capabilities and imperfect environmental protection measures at this stage, indirect household carbon emissions (IHCEs) increase rapidly. Nevertheless, with the further development of the digital economy, increased investment in energy - saving technologies and the implementation of stricter environmental policies help to suppress and eventually reduce IHCEs, thus forming a distinct inverted U - shaped relationship. In contrast, in regions with advanced digital economies, characterized by strong economic growth, advanced technology, and optimized industrial structures, the concept of sustainable development has been integrated into development strategies from the early stage. Although households in these areas may tend to consume high - carbon - emission goods and services such as automobiles, air travel, and electronics, and residents may prefer luxurious and high - consumption lifestyles, the well - established energy - saving and emission - reduction systems and strict environmental regulations in these regions encourage both enterprises and consumers to prioritize environmental protection. As a result, the inverted U - shaped effect between household carbon emissions and digital economy development is weakened. In conclusion, Hypothesis H3 is confirmed.
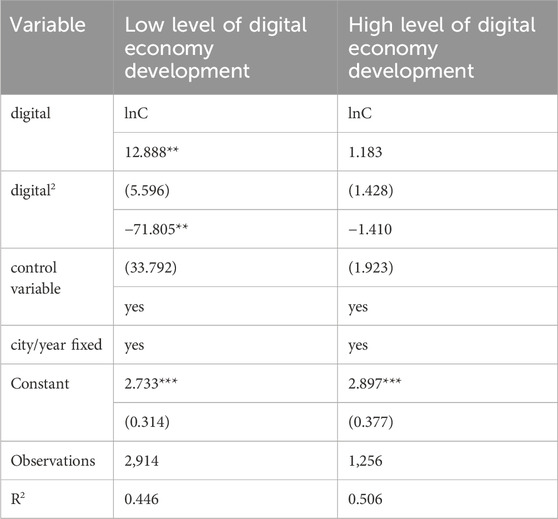
Table 8. Heterogeneity test results (by level of digital economy development).
This study delves into the influence of the digital economy on carbon emissions, meticulously examining eight different categories of household consumption. As presented in Table 9, a notable finding is that there exists an inverted U - shaped relationship between the digital economy and indirect household carbon emissions (IHCEs), with this correlation being mainly shaped by housing and food consumption. For clothing, medical care, transportation, home goods and equipment, education, entertainment, and other categories, a positive U - shaped relationship with carbon emissions is observed, yet it lacks statistical significance. This divergence can be attributed to multiple factors. In the early stages of the digital economy, as living standards rise, consumption increases, thereby driving up IHCEs, especially in food and housing. For instance, more people might choose larger houses or dine out more frequently. However, as the digital economy matures, the easy access to and sharing of information has promoted healthy eating concepts. People consume less high - calorie and high - fat foods, reducing carbon emissions from food consumption. Meanwhile, in the housing sector, the digital economy has enabled households to access more eco - friendly housing options and construction materials, cutting down on related emissions. In line with Hypothesis H4, which posits that the digital economy’s impact on IHCEs varies across consumption categories, with an inverted U - shaped relationship significant for food and housing but not for other categories where it mainly drives emission increases. Up to this point, Hypothesis H4 is verified.
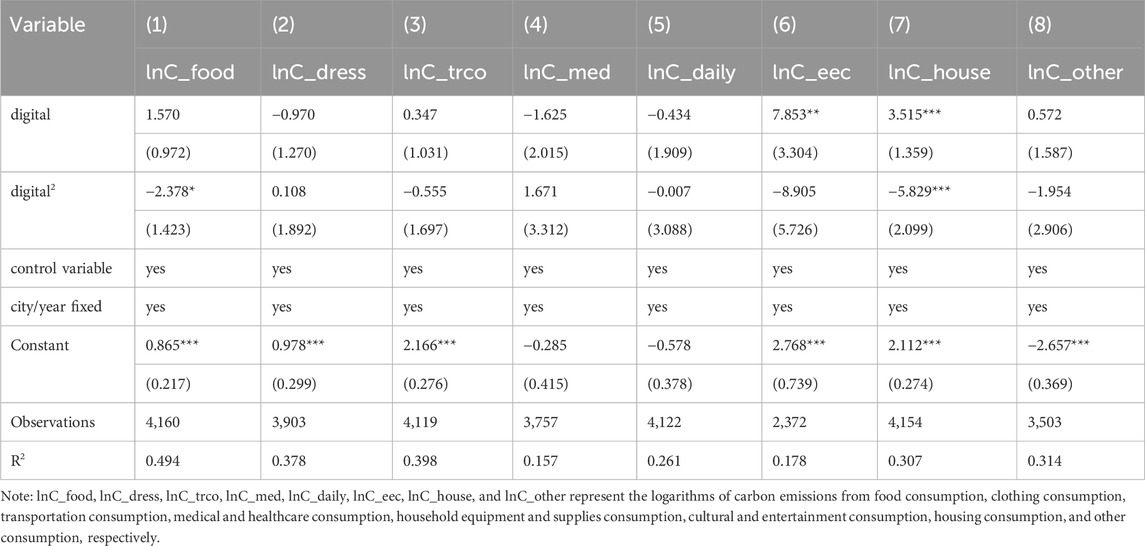
Table 9. Results of heterogeneity tests (by type of household consumption).
In the global context of advancing carbon reduction efforts and promoting sustainable development, the digital economy, as an emerging and highly influential force, is reshaping socio-economic structures comprehensively. Against this backdrop, the relationship between the digital economy and indirect household carbon emissions (IHCEs) has garnered significant attention. However, previous studies have not fully explored the mechanisms through which the digital economy impacts IHCEs, nor the variations of this impact across regions, levels of digital economic development, and consumption categories. To address these gaps, this study focuses on the critical issue of how digital economic development influences IHCEs. To achieve precise and representative conclusions, this research employs data from the 2014–2018 China Family Panel Studies (CFPS). This dataset covers households across different regions and economic levels in China, providing comprehensive and reliable information to build a solid foundation for analysis. Using rigorous econometric modeling and empirical methods, this study conducts an in-depth multidimensional analysis, yielding the following key findings:
(1) An Inverted U-shaped Relationship between the Digital Economy and IHCEs. The relationship between the digital economy and IHCEs exhibits a significant inverted U-shaped pattern, as validated by robustness checks. In the early stages of digital economic development, improved accessibility to goods and services, coupled with expanded consumer choices, drives significant increases in the consumption of energy-intensive products, thereby raising IHCEs. This occurs because, in its initial stages, the digital economy primarily stimulates consumption growth, while its energy-saving and carbon-reducing benefits remain underutilized. As digital technologies mature, resource allocation becomes more efficient, and sustainable consumption concepts gain traction. Enterprises leverage digital technologies to improve production efficiency and reduce resource waste, while consumers are more inclined to choose low-carbon products, leading to a gradual decline in IHCEs. This finding enriches the theoretical understanding of the relationship between the digital economy and environmental sustainability, offering policymakers critical evidence for formulating stage-specific policies that align digital economic growth with carbon reduction objectives.
(2) Regional Differences in the Digital Economy’s Impact. The impact of the digital economy on IHCEs varies significantly across regions. In the Eastern region, supported by advanced digital infrastructure and a high level of digitalization, enterprises efficiently adopt green production technologies, and residents are more likely to embrace low-carbon lifestyles. Consequently, the digital economy in the Eastern region exhibits a strong carbon-reducing effect. In contrast, the Central region, with its relatively underdeveloped digital infrastructure, experiences increased emissions as industries consume more energy and emit more carbon during the transition to new consumption patterns like online shopping. Meanwhile, in the Western region, carbon emissions initially rise due to industrial transformation challenges. However, as technological progress accelerates and environmental awareness improves, the digital economy and IHCEs in the Western region gradually exhibit an inverted U-shaped relationship.
(3) Heterogeneity by Digital Economic Development Levels. The impact of the digital economy on IHCEs also varies significantly based on the level of digital economic development. In regions with low levels of digital economic development, IHCEs and the digital economy exhibit a pronounced inverted U-shaped relationship. During the initial phase, rapid growth in new industries, such as e-commerce, stimulates consumption and drives industrial expansion. However, due to inadequate technology and insufficient environmental measures, carbon emissions increase rapidly. As the digital economy advances, increased investments in energy-saving technologies and improved environmental policies help curb and eventually reduce emissions. Conversely, in regions with high levels of digital economic development, the inverted U-shaped relationship is less pronounced. These regions, characterized by advanced economies, optimized industrial structures, and strict environmental regulations, integrate sustainability concepts into economic and consumption models early on, preventing significant rises in carbon emissions.
(4) Sectoral Heterogeneity in the Digital Economy’s Impact on IHCEs. A deeper analysis by consumption categories reveals significant heterogeneity in the digital economy’s impact on IHCEs. In the food and housing sectors, the digital economy demonstrates a clear inverted U-shaped relationship with IHCEs. During the early stages, the convenience brought by digital technologies stimulates demand, leading to industrial expansion and increased emissions. As digital technologies mature, industries accelerate their green transformation, reducing energy consumption and carbon emissions. However, in sectors such as transportation, household equipment, and cultural and recreational activities, the theoretical inverted U-shaped relationship is not significant. In the clothing and healthcare sectors, a positive U-shaped relationship emerges but lacks strong significance. These findings highlight the uneven progress in emission reductions across industries, revealing the untapped potential of the digital economy for reducing emissions.
To fully realize the potential of the digital economy in reducing IHCEs, policymakers should design targeted, region-specific, and sector-focused strategies based on the study’s findings. The following recommendations are proposed:
(1) Promoting Sustainable Development Based on the Inverted U-shaped Relationship. Given the inverted U-shaped relationship between the digital economy and IHCEs, policymakers should focus on guiding consumption during the early stages of digital economic development. On one hand, public education campaigns can enhance consumer awareness and preferences for low-carbon products, discouraging excessive consumption of energy-intensive goods. On the other hand, subsidies and tax incentives should support the development and application of energy-saving and carbon-reducing technologies, accelerating technological and industrial transformation. During the mature stages of the digital economy, policies should encourage enterprises to continue innovating and leveraging digital technologies to optimize resource allocation while promoting sustainable consumption concepts. These efforts will align the digital economy with low-carbon development goals.
(2) Regional Differentiation Policies to Promote Balanced Development. To address regional disparities in the digital economy’s impact on IHCEs, region-specific strategies are essential. In the Eastern region, policymakers should strengthen the digital economy’s role in promoting low-carbon development by encouraging enterprises to engage in green technological innovation and integrating digital technologies into green production processes. In the Central region, investments in digital infrastructure should be accelerated to attract digital economy enterprises, facilitate the digital transformation of traditional industries, and reduce industrial energy consumption. In the Western region, efforts should focus on advancing technology and raising environmental awareness by establishing special funds for energy-saving technology research and promoting green consumption practices. These measures will help ensure that the Western region transitions more quickly to the descending phase of the inverted U-shaped curve.
(3) Tailoring Strategies to Digital Economy Development Levels. In regions with low levels of digital economy development, efforts should focus on regulating emerging industries, such as e-commerce, by establishing green development thresholds and encouraging enterprises to adopt environmentally friendly production technologies. As the digital economy advances, investments in energy-saving technologies should increase, and environmental policies should impose stricter carbon emission limits. In regions with high levels of digital economy development, policies should explore the integration of digital economy advancements with green industries. For example, establishing innovation parks with tax incentives can encourage sustainable practices. Supporting green supply chain management and rewarding enterprises for reducing supply chain emissions will further consolidate sustainable development outcomes.
(4) Unlocking Emissions Reduction Potential by Consumption Categories. Policies should prioritize emissions reductions in the food and housing sectors, where the digital economy demonstrates clear potential for impact. Early-stage green planning should guide industrial expansion, while incentives for environmentally friendly production processes and materials can further support these efforts. For sectors such as transportation, household equipment, and cultural activities, policies should encourage the development of low-carbon technologies and products. For example, subsidies for new energy vehicle production and research on digital emissions reduction pathways in these sectors could drive progress. In the clothing and healthcare sectors, businesses using sustainable materials and processes should receive subsidies, and public awareness campaigns should promote environmentally conscious consumption. These measures will unlock the full potential of the digital economy in reducing IHCEs across all consumption categories.
By implementing these policy measures, governments can maximize the digital economy’s potential to reduce IHCEs while fostering sustainable and inclusive economic growth. The findings provide valuable guidance for policymakers and researchers seeking to align digital economic development with environmental sustainability goals.
The original contributions presented in the study are included in the article/supplementary material, further inquiries can be directed to the corresponding author.
YC: Data curation, Software, Writing–original draft, Writing–review and editing. DC: Supervision, Writing–review and editing. CG: Methodology, Supervision, Writing–review and editing. XW: Funding acquisition, Writing–review and editing.
The author(s) declare that financial support was received for the research, authorship, and/or publication of this article. This research was funded by the National Natural Science Foundation of China [grant number 72271192].
The authors declare that the research was conducted in the absence of any commercial or financial relationships that could be construed as a potential conflict of interest.
The author(s) declare that no Generative AI was used in the creation of this manuscript.
All claims expressed in this article are solely those of the authors and do not necessarily represent those of their affiliated organizations, or those of the publisher, the editors and the reviewers. Any product that may be evaluated in this article, or claim that may be made by its manufacturer, is not guaranteed or endorsed by the publisher.
Baiocchi, G., Minx, J., and Hubacek, K. (2010). The impact of social factors and consumer behavior on carbon dioxide emissions in the United Kingdom: a regression based on Input−Output and geodemographic consumer segmentation data. J. Ind. Ecol. 14, 50–72. doi:10.1111/j.1530-9290.2009.00216.x
Bieser, J. C. T., and Hilty, L. M. (2018). Indirect effects of the digital transformation on environmental sustainability: methodological challenges in assessing the greenhouse gas abatement potential of ICT. EPiC Ser. Comput. 52, 68–53. doi:10.29007/lx7q
Bin, S., and Dowlatabadi, H. (2005). Consumer lifestyle approach to US energy use and the related CO2 emissions. Energy Policy 33, 197–208. doi:10.1016/S0301-4215(03)00210-6
Brand, C., Goodman, A., Rutter, H., Song, Y., and Ogilvie, D. (2013). Associations of individual, household and environmental characteristics with carbon dioxide emissions from motorised passenger travel. Appl. Energy 104, 158–169. doi:10.1016/j.apenergy.2012.11.001
Büchs, M., and Schnepf, S. V. (2013). Who emits most? Associations between socio-economic factors and UK households’ home energy, transport, indirect and total CO2 emissions. Ecol. Econ. 90, 114–123. doi:10.1016/j.ecolecon.2013.03.007
Cao, J., Ho, M. S., Li, Y., Newell, R. G., and Pizer, W. A. (2019). Chinese residential electricity consumption: estimation and forecast using micro-data. Resour. Energy Econ. 56, 6–27. doi:10.1016/j.reseneeco.2017.10.003
Ding, N., Gu, L., and Peng, Y. (2022). Fintech, financial constraints and innovation: evidence from China. J. Corp. Finance 73, 102194. doi:10.1016/j.jcorpfin.2022.102194
Du, Z., Xu, J., and Lin, B. (2024). What does the digital economy bring to household carbon emissions? – From the perspective of energy intensity. Appl. Energy 370, 123613. doi:10.1016/j.apenergy.2024.123613
Eggleston, H. S., Buendia, L., Miwa, K., Ngara, T., and Tanabe, K. (2006). 2006 IPCC Guidelines for national greenhouse gas Inventories. Available at: https://www.osti.gov/etdeweb/biblio/20880391 (Accessed August 30, 2024).
Fan, J., Zhou, L., Zhang, Y., Shao, S., and Ma, M. (2021). How does population aging affect household carbon emissions? Evidence from Chinese urban and rural areas. Energy Econ. 100, 105356. doi:10.1016/j.eneco.2021.105356
Feng, S., Liu, J., and Xu, D. (2023). Digital financial development and indirect household carbon emissions: empirical evidence from China. Environ. Dev. Sustain. 26, 23401–23435. doi:10.1007/s10668-023-03603-4
Feng, Z.-H., Zou, L.-L., and Wei, Y.-M. (2011). The impact of household consumption on energy use and CO2 emissions in China. Energy 36, 656–670. doi:10.1016/j.energy.2010.09.049
Frick, V., and Matthies, E. (2020). Everything is just a click away. Online shopping efficiency and consumption levels in three consumption domains. Sustain. Prod. Consum. 23, 212–223. doi:10.1016/j.spc.2020.05.002
Goldfarb, A., and Tucker, C. (2019). Digital economics. J. Econ. Lit. 57, 3–43. doi:10.1257/jel.20171452
Gong, X., Zhang, J., Zhang, H., Cheng, M., Wang, F., and Yu, N. (2020). Internet use encourages pro-environmental behavior: evidence from China. J. Clean. Prod. 256, 120725. doi:10.1016/j.jclepro.2020.120725
Guo, F., Zheng, X., Wang, C., and Zhang, L. (2022). Sharing matters: household and urban economies of scale for a carbon-neutral future. Resour. Conserv. Recycl. 184, 106410. doi:10.1016/j.resconrec.2022.106410
Haans, R. F. J., Pieters, C., and He, Z. (2016). Thinking about U: theorizing and testing U - and inverted U -shaped relationships in strategy research. Strateg. Manag. J. 37, 1177–1195. doi:10.1002/smj.2399
Heinonen, J., and Junnila, S. (2011). Implications of urban structure on carbon consumption in metropolitan areas. Environ. Res. Lett. 6, 014018. doi:10.1088/1748-9326/6/1/014018
Hertwich, E. G., and Peters, G. P. (2009). Carbon footprint of nations: a global, trade-linked analysis. Environ. Sci. Technol. 43, 6414–6420. doi:10.1021/es803496a
Hou, J., Li, W., and Zhang, X. (2024). Research on the impacts of digital economy on carbon emission efficiency at China’s City level. PloS One 19, e0308001. doi:10.1371/journal.pone.0308001
Ivanova, D., Stadler, K., Steen-Olsen, K., Wood, R., Vita, G., Tukker, A., et al. (2016). Environmental impact assessment of household consumption. J. Ind. Ecol. 20, 526–536. doi:10.1111/jiec.12371
Jin, X., and Yu, W. (2022). Information and communication technology and carbon emissions in China: the rebound effect of energy intensive industry. Sustain. Prod. Consum. 32, 731–742. doi:10.1016/j.spc.2022.06.004
Kim, H. B., Iwamatsu, T., Nishio, K., Komatsu, H., Mukai, T., Odate, Y., et al. (2020). Field experiment of smartphone-based energy efficiency services for households: impact of advice through push notifications. Energy Build. 223, 110151. doi:10.1016/j.enbuild.2020.110151
Kim, J., Jang, M., and Shin, D. (2019). Examining the role of population age structure upon residential electricity demand: a case from korea. Sustainability 11, 3914. doi:10.3390/su11143914
Lei, X., Ma, Y., Ke, J., and Zhang, C. (2023). The non-linear impact of the digital economy on carbon emissions based on a mediated effects model. Sustainability 15, 7438. doi:10.3390/su15097438
Li, T., Jiang, Y., and Zhao, Y. (2024). Does mobile payment foster low-carbon lifestyles? Evidence from Alipay’s “collecting five blessings” campaign. J. Clean. Prod. 463, 142513. doi:10.1016/j.jclepro.2024.142513
Li, T., and Ma, J. (2021a). Does digital finance benefit the income of rural residents? A case study on China. Quant. Finance Econ. 5, 664–688. doi:10.3934/QFE.2021030
Li, X., Zhang, D., Zhang, T., Ji, Q., and Lucey, B. (2021b). Awareness, energy consumption and pro-environmental choices of Chinese households. J. Clean. Prod. 279, 123734. doi:10.1016/j.jclepro.2020.123734
Li, Z., and Wang, J. (2022). The dynamic impact of digital economy on carbon emission reduction: evidence city-level empirical data in China. J. Clean. Prod. 351, 131570. doi:10.1016/j.jclepro.2022.131570
Liu, W., Spaargaren, G., Heerink, N., Mol, A. P. J., and Wang, C. (2013). Energy consumption practices of rural households in north China: basic characteristics and potential for low carbon development. Energy Policy 55, 128–138. doi:10.1016/j.enpol.2012.11.031
Luo, S., Sun, Y., and Zhou, R. (2022). Can fintech innovation promote household consumption? Evidence from China family panel studies. Int. Rev. Financ. Anal. 82, 102137. doi:10.1016/j.irfa.2022.102137
Ma, R., Zheng, X., Zhang, C., Li, J., and Ma, Y. (2022). Distribution of CO2 emissions in China’s supply chains: a sub-national MRIO analysis. J. Clean. Prod. 345, 130986. doi:10.1016/j.jclepro.2022.130986
Mi, Z., Zheng, J., Meng, J., Ou, J., Hubacek, K., Liu, Z., et al. (2020). Economic development and converging household carbon footprints in China. Nat. Sustain. 3, 529–537. doi:10.1038/s41893-020-0504-y
Pu, Z., and Fei, J. (2022). The impact of digital finance on residential carbon emissions: evidence from China. Struct. Change Econ. Dyn. 63, 515–527. doi:10.1016/j.strueco.2022.07.006
Qin, X., Wu, H., and Li, R. (2022). Digital finance and household carbon emissions in China. China Econ. Rev. 76, 101872. doi:10.1016/j.chieco.2022.101872
Sarfraz, M., Ivascu, L., Abdullah, M. I., Ozturk, I., and Tariq, J. (2022). Exploring a pathway to sustainable performance in manufacturing firms: the interplay between innovation capabilities, green process, product innovations and digital leadership. Sustainability 14, 5945. doi:10.3390/su14105945
Sharif, A., Raza, S. A., Ozturk, I., and Afshan, S. (2019). The dynamic relationship of renewable and nonrenewable energy consumption with carbon emission: a global study with the application of heterogeneous panel estimations. Renew. Energy 133, 685–691. doi:10.1016/j.renene.2018.10.052
Shirley, R., Jones, C., and Kammen, D. (2012). A household carbon footprint calculator for islands: case study of the United States Virgin Islands. Ecol. Econ. 80, 8–14. doi:10.1016/j.ecolecon.2012.04.027
Song, K., Qu, S., Taiebat, M., Liang, S., and Xu, M. (2019). Scale, distribution and variations of global greenhouse gas emissions driven by U.S. households. Environ. Int. 133, 105137. doi:10.1016/j.envint.2019.105137
Wang, J., Dong, X., and Dong, K. (2022). How digital industries affect China’s carbon emissions? Analysis of the direct and indirect structural effects. Technol. Soc. 68, 101911. doi:10.1016/j.techsoc.2022.101911
Wang, S., Sun, S., Zhao, E., and Wang, S. (2021). Urban and rural differences with regional assessment of household energy consumption in China. Energy 232, 121091. doi:10.1016/j.energy.2021.121091
Wei, Y.-M., Liu, L.-C., Fan, Y., and Wu, G. (2007). The impact of lifestyle on energy use and CO2 emission: an empirical analysis of China’s residents. Energy Policy 35, 247–257. doi:10.1016/j.enpol.2005.11.020
Wiedmann, T., Lenzen, M., Keyßer, L. T., and Steinberger, J. K. (2020). Scientists’ warning on affluence. Nat. Commun. 11, 3107. doi:10.1038/s41467-020-16941-y
Xu, X., and Han, L. (2017). Diverse effects of consumer credit on household carbon emissions at quantiles: evidence from urban China. Sustainability 9, 1563. doi:10.3390/su9091563
Xu, X., Han, L., and Lv, X. (2016). Household carbon inequality in urban China, its sources and determinants. Ecol. Econ. 128, 77–86. doi:10.1016/j.ecolecon.2016.04.015
Yin, X., Hao, Y., Yang, Z., Zhang, L., Su, M., Cheng, Y., et al. (2020). Changing carbon footprint of urban household consumption in Beijing: Insight from a nested input-output analysis. J. Clean. Prod. 258, 120698. doi:10.1016/j.jclepro.2020.120698
Yin, X., Zhang, J., and Ji, J. (2023). Nonlinear impact of digital economy on carbon intensity: the moderating role of low-carbon regulation. Environ. Sci. Pollut. Res. 30, 122346–122363. doi:10.1007/s11356-023-30770-8
Yin, Z., Wang, T., and Jiang, J. (2023). The impact of mobile payment on carbon consumption of Chinese households: evidence from household carbon footprint. Account. Econ. Res. 37, 99–116. doi:10.16314/j.cnki.31-2074/f.2023.01.006
Zhang, H., Shi, X., Wang, K., Xue, J., Song, L., and Sun, Y. (2020). Intertemporal lifestyle changes and carbon emissions: evidence from a China household survey. Energy Econ. 86, 104655. doi:10.1016/j.eneco.2019.104655
Zhang, J., and Wei, Z. (2023). Can the digital economy drive the low-carbon transformation of household consumption? Empirical evidence based on CFPS. Mod. Finance Economics-Journal Tianjin Univ. Finance Econ. 43, 3–19. doi:10.19559/j.cnki.12-1387.2023.09.001
Zhang, W., Liu, X., Wang, D., and Zhou, J. (2022). Digital economy and carbon emission performance: evidence at China’s city level. Energy Policy 165, 112927. doi:10.1016/j.enpol.2022.112927
Zhang, Y., Wang, F., and Zhang, B. (2023). The impacts of household structure transitions on household carbon emissions in China. Ecol. Econ. 206, 107734. doi:10.1016/j.ecolecon.2022.107734
Zhao, T., Zhang, Z., and Liang, S. (2020). Digital economy, entrepreneurship, and high-quality economic development: empirical evidence from urban China. J. Manag. World 36, 65–76. doi:10.19744/j.cnki.11-1235/f.2020.0154
Keywords: digital economy, household carbon emissions, consumption carbon emissions, inverted U-shape, carbon mitigation
Citation: Chen Y, Chen D, Gao C and Wei X (2025) The inverted U-shaped impact of the digital economy on indirect household carbon emissions — an empirical study based on CFPS. Front. Environ. Sci. 13:1519286. doi: 10.3389/fenvs.2025.1519286
Received: 30 October 2024; Accepted: 24 January 2025;
Published: 20 February 2025.
Edited by:
Ji Zheng, The University of Hong Kong, Hong Kong SAR, ChinaReviewed by:
Xuetao Sun, Ocean University of China, ChinaCopyright © 2025 Chen, Chen, Gao and Wei. This is an open-access article distributed under the terms of the Creative Commons Attribution License (CC BY). The use, distribution or reproduction in other forums is permitted, provided the original author(s) and the copyright owner(s) are credited and that the original publication in this journal is cited, in accordance with accepted academic practice. No use, distribution or reproduction is permitted which does not comply with these terms.
*Correspondence: Donglin Chen, Y2hlbmRsQHdodXQuZWR1LmNu
Disclaimer: All claims expressed in this article are solely those of the authors and do not necessarily represent those of their affiliated organizations, or those of the publisher, the editors and the reviewers. Any product that may be evaluated in this article or claim that may be made by its manufacturer is not guaranteed or endorsed by the publisher.
Research integrity at Frontiers
Learn more about the work of our research integrity team to safeguard the quality of each article we publish.