 Yu Chen1
 Jun Wang2*
- 1College of Economics and Management, Jilin Agricultural University, Changchun, China
- 2Center for Faculty Development, Jilin Agricultural University, Changchun, China
Rural multifunctionality (RMF) is a critical component of urban–rural overall planning and sustainable development. In China, rural areas have special functions that cannot be replaced by cities, such as residential carrying, agricultural and non-agricultural production, and ecological conservation. However, few studies have determined the direction of rural development and realized rural regional value from the RMF perspective. In this study, 30 counties in the Liaoning Coastal Economic Zone were taken as the research area, and the years 2000, 2013, and 2023 were selected as the research time nodes. This study constructed the RMF index from the living function, production function, and ecological function and systematically analyzed and depicted the spatiotemporal distribution process of rural functions using trend surface analysis and exploratory spatial data analysis. A geographical detector model was employed to further analyze the influencing factors. The results are as follows: (1) Rural regional agglomeration had obvious characteristics that are undergoing a key transformation from slow to radical. In the spatial dimension, it shows the tendency of high coupling multi-core agglomeration and low coupling dispersion. (2) The degree of coupling coordination indicated a shift from reluctant coordination to good coordination, and the gap across counties was narrowing. (3) The dominating determinants had shifted away from natural resources toward socioeconomic and policy environment factors. This will provide an effective reference for investigating the diversification of rural regional space in Liaoning Province, directing the rational use of rural land and accomplishing coordinated development of rural space.
1 Introduction
Rural space is a regional concept that refers to all areas outside the urban areas (Cassidy et al.,2010; Zhang et al., 2023). One of the most essential characteristics of rural space is function, and its change might signal a change in the land use of the area (Long et al., 2016; Tu et al., 2018; Argent, 1999). Rural multi-functional (RMF) originated from the agricultural multi-function and land use multi-function systems of the EU at the end of the 20th century (Yang et al., 2023a;Feinerman and Falkovit, 1991; Sophie et al., 2007). The OECD (Organization for Economic Co-operation and Development) noted that agriculture performs a variety of roles in restoring rural landscapes and preserving biodiversity in addition to producing food and fiber and supporting the sustainable growth of agriculture (García-Llorente et al., 2012; Marsden and Sonnino, 2008; Renting et al., 2013). Coordinating the contradictions between economic growth, life improvement, and ecological conservation in rural areas has become a pressing issue that must be addressed. Therefore, many studies have begun to expand the research scope of RMF (Jerzy Banski and Monika, 2010; Liu and Liu, 2012). In a given stage of social development, RMF refers to the beneficial role of a specific rural system to nature or mankind by giving play to its own attributes and its joint role with other systems in a larger regional space in a certain stage of social development (Li et al., 2015; Long et al., 2007; Agnoletti, 2014).
Rural reconstruction and evolution have become key issues in geographical studies (Agnoletti, 2014). For example, some studies that were primarily based on geography were gradually integrated into the disciplines of economics, sociology, landscape ecology, and biology and investigated the spatial distribution characteristics of rural connotation, classification, function, culture, and environment from various scientific perspectives (Kunitsa, 2012; Li et al., 2021). In establishing the evaluation index system, many studies have taken the geo-relational territorial system as the theoretical basis; classified the functional types of RMF in terms of resources, environment, humanities, economy, and other dimensions; analyzed the mechanism of differentiation of rural territorial development; and clarified the way of development of rural territorial sub-districts (Zhao et al., 2022). In terms of the research methodology, the data are usually quantified through the comprehensive index evaluation method, and then techniques such as the Gini coefficient, neural network model, local spatial autocorrelation, and gray correlation method are applied to study the delineation of rural functions and the evolution law (Zhen et al., 2024; Ma et al., 2023). For regions with different characteristics, how to establish a targeted RMF indicator system is a research hotspot.
With the continual advancement of urbanization and industrialization in China, the urban and rural economic structures and demographics are continuously recombining (Hualou, 2012; Xiong et al., 2021). It has led to many issues in rural regions, such as extensive and inefficient land use, chaotic construction, a lack of infrastructure and public services, encroachment on agricultural production space, and environmental deterioration (Yang et al., 2023b; Hu et al., 2020).
In particular, the Liaoning Coastal Economic Belt in Northeast China is both a national grain production functional area and a port industrial belt with international competitiveness. The Liaoning Coastal Economic Zone has a good agricultural foundation, concentrating half of the province’s agricultural population, accounting for approximately half of the province’s agricultural output, and accounting for approximately 40% of the province’s sown area and output of major grain crops. However, there is an imbalance in the structure of supply and demand of agricultural products, and there are many people with little land, little arable land, little fresh water, and high pollution from agricultural sources, resulting in serious pollution of the water environment (Ma and Zheng, 2018). Its rural development has always been in a weak position. The key to treating “rural sickness” is to appropriately construct the RMF identification system, optimize the rural “living, production, ecology” space, and achieve the multifunctional and coordinated development of rural space (Liu, 2020; Long et al., 2021).
Since 2000, China’s development paradigm has shifted, with the relationship between urban and rural areas changing and rural construction entering a new phase. In 2013, the Central Government’s Document No. 1 centered on the three rural issues and provided a top-level design for rural development in order to solve the problems of the three rural issues. In 2023, Liaoning Province issued the “14th Five-Year Plan for Modernization of Agriculture and Rural Areas in Liaoning Province,” marking the beginning of a new phase. Based on the background of the Rural Revitalization Strategy, this study aimed primarily to (1) establish an RMF index system and describe the features of rural regional spatial–temporal diversification in the research area in 2000, 2013, and 2023; (2) measure the coupling and interacting relationship between mutual promotion and mutual stress of living, production, and ecosystem, as well as perform spatial comparison and time series analysis; (3) investigate the primary drivers of the geographical difference in RMF level in the research region using Geodetector, as well as the action intensity of various factors on spatial–temporal distribution. The findings of this study will provide new research ideas for exploring rural regional space diversification and achieving multifunctional and coordinated rural space development in Liaoning Province.
2 Materials and methods
2.1 Study area
The Liaoning Coastal Economic Belt, located in the south of Liaoning Province, is an important intersection between the Bohai Rim and Northeast China (Figure 1). Dalian, Dandong, Jinzhou, Yingkou, Panjin, and Huludao are among the six coastal cities that make up the Economic Belt. In this article, we selected the Economic Belt’s 30 counties as the study area. There is great potential for the development and utilization of land resources, with a wide range of low yields or abandoned salt fields, saline-alkali soils, desolate beaches, and usable beaches. The Liaoning Coastal Economic Belt’s GDP was 1.23 × 10¹² yuan (RMB) at the end of 2023, accounting for 49.23% of the province’s overall economy. The permanent resident population is approximately 1.78 × 10⁷, with the rural population accounting for approximately 5.16 × 10⁶. The per capita net income of farmers is 1.70 × 10⁶ yuan (RMB). Emerging industries and manufacturing are the dominant industries in the Economic Belt, while its rural economy is weak. Furthermore, several ecological issues have become increasingly prominent, such as a lack of freshwater, seawater backflow, and marine pollution. In constructing a beautiful village “suitable for living, working, and touring” in Liaoning Province, how to harmonize the contradictions between economic growth, life enhancement, and ecological protection in rural regions has become an important challenge to be solved.
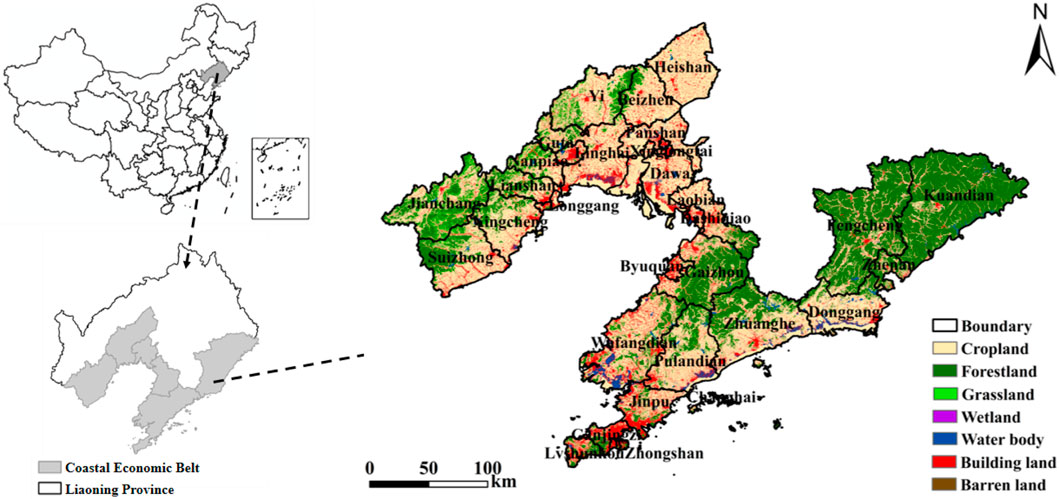
Figure 1. Location map of the Liaoning Coastal Economic Belt.
2.2 Data sources
The land use data of the Liaoning Coastal Economic Belt in 2000, 2013, and 2023 were taken from the Resource and Environmental Science and Data Center (https://www.resdc.cn/). NDVI data were based on the Geospatial Data Cloud Platform (http://www.gscloud.cn/) and downloaded landsat8 OLI with a resolution of 15 m × 15 m. Ecosystem service value was calculated by using the method given by Costanza et al. (1996) and Xie et al. (2003). The economic value of an ecosystem valued equivalent in Liaoning Province is 5.53 × 10³ yuan (RMB)/hm2. The socioeconomic data mainly came from the Liaoning Statistical Yearbook (Liaoning Provincial Bureau of Statistics, 2001, 2014, 2024), Liaoning Statistical Survey Yearbook (Liaoning Provincial Bureau of Statistics, 2001, 2014, 2024), Liaoning Rural Statistical Yearbook (Liaoning Provincial Bureau of Statistics, 2001, 2014, 2024), China County Statistical Yearbook (National Bureau of Statistics, 2001, 2014, 2024), Liaoning Provincial Water Resources Bulletin (Liaoning Provincial development of water resources), and the National Economic and Social Statistical Bulletin, a Government Work Report in 2023.
2.3 Research methods
2.3.1 Construction of index system
Natural endowment, geographical circumstances, economic basis, human resources, cultural customs, and other variables within a certain rural region make up a rural system with a specific function (Liu and Liu, 2012). Different elements have an influence on the evaluation of RMF (Hualou, 2012; Liu et al., 2011). The rural area is diversified and intricate because these functions are not separate but rather complex with reciprocal effects (Figure 2). The living function refers to the ability of various spaces provided by the countryside to provide material and spiritual support to ensure human survival and development. People are the most active elements in the whole rural area, so the living function is the most basic function in the entire rural environment. The essential objective and significant main line of people’s production activities is to improve the quality of life and livable level. The production function is formed by the mutual connection and interaction of various production factors within a certain region, which provides consumer goods and various services required for people’s survival and development and increases social wealth. The ecological function refers to the ability of rural areas to maintain the material cycle of life and provide ecological resources. The ecosystem is diverse, comprehensive, and dynamic. It is a prerequisite for the smooth progress of industrial development, urban construction, and other activities. This study refers to the existing research results to construct the RMF evaluation system (Table 1) (Gómez-Limón et al., 2012; Gu et al., 2019; Zhu et al., 2024).
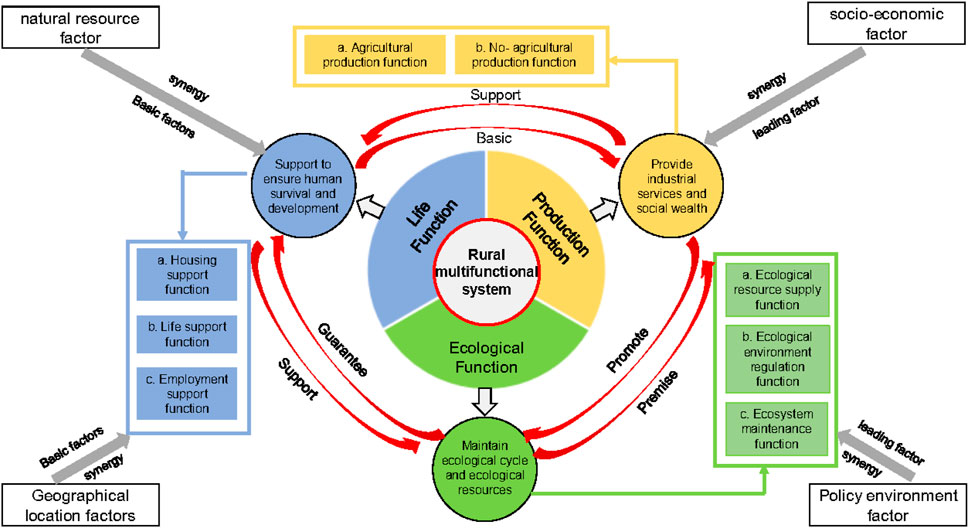
Figure 2. Structure of the RMF system.

Table 1. RMF index system of the Liaoning Coastal Economic Belt.
The calculation of the RMF evaluation value involves multiple indicators, and because of the differences in the outline and units of the indicators, the extreme value method is used to normalize the evaluation indicators as a whole, while Criteria Importance Through Intercriteria Correlation (CRITIC) weighting method is applied to determine the weights of the indicators (Yu et al., 2024).
2.3.2 Identification of influencing factors
Table 3 indicates the spatial distribution of RMF will be comprehensively affected by natural resource factors, socioeconomic factors, geographical location factors, and policy environment factors. Based on this, our study selects 10 influencing factors and uses the Geodetector to reveal the possible causal relationship between several indicators (Table 2) (Knickel and Renting, 2000; Bao et al., 2022; Yang et al., 2023a). Among them, the natural resource factors are the internal factors affecting the RMF level. They play a critical role in the formation of the multifunctional level’s spatial differentiation form, which is primarily manifested in the combination of natural conditions such as geology, landform, vegetation, and climate. The affecting elements were the average elevation (EAVG), the cultivated land reclamation rate (CLRR), and the cultivated land area above 25° (CLA25°). Socioeconomic factors represent the socioeconomic level formed by the development of social productivity and are external factors affecting the RMF level. They have a major impact on the land use mode via industrial structures, external goods, and infrastructure. The affecting elements were the proportion of primary industry (PPI), the balance of residents’ savings deposits (BRSD), the farmers’ per capita net income (FPCNI), and the science and technology expenditure (STL). Geographical location factors refer to the relationship between traffic routes and facilities in an area. The affecting elements were the traffic accessibility (TA) and the distance between administrative villages and the prefecture-level cities (PLC). Policy environment factors are a key adjustment tool for dealing with diverse tensions in regional land relationships. They are action criteria stated in the development, usage, governance, preservation, and management of land resources. The affecting element is the afforestation area (AA).
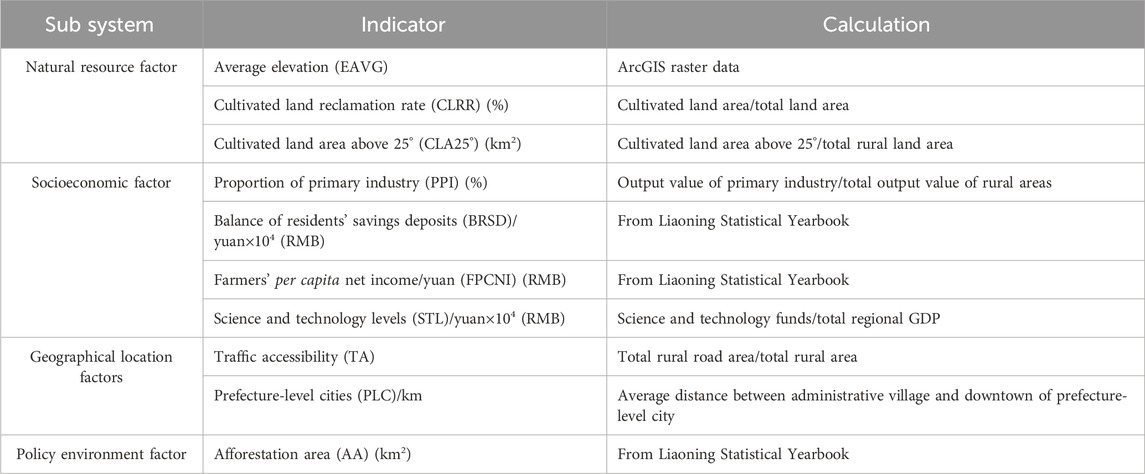
Table 2. Influencing factor index system.
2.3.3 Exploratory spatial data analysis method
The exploratory spatial data analysis method was used to reveal the spatial relationship and correlation of RMF levels among districts and counties in the Economic Belt.
2.3.3.1 Global spatial autocorrelation analysis
Global spatial autocorrelation analysis can be expressed as follows:
where W ij is the spatial weight matrix, Xi and X j are the RMF indexes of district I and district J,
2.3.3.2 Local spatial autocorrelation analysis
Local spatial autocorrelation reflects the specific location and spatial pattern characteristics of agglomeration in the study area. The spatial hotspot detection analysis (Getis-ord GI*) showed the “hotspot” and “coldspot” locations using GIS. The expression is
where if it is positive and statistically significant, it is a high-value spatial agglomeration (hotspot zone). If it is negative and statistically significant, it is a low-value spatial agglomeration (coldspot zone).
2.3.3.3 Coupling coordination model
The phenomenon of coupling refers to the situation in which two or more systems impact each other through various interactions. The coupling model was used to measure the degree of interaction between systems or elements within the system (Fang and Chaobao, 2004). The coordination model was used to measure the relationship between coordination and the virtuous circle between systems or elements. The coupling model can be expressed as follows:
where C expresses the RMF coupling degree ([0,1]). Lf, Pf, and Ef are values of rural living production and ecological function.
The coordination model can be expressed as follows:
2.3.3.4 Trend surface analysis
Trend surface analysis is a mathematical method for simulating the spatial distribution and changing trends of geographic system elements using mathematical surfaces. The principle of trend surface analysis is as follows:
where
2.3.3.5 Geodetector
Geodetector is a statistical method to detect spatial diversity and reveal the driving force behind it (Wang and Chengdong, 2017). The factor detector measures the interpretation degree of high values of variables corresponding to different factors. The interaction detector measures whether the influencing factors act independently or dependently. The factor detector can be expressed as follows:
where qi is the influence of influencing factor i on RMF distribution, L is the stratification of influencing factor i, Nh and
Interaction analysis determines whether there is an interaction between factors by comparing the explanatory power (q-value) of a single factor and a combination of multiple factors (Table 3).
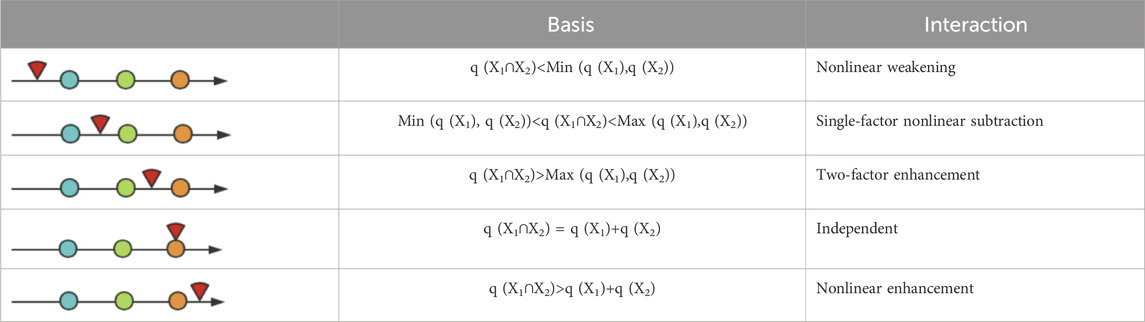
Table 3. The type of interaction between two independent variables and dependent variables.
3 Result
3.1 Global trend characteristics
The three-dimensional perspective of various functional indicators of rural land use in the Economic Belt from 2000 to 2023 is fit and constructed by using the trend analysis tool (Figure 3). Overall, RMF has distinct geographical features.
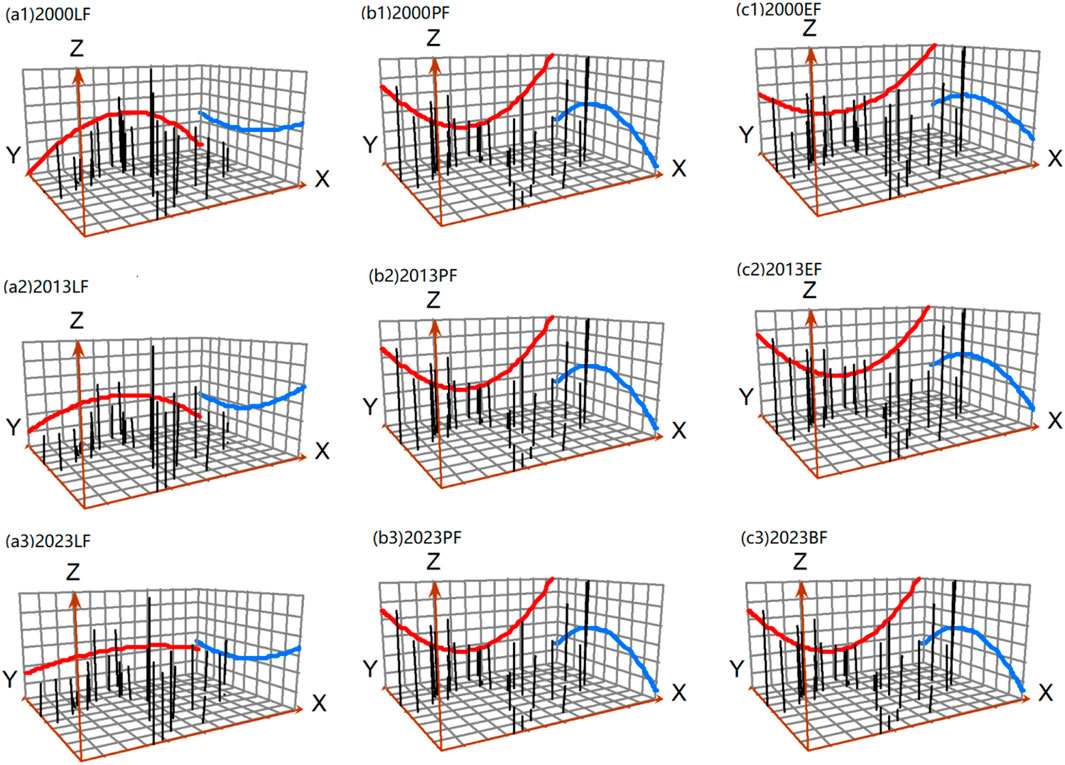
Figure 3. Three-dimensional perspective of the global trends of various functional indexes from 2000 to 2023.
The living function exhibited a tendency of upward bending in the center and downward bending on both sides on the y-axis, but the regional disparities tend to flatten out with time. On the x-axis, it displays a decreasing tendency, indicating that the high-value area of the rural living function index is concentrated in the middle (Figure 3a1–a3). The production function exhibited was high in the north–south direction and low in the middle on the y-axis, showed an uplift in the middle, and downward bending on both sides on the x-axis. It illustrates that the production function has always been concentrated on Dalian and Yingkou in the southeast from 2000 to 2023 and gradually spread outward (Figure 3b1–b3). The ecological function of the Middle East region was always higher than that of other regions in the county, indicating that the ecological function centered on Dandong City showed a trend of continuous expansion, and the bending range showed an increasing trend. This also fully confirms the increasingly significant characteristics of the ecological spatial differentiation pattern, while there is still potential for improvement (Figure 3c1–c3).
3.2 Spatiotemporal distribution characteristics
3.2.1 Global spatial autocorrelation analysis
The Moran’s I index of RMF was calculated using the univariate Moran’s I module in GeoDa. (1) At 90% confidence, there is a significant spatial positive correlation; that is, the high and low values of various functions show significant aggregation in spatial distribution, among which the ecological function is the most obvious, followed by the industrial production function, and finally the living function. (2) When the Moran’s I indexes of the three time nodes are compared from 2000 to 2023, the rural functional indexes are found to be increasing, indicating that the spatial agglomeration degree of rural functions is increasing over time and multifunctional areas are extending and expanding in spatial distribution.
3.2.2 Local spatial autocorrelation analysis
In rural living functions, the local agglomeration degree demonstrated a “from north to south” geographical evolution tendency from 2000 to 2023 (Figure 4a1–a3). In 2000, the hotspot zones were concentrated in Bayuquan District and Xinglongtai District, which are strongly attracted and radiated by the city due to its full infrastructure, public facilities, and a wide range of living activities. The coldspot zone was centered in Huludao City, which encompassed Jianchang County, Lianshan District, Xingcheng City, and Nanpiao District. These areas are located in the concentrated contiguous area of Songling and Yanshan Mountains. In terms of topography and living circumstances, the area was not appropriate for large-scale dwellings. In 2013, the hotspot zones were relocated to Ganjingzi District, Lushunkou District, and Changhai County of Dalian. The conditions of a developed economy and superior location provided a material basis for the high agglomeration of living functions. The sub-coldspot zones were scattered, mainly in Xingcheng City, Linghai City, and Fengcheng City. In 2023, the concentration of living functions gradually decreased, with the hotspot zones concentrated in Wafangdian City and Jinpu New Area of Dalian; the sub-coldspot area was Linghai City of Jinzhou City.
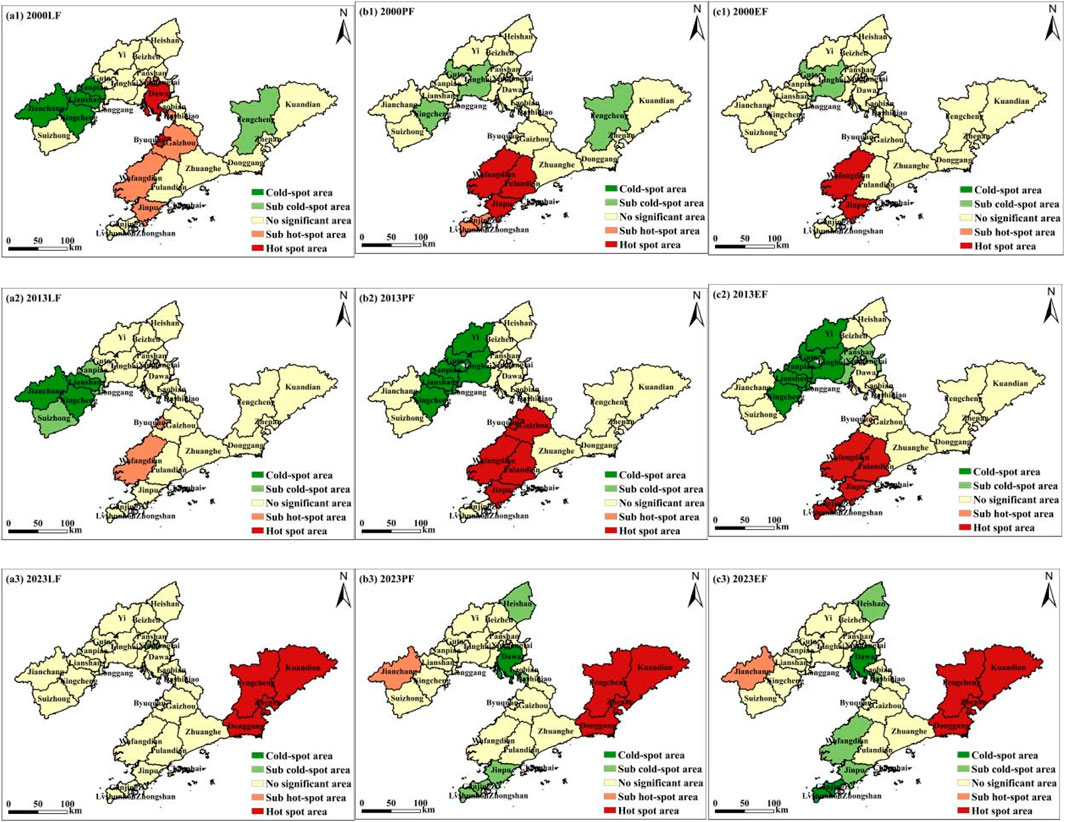
Figure 4. Spatio-temporal distribution of RMF hotspot and coldspot zones in the Liaoning Coastal Economic Belt from 2000 to 2023.
The rural production function has obvious regional agglomeration from 2000 to 2023 (Figure 4b1–b3). In 2000, the sub-hotspot zones were concentrated in Wafangdian City and Bayuquan District, and the coldspot zone was concentrated in Lianshan District, Xingcheng City, and Jianchang County, with a weak agglomeration effect. The Economic Belt’s industrial structure was uncoordinated in the 1990s; agricultural production technology was backward, and the level of mechanization and water conservation was low. At the same time, the ability to absorb employment was weak, and the agglomeration effect of innovative industrial clusters was not significant. In 2013, the agglomeration characteristics increased significantly. The hotspot zone gradually spread outward, with Dalian and Yingkou as the core. This indicates that these regions have focused on encouraging the development of the marine industry and high-tech industry since 2013, resulting in rapid industrial transformation and upgrading and structural optimization, relying on the regional advantages of the Bohai Rim region and Northeast China. The coldspot zones were mainly located in Jinzhou City and Huludao City. In 2023, the industrial agglomeration effect shows a pattern of “reduction and expansion,” such as the reduction of the hotspot zones, the transformation of Gaizhou City from hotspot to sub-hotspot; the scope of the coldspot zones expanded, with two sub-coldspot zones, Panshan county and Xinglongtai District, added.
In the rural ecological function, Dandong City demonstrated a pattern of steady increase from 2000 to 2023 (Figure 4c1–c3). In 2000, the hotspot zones were located in the whole area of Dandong City, accounting for 25%. Dandong’s ecological quality was at the highest level in the province, and the function of ecological resource supply and stability maintenance was high. The sub-coldspot zone was Xinglongtai District. The living and production land in this area continues to encroach on the ecological land. The development of rural living and production functions came at the price of the rural natural environment, which has clearly degraded. In 2013, the hotspot zone was still Dandong City; the coldspot and the sub-coldspot zones were Dawa County and Heishan County, Laobian District, Jinpu New Area, Ganjingzi District, and Lushunkou District, respectively, with weak ecological conservation functions. In 2023, the hotspot zones remained the same. The coldspot zones were Dawa County, Lushunkou District, and Ganjingzi District. As a coastal district and county, local ecological resources are rare, seawater backflow, a lack of freshwater resources, and other ecological and environmental concerns are common, and ecological land is continually eroded by living and producing land. The concentrated expansion of industry and tourism destroys the rural living environment, resulting in an obvious degradation of ecological conservation function and the formation of an ecological low agglomeration area.
3.3 Spatio-temporal distribution characteristics of coupling coordination degree
According to the coordination degree model, the rural functional coupling and coordination degree is divided into 10 levels according to the international division standards (Yang et al., 2020; Li et al., 2012) (Figure 5). The findings show that in the time dimension, the RMF coupling coordination degree in 30 districts and counties shows a “gradual upward” trend from reluctant coordination to good coordination, with the average value increasing from 0.59 to 0.64. In the spatial dimension, there are obvious regional differences, demonstrating the tendency of “high value multi-core agglomeration and low value wide distribution,” showing the characteristics of gradual outward diffusion with the Dalian–Yingkou–Panjin axis as the core. In 2000, the coupling coordination degree was 0.59.
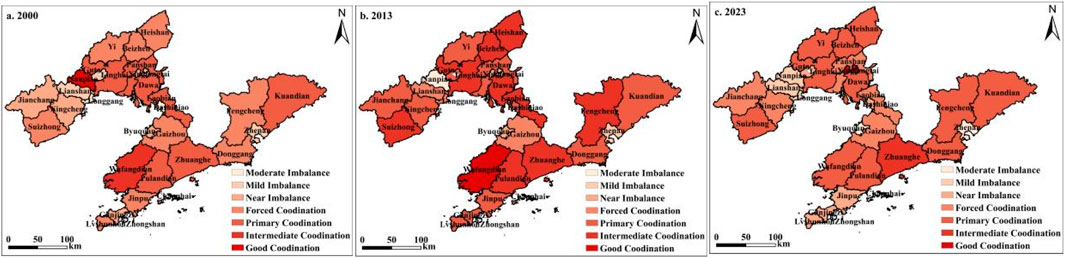
Figure 5. Multifunctional coupling coordination spatial distribution in the Liaoning Coastal Economic Belt from 2000 to 2023. (A) 2000. (B) 2013. (C) 2023.
The types of coupling coordination degrees mainly include serious imbalance, mild imbalance, reluctant coordination, primary coordination, intermediate coordination, good coordination, and high-quality coordination. Among them, the areas of forced coordination, primary coordination, and intermediate coordination accounted for 86.99%, mainly primary and intermediate, and the degree of coupling coordination was low. In 2013, the coupling coordination degree was 0.62, the type of serious imbalance disappeared, the type of primary coordination increased, and the coupling coordination degree was at a medium level. Six counties within Huludao City’s administration have increased their coupling coordination degree, whereas Shuangtaizi District, Xinglongtai District, and Zhen’an District have reduced their coupling coordination degree. In 2023, the coupling coordination degree was 0.64, and 90% of the regions were coordinated.
The gap in coupling coordination degree counties continued to decrease, showing that rural living, production, and ecological functions in the Economic Belt were closely associated and in a stage of benign coupling development. However, Wafangdian City, Changhai County, Zhen’an District, Bayuquan District, and other economically developed metropolitan areas have experienced a “retrogressive” process of rural functional coupling and coordination, indicating that these areas are ignoring the improvement of the rural living environment and ecological environment while vigorously developing the rural economy.
3.4 Analysis of influencing factors
3.4.1 Impact factor identification
In 2000, PLC, FPCNI, and CLA25° were the major factors affecting RMF spatial distribution. In 2013, CLA25°, AA, and STL were the major factors affecting RMF spatial distribution. In 2023, AA, FPCNI, and BRSD were the major factors affecting RMF spatial distribution (Table 4). Overall, the dominant factor of RMF spatial distribution is shifting away from natural resources to socioeconomic factors and policy environment. From 2000 to 2023, natural resources had some impact on RMF, but the dependence continued to decline, and each factor’s influence ranking decreased. For example, the q value of CLRR decreased from 0.336 to 0.105, and the q value of CLA25° decreased from 0.420 to 0.311. Simultaneously, the explanatory ability of PPI’s spatial distribution in 2013 and 2023 is tiny and failed to pass the significance test, indicating agricultural production and ecological functions are steadily reduced as secondary and tertiary industries develop and upgrade. The aggregate q value of socioeconomic and policy environmental elements has steadily grown over time, and the ranking eventually rose to the top. For example, the rising q values of FPCNI and STL show that improving the rural regional economy leads to an increase in farmers’ demand for self-development and accelerates the process of agricultural modernization. Meanwhile, the explanatory power of AA has gradually increased under the background of ecological civilization construction. The introduction of a series of policies, such as “the policy of returning farmland to forest ” and “Building a Shared Future for All Life on Earth,” has significantly improved the level of regional ecological function.
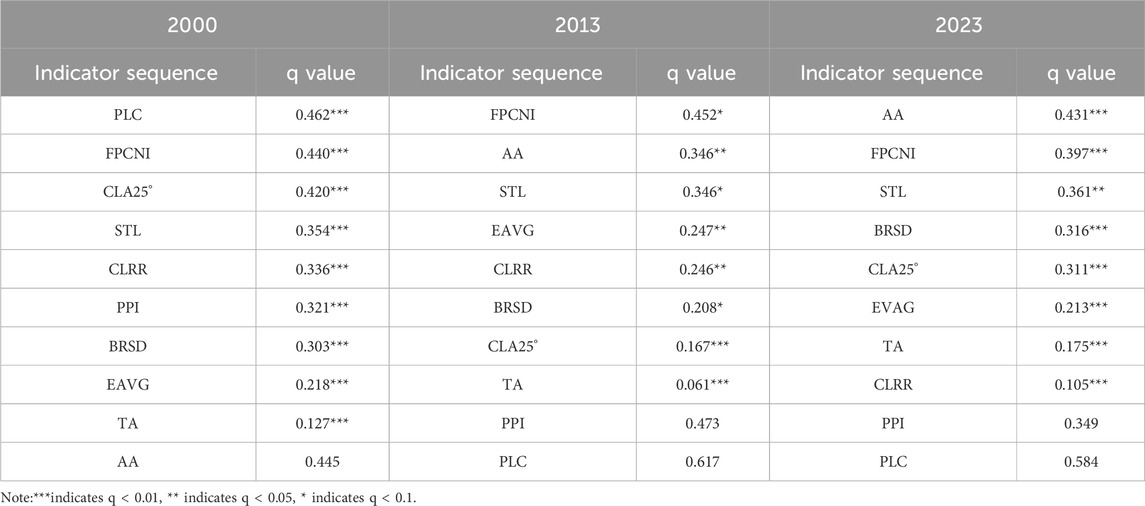
Table 4. Factor detection results of rural multifunctional system from 2000 to 2023.
3.4.2 Interaction of influencing factors
The 2023 time point is used as an example to detect the interaction of different influencing factors (Figure 6). The results reveal that the interaction of any two factors is greater than that of a single factor. The types of interaction are double factor enhancement and nonlinear enhancement, and there is no independent and weakening relationship. There are five double-factor enhancements and 40 nonlinear enhancements. In 2023, the highest q value, BRSD ∩ PLC, is 0.999, and the lowest, BRSD ∩ EAVG, is 0.757. It explains that the interaction between influencing factors is conducive to enhancing the explanatory power of the spatial-temporal evolution of RMF; that is, the spatial–temporal evolution is the result of the combined influence of multiple factors. Therefore, it is further verified that the socioeconomic data, especially the FPCNI and STL, are the leading influencing factors of spatial-temporal evolution, and the interaction between these two factors and other factors can explain the spatial-temporal distribution of RMF to a large extent.
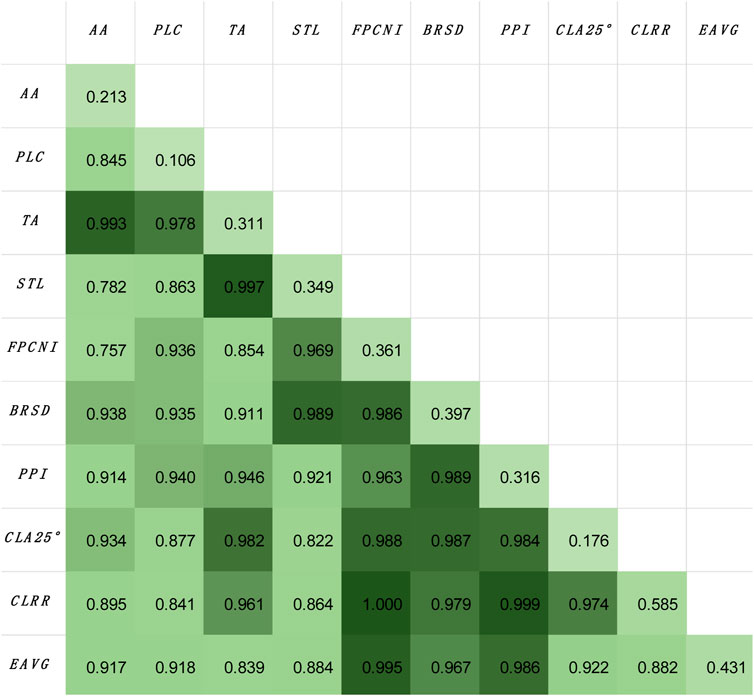
Figure 6. Interactive detection values of the rural multifunctional system in 2023.
4 Comprehensive policy recommendations for strengthening rural development
The two-dimensional graph theory clustering method was used to provide measures for rural development (Zhang et al., 2020; Chang et al., 2017). In this way, it can maintain the relative constancy of natural resources and socioeconomic data within each county and maintain the continuity and integrity of administrative divisions. We classified 30 counties in the Economic Belt as having six categories of rural development and proposed management methods (Figure 7).
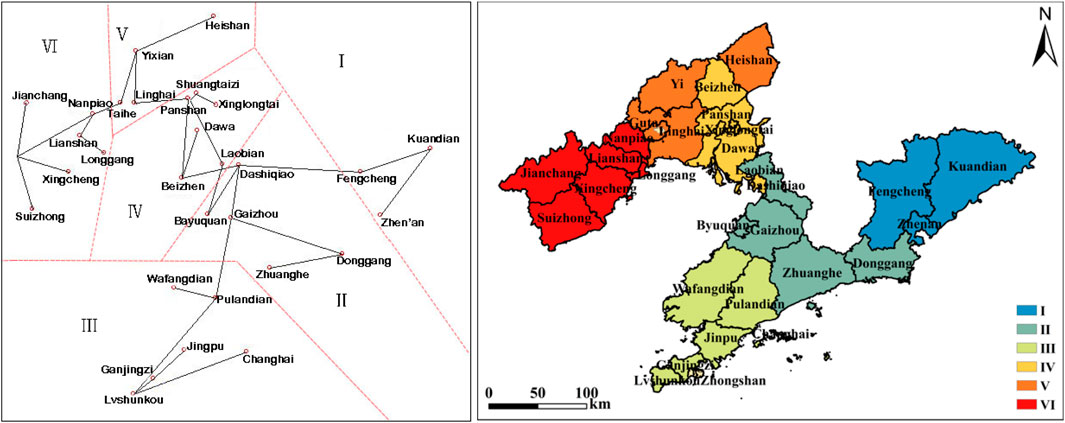
Figure 7. RMF minimum generating tree and functional partition in 2023.
Coordination and optimization area (Zone I). The RMF value is 0.233–0.252–0.458, indicating undeveloped functions and a mild imbalance of three functions. This area’s physical position and socioeconomic status are both deplorable. In recent years, there has been a certain amount of idle land in these regions representative of typical resource-depleted cities in Liaoning Province, which directly impacts the land usage rate, output rate, and utilization efficiency of villages. Therefore, the first step is to reinvigorate inefficient and idle land, to rationally manage the land use scale and layout of villages, and to strengthen the rehabilitation of old and damaged dwellings. The second step is to comprehend the “dual strategic posture” of the Economic Belt and the integration of western Liaoning into Beijing, Tianjin, and Hebei, promote distinctive agriculture, and improve agricultural machinery and agronomy integration system development. The third requires adhering to ecological priority by aiming for carbon neutrality and emission peak, reducing rural household and production waste, and preventing environmental morbidity.
Potential lifting area (Zone Ⅱ). The RMF value is 0.272–0.391–0.280, which is characterized by living function, strong development strength, and tremendous potential. Some counties are adjacent to metropolitan regions, where secondary and tertiary industries have a solid development base. The per capita net income of farmers can reach 20,000 yuan (RMB), ranking first in the province for several years in a row and indicating that the proportion of property and transfer income of rural residents in this region is high. However, there is wasteful internal friction and low-level repeated construction in land use, which obstructs the efficiency of industrial integration and the optimal utilization of land resources. In the future, we should mobilize villagers to establish a business model by taking shares in villagers’ homesteads and agreeing on specific cooperation methods, dividend methods, and compensation methods to provide a strong guarantee for the economic increase of rural residents. We will conduct experimental projects to change rural residential land, revitalize deteriorating historic dwellings, and optimize rural house layout.
Moderate lifting area (Zone Ⅲ). The RMF value is 0.339–0.390–0.386, with agriculture production being the most important function, and the three functions are strongly coordinated. This area is part of the “western Liaoning Corridor.” The East is a transportation center that connects North and Northeast China. As a national commodity grain base, this area is an important part of the main agricultural production area of Liaoning Province. All counties should accelerate agricultural supply-side structural reform, increase cultivated land output efficiency, strengthen agricultural structure adjustment, and prioritize the processing of agricultural goods and export of healthy food as rural pillar industries. While strengthening the agricultural production function, we should focus on the prevention and management of agricultural film pollution to avoid agricultural pollution.
Key promotion area (Zone Ⅳ). The RMF value is 0.284–0.404–0.381, which is characterized by a high level of non-agricultural production and comprehensive rural development. This is the “Northeast Asia International Trade Center.” In the future, the first steps will highlight the leading role of the comparative advantage function of non-agricultural industries and strive to cultivate and expand three new industries: clean energy, tourism, and healthcare, and further consolidate and enhance the development of rural enterprises and tourism. The second step will establish a modern green agriculture cluster represented by planting, breeding, and processing of agricultural products, develop the agricultural complementary industry, and promote farmers’ sustained and stable increase in production and income. The third phase will delineate the red line for regional ecological protection and reduce the use of high-quality cultivated land and ecological land for non-agricultural industry growth.
Ecological guarantee area (Zone Ⅴ). The RMF value is 0.207–0.328–0.656, which is characterized by high agglomeration conditions of natural resources, strong functions of ecological maintenance and stability, and weak living and production functions. This area is a part of the mountains and hills in Eastern Liaoning. It is the province’s most abundant source of ecological resources and the primary supplier of ecological goods. Regional water resources are plentiful, with the per capita water volume reaching 3968 km3, ensuring the smooth growth of regional industrial development, urban building, and other activities. The development of this region should take the initiative to launch eco-agricultural products and eco-tourism products and actively develop the processing industry of agricultural and sideline products with green and ecological characteristics in conjunction with the border economy and national characteristics. Concurrently, a village landscape corridor, village leisure and greening ecological corridor, the regional water network space, and the waterfront area should be constructed.
Comprehensive development area (Zone Ⅵ). The RMF value is 0.382–0.422–0.280, which indicates an obvious industrial agglomeration effect and high people’s living standards. This area has a strong non-agricultural production function, and the attraction and radiation of cities increase the rural economic level. However, the per capita cultivated land area is declining, the reserve resources of cultivated land are severely depleted, and the contradiction between man and land is becoming increasingly prominent. The rural economy ignores the improvement of the rural living environment and the natural environment. While strengthening regional industrial agglomeration, regional development should fully protect rural residents’ housing and production land needs, establish a dynamic supervision system for the balance of cultivated land occupation and compensation, and pilot a project linking the increase and decrease of urban and rural construction land, in order to ensure the dynamic balance of agricultural production land and non-agricultural production land. The ease, livability, and comfort of the living environment will be improved by further optimizing the building of supporting infrastructure for rural life.
5 Discussion
5.1 Realistic change mechanism of RMF under multiple influencing factors
There is a complex relationship between the categories of rural regional functions and influencing factors. In the past 20 years, the dominating factors of RMF spatio-temporal distribution have shifted from natural factors to socioeconomic factors and policy environmental factors. The ability of natural resource limitations to affect rural development and functional transformation is increasingly lessened, and the effect ranking of diverse elements is low. Studies have shown that natural geography is the basic factor for the formation of the rural multifunctional pattern, and its influence is weakening. Regional economic strength, urbanization level, and fixed asset investment are the dominant factors affecting the evolution of rural multifunctional spatio-temporal patterns. Its influence is becoming more and more prominent, and the evolution of the rural multifunctional pattern in the future will still be mainly driven by the dominant factors of economic and social development (Zhang and Zhang, 2022). Our finding supports previous research conclusions (Yang et al., 2023b; Xu and Fang, 2021).
The decrease in q values for CLRR and CLA25° indicates that with the advancement of social and economic levels, as well as the optimization of policy environments, industry and tourism have developed and occupy a large amount of cultivated land, resulting in the decline of the agricultural production function, particularly the status of the cultivated land production function. Natural resource constraints on rural development and functional transformation are increasingly eroding. At the same time, the spatial distribution interpretation ability of PPI in 2013 and 2023 is tiny and fails the significance test, indicating that as secondary and tertiary industries grow and upgrade, agricultural production and ecological functions are continuously undermined. With time, the q value of regional economic strength rises to first place, becoming the most important factor impacting RMF. The increase in q values for FPCNI and SLT indicates that the combined action of endogenous driving force and favorable externalities of rural development has promoted the optimization and upgrading of agricultural production and employment structure in rural areas, which has a significant impact on rural social security and the agricultural production function. The explanatory power of policy environmental variables has steadily increased, the proportion of farmland returning to forest areas has increased, and the function of land ecological conservation is helpful to the improvement of the regional ecological environment (Kimmel and Hull, 2012). It will not only play a role in land ecological conservation, but it will also play a constraining role in regional economic growth, resulting in a multifunctional, holistic improvement of regional land use.
5.2 Limitations
Some limitations need to be considered when interpreting our findings. Due to the difficulties in gathering data, the RMF research scale chooses the macro size of the county, which is not refined to the micro village scale. Although the spatial elements of rural areas should be considered the main factors in the selection of indicators, the results can only represent the multi-function of rural areas at the macro level. In the future, typical villages and towns should be selected for micro-level research. At the same time, the multifunctional measurement indicators are being expanded. The article only constructs the rural regional multifunctional evaluation index system from the perspectives of “living, production and ecology” and lacks consideration of farmers’ behavior, policy guidance, and cultural environment. Whether the construction of the evaluation index system is universal remains to be further explored. RMF is the product of rural areas giving play to their own attributes and working together with other systems. As a village in the overall development area of the economic circle, the characteristics of regional function complexity and leading function differentiation are obvious. In the future, how to carry out rural regional multifunctional economic transformation and development, as well as village self-recovery functions, will continue to be a priority.
6 Conclusion
According to the findings, RMF has an extremely substantial spatial positive link with the passage of time. At the same time, the coupling coordination degree is showing a “gradual upward” trend from reluctant coordination to good coordination, and the gap across counties is shrinking. Natural resources have switched to socioeconomic variables and policy environment as the dominating drivers of RMF spatial differentiation during the last 20 years. The rapid non-agricultural transformation of agricultural production factors, the increasing empty and waste of village construction land, and the deep poverty of some rural areas are the most prominent structural contradictions in the development of the Economic Belt at this stage.
In view of the general distribution pattern of RMF vulnerable areas and local prominent strong areas in the study area, the Economic Belt urgently needs to promote benign and coordinated multi-functional development while optimizing and upgrading rural regional functions. Development plans should adopt a cluster development strategy in conjunction with advantageous rural industries, increase the radiation and driving function of strong areas, achieve complementary, mutual, and linking growth between villages and villages, and close the regional gap. At the same time, it is important that development actively protects the ecology and promotes the sustainable development of the village. Given the continued deterioration of the rural ecological function, we must focus on ecological building, optimize the structure of rural ecosystems, integrate development, and enhance the rural ecosystem’s overall economic, social, and ecological advantages in the future. We must continuously explore new rural industries, new formats, new models, and new technologies to realize the sustainable development of rural ecosystems.
Data availability statement
The original contributions presented in the study are included in the article/Supplementary Material; further inquiries can be directed to the corresponding author.
Author contributions
YC: conceptualization, formal analysis, methodology, software, supervision, validation, visualization, writing–original draft, and writing–review and editing. JW: data curation, supervision, validation, and writing–review and editing.
Funding
The author(s) declare that no financial support was received for the research, authorship, and/or publication of this article.
Conflict of interest
The authors declare that the research was conducted in the absence of any commercial or financial relationships that could be construed as a potential conflict of interest.
Generative AI statement
The author(s) declare that no Generative AI was used in the creation of this manuscript.
Publisher’s note
All claims expressed in this article are solely those of the authors and do not necessarily represent those of their affiliated organizations, or those of the publisher, the editors and the reviewers. Any product that may be evaluated in this article, or claim that may be made by its manufacturer, is not guaranteed or endorsed by the publisher.
References
Agnoletti, M. (2014). Rural landscape, nature conservation and culture: some notes on research trends and management approaches from a (southern) European perspective. Landsc. urban Plan. 126 (-), 66–73. doi:10.1016/j.landurbplan.2014.02.012
Argent, N. (1999). Inside the black box: dimensions of gender, generation and scale in the Australian rural restructuring process. J. Rural Stud. 15, 1–15. doi:10.1016/s0743-0167(98)00044-8
Bao, X., Dai, W., Liu, S., and Chen, S. l. (2022). Spatial differentiation and influencing factors of rural territorial multi-functions in urban-rural integration area: acase study of Eastern Fuzhou. J. Nat. Resour. 37 (10), 2688–2702. doi:10.31497/zrzyxb.20221015
Cassidy, L., Binford, M., Southworth, J., and Barnes, G. (2010). Social and ecological factors and land-use land-cover diversity in two provinces in Southeast Asia. J. land use Sci. 5, 277–306. doi:10.1080/1747423x.2010.500688
Chang, L., Lei, G., and Zhou, H., (2017). Land use in northeast China based on tow-dimenssion graphics cluster methods. Trans. Chin. Soc. Agric. Mach. 48 (12), 155–164. doi:10.6041/j.issn.1000-1298.2017.12.018
Costanza, R., Déarge, R., Groot, H., Farber, S., Grasso, M., Hannon, B., et al. (1996). The value of the world's ecosystem services and natural capital. Nature 387 (6630), 253–260. doi:10.1038/387253a0
Fang, C., and Chaobao, F., (2004). The coupling model of water-ecology-economy coordinated development and its application in heihe river basin. Acta Geogr. Sin. 59 (5), 781–790. doi:10.11821/xb200405017
Feinerman, E., and Falkovitz, M. S. (1991). An agricultural multipurpose service cooperative: pareto optimality, price-tax solution, and stability. J. Comp. Econ. 15 (1), 95–114. doi:10.1016/0147-5967(91)90107-5
García-Llorente, M., Martín-López, B., Iniesta-Arandia, I., López-Santiago, C. A., Aguilera, P. A., and Montes, C. (2012). The role of multi-functionality in social preferences toward semi-arid rural landscapes: an ecosystem service approach. Environ. Sci. and Policy 19-20 (5), 136–146. doi:10.1016/j.envsci.2012.01.006
Gómez-Limón, J. A., Vera-Toscano, E., and Rico-González, M. (2012). Measuring individual preferences for rural multifunctionality: the importance of demographic and residential heterogeneity. J. Agric. Econ. 63 (1), 1–24. doi:10.1111/j.1477-9552.2011.00325.x
Gu, X., Xie, B., Zhang, Z., and Guo, H. D. (2019). Rural multifunction in Shanghai suburbs: evaluation and spatial characteristics based on villages. Habitat Int. 92, 102041. doi:10.1016/j.habitatint.2019.102041
Hu, X., Li, H., and Zhang, X. (2020). On the re-cognition of rural definitions. Acta Geogr. Sin. 75 (02), 398–409. doi:10.11821/dlxb202002013
Hualou, L. (2012). Land use transition and rural transformation development. Prog. Geogr. 31 (02), 131–138. doi:10.11820/dlkxjz.2012.02.001
Jerzy Bański, A., and Monika, W. (2010). Transformations in housing construction in rural areas of Poland's Lublin region—influence on the spatial settlement structure and landscape aesthetics. Landsc. Urban Plan. 94 (2), 116–126. doi:10.1016/j.landurbplan.2009.08.005
Kimmel, C. E., and Hull, R. B. (2012). Ecological entrepreneurship support networks: roles and functions for conservation organizations. geoforum 43 (1), 58–67. doi:10.1016/j.geoforum.2011.07.003
Knickel, K., and Renting, H. (2000). Methodological and conceptual issues in the study of multifunctionality and rural development. Sociol. Rural. 40 (4), 512–528. doi:10.1111/1467-9523.00164
Li, T., Long, H., Liu, Y., and Tu, S. (2015). Multi-scale analysis of rural housing land transition under China's rapid urbanization: the case of Bohai Rim. Habitat Int. 48, 227–238. doi:10.1016/j.habitatint.2015.04.002
Li, Y., Kong, X., and He, J., (2021). Regional function evaluation and transformation characteristics of rural areain Hubei Province. China Land Sci. 35 (03), 79–87. doi:10.11994/zgtdkx.20210301.110146
Li, Y., Yi, L., Zhou, Y., Shi, Y., and Zhu, X. (2012). Investigation of a coupling model of coordination between urbanization and the environment. J. Environ. Manag. 98, 127–133. doi:10.1016/j.jenvman.2011.12.025
Liu, Y. (2020). The basic theory and methodology of rural revitalization planning in China. Acta Geogr. Sin. 75 (06), 1120–1133. doi:10.11821/dlxb202006002
Liu, Y., and Liu, Y. (2012). Progress and prospect in the study of rural region multifunction. China Popul. Resour. Environ. 22 (10), 164–169. doi:10.3969/j.issn.1002-2104.2012.10.024
Liu, Y., Liu, Y., and Guo, L. (2011). Connotations of rural regional multifunction and its policy implications in China. Hum. Geogr. 26 (06), 103–106+132. doi:10.13959/j.issn.1003-2398.2011.06.029
Long, H., Gerhard, K., Heilig, L., and Zhang, M. (2007). Socio-economic development and land-use change: analysis of rural housing land transition in the Transect of the Yangtse River, China. Land Use Policy 24 (1), 141–153. doi:10.1016/j.landusepol.2005.11.003
Long, H., Tu, S., Ge, D., Li, T., and Liu, Y. (2016). The allocation and management of critical resources in rural China under restructuring: problems and prospects. J. Rural Stud. 47, 392–412. doi:10.1016/j.jrurstud.2016.03.011
Long, H., Zhang, Y., Liu, Y., et al. (2021). The state-the-art of agricultural geography and rural development research in China. Econ. Geogr. 41 (10), 49–58. (in Chinese). doi:10.15957/j.cnki.jjdl.2021.10.006
Ma, T., and Zheng, L. (2018). Comprehensive evaluation of rural development in liaoning coastal economic belt. Agric. Econ. (12), 32–34.
Ma, X., Sun, Z., Yu, Z., Jiao, F., and Li, X. (2023). Classification and spatial pattern of rural multifunction from the diversify of construction land use: taking tongshan district of jiangsu province as a case study. Chin. Geogr. Sci. 33 (5), 865–879. doi:10.1007/s11769-023-1376-7
Marsden, T., and Sonnino, R. (2008). Rural development and the regional state: denying multifunctional agriculture in the UK. J. Rural Stud. 24 (4), 422–431. doi:10.1016/j.jrurstud.2008.04.001
Renting, H., Rossing, W., Groot, J., Van der Ploeg, J., Laurent, C., Perraud, D., et al. (2013). Exploring multifunctional agriculture. A review of conceptual approaches and prospects for an integrative transitional framework. J. Environ. Manag. 90 (2), 112–123. doi:10.1016/j.jenvman.2008.11.014
Sophie, O., Vanwambeke, P. S., and Lambin, E. F. (2007). Rural transformation and land use change in northern Thailand. J. Land Use Sci. 2 (1), 1–29. doi:10.1080/17474230601145943
Tu, S., Long, H., Zhang, Y., Ge, D., and Qu, Y. (2018). Rural restructuring at village level under rapid urbanization in metropolitan suburbs of China and its implications for innovations in land use policy. Habitat Int. 77, 143–152. doi:10.1016/j.habitatint.2017.12.001
Wang, J., and Chengdong, X. (2017). Geodetector: principle and prospective. Acta Geogr. Sin. 72 (1), 116–134. doi:10.11821/dlxb201701010
Xie, G., Lu, C., Leng, Y., and Zheng, D., (2003). Value evaluation of ecological assets in qinghai tibet plateau. J. Nat. Resour. 2003 (02), 189–196. doi:10.11849/zrzyxb.2003.02.010
Xiong, Y., Huang, L., and Zhou, F., (2021). Multifunctional spatial characteristics of rural areas and their type identification based on county scale: a case of Hunan Province. Econ. Geogr. 41 (06), 162–170. doi:10.15957/j.cnki.jjdl.2021.06.018
Xu, K., and Fang, Y. (2021). Rural mult-function evaluation and evolution charateristics in Liaoning province. Econ. Geogr. 41 (01), 147–157. doi:10.15957/j.cnki.jjdl.2021.01.017
Yang, J., Guo, A., Li, Y., Zhang, Y., and Li, X. (2023a). Simulation of landscape spatial layout evolution in rural-urban fringe areas: a case study of Ganjingzi District. GIScience and Remote Sens. 56 (3), 388–405. doi:10.1080/15481603.2018.1533680
Yang, R., Guo, X., and Chen, Y. (2023b). Spatial pattern and influencing factors of rural multifunctionality at county level in China. Prog. Geogr. 38 (09), 1316–1328. doi:10.18306/dlkxjz.2019.09.005
Yang, Y., Bao, W., and Liu, Y. (2020). Coupling coordination analysis of rural production-living-ecological space in the Beijing-Tianjin-Hebei region. Ecol. Indic. 117 (4), 106512. doi:10.1016/j.ecolind.2020.106512
Yu, Z., Ma, X., and Sun, X. (2024). Multi-function evolution and development path of suburban villages at village scale: a case study of Tongshan District, Xuzhou City. Prog. Geogr. 43 (3), 446–457. doi:10.18306/dlkxjz.2024.03.003
Zhang, C., Sargent, I., Pan, X., Li, H., Gardiner, A., Hare, J., et al. (2023). Joint Deep Learning for land cover and land use classification. Remote Sens. Environ. 221, 173–187. doi:10.1016/j.rse.2018.11.014
Zhang, L., Lei, G., and Guo, Y. (2020). Graph-theoretic clustering for multifunctional land use in Liaoning Province, China. Trans. Chin. Soc. Agric. Eng. 36 (13), 242–249. doi:10.11975/j.issn.1002-6819.2020.13.028
Zhang, R., and Zhang, X. (2022). Spatiotemporal evolution and driving mechanism of rural multi-functions in the Yangtze River Delta. Trans. Chin. Soc. Agric. Eng. Trans. CSAE 38 (13), 264–272. doi:10.11975/j.issn.1002-6819.2022.13.029
Zhao, T., Cheng, Y., Fan, Y., and Fan, X. (2022). Functional tradeoffs and feature recognition of rural production–living–ecological spaces. Land 11 (7), 1103. doi:10.3390/land11071103
Keywords: rural multifunctionality system, spatio-temporal distribution, new countryside construction, the Liaoning Coastal Economic Belt, influence factor
Citation: Chen Y and Wang J (2025) Spatiotemporal distribution of rural multifunctionality and its influencing factors: a case study of the Liaoning Coastal Economic Belt, China. Front. Environ. Sci. 13:1517900. doi: 10.3389/fenvs.2025.1517900
Received: 27 October 2024; Accepted: 07 January 2025;
Published: 10 February 2025.
Edited by:
Qingji Zhou, Tianjin University, ChinaReviewed by:
Wenyu Song, Fudan University, ChinaPeng Du, Liaoning Normal University, China
Li Xiang, Northwest A&F University, China
Copyright © 2025 Chen and Wang. This is an open-access article distributed under the terms of the Creative Commons Attribution License (CC BY). The use, distribution or reproduction in other forums is permitted, provided the original author(s) and the copyright owner(s) are credited and that the original publication in this journal is cited, in accordance with accepted academic practice. No use, distribution or reproduction is permitted which does not comply with these terms.
*Correspondence: Jun Wang, d2FuZ2p1bjQxNjlAMTI2LmNvbQ==