 Qi Liu1Usman Mehmood2,3*
- 1Business School, University of Exeter, England, United Kingdom
- 2Department of Business Administration, Bahçeşehir Cyprus University, Lefkosa, Cyprus
- 3Sunway Business School, Sunway University, Bandar Sunway, Malaysia
Due to economic growth, significant natural resource overuse and unsustainable use have hastened the adverse effects of excessive consumption, which has resulted in large increases in ecological footprint. Additionally, energy insecurity, increasing fossil fuel usage, and environmental unsustainability are significant challenges resulting from the escalating wars. However, resource consumption and environmental footprints may be impacted by the shift of energy systems and economic activity that promotes the use of clean energy and aids in the digitalization process. Thus, by incorporating external conflicts (EC) into the model, this study examines the effects of natural resources (NR), the digital economy (DIE), government stability (GOV), and clean energy (RE) on the ecological footprint (EF) in G-20 nations from 2000 to 2021. To provide panel estimates resistant to slope heterogeneity and cross-sectional dependence (CD), momentum quantile regression (MMQR) is used. The empirical findings show that the digital economy and natural resources are growing their economic footprints in the G-20 economies and are a major danger to the quality of the environment. The government and clean energy, however, contribute to a less ecological footprint. Furthermore, reducing disputes reduces ecological impact while improving economic conditions degrades environmental quality. These estimates serve as the foundation for comprehensive policies that enhance environmental quality through the energy transition, digitization, and sustainable use of natural resources.
1 Introduction
Unsustainable economic expansion driven by increasing fossil fuel consumption has resulted in severe ecological issues, prompting nations to focus on developing policies for sustainable growth. As a result, ecological footprints (EF) across various countries have significantly amplified, creating a condition known as ecological scarcity. This concept highlights the limited capacity of ecosystems to provide resources relative to the growing demands of the global (GFN, 2023). The over-reliance on fossil fuels has accelerated global climate change, leading to more frequent and severe weather-related disasters such as heatwaves, storms, and flooding, which threaten life and infrastructure (IPCC, 2021).
The planet’s biocapacity is being exceeded at an alarming rate, with humans overusing it by approximately 56%, highlighting the urgent need for strategic policies to achieve carbon neutrality and sustainable development. Target 7 of the Sustainable Development Goals (SDGs) emphasizes transitioning to affordable renewable energy sources to promote sustainability, while Target 13 calls for concerted efforts to combat climate change (UNO, 2021). Achieving carbon neutrality by 2050 requires strategic policies to curb the consumption of natural resources like coal, gas, and oil, which significantly contribute to environmental degradation.
Developing nations, which consume half of the world’s energy, face unique challenges in meeting these goals. These countries often prioritize economic growth over environmental conservation due to their developmental stage, lacking the technological capacity, financial resources, and stringent environmental regulations needed for renewable energy transitions and pollution reduction (British Petroleum, 2019). The situation is further complicated by escalating international conflicts that exacerbate energy insecurity and hinder sustainability efforts. This confluence of challenges calls for comprehensive research to unravel the relationships between natural resource utilization (NR), renewable energy (RE), external conflicts (EC), and emerging technologies like the digital economy (DIE). Understanding these interactions is crucial for designing effective policies that enhance energy security, facilitate transitions to sustainable energy, and reduce ecological footprints (EF).
The study aims to explore the complex interplay of NR, RE, EC, DIE, and governance (GOV) and their combined impact on EF in the Group of Twenty (G-20) nations. These nations represent a large portion of the global population, energy consumption, and GDP (British Petroleum, 2019), while also facing significant ecological deficits and degradation. This study evaluates how NR extraction and RE adoption influence environmental sustainability, examines the dual effects of DIE on EF, and assesses the role of EC and governance in shaping resource use and ecological health. By addressing these dimensions, the study seeks to contribute to achieving SDG-13 targets and balancing economic growth with environmental sustainability (UNCCD, 2024).
The connection between NR and environmental sustainability has been extensively studied. Emissions from fossil fuels are a primary driver of ecological unsustainability, while resource extraction harms air and water quality (Ahmad et al., 2023; Jiao et al., 2021). Activities such as deforestation and mining further degrade ecosystems and threaten biodiversity (Sarkodie, 2018). Conversely, some studies suggest that abundant natural gas (NG) could reduce reliance on more polluting resources like coal and petroleum, thereby potentially reducing pollution (Balsalobre-Lorente et al., 2018). However, these substitution efforts remain inadequate to address global temperature rises, making it crucial to balance NR use with economic growth (Zafar et al., 2019).
The digital economy (DIE) has reshaped socio-economic structures, offering both opportunities and challenges for sustainability (Dong et al., 2022). On one hand, digitalization promotes resource conservation through dematerialization trends, replacing physical goods and services with digital alternatives (Danish, 2019; Shahbaz et al., 2022). For example, online banking and e-commerce reduce the need for physical infrastructure and transportation. On the other hand, the rapid expansion of digital technology increases energy consumption (Ulucak and Khan, 2020) and electronic waste, contributing to environmental degradation (Ahmed et al., 2021). This duality underscores the need for policies that maximize the benefits of digitalization while addressing its environmental costs.
External conflicts (EC) further exacerbate ecological degradation by accelerating resource exploitation and undermining environmental policies. Conflicts drive militarization (ICRG, 2022), which often diverts resources from green investments and disrupts ecological balance. For instance, the construction of military housing and infrastructure intensifies resource consumption and EF (Dai et al., 2023a). Additionally, conflicts can directly damage land and reduce NR availability, making it harder to achieve environmental goals.
Governance (GOV) plays a critical role in mitigating these challenges. Effective governance ensures the implementation of environmental regulations, reduces corruption, and promotes sustainability (Cardoni et al., 2020). Good governance frameworks address political stability, regulatory quality, and the rule of law, creating an environment conducive to sustainable development (Câmara, 2022; Lombardi et al., 2019). Governance-oriented policies not only enhance resource efficiency but also align with the core pillars of sustainability: economic, environmental, and social progress (Andrew, 2010).
By incorporating NR, RE, EC, DIE, and GOV into its analysis, this study addresses gaps in the existing literature. Unlike previous research, it integrates the roles of conflicts and the digital economy, which are often overlooked in discussions of ecological sustainability. Methodologically, it employs the Method of momentum quantile regression (MMQR) approach to account for heterogeneity and cross-sectional dependence (CD), ensuring robust and long-term insights. This comprehensive approach provides a solid foundation for policymakers to balance economic growth with environmental conservation, thereby advancing SDG and carbon neutrality goals.
The arrangement of the remaining paper is organized as follows. Section 2 provides a review of previous research on the relationships between the study variables. This is followed by a discussion of the methods and procedures used for data collection and analysis, along with the results in Sections 3, 4, and 5. The paper concludes in the final section with a summary of the findings, policy recommendations, and an outline of the study’s limitations, supported by the insights from prior research.
2 Literature review
2.1 Ecological footprints and digital economy
The digital economy (DIE) has reshaped modern society, transforming social structures, business practices, and lifestyles globally. Additionally, the DIE has expanded the types and sizes of economies and businesses globally, fostering innovation and assisting in the promotion of global GDP (Du et al., 2023; Ren et al., 2022). It is crucial to evaluate the environmental implications of digitalization, particularly its impact on resource use and ecological footprints. The relationship between EF and DIE has drawn more attention in recent years.
Studies highlight how the DIE reduces ecological footprints (EF) by promoting resource efficiency, dematerialization, and energy-saving technologies. For example, from 2006 to 2018, Xu et al. (2023) probed how China’s DIE affected the country’s environmental quality. According to their research, DIE significantly raises living standards by reducing ecological pollutants. Likewise, Ran et al. (2023) demonstrated how the DIE significantly promotes green industrial conversion by enabling more effective use of NR, which helps to lessen the ecological imprint in China’s eastern region. According to Wang et al. (2023), there is a favorable association between the growth of renewable energy and the DIE in Asian nations, which may make it easier for the area to achieve a low-carbon economy. Zhang et al. (2022) found a negative correlation between China’s carbon emissions and the growth of the DIE. Like this, Wu et al. (2023) investigated how China’s 274 cities' air pollution levels were affected by the development of the DIE between 2011 and 2019. The results showed a significant decrease in air pollution, which could be attributed to China’s growing DIE. Notably, compared to the eastern region, the middle and western regions of the nation demonstrated a higher elasticity of pollution reduction.
Conversely, the swift rate of technological progress, coupled with a growing need for digital goods and services, has played a significant role in driving up energy consumption, which is mostly sourced from power plants powered by coal and the usage of earth metals in electric appliances and smartphones. Additionally, there are serious risks to the environment and public health associated with the disposal of electronic waste and the continuous development of new technology. For example, Wang et al. (2022) found that China’s rising CO2 emissions are a result of the societal effects of the DIE. Dong et al. (2022) looked at how the DIE affected per capita emissions and carbon emission intensity in 60 different countries. According to their findings, these countries' emission densities decreased because of the DIE, but their per capita emissions rose. Goel et al. (2024) discussed how digital transformation, powered by technologies like AI, IoT, and big data, reshapes industries and societies. They highlighted threats such as rising energy consumption and growing e-waste and suggested mitigation strategies like adopting energy-efficient practices and integrating renewable energy.
2.2 Ecological footprints and natural resources
While natural resources (NR) are essential for life and development, their overuse poses significant challenges to sustainable growth (Chen et al., 2022). Several works have probed the complex linkages between NR and the EF. Many studies describe NR as a “curse” due to their detrimental environmental impacts when overexploited. A few works, meantime, contend that NR can also have positive effects because of its advantages for the economy. In the case of Pakistan, for example, Hassan et al. (2019) examined the effects of NR and GDP on the EF throughout the years 1970–2017. Their research showed that the nation’s EF was negatively impacted by both NR and economic growth. In a similar spirit, Awosusi et al. (2022) evaluated the effects of NR on EF and showed that via escalating EF, both NR and GDP lead to the deterioration of ecological quality in BRICS. Pata et al. (2021) investigated the impact of NR on EF in 10 nations with the highest EF. Their results showed that EF is increased by NR, which harms the overall quality of the environment.
On the other hand, not much research has found that NR improves the environment. For example, Zafar et al. (2019) discovered that in the United States, NR lowers EF and hence enhances environmental quality. Similarly, Danish et a. (2020) examined the relationship of NR-EF and found that NR is improving climate. The findings imply that NR in these countries successfully reduces EF. Kongbuamai et al. (2020) also revealed a negative correlation between EF and NR in the context of Asian nations. They disproved the notion of the resource curse and emphasized the benefits of having an abundance of NR. Amer et al. (2024) explored the relationship between natural resources and environmental degradation, focusing on EF and CO2 emissions. Their study revealed that the overexploitation of NR contributes to increased EF and CO2 emissions, emphasizing the need for sustainable resource management.
2.3 Ecological footprints and renewable energy
Amid escalating environmental concerns, clean energy emerges as a critical solution to mitigate ecological degradation. The negative consequences of environmental degradation can be lessened by utilizing clean and renewable energy sources (Adebayo et al., 2023; Balsalobre-Lorente et al., 2023). Prior research has emphasized the significance of using RE sources to mitigate the negative impacts of human activity on the climate (Zhang et al., 2022). Usman et al. (2022) evaluate the linkages of nuclear energy and EF in developed nations. The results show that using nuclear energy helps these countries' forests, lands, and water supplies be preserved, which lowers EF. In the United States, Cai et al. (2018) discovered one-directional causality between renewable energy consumption and ecological degradation, but bidirectional causality was observed in Germany. Similarly, from 1975 to 2016, Murshed et al. (2021) studied how Bangladesh’s ecological degradation was affected using clean energy. According to their findings, Bangladesh’s carbon footprints are being reduced largely using hydropower and non-fossil fuel energy, which helps the country achieve its carbon neutrality goals. Li et al. (2020) reported that clean energy use significantly reduces air pollution in China. Conversely, Zhang et al. (2023) discovered that China’s increased CO2 emissions because of nuclear energy aggravates environmental degradation. Imran et al. (2024) explored the complex relationships involving EF, energy use, carbon emissions, governance efficiency, economic prosperity, and financial stability in South Asian nations spanning the period from 2000 to 2022. Their findings suggested that increased adoption of renewable energy can reduce the ecological footprint, but policymakers need to balance this with financial stability considerations.
2.4 Ecological footprints and external conflicts
The global backdrop of the 21st century is marked by a multitude of issues, including the escalation of ecological degradation, resource scarcity, and international wars (Chu et al., 2022). The Russia-Ukraine crisis underscores the critical need to explore how military conflicts impact environmental sustainability. However, the scope of the material that is currently available on the relationship between external disputes (EC) and EF is constrained. Ahmed et al. (2022) used the Augmented ARDL model with Spectral causality tests to examine the effects of EC on ecological quality in India between 1984 and 2017. Their results show that EF levels rise after a decrease in EC, mitigating EC does not always result in an improvement in ecological quality. Conversely, Usman et al. (2021) discovered that EF is decreased by foreign conflicts in MENA nations. Nonetheless, Qayyum et al. (2021) revealed a strong correlation between EF and military spending, internal conflicts, and exterior conflicts. Khezri et al. (2023) examined the impact of external and internal conflicts on the EF in Middle Eastern and African countries from 2001 to 2019. Their findings indicated that conflicts significantly increase the ecological footprint by putting pressure on natural resources and ecological systems.
2.5 Ecological footprints and institutional quality
While research has examined governance and corruption control’s impact on EF (Salman et al., 2022; Tabash et al., 2022; Uzar, 2021), the connection between EF and sustainable governance remains underexplored. Ali et al. (2022) found that renewable energy, human capital, and strong governance institutions help reduce EF in ECOWAS economies. Furthermore, Tabash et al. (2022) claimed that as a stronger governance system can help reduce EF, policymakers should give it their full focus. Additionally, Yao et al. (2021) studied the N-11 and BRICS economies. The relationship between financial development, control of corruption, and EF is determined by the study. The data set contains information from 1995 to 2014. The results thus imply that writers and control of corruption are more likely to increase energy efficiency and decrease EF. Natural resource rents and technological developments can both improve environmental quality and energy efficiency at the same time. On the other hand, Hussain and Dogan, (2021) asserted that BRICS can achieve sustainable growth by raising investments in green technology and enhancing the caliber of their institutions. Governmental stability, control of corruption, law and order, bureaucratic efficacy, and democracy all play a significant role in lowering EF, according to Uzar, (2021). Similarly, Akalin et al. (2021) asserted that reducing corruption at the state level can lead to sustainable development. Aydin et al. (2024) found that investments in environmental technologies, higher institutional quality, and globalization significantly improve environmental sustainability in European Union countries. Their study highlighted the importance of enhancing institutional standards and increasing research and development budgets for environmental technologies. Bambi et al. (2024) explored the relationship between institutions, governance, and environmental quality in Sub-Saharan Africa. They revealed that high institutional quality is associated with a lower ecological footprint, and improved governance helps mitigate the decline in institutional performance.
After reviewing the literature, it can be said that there is a lack of data and a range of findings about the connections between the DIE, EC, institutional quality, and EF. Most earlier studies that looked at this relationship primarily concentrated on China. Furthermore, there is a lack of unanimity in the literature currently in publication about the relationship between EF and NR. For example, EF and NR have been found to positively correlate in certain research, but negatively correlated in others. To the best of the authors' knowledge, there is no research discussing how, in the context of G-20 countries, clean energy use, DIE, and EC affect EF. All things considered, this gap in the literature emphasizes the necessity of thorough study to comprehend the intricate interactions among the DIE, NR, RE, EC, GOV, and EF.
3 Data, model, and methodology
Reliable results and effective policy recommendations depend on selecting a robust model to assess the influences of natural resources (NR), the digital economy (DIE), governance (GOV), and external conflicts (EC) on ecological footprints (EF). The ecological footprint, a comprehensive measure of environmental quality, is chosen as the dependent variable instead of CO2 emissions due to its broader applicability and acceptance among academics. The inclusion of NR in the model is justified by its critical role in economic progress, as resources like gas, oil, and coal are essential yet finite. Extensive extraction and ongoing exploitation degrade stocks and adversely affect ecosystem quality. The “Treadmill of Production” theory (Aronson, 1994) posits this by positing that economic growth drives over-extraction and environmental contamination. Conversely, renewable energy (RE) adoption is expected to mitigate these effects and help achieve SDGs 13 and 7 by promoting sustainability. Figure 1 illustrates the state of NR use in G-20 nations.
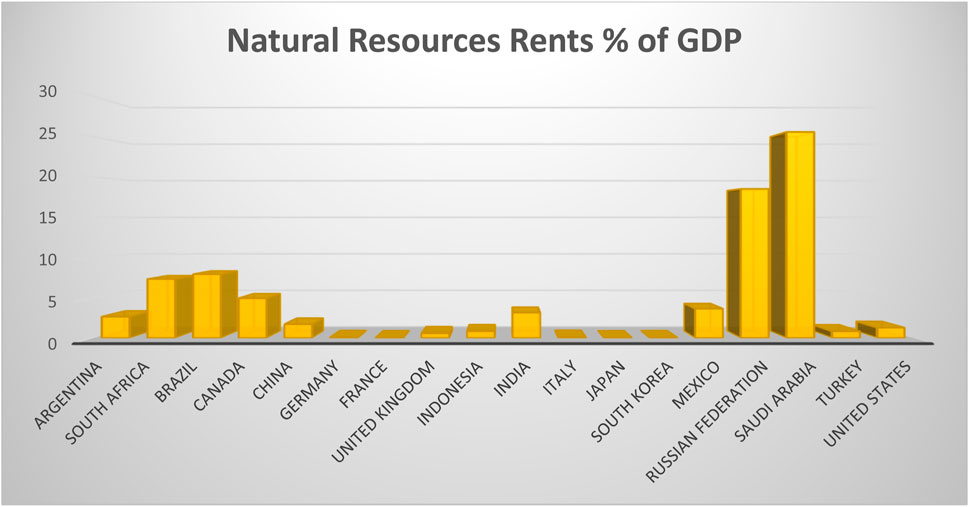
Figure 1. Trends of natural resources rents.
The integration of the digital economy (DIE) in the model reflects its transformative role in resource efficiency and environmental impact. DIE drives resource conservation through dematerialization trends, replacing physical goods with digital alternatives, thereby reducing resource usage. However, DIE also increases energy demand and contributes to electronic waste, which exacerbates ecological issues. The inclusion of conflicts (EC) is grounded in the “Treadmill of Destruction” theory (Hooks and Smith, 2005), which highlights how militarization and conflicts increase resource exploitation and environmental degradation. EC influences environmental sustainability directly through habitat destruction and indirectly by diverting resources away from green investments. Governance (GOV) is included to capture the critical role of institutions in enforcing environmental policies, reducing corruption, and promoting sustainable practices. Ecological Modernization theory emphasizes the potential of technological and governance advancements to mitigate environmental harm, while the Sustainability Transition theory underscores the importance of RE in reducing ecological footprints.
The interaction between these variables is intricate but essential. Effective governance (GOV) enhances renewable energy (RE) adoption benefits and curbs digital economy (DIE) drawbacks by enforcing energy efficiency and e-waste management regulations. Similarly, conflicts (EC) not only increase NR exploitation but also weaken institutional governance, exacerbating ecological degradation. DIE interacts with GDP by driving economic growth, but it also intensifies energy consumption, highlighting the dual effects on EF. These interdependencies underscore the necessity of a comprehensive model to analyze these dynamics.
The model specification is as follows:
In this model, EF represents the ecological footprint, capturing the environmental impact in terms of resource use and pollution. DIE denotes the digital economy, reflecting its role in economic activity and resource consumption. EU signifies energy use, NR represents natural resource rents, RE indicates renewable energy, EC captures external conflicts, GDP reflects economic growth, and GOV measures governance quality. The model construction is underpinned by several theoretical frameworks. The Environmental Kuznets Curve (EKC) hypothesis suggests that environmental degradation initially rises with economic growth but eventually declines as clean technologies are adopted. The “Treadmill of Production” theory explains how economic growth and industrialization drive resource extraction and energy use, increasing ecological degradation. The Ecological Modernization theory highlights the potential of governance and technological advancements to mitigate environmental harm. Conflict and Resource Scarcity theory emphasizes the detrimental environmental effects of conflicts, while the Sustainability Transition theory underscores the critical role of renewable energy in reducing ecological footprints.
To ensure linearity and address heteroscedasticity, all variables are logarithmically transformed, making coefficients interpretable as elasticities. The model is suitable for advanced econometric techniques, including the Generalized Method of Moments (GMM) and Method of Moments Quantile Regression (MMQR). These methods address endogeneity, heterogeneity, and cross-sectional dependence, ensuring robust insights into sustainability drivers in G-20 nations.
The empirical model, incorporating the logarithmic form of variables, is:
where α0 is the intercept, μit is the error term, and δ1 to δ6 are coefficients of the respective independent variables.
The study uses datasets spanning 2000–2021 for 18 G-20 economies. Limitations in data availability for EF, DIE, EC, and GOV restricted the timeline and excluded some countries from the analysis. Variables were converted into natural logarithms to ensure consistency with prior research. The DIE index, used to measure digital economy performance, is derived following Shahbaz et al. (2022). Table 1 provides detailed descriptions of all variables used in the study, sourced from WGI, (2024), WDI, (2024), ICRG, (2024), and GFN, (2024) datasets. While these datasets are widely used and respected, it is important to acknowledge potential biases and limitations. For instance, EF estimates from GFN rely on assumptions about land productivity and consumption patterns that may not fully account for regional variations. Similarly, ICRG’s conflict data primarily focuses on reported conflicts, which could underrepresent smaller-scale disputes. To ensure reliability, data cleaning and validation were conducted, and sensitivity analyses were performed to test the robustness of the results.
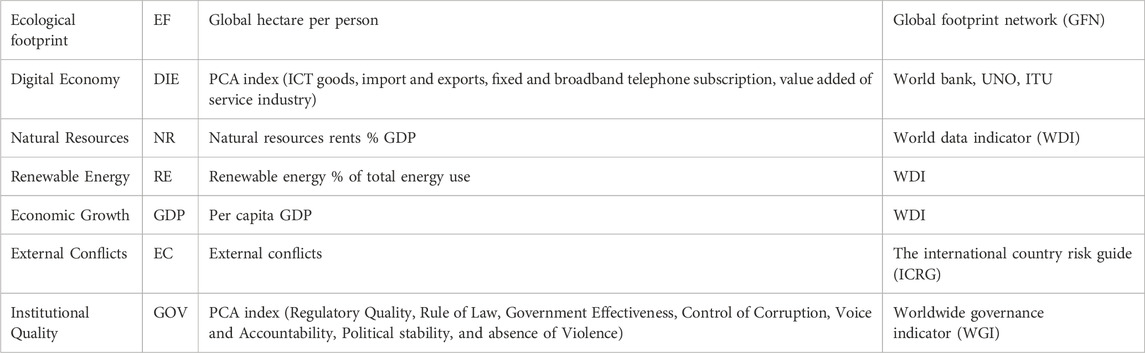
Table 1. Variable and description.
The theoretical and empirical foundations, combined with transparent data discussions, strengthen the credibility and robustness of the model. These enhancements address the reviewer’s concerns by providing detailed justifications for the inclusion of key variables, explaining their interactions, and ensuring greater transparency regarding data quality and limitations.
The regional distribution of EF for the G-20 countries is shown in Figure 2. The United States and Canada have the maximum EF.
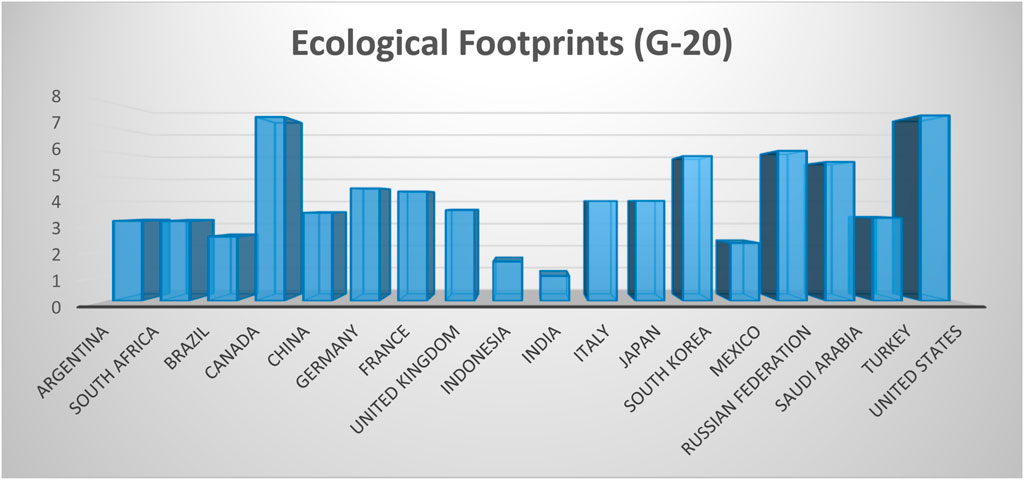
Figure 2. Distribution of EF in G-20 nations.
4 Methodology
To verify some fundamental panel data aspects, it is necessary to comprehend the long-term relationships among DIE, NR, RE, EC, GDP, GOV, and EF. First, among these prerequisite tests, heterogeneity investigation techniques and CD are used. Pesaran’s CD test was selected because of its widespread application in the most current literature. Equation 3 following describes this method.
The sample size (y), time (p), and pairwise correlation
where the modified Δ ̃ and Δ ̃ tilde is shown by the
where
where ADF characterizes each CADF average obtained from Equation 6, and IPS stands for the CIPS approach. It is relevant to investigate the cointegration in the G-20 country dataset after applying these tests. Because (Westerlund and Edgerton, 2007) estimating strategy addresses heterogeneity and CD, as the previous research revealed, it is the method of choice. Because bootstrapping is used, this test has robust small panel data estimation features. This method not only reports the p-values but also produces robust p-values that counter CD issues using a bootstrapped approach. In addition, this testing protocol consists of two-panel tests and two group tests. Alternative hypotheses indicating cointegration are accepted when at least one panel and one group statistic demonstrate significance.
The main analytical technique used in the current study is to examine the link between DIE, NR, RE, EC, GDP, GOV, and EF by the Method of Moments Panel Quantile Regression (Machado and Santos Silva, 2019). Our main justification for selecting MMQR is as explained before, by using moment restrictions, this method effectively addresses econometric problems like heterogeneity and endogeneity (Ma et al., 2023) and generates dynamic estimates for endogenous variables when the individual effect is highly integrated. Additionally, conditional mean shifting of the mean is considered by MMQR limits to permit the individual influence of independent variables on the distribution. Since MMQR considers both linear and nonlinear relationships between data variables, it also has the benefit of ensuring model validity (Safitri et al., 2023). Furthermore, the measurement of non-crossing coefficients because of scale and location parameters is ensured by providing quantile estimations. For the conditional quantile
The “fixed effect of individuals” is represented by the expression “i = 1, 2, … n,” where the probability value “
The variable V in Equation 9 is deemed time-invariant due to even distribution and independence, while CSⅈt is redistributed within individual j throughout time. It is redistributed perpendicular to the velocity vector to satisfy the moment criteria. Therefore, Equation 9 can be converted as:
Equation 10 uses QEF (γ|CS˂ⅈt) to show the quantile distribution of the dependent variable and V¨it to calculate vector values for independent variables like NR, EG, GDP, FP, and GI. Furthermore, considering the optimization endeavor (γ − th) symbolizes the equation of q (γ) as:
Equation 11 can be transformed as follows to find the checking function in Equation 12.
5 Results and discussion
The Cross-Sectional Dependence (CD) test results in Table 2 indicate a strong correlation among variables across the selected nations. Cross-sectional dependence is a common issue in panel data studies, particularly when the data encompasses multiple countries that are economically, socially, or environmentally interconnected. In this study, all variables exhibit statistically significant dependence, as evidenced by their corresponding CD test statistics and p-values. For instance, EF shows a CD value of 5.58, significant at the 1% level, while NR and GDP report even higher CD values of 20.67 and 39.77, respectively, both significant at the 1% level. RE and external conflicts (EC) also demonstrate significant dependence, albeit with lower CD values. Similarly, the DIE and GOV variables reveal significant correlations, albeit with varying magnitudes of dependence. Notably, GOV’s CD value is significant at the 10% level, which still indicates a notable degree of dependence.
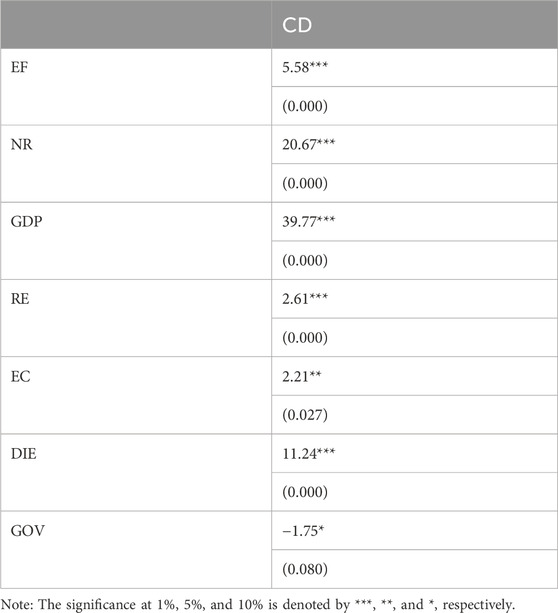
Table 2. Cross-sectional dependence test.
These results underscore the interdependencies among the studied nations. Such interdependence can be attributed to shared economic ties, globalization, and common environmental challenges like climate change, which transcend national boundaries. For example, economic growth in one country may influence resource demands, trade dynamics, or technological advancements in neighboring countries, thereby fostering cross-sectional dependence. Similarly, ecological footprints (EF) are shaped by global trade, energy consumption patterns, and environmental spillovers, reflecting interconnections within and beyond regional boundaries.
The presence of cross-sectional dependence necessitates the adoption of advanced econometric techniques that account for such interdependencies. Ignoring CD can lead to biased estimates and unreliable inference in panel data analysis. The findings validate the importance of addressing CD to ensure robust results, particularly when examining global challenges like sustainability and resource use.
Moreover, the statistically significant dependence of NR and RE highlights the interconnected nature of resource extraction, consumption, and transition to cleaner energy. For instance, shared technology, global energy markets, and international conflicts can jointly influence NR utilization and RE adoption across countries. Similarly, significant CD in the digital economy (DIE) reflects the widespread diffusion of technology and its uniform impacts on environmental and economic dimensions across nations.
In summary, the CD test results emphasize the necessity of employing econometric models that account for cross-sectional dependence to capture the true relationships among EF, NR, GDP, RE, EC, DIE, and GOV. These interconnections highlight the global nature of ecological challenges and the importance of collaborative, regionally informed policymaking to address sustainability issues effectively.
The results of the slope homogeneity test, as presented in Table 3, provide critical insights into the heterogeneity of the panel data. The test results reject the null hypothesis of slope homogeneity, indicating that the relationship between the dependent variable (ecological footprint, EF) and the independent variables (such as NR, GDP, RE, EC, DIE, and GOV) varies significantly across the countries analyzed. Specifically, the Delta statistic is significant at the 10% level (p = 0.081), while the adjusted Delta statistic is significant at the 5% level (p = 0.016). These findings confirm the presence of heterogeneity in the slopes of the panel data.

Table 3. Slope homogeneity test.
Slope heterogeneity is an essential consideration in panel data analysis, particularly when the dataset spans multiple countries with diverse economic, social, and environmental contexts. In this study, the rejection of slope homogeneity underscores that the impact of variables like NR, RE, and GOV on EF is not uniform across the nations studied. For example, a country’s reliance on NR may vary based on its stage of economic development, technological advancements, and policy frameworks, leading to different slope coefficients for NR’s impact on EF. Similarly, the influence of governance quality on environmental outcomes may differ due to variations in institutional structures, regulatory enforcement, and corruption levels across countries.
The presence of slope heterogeneity necessitates the use of econometric techniques capable of addressing this issue, such as heterogeneous panel models or quantile regression methods. Ignoring slope heterogeneity can result in biased parameter estimates, as pooled models with uniform slopes fail to capture the nuanced relationships present in heterogeneous data. By incorporating slope heterogeneity into the analysis, researchers can better understand country-specific dynamics and provide tailored policy recommendations.
Furthermore, the findings highlight the complex interactions between variables in a global context. For example, the transition to renewable energy might have a more pronounced impact on reducing EF in countries with robust infrastructure and governance than in nations facing technological and financial constraints. Similarly, external conflicts may affect resource availability and ecological footprints differently depending on a country’s geopolitical context.
In conclusion, the slope homogeneity test results emphasize the importance of accounting for heterogeneity in panel data analysis. Incorporating heterogeneity ensures more accurate and meaningful insights into the drivers of ecological footprints across diverse national contexts, thereby strengthening the study’s policy relevance and applicability.
The results of the CIPS (Cross-Sectionally Augmented Dickey-Fuller) panel unit root test, as shown in Table 4, provide crucial insights into the stationarity properties of the variables under study. The CIPS test is particularly suitable for panel data with cross-sectional dependence, a feature established earlier in this study. By testing for stationarity at both levels I (0) and first differences I (1), the CIPS test allows for accurate identification of the integration order for each variable.
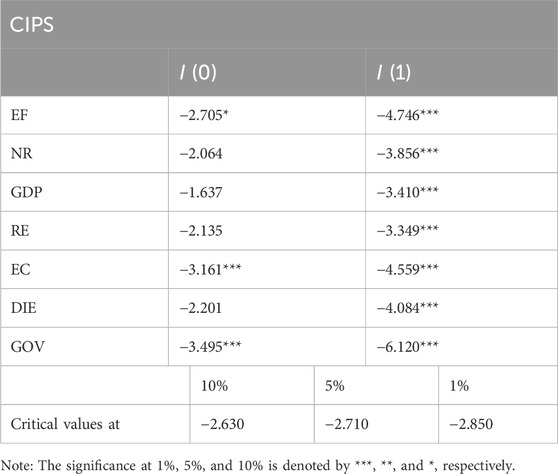
Table 4. CIPS unit root test.
The test results indicate that ecological footprint (EF), external conflicts (EC), and governance (GOV) are stationary at levels I (0), as their test statistics exceed the critical values at the 1% or 5% significance levels. This suggests that these variables do not exhibit unit root behavior and are stable over time within the studied panel. This stationarity might reflect their direct responsiveness to immediate changes in underlying economic, institutional, or conflict-related factors, aligning with their roles as key policy-sensitive measures.
Conversely, natural resources (NR), gross domestic product (GDP), renewable energy (RE), and the digital economy (DIE) become stationary only after taking their first differences I (1). This indicates that these variables exhibit a unit root at their levels but stabilize when differenced. This behavior is typical for economic and resource-related indicators, which often display trends due to persistent effects, such as cumulative economic growth, technological adoption, and resource depletion.
The heterogeneous order of integration across variables highlights the importance of applying econometric models capable of handling such dynamics. The presence of both I (0) and I (1) variables requires analytical methods that can robustly address mixed integration orders, such as cointegration techniques and quantile regression methods.
These findings underscore the dynamic nature of the relationships between variables. For example, the non-stationarity of GDP and DIE at levels reflect their trend-driven growth in the global context, influenced by economic cycles, innovation, and globalization. Similarly, the stationarity of EC and GOV at levels could signify their direct reaction to shocks or policy interventions in the studied nations.
Overall, the results of the CIPS test validate the use of advanced econometric approaches to explore long-term relationships among EF, NR, GDP, RE, EC, DIE, and GOV. By confirming that all variables achieve stationarity after appropriate differencing, the study ensures a solid foundation for subsequent analyses, such as panel cointegration tests, to determine long-term equilibrium relationships. This step is vital for deriving meaningful insights into the sustainability challenges faced by G-20 nations.
Table 5 displays the analysis’s findings, which show a substantial correlation between the variables. This serves as the foundation for assessing the long-term relationship between the factors using further empirical techniques. Following the confirmation of cointegration, the MMQR methods were employed in this work to assess the connection between the factors in Table 6.
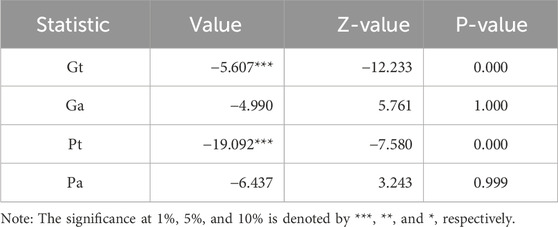
Table 5. Cointegration test.
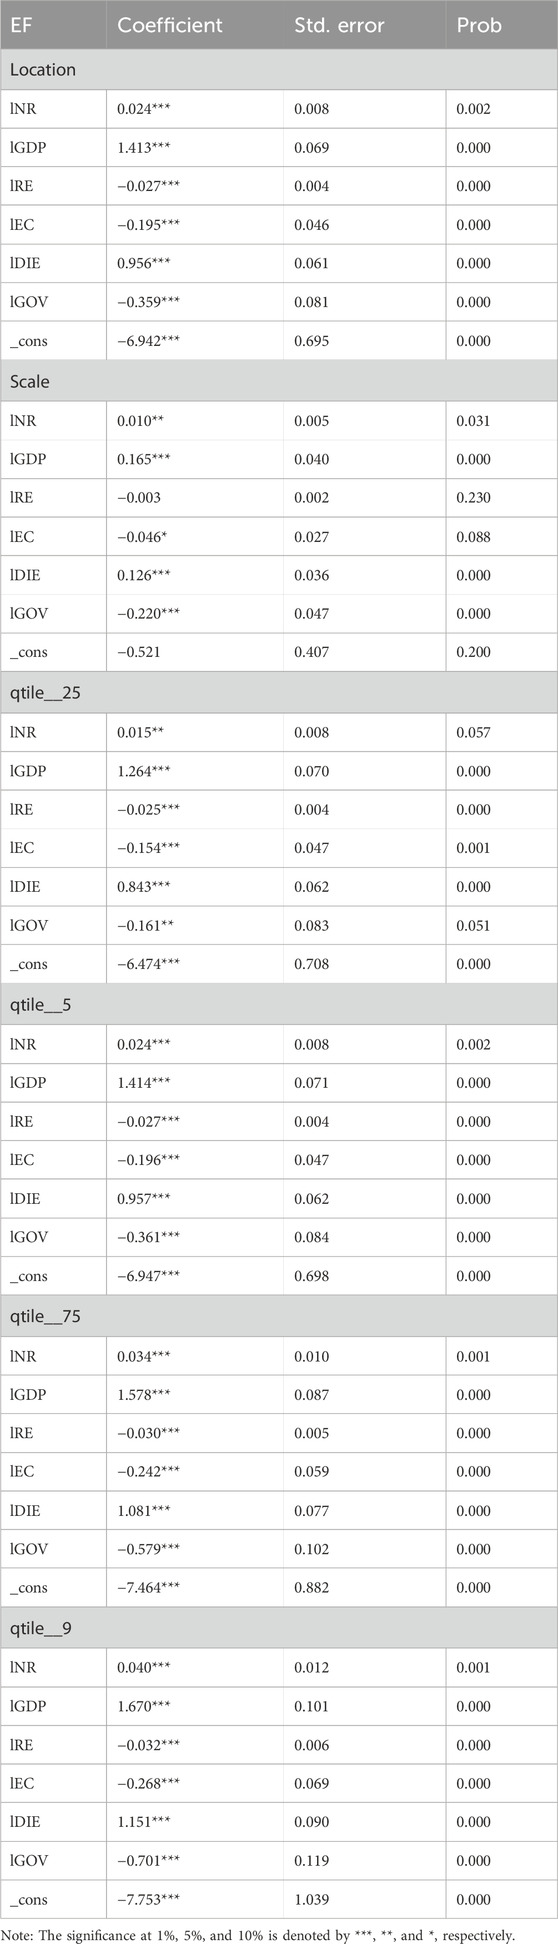
Table 6. MMQR test results.
The coefficients for NR are positive and significant across all quantiles and locations, ranging from 0.015 to 0.040. This indicates that increased reliance on natural resources exacerbates EF across all levels of environmental pressure. The positive relationship underscores that resource-intensive development in the G-20 countries contributes to greater environmental degradation, consistent with the “resource curse” hypothesis. The stronger coefficients in higher quantiles suggest that nations with larger ecological footprints are disproportionately affected by natural resource consumption. The positive link is probably explained by the fact that most G-20 nations primarily depend on the extraction of natural resources as a major engine of economic growth (Dai et al., 2023b). The gross domestic product and exports of these countries are significantly influenced by industries including mining, forestry, and agriculture. Nonetheless, these industries frequently cause pollution, alterations in land use, and habitat destruction, all of which raise EF. Moreover, increasing greenhouse gas emissions from the usage of fossil fuels to produce energy exacerbates the effects on the environment. The dearth of cutting-edge infrastructure and technology that support sustainable resource exploitation may be responsible for the positive correlation shown between EF and natural resources in G-20 nations. Many countries lack access to cleaner technology that might lessen the negative environmental effects of resource consumption, like effective waste management systems or renewable energy sources (Sharma et al., 2021). Ineffective public transit networks may also lead to a rise in the use of automobiles, emissions, and the consumption of natural resources. These findings contradict the findings of Kongbuamai et al. (2020), Aldegheishem, (2024), and Danish (2019), which showed a negative linkage between EF and NR. These results are consistent with the findings of Awosusi et al. (2022) for the BRICS nations, Pata et al. (2021) for the 10 highest footprint nations, and Zafar et al. (2019) in the United States.
GDP consistently shows a strong positive relationship with EF, with coefficients ranging from 1.264 to 1.670 across quantiles. This indicates that economic growth, while vital for development, significantly increases environmental degradation due to increased production, energy consumption, and resource extraction. The findings support the Environmental Kuznets Curve (EKC) hypothesis, which suggests that economic growth initially leads to environmental degradation before reversing at higher income levels. However, the uniformly high coefficients imply that G-20 nations are still in the environmentally degrading phase of the EKC.
Economic advancement is associated with increased resource usage and pollution, which is a significant factor (Khalfaoui et al., 2023; Sharma et al., 2020). G-20 countries use more natural resources since they are still in the process of industrialization and urbanization. This leads to waste and emissions that worsen the environment. Moreover, the growth of industrial operations frequently causes changes in land use, habitat loss, and deforestation, which exacerbates the ecological effects. The income effect is a further component to consider. This phenomenon occurs when consumer demand for products and services is stimulated by rising income levels in emerging economies, which increases the demand for resources and energy and exacerbates environmental challenges. It is also critical to remember that higher income levels may lead to a greater propensity for trash production. This is explained by the fact that people who have higher purchasing capacity typically follow higher consumption habits, which leads to the discarding of a bigger number of things. It is imperative to adopt sustainable development methods considering the positive link that has been shown between EF and GDP in G-20 nations. The environmental effects of financial expansion must be given top priority by policymakers, who should also work to strike a fair balance between the two. Making investments in RE, enacting waste management systems, encouraging resource efficiency, adopting cleaner manufacturing technologies, and encouraging sustainable consumption patterns are just a few of the tactics that can be used to effectively lower environmental pollution while fostering GDP. Moreover, the adoption of a circular economy, that involves emphasizing resource retrieval and recycling, has a significant capacity to help these nations lessen their ecological impact. These findings are comparable to those of Dong et al. (2022) and Ahmad et al. (2023).
The coefficients for RE are negative and significant across most quantiles, ranging from −0.025 to −0.032, indicating that renewable energy adoption mitigates EF. The stronger negative impact in higher quantiles suggests that increasing renewable energy use is particularly effective in reducing ecological footprints for countries experiencing higher environmental stress. These findings underscore the importance of accelerating renewable energy transitions in the G-20 nations to counteract the adverse effects of traditional energy sources.
It is crucial to acknowledge that the G-20 countries often face significant challenges in meeting their increasing energy needs while also reducing their environmental impact. These countries frequently demonstrate a significant dependence on fossils as their primary energy source, which results in the production of emissions and an increase in EF. Therefore, to appropriately address the ecological repercussions, it is essential to prioritize research into and deployment of clean energy alternatives. A growing understanding of the need for RE sources, such as nuclear and hydroelectric power should be adopted in G-20. The G-20 countries are currently engaged in aggressive initiatives aimed at promoting the extensive use of ecologically friendly energy technologies, such as geothermal, hydro, solar, and wind power. This strategy approach’s primary objective is to reduce dependency on fossil fuels and increase the diversity of energy sources. Reducing CO2, and addressing the environmental consequences associated with energy production are the main objectives. In addition, there are several positive reasons why G-20 economies have adopted sustainable energy sources. Technological improvements have substantially aided the greater accessibility and affordability of RE technologies, making them increasingly viable choices for these countries. Furthermore, international accords and initiatives like the Paris Agreement and SDGs have strengthened the support for sustainable practices and renewable energy in rising economies. However, it is crucial to acknowledge the limitations and difficulties these countries face as they shift to sustainable energy usage. Widespread adoption of the increasing number of renewable energy solutions may be hampered by technological barriers, inadequate infrastructure, and budgetary constraints. Furthermore, to support financing in RE and the smooth transition of RE into the existing energy systems, it is imperative to create or reinforce regulatory and policy structures. The findings of Usman et al. (2022) for rich nations, Tran et al. (2024) in ASEAN, Akpanke et al. (2024) in OECD nations, Li et al. (2020) in China, Sharma et al. (2020) for eight emerging countries, and Dogan et al. (2020) are in line with these findings.
The value of EC shows a negative sign, suggesting that a decrease in the EF of G-20 nations is related to the management of external conflict. These results support the findings of Khezri et al. (2023), Usman et al. (2021), and Ahmed et al. (2022).
The coefficients for EC are negative and significant, ranging from −0.154 to −0.268. This suggests that effective management of external conflicts contributes to reducing EF. Conflicts often disrupt environmental policies, increase militarization, and exacerbate resource exploitation. Conversely, peaceful conditions enable countries to focus on sustainability initiatives and resource management, reducing their ecological footprints.
A nation’s EF can suffer from a wide range of negative effects from external wars, such as the destruction of NR, the upheaval of ecology, and population movement. These factors worsen the EF of G-20 countries, which are already battling the difficulties brought on by quick population increase and economic expansion. It is also critical to recognize that conflicts can significantly affect ongoing environmental conservation and management efforts. The preservation of the environment is frequently subordinated to the resolution of conflict-related problems. An absence of management over ecologically hazardous movements, such as unlawful forestry, wildlife poaching, and unlicensed mining, may arise from this redirection of resources to other undertakings. As a result, the EF grows larger the longer environmental degradation goes unchecked. It is also important to remember that conflicts can obstruct the development and application of sustainable policies and practices. Plans and investments in sustainable resource management and environmental conservation are often neglected during times of conflict. The results of this study highlight the significance of efforts for peacebuilding and conflict resolution in reducing the EF of rising nations.
DIE exhibits a positive and significant relationship with EF, with coefficients ranging from 0.843 to 1.151. While digitalization fosters economic activity and efficiency, it also increases energy consumption and electronic waste, leading to greater environmental degradation. The results highlight the dual role of the digital economy, where its environmental benefits are offset by its resource and energy demands, particularly in nations with weaker regulatory frameworks.
In G-20 countries, the coefficient of DIE shows a positive linkage with EF, meaning that growth in the former drives growth in the latter. A plausible rationale for the observed outcome is that the swift rate of technological progress, coupled with a growing need for digital goods and services, has significantly contributed to the rise in energy consumption, which is primarily sourced from coal power plants. Additionally, there are serious risks to the environment and public health associated with the disposal of electronic trash and the continuous development of new technology. These findings are like the results of Wang et al. (2022), who found that China’s rising CO2 emissions are a result of the societal effects of the digital economy. Additionally, Dong et al. (2022) looked at how the digital economy affected per capita emissions and carbon emission intensity in 60 different countries. According to their findings, these countries' emission densities decrease because of the digital economy, but their per capita emissions rise.
Governance consistently shows a strong negative relationship with EF, with coefficients ranging from −0.161 to −0.701 across quantiles. Strong governance reduces EF by promoting sustainable policies, enforcing environmental regulations, and reducing corruption. The stronger negative coefficients in higher quantiles suggest that good governance has a more pronounced impact in mitigating ecological footprints in countries facing higher environmental challenges.
Robust institutions facilitate the application of stringent environmental laws and help to reduce corruption. Thus, through social, governance, and economic preparedness, institutional quality plays a critical role in mitigating the effects of climate change. Thus, before adaptation choices can be implemented, strong political institutions require rigorous social, government, and economic improvements and policies. This finding is in line with the results of (Ahmad et al., 2022; Aydin et al., 2024; Bambi et al., 2024; Yang et al., 2023). Figure 3 shows the graphical representation of the results.
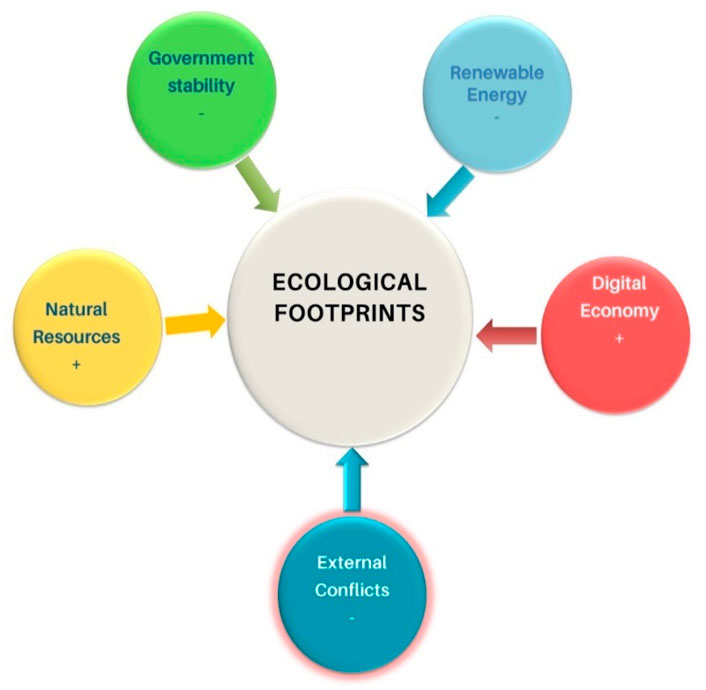
Figure 3. Graphical representation of findings.
The intercepts (constant terms) are negative and significant across all quantiles, indicating a baseline reduction in EF when other variables are controlled. The results show heterogeneity in the relationships across quantiles, emphasizing the need for tailored policy interventions. Countries with higher ecological footprints benefit more significantly from improvements in renewable energy adoption and governance quality while being disproportionately affected by resource consumption and economic growth.
The findings stress the urgency of promoting renewable energy transitions, improving governance, and managing natural resource consumption to mitigate ecological footprints. Additionally, efforts to leverage the digital economy should focus on minimizing its environmental costs through sustainable practices and regulations. Addressing external conflicts is also crucial for fostering an environment conducive to sustainability initiatives.
6 Conclusion and policy suggestions
The investigation conducted on G-20 nations reveals significant insights into the relationships among natural resources (NR), renewable energy (RE), and ecological footprints (EF), while considering external conflicts, governance (GOV), and the digital economy (DIE). The results indicate that DIE and NR exacerbate ecological degradation, increasing EF. External conflicts also contribute to heightened EF in these nations. Conversely, renewable energy use reduces EF, demonstrating its positive role in mitigating environmental impacts. Rising economic growth, however, is associated with increased EF, highlighting the trade-offs between development and sustainability. The study underscores the unsustainability of NR usage, which poses significant challenges to achieving carbon neutrality targets and meeting SDG 13.
6.1 Policy implications
To address ecological degradation and achieve Sustainable Development Goal (SDG) targets, policymakers must adopt a multifaceted and targeted approach grounded in the results of this study. Limiting NR usage and accelerating the transition to RE should be central priorities. Concrete strategies include implementing levies, tariffs, and high taxes on NR-intensive industries, particularly in developing nations. Raising NR costs through increased import duties or extraction fees can also discourage overexploitation. Governments should invest heavily in clean energy research, development, and production to ensure a seamless energy transition and uninterrupted economic growth. To mitigate the pollution and ecological impact of resource-intensive industries, green mining policies, such as requiring the use of environmentally friendly extraction technologies, should be enforced. Additionally, incentives for adopting clean technologies in NR extraction, processing, and transportation can further minimize their environmental footprint.
The transition to RE demands a phased and strategic approach. Policymakers should promote the temporary substitution of cleaner fossil fuels, such as natural gas until renewable energy technologies like solar, wind, and hydroelectric power become more accessible and affordable. This substitution can act as a bridge to reduce reliance on heavily polluting energy sources. Large-scale infrastructure investments in RE, coupled with incentives for private-sector participation, will be crucial. Providing subsidies for renewable energy installations, streamlining regulatory approvals for green projects, and establishing a carbon pricing mechanism are actionable steps to accelerate the transition. These policies can enhance environmental sustainability, reduce pollution, and expedite progress toward achieving SDGs 7 (Affordable and Clean Energy) and 11 (Sustainable Cities and Communities).
Given the significant role of the digital economy (DIE) in driving energy consumption, G-20 nations should leverage their high ICT adoption rates to integrate renewable energy into digital infrastructure and services. Dematerialization trends—reducing reliance on physical goods and emphasizing digital solutions—can be further encouraged by expanding digital education, promoting e-governance platforms, and incentivizing industries to adopt cloud computing and other energy-efficient digital technologies. Regulations mandating the use of RE in powering data centers, digital infrastructure, and telecommunications can substantially reduce the DIE’s carbon footprint.
For external conflicts, peaceful resolution policies are critical to curtail the arms race, military spending, and resource exploitation. Diplomatic efforts should focus on conflict de-escalation through international collaboration and mediation mechanisms. Reallocating resources from military expenditures to environmental conservation projects and infrastructure development can foster long-term sustainability. Policymakers should prioritize investments in rebuilding conflict-affected regions with eco-friendly materials and practices to promote resource sustainability and economic recovery.
Regarding the EF and gross GDP relationship, policies should aim to decouple economic growth from environmental degradation. Expanding renewable energy adoption, incentivizing circular economy practices (such as recycling and resource recovery), and supporting green entrepreneurship can help mitigate the negative effects of economic expansion. Strengthening digital infrastructure with energy-efficient technologies and integrating sustainability metrics into national economic planning will enable G-20 nations to achieve balanced environmental and economic sustainability. Clear, enforceable targets for reducing EF, supported by robust monitoring systems, will ensure accountability and progress toward these goals.
6.2 Limitations of the study
While this study provides valuable insights into the relationships among natural resources, renewable energy, digital economy, external conflicts, governance, and ecological footprints in G-20 countries, several limitations should be acknowledged. First, the analysis is constrained by data availability, as the study focuses on the period from 2000 to 2021. The exclusion of data for 2022, 2023, and 2024 is primarily due to incomplete or unavailable datasets for key variables such as ecological footprints, digital economy indicators, and governance measures during these years. This limitation was unavoidable but ensured the reliability and consistency of the findings based on comprehensive data.
Additionally, the study does not account for certain important variables, such as technological innovation in clean energy and demographic characteristics, which could further explain variations in ecological footprints. Including such variables could enhance the robustness of future research. Moreover, while the study adopts the MMQR methodology to address heterogeneity and cross-sectional dependence, it does not explore alternative techniques, which might yield complementary perspectives.
Another limitation lies in the generalizability of the findings. While the G-20 nations represent a significant portion of global economic activity and energy consumption, their unique characteristics may not fully capture the dynamics in smaller economies or regions with less industrialization. Finally, although the study integrates the impacts of conflicts, the digital economy, and governance, the potential interaction effects among these variables are not thoroughly explored.
These limitations suggest that future research could extend the dataset to include recent years, incorporate additional explanatory variables, and employ alternative methodologies. Comparative analyses across different income groups or regions could also yield intriguing results, enhancing the applicability of findings to a broader global context.
6.3 Future research directions
Nevertheless, certain aspects, such as technology for the environment, and demographic characteristics were left out of this empirical inquiry, which only controlled a small number of variables. Future research can incorporate different economic and demographic variables into the model since EF can be influenced by a wide range of other factors. To comprehend the diverse impacts of factors on EF, future research can potentially make use of additional reliable techniques. Aside from this, comparative research that splits nations into various income brackets or geographical areas could yield some intriguing results.
Data availability statement
Publicly available datasets were analyzed in this study. This data can be found here: https://data.worldbank.org/country; https://www.footprintnetwork.org/.
Author contributions
QL: Conceptualization, Data curation, Funding acquisition, Investigation, Methodology, Software, Validation, Writing–original draft, Writing–review and editing. UM: Conceptualization, Formal Analysis, Investigation, Methodology, Writing–original draft, Writing–review and editing.
Funding
The author(s) declare that no financial support was received for the research, authorship, and/or publication of this article.
Conflict of interest
The authors declare that the research was conducted in the absence of any commercial or financial relationships that could be construed as a potential conflict of interest.
Generative AI statement
The author(s) declare that no Generative AI was used in the creation of this manuscript.
Publisher’s note
All claims expressed in this article are solely those of the authors and do not necessarily represent those of their affiliated organizations, or those of the publisher, the editors and the reviewers. Any product that may be evaluated in this article, or claim that may be made by its manufacturer, is not guaranteed or endorsed by the publisher.
References
Adebayo, T. S., Ullah, S., Kartal, M. T., Ali, K., Pata, U. K., and Ağa, M. (2023). Endorsing sustainable development in BRICS: the role of technological innovation, renewable energy consumption, and natural resources in limiting carbon emission. Sci. Total Environ. 859, 160181. doi:10.1016/j.scitotenv.2022.160181
Ahmad, M., Ahmed, Z., Akbar, S., and Alvarado, R. (2023). Towards environmental sustainability in E−7 countries: assessing the roles of natural resources, economic growth, country risk, and energy transition. Resour. Policy 82, 103486. doi:10.1016/J.RESOURPOL.2023.103486
Ahmad, M., Ahmed, Z., Yang, X., Hussain, N., and Sinha, A. (2022). Financial development and environmental degradation: do human capital and institutional quality make a difference? Gondwana Res. 105, 299–310. doi:10.1016/j.gr.2021.09.012
Ahmed, Z., Ahmad, M., Alvarado, R., Sinha, A., Shah, M. I., and Abbas, S. (2022). Towards environmental sustainability: do financial risk and external conflicts matter? J. Clean. Prod. 371, 133721. doi:10.1016/j.jclepro.2022.133721
Ahmed, Z., Nathaniel, S. P., and Shahbaz, M. (2021). The criticality of information and communication technology and human capital in environmental sustainability: evidence from Latin American and Caribbean countries. J. Clean. Prod. 286, 125529. doi:10.1016/j.jclepro.2020.125529
Akalin, G., Erdogan, S., and Sarkodie, S. A. (2021). Do dependence on fossil fuels and corruption spur ecological footprint? Environ. Impact Assess. Rev. 90, 106641. doi:10.1016/j.eiar.2021.106641
Akpanke, T. A., Deka, A., Ozdeser, H., and Seraj, M. (2024). Ecological footprint in the OECD countries: do energy efficiency and renewable energy matter? Environ. Sci. Pollut. Res. 31, 15289–15301. doi:10.1007/S11356-024-32151-1
Aldegheishem, A. (2024). Factors affecting ecological footprint in Saudi Arabia: a panel data analysis. Front. Environ. Sci. 12, 1384451. doi:10.3389/fenvs.2024.1384451
Ali, A., Radulescu, M., Lorente, D. B., and Hoang, V. N. V. (2022). An analysis of the impact of clean and non-clean energy consumption on economic growth and carbon emission: evidence from PIMC countries. Environ. Sci. Pollut. Res. 29, 51442–51455. doi:10.1007/S11356-022-19284-X/TABLES/8
Amer, E. A. A. A., Meyad, E. M. A., Meyad, A. M., and Mohsin, A. K. M. (2024). The impact of natural resources on environmental degradation: a review of ecological footprint and CO2 emissions as indicators. Front. Environ. Sci. 12, 1368125. doi:10.3389/fenvs.2024.1368125
Andrews, M. (2010). Good government means different things in different countries. Governance 23, 7–35. doi:10.1111/j.1468-0491.2009.01465.x
Aronson, H. (1994). Allan schnaiberg and kenneth alan gould,Environment and society: the enduring conflict.New York: st. Martin’s press, 1994. Xiii + 255 pages. Sociol. Focus 27, 381–382. doi:10.1080/00380237.1994.10571033
Awosusi, A. A., Adebayo, T. S., Altuntaş, M., Agyekum, E. B., Zawbaa, H. M., and Kamel, S. (2022). The dynamic impact of biomass and natural resources on ecological footprint in BRICS economies: a quantile regression evidence. Energy Rep. 8, 1979–1994. doi:10.1016/j.egyr.2022.01.022
Aydin, M., Sogut, Y., and Erdem, A. (2024). The role of environmental technologies, institutional quality, and globalization on environmental sustainability in European Union countries: new evidence from advanced panel data estimations. Environ. Sci. Pollut. Res. 2024 Springer 31, 10460–10472. doi:10.1007/s11356-024-31860-x
Balsalobre-Lorente, D., Shahbaz, M., Murshed, M., and Nuta, F. M. (2023). Environmental impact of globalization: the case of central and Eastern European emerging economies. J. Environ. Manage. 341, 118018. doi:10.1016/j.jenvman.2023.118018
Balsalobre-Lorente, D., Shahbaz, M., Roubaud, D., and Farhani, S. (2018). How economic growth, renewable electricity and natural resources contribute to CO2 emissions? Energy Policy 113, 356–367. doi:10.1016/J.ENPOL.2017.10.050
Bambi, P. D. R., Batatana, M. L. D., Appiah, M., and Tetteh, D. (2024). Governance, institutions, and climate change resilience in Sub-Saharan Africa: assessing the threshold effects. Front. Environ. Sci. 12. doi:10.3389/fenvs.2024.1352344
British Petroleum (2019). British petroleum (BP) (2019). BP statistical review of world energy 2019. BP. - google search. Available at: https://www.google.com/search?q=British+Petroleum+%28BP%29+%282019%29.+BP+Statistical+Review+of+World+Energy+2019.+BP.&sca_esv=fd2cccf1c76b337a&sxsrf=ADLYWIKRjM0EFHw7OaKeY0N5S-lBIazUHw%3A1735358235683&ei=G3dvZ7GzKfiC1LsP09mXqA8&ved=0ahUKEwjxrMiZycmKAxV4AX (Accessed December 28, 24).
Cai, Y., Sam, C. Y., and Chang, T. (2018). Nexus between clean energy consumption, economic growth and CO2 emissions. J. Clean. Prod. 182, 1001–1011. doi:10.1016/j.jclepro.2018.02.035
Câmara, P. (2022). The systemic interaction between corporate governance and ESG. Palgrave Handb. ESG Corp. Gov., 3–40. doi:10.1007/978-3-030-99468-6_1
Cardoni, A., Kiseleva, E., and Lombardi, R. (2020). A sustainable governance model to prevent corporate corruption: integrating anticorruption practices, corporate strategy and business processes. Bus. Strateg. Environ. 29, 1173–1185. doi:10.1002/bse.2424
Chen, F., Ahmad, S., Arshad, S., Ali, S., Rizwan, M., Hamzah Saleem, M., et al. (2022). Towards achieving eco-efficiency in top 10 polluted countries: the role of green technology and natural resource rents. Gondwana Res. 110, 114–127. doi:10.1016/j.gr.2022.06.010
Chu, L. K., Doğan, B., Abakah, E. J. A., Ghosh, S., and Albeni, M. (2022). Impact of economic policy uncertainty, geopolitical risk, and economic complexity on carbon emissions and ecological footprint: an investigation of the E7 countries. Environ. Sci. Pollut. Res. 30, 34406–34427. doi:10.1007/s11356-022-24682-2
Dai, J., Ahmed, Z., Pata, U. K., and Ahmad, M. (2023a). Achieving SDG-13 in the era of conflicts: the roles of economic growth and government stability. Eval. Rev. 47, 1168–1192. doi:10.1177/0193841x231160626
Dai, J., Alvarado, R., Ali, S., Ahmed, Z., and Meo, M. S. (2023b). Transport infrastructure, economic growth, and transport CO(2) emissions nexus: does green energy consumption in the transport sector matter? Environ. Sci. Pollut. Res. Int. 30, 40094–40106. doi:10.1007/s11356-022-25100-3
Danish (2019). Effects of information and communication technology and real income on CO2 emissions: the experience of countries along Belt and Road. Telemat. Inf. 45, 101300. doi:10.1016/j.tele.2019.101300
Danish, K., Ulucak, R., and Khan, S.U.-D. (2020). Determinants of the ecological footprint: role of renewable energy, natural resources, and urbanization. Sustain. Cities Soc. 54, 101996. doi:10.1016/j.scs.2019.101996
Dogan, E., Tzeremes, P., and Altinoz, B. (2020). Revisiting the nexus among carbon emissions, energy consumption and total factor productivity in African countries: new evidence from nonparametric quantile causality approach. Heliyon 6, e03566. doi:10.1016/J.HELIYON.2020.E03566
Dong, F., Hu, M., Gao, Y., Liu, Y., Zhu, J., and Pan, Y. (2022). How does digital economy affect carbon emissions? Evidence from global 60 countries. Sci. Total Environ. 852, 158401. doi:10.1016/j.scitotenv.2022.158401
Du, J., Shen, Z., Song, M., and Zhang, L. (2023). Nexus between digital transformation and energy technology innovation: an empirical test of A-share listed enterprises. Energy Econ. 120, 106572. doi:10.1016/j.eneco.2023.106572
GFN (2024). Global footprint network. Available at: http://data.footprintnetwork.org.
Goel, A., Masurkar, S., and Pathade, G. R. (2024). An overview of digital transformation and environmental sustainability: threats, opportunities, and solutions. Sustain 16, 11079. doi:10.3390/SU162411079
Hashem Pesaran, M., and Yamagata, T. (2008). Testing slope homogeneity in large panels. J. Econom. 142, 50–93. doi:10.1016/j.jeconom.2007.05.010
Hassan, S. T., Xia, E., Huang, J., Khan, N. H., and Iqbal, K. (2019). Natural resources, globalization, and economic growth: evidence from Pakistan. Environ. Sci. Pollut. Res. 26, 15527–15534. doi:10.1007/s11356-019-04890-z
Hooks, G., and Smith, C. L. (2005). Treadmills of production and destruction. Organ. and Environ. 18, 19–37. doi:10.1177/1086026604270453
Hussain, M., and Dogan, E. (2021). The role of institutional quality and environment-related technologies in environmental degradation for BRICS. J. Clean. Prod. 304, 127059. doi:10.1016/J.JCLEPRO.2021.127059
ICRG (2022). International country risk guide. Available at: https://www.prsgroup.com/explore-our-products/international-country-risk-guide/(Accessed January, 2021).
ICRG (2024). The international country risk guide (ICRG). United States: PRS Group. Available at: https://www.prsgroup.com/explore-our-products/icrg/(Accessed October 31, 24).
Imran, M., Khan, M. K., Alam, S., Wahab, S., Tufail, M., and Jijian, Z. (2024). The implications of the ecological footprint and renewable energy usage on the financial stability of South Asian countries. Financ. Innov. 10, 102–123. doi:10.1186/s40854-024-00627-1
IPCC (2021). Climate change 2021: the physical science basis | climate change 2021. Phys. Sci. Basis. Available at: https://www.ipcc.ch/report/ar6/wg1/(Accessed December 28, 24).
Jiao, Z., Sharma, R., Kautish, P., and Hussain, H. I. (2021). Unveiling the asymmetric impact of exports, oil prices, technological innovations, and income inequality on carbon emissions in India. Resour. Policy 74, 102408. doi:10.1016/j.resourpol.2021.102408
Khalfaoui, R., Arminen, H., Doğan, B., and Ghosh, S. (2023). Environment-growth nexus and corruption in the MENA region: novel evidence based on method of moments quantile estimations. J. Environ. Manage. 342, 118146. doi:10.1016/j.jenvman.2023.118146
Khezri, M., Mamkhezri, J., and Razzaghi, S. (2023). Regional and spatial impacts of external and internal conflicts on ecological footprint: the case of Middle East and Africa. Environ. Sci. Pollut. Res. 30, 63631–63646. doi:10.1007/S11356-023-26692-0
Kongbuamai, N., Bui, Q., Yousaf, H. M. A. U., and Liu, Y. (2020). The impact of tourism and natural resources on the ecological footprint: a case study of ASEAN countries. Environ. Sci. Pollut. Res. 27, 19251–19264. doi:10.1007/S11356-020-08582-X
Li, L., Hong, X., and Wang, J. (2020). Evaluating the impact of clean energy consumption and factor allocation on China’s air pollution: a spatial econometric approach. Energy 195, 116842. doi:10.1016/j.energy.2019.116842
Lombardi, R., Trequattrini, R., Cuozzo, B., and Cano-Rubio, M. (2019). Corporate corruption prevention, sustainable governance and legislation: first exploratory evidence from the Italian scenario. J. Clean. Prod. 217, 666–675. doi:10.1016/j.jclepro.2019.01.214
Ma, B., Lin, S., Bashir, M. F., Sun, H., and Zafar, M. (2023). Revisiting the role of firm-level carbon disclosure in sustainable development goals: research agenda and policy implications. Gondwana Res. 117, 230–242. doi:10.1016/j.gr.2023.02.002
Machado, J. A. F., and Santos Silva, J. M. C. (2019). Quantiles via moments. J. Econom. 213, 145–173. doi:10.1016/j.jeconom.2019.04.009
Murshed, M., Ahmed, Z., Alam, M. S., Mahmood, H., Rehman, A., and Dagar, V. (2021). Reinvigorating the role of clean energy transition for achieving a low-carbon economy: evidence from Bangladesh. Environ. Sci. Pollut. Res. 28, 67689–67710. doi:10.1007/s11356-021-15352-w
Pata, U. K., Aydin, M., and Haouas, I. (2021). Are natural resources abundance and human development a solution for environmental pressure? Evidence from top ten countries with the largest ecological footprint. Resour. Policy 70, 101923. doi:10.1016/j.resourpol.2020.101923
Pesaran, M. H. (2007). A simple panel unit root test in the presence of cross-section dependence. J. Appl. Econom. 22, 265–312. doi:10.1002/jae.951
Qayyum, U., Anjum, S., and Sabir, S. (2021). Armed conflict, militarization and ecological footprint: empirical evidence from South Asia. J. Clean. Prod. 281, 125299. doi:10.1016/j.jclepro.2020.125299
Ran, Q., Yang, X., Yan, H., Xu, Y., and Cao, J. (2023). Natural resource consumption and industrial green transformation: does the digital economy matter? Resour. Policy 81, 103396. doi:10.1016/j.resourpol.2023.103396
Ren, S., Hao, Y., and Wu, H. (2022). Digitalization and environment governance: does internet development reduce environmental pollution? J. Environ. Plan. Manag. 66, 1533–1562. doi:10.1080/09640568.2022.2033959
Safitri, D., Fahrurrozi, M., Marini, A., Dewiyani, L., and Attas, S. G. (2023). The role of environmental degradation and green investment on the renewable energy production in ASEAN countries: evidence using novel MMQR technique. Environ. Sci. Pollut. Res. 30, 33363–33374. doi:10.1007/s11356-022-24302-z
Salman, M., Zha, D., and Wang, G. (2022). Indigenous versus foreign innovation and ecological footprint: dynamic threshold effect of corruption. Environ. Sustain. Indic. 14, 100177. doi:10.1016/j.indic.2022.100177
Sarkodie, S. A. (2018). The invisible hand and EKC hypothesis: what are the drivers of environmental degradation and pollution in Africa? Environ. Sci. Pollut. Res. 25, 21993–22022. doi:10.1007/s11356-018-2347-x
Shahbaz, M., Wang, J., Dong, K., and Zhao, J. (2022). The impact of digital economy on energy transition across the globe: the mediating role of government governance. Renew. Sustain. Energy Rev. 166, 112620. doi:10.1016/j.rser.2022.112620
Sharma, R., Sinha, A., and Kautish, P. (2020). Examining the impacts of economic and demographic aspects on the ecological footprint in South and Southeast Asian countries. Environ. Sci. Pollut. Res. 27, 36970–36982. doi:10.1007/s11356-020-09659-3
Sharma, R., Sinha, A., and Kautish, P. (2021). Does renewable energy consumption reduce ecological footprint? Evidence from eight developing countries of Asia. J. Clean. Prod. 285, 124867. doi:10.1016/J.JCLEPRO.2020.124867
Tabash, M. I., Farooq, U., El Refae, G. A., and Belarbi, A. (2022). Tackling the ecological footprints of foreign direct investment and energy dependency through governance: empirical evidence from GCC region. Qual. and Quant. 57, 4435–4454. doi:10.1007/s11135-022-01534-2
Tran, T., Bui, H., Vo, A., and Vo, D. (2024). The role of renewable energy in the energy–growth–emission nexus in the ASEAN region. Sustain. Soc. 2024 Springer 14, 17. doi:10.1186/s13705-024-00446-3
Ulucak, R., Danish, , and Khan, S. U. (2020). Does information and communication technology affect CO 2 mitigation under the pathway of sustainable development during the mode of globalization? Sustain. Dev. 28, 857–867. doi:10.1002/sd.2041
UNCCD (2024). G20 global land initiative | UNCCD. Available at: https://www.unccd.int/our-work/flagship-initiatives/G20-Initiative (Accessed December 28, 24).
Usman, A., Ozturk, I., Naqvi, S. M. M. A., Ullah, S., and Javed, M. I. (2022). Revealing the nexus between nuclear energy and ecological footprint in STIRPAT model of advanced economies: fresh evidence from novel CS-ARDL model. Prog. Nucl. Energy 148, 104220. doi:10.1016/j.pnucene.2022.104220
Usman, O., Rafindadi, A. A., and Sarkodie, S. A. (2021). Conflicts and ecological footprint in MENA countries: implications for sustainable terrestrial ecosystem. Environ. Sci. Pollut. Res. 28, 59988–59999. doi:10.1007/s11356-021-14931-1
Uzar, U. (2021). The relationship between institutional quality and ecological footprint: is there a connection? Nat. Resour. Forum 45, 380–396. doi:10.1111/1477-8947.12235
Wang, B., Wang, J., Dong, K., and Dong, X. (2023). Is the digital economy conducive to the development of renewable energy in Asia? Energy Policy 173, 113381. doi:10.1016/j.enpol.2022.113381
Wang, J., Dong, K., Dong, X., and Taghizadeh-Hesary, F. (2022). Assessing the digital economy and its carbon-mitigation effects: the case of China. Energy Econ. 113, 106198. doi:10.1016/j.eneco.2022.106198
WDI (2024). World Bank (world development indicators). Available at: https://databank.worldbank.org/indicator/NY.GDP.PCAP.CD/%201ff4a498/%20Popular-Indicators.
Westerlund, J., and Edgerton, D. L. (2007). A panel bootstrap cointegration test. Econ. Lett. 97, 185–190. doi:10.1016/j.econlet.2007.03.003
WGI (2024). Worldwide governance indicators | DataBank. Available at: https://databank.worldbank.org/Institutional-Quality/id/98e680fc (Accessed December 28, 24).
Wu, L., Wan, X., Jahanger, A., Li, M., Murshed, M., and Balsalobre-Lorente, D. (2023). Does the digital economy reduce air pollution in China? A perspective from industrial agglomeration. Energy Rep. 9, 3625–3641. doi:10.1016/j.egyr.2023.02.031
Xu, C., Zhao, W., Li, X., Cheng, B., and Zhang, M. (2023). Quality of life and carbon emissions reduction: does digital economy play an influential role? Clim. Policy 24, 346–361. doi:10.1080/14693062.2023.2197862
Yang, J., Huang, H., Sanyal, S., Khan, S., Alam, M. M., and Murshed, M. (2023). Heterogeneous effects of energy productivity improvement on consumption-based carbon footprints in developed and developing countries: the relevance of improving institutional quality. Gondwana Res. 124, 61–76. doi:10.1016/j.gr.2023.06.013
Yao, X., Yasmeen, R., Hussain, J., and Hassan Shah, W. U. (2021). The repercussions of financial development and corruption on energy efficiency and ecological footprint: evidence from BRICS and next 11 countries. Energy 223, 120063. doi:10.1016/j.energy.2021.120063
Zafar, M. W., Zaidi, S. A. H., Khan, N. R., Mirza, F. M., Hou, F., and Kirmani, S. A. A. (2019). The impact of natural resources, human capital, and foreign direct investment on the ecological footprint: the case of the United States. Resour. Policy 63, 101428. doi:10.1016/j.resourpol.2019.101428
Zhang, R., Sharma, R., Tan, Z., and Kautish, P. (2022). Do export diversification and stock market development drive carbon intensity? The role of renewable energy solutions in top carbon emitter countries. Renew. Energy 185, 1318–1328. doi:10.1016/j.renene.2021.12.113
Keywords: digital economy, external conflicts, G-20, institutional quality, MMQR, natural resources
Citation: Liu Q and Mehmood U (2025) From pixels to policy: deciphering G-20 countries’ digitalization, resource management, external conflicts, governance, and environmental frameworks. Front. Environ. Sci. 13:1517486. doi: 10.3389/fenvs.2025.1517486
Received: 26 October 2024; Accepted: 10 January 2025;
Published: 13 February 2025.
Edited by:
Mobeen Ur Rehman, Keele University, United KingdomReviewed by:
Alieu Gibba, University of the Gambia, GambiaYan Tang, Tianjin University of Technology, China
Copyright © 2025 Liu and Mehmood. This is an open-access article distributed under the terms of the Creative Commons Attribution License (CC BY). The use, distribution or reproduction in other forums is permitted, provided the original author(s) and the copyright owner(s) are credited and that the original publication in this journal is cited, in accordance with accepted academic practice. No use, distribution or reproduction is permitted which does not comply with these terms.
*Correspondence: Usman Mehmood, usmanmehmood.umt@gmail.com