 Raid Alrowais1,2*
 Ashraf Jatwary3
 Marcela Bindzarova Gergelova4*
 Mohammad Akrami5Bandar Alwushayh1
 Elsayed Elkamhawy3,6
- 1Department of Civil Engineering, College of Engineering, Jouf University, Sakakah, Saudi Arabia
- 2Sustainable Development Research and Innovation Center, Deanship of Graduate Studies and Scientific Research, Jouf University, Sakakah, Saudi Arabia
- 3Faculty of Engineering, Zagazig University, Zagazig, Egypt
- 4Institute of Geodesy, Cartography and Geographical Information Systems, Faculty of Mining, Ecology, Process Control and Geotechnology, Technical University of Kosice, Kosice, Slovakia
- 5Department of Engineering, University of Exeter, Exeter, United Kingdom
- 6Abaalkhail Consulting Engineering Co., Riyadh, Saudi Arabia
As global climate change exacerbates water scarcity, recycling agricultural drainage water is emerging as a promising solution in water resources-limited regions. This research investigated the hydraulic impact of using gravel bio-filters in contaminated water-courses, focusing on submerged bioreactors as a sustainable engineering solution. This study assessed the hydraulic impacts of installing these bioreactors in polluted waterways using three-dimensional numerical models based on computational fluid dynamics. Results indicated that relative heading-up will increase with the Froude number, demonstrating a direct relationship between flow velocity and heading-up. Altering the shape of bio-filter inlet is predicted to significantly influence heading-up values, with triangular shapes showing the lowest heading-up values compared to basic, rounded, or sloped upstream U.S face shapes. Relative heading-up values will increase by 10.32%, 10.44%, 24.67%, and 31.86% when changing the bio-filter inlet shape from triangular to sloped U.S. face with respect to horizontal and vertical direction, rounded, and basic bio-filter, respectively. Additionally, the number and orientation of shapes in the bio-filter inlet impact relative heading-up, with varying effects predicted based on the inclination angle. These findings provide valuable guidance for mitigating hydraulic impacts and optimizing the design and operation of bioreactors in water resource management, promoting sustainable water purification approaches in contaminated watercourses and conserving surrounding environments.
1 Introduction
1.1 Water resources protection from pollution
Water, particularly in arid and semi-arid environments, is acknowledged as an exceedingly vital resource (Elkamhawy et al., 2021; Alrowais et al., 2023a). Thus, the imperative task of safeguarding water resources from pollution necessitates reducing contamination levels and enhancing water quality to align with international standards and curtail the environmental dissemination of contaminants (El-Saiad et al., 2021; Abd-Elhamid et al., 2022; Alrowais et al., 2023b). Pollutants, such as pesticides, herbicides, fertilizers, and industrial wastewater, are discharged into different drains of water, rendering them unfit for human consumption (Elkamhawy et al., 2021; Fan et al., 2018). The safeguarding of water resources mandates the prevention of pollution by curtailing the discharge of contaminants into water bodies. Achieving this involves the enforcement of regulations and policies that restrict the amount of pollutants industries can release into different water bodies. Eliminating water pollution is essential for preserving biodiversity, providing safe drinking water, and promoting sustainable development through diverse treatment methods like sedimentation, filtration, and disinfection (Saravanan et al., 2021; Alrowais et al., 2024a). These procedures play a pivotal role in purging pollutants, ensuring water safety for consumption. The efficacy of treatment technologies in eliminating an extensive array of contaminants from water resources underscores the importance of investing in these technologies to shield and conserve water resources for future generations (National Research Council, 1999). This crisis underscores the urgency of developing effective and sustainable methods for water treatment to ensure the availability of clean water resources.
1.2 Water demand and pollution challenges
The demand for water is increasing due to population growth, agricultural expansion, and industrial development. Agriculture consumes about 70% of the world’s water, followed by 20% for industry and 10% for municipalities; in addition water demand is projected to rise by 55% by 2050 (Abd-Elhamid et al., 2022). Recycling agricultural drainage water for irrigation is a cost-effective solution, but this water is often polluted by fertilizers, herbicides, and pesticides (Alrowais et al., 2023b). Water pollution is worsened by untreated wastewater discharge, especially in developing nations. Improving water quality and adhering to international standards is crucial to minimize environmental contamination (El-Saiad et al., 2021; El-Agha et al., 2011).
1.3 Sustainable water treatment technologies: bioreactors as effective solutions
Traditional water treatment technologies, such as physical, chemical, and biological processes, frequently rely on energy-intensive, chemically driven procedures, which can have negative environmental consequences and might not be practicable in remote, isolated, or economically disadvantaged areas (El-Saiad et al., 2021; Abdel Daiem et al., 2021). The essential advancement of eco-friendly technologies is vital for protecting both human health and environment, with the goal of reducing the pollution of natural water sources (Çinar et al., 2006; Liu et al., 2020; Md Anawar and Chowdhury, 2020). Predominantly, adsorption/bio-adsorption serve as one of the primary and effective mechanisms for removing both inorganic and organic pollutants from water solutions that could combine biological and physiochemical adsorption in a bioreactor, contributing to enhanced self-decontamination and improved water quality from both economic and environmental perspectives (Alrowais et al., 2023c; Alrowais et al., 2024b; El-Shatoury et al., 2014). Bioreactors, including gravel filters, are emerging as a promising sustainable alternative that use the natural, biological, and low maintenance processes to remove different pollutants from drainage water with a resilient ecosystem via diverse microbial communities and self-regulation. Moreover, a sustainable, and renewable bioreactor system can be put together using biodegradable and local bio-filter media, such as sand, gravel, peat, carbon material, and compost (Abdel Daiem et al., 2021; Çinar et al., 2006; Alrowais et al., 2023c; Alrowais et al., 2024b; El-Shatoury et al., 2014; Ramírez-Baca et al., 2005; El Monayeri et al., 2007; Braschi et al., 2022; Aljubiri et al., 2024). In addition to providing a low-energy, eco-friendly alternative to traditional treatment systems by using passive energy, renewable energy is considered as sludge reduction reactor. Furthermore, the longevity and durability of bio-filters contribute to their sustainability. With proper design and maintenance, bio-filters can function effectively for many years (El-Saiad et al., 2021; Abdel Daiem et al., 2021). The concept of self-purification in watercourses, wherein the natural ecosystem progressively breaks down contaminants, is improved through the judicious use of bioreactors. These systems rely on microorganisms in the filter media to break down organic pollutants, trap suspended particles and neutralize hazardous compounds (Abdel Daiem et al., 2021; El-Shatoury et al., 2014). Therefore, numerous studies have delved into bioreactor media, concentrating on assessing the impact of different media on the efficient removal of various contaminants from water bodies (Abdel Daiem et al., 2021; Çinar et al., 2006; El Monayeri et al., 2007; EL-Gohary, 2007).
1.4 Impact of bioreactors on hydraulic characteristics in open channels
While submerged bioreactors exhibit effectiveness in contaminant removal, their installation in open channels may introduce hydraulic impacts that influence water flow and quality. Previous studies have highlighted the need for a comprehensive hydraulic investigation to understand these impacts and optimize bioreactor deployment (Alrowais et al., 2023a; El-Saiad et al., 2021; Abd-Elhamid et al., 2022). Treating bioreactors as porous media allows the application of established studies (EL-Gohary, 2007; Mulqueen, 2005; Tao et al., 2011) to forecast the hydraulic features of watercourse flow in their installation vicinity. Abd-Elhamid et al. (2022) and El-Saiad et al. (2021) experimentally studied the hydraulic characteristics induced by bioreactor installation in an open waterway. These studies investigated different operational parameters, such as water flow, water height, and various bioreactor specifications, including relative heading up on the performance of bioreactors. Numerical simulation is considered an essential tool in engineering applications, as it allows for the analysis of complex systems and the accurate prediction of their behavior, helping to improve designs and save time and costs (Burgan, 2021). The use of computational fluid dynamics (CFD) has become integral in simulating and analyzing the hydraulic behavior of water flow in open channels. This approach allows for the creation of three-dimensional numerical models to assess the effects of bioreactor placement on flow velocity, turbulence, and shear stress (Alrowais et al., 2023a).
1.5 Study objective and literature gap
The aim of this study was to numerically investigate the influence of different arrangements of bioreactors within an open water channel on the hydraulic characteristics of a channel. Different Froude’s numbers, which reflect the various hydraulic conditions of various drain flow regimes, were used to conduct the investigation of relative heading up. Notably, this study uniquely focused on directing the whole flow of open drains through the bio-filter, distinguishing it from most previous studies that primarily dealt with submerged bioreactors for which only a portion of the discharge passes through, and the rest flows over the submerged bioreactor. The use of CFD modeling can help to optimize the design and operation of bioreactors in waterways. Overall, the hydraulic impact of bioreactors on contaminated waterways needs to be carefully evaluated to ensure effective treatment of the contaminated water while minimizing any negative impacts on the water courses and surroundings.
2 Materials and methods
2.1 Methodology
The purpose of this study was to understand and reduce the hydraulic effects that gravel bio-filters have on watercourses by numerically simulating them under various scenarios. The scenarios were investigated as follows: The first scenario examined at various discharges, which led to varying velocities and, as a result, varied Froude’s values that represented the drains’ true domain. The second scenario relied on the use of a 1.20 m fixed length bio-filter with different numbers of rounded shapes at the inlet of the bio-filter. Additionally, different numbers of triangular shapes at the inlet of the bio-filter were investigated. Both scenarios two and three were utilized to identify the effect of inlet shape on the hydraulic performance of bio-filter. The fourth scenario was applied to check the effect of changing the U.S. face angle with respect to horizontal direction (i.e., four angles: 0°, 15°, 30°, and 45° where the angle measuring direction is counterclockwise from horizontal direction) of the bio-filter at its inlet. The final scenario was based on changing the U.S. face angle with respect to the vertical direction (i.e., four angles: 0°, 15°, 30°, and 45° where the angle measuring direction is clockwise from vertical direction) of the bio-filter at its inlet. Figure 1 shows the summarized methodology for this study.
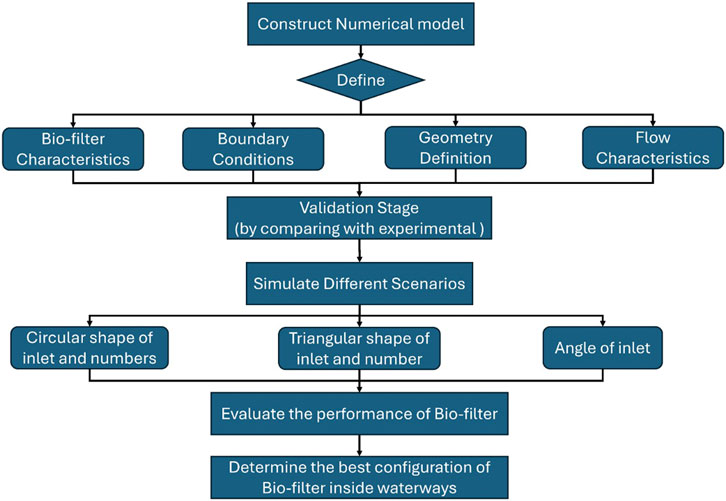
Figure 1. Flowchart of followed methodology.
The dimensions of the numerical model were as follows: The total length of the model was 10.0 m in the X-direction. The mesh block was divided into three zones using four mesh planes at intervals of 0.0, 4.40, 5.60, and 10.0 m. The total width of the model was 1.0 m in the Y-direction. The block of mesh was surrounded by two mesh planes at 0.0 m and 1.0 m intervals. The total height of the model was 1.0 m in the Z-direction. The mesh block was divided into three zones using four mesh planes at intervals of 0.0, 0.60, 0.78, and 1.0 m. Finally, the mesh block was created using the same cell size of 0.035 m in the three model directions.
2.2 Relevant theory
The current study was performed using one of the most powerful CFD FLOW-3D software packages (FLOW-3D, 2025). A CAD program was also used to create the geometry of the bio-filter and export it to FLOW-3D by stereolithographic (STL) format as shown in Figure 2. As shown in Equations 1, 2, the Reynolds-averaged Navier-Stokes equations (RANS) are the primary equations that regulate the flow in three directions during the numerical simulation. The finite volume method (FVM) is employed in FLOW-3D to solve the governing equations. The unknown values are calculated at various nodes in the mesh geometry of the finite volume method, which is described as a Eulerian method for defining, analyzing, and transforming partial differential equations to algebraic form (Patankar, 2018). This method expresses a small volume surrounding each node point on a mesh structure using the divergence theorem to transform volume integrals into surface integrals. These terms are then evaluated as fluxes at the surface of each finite volume.
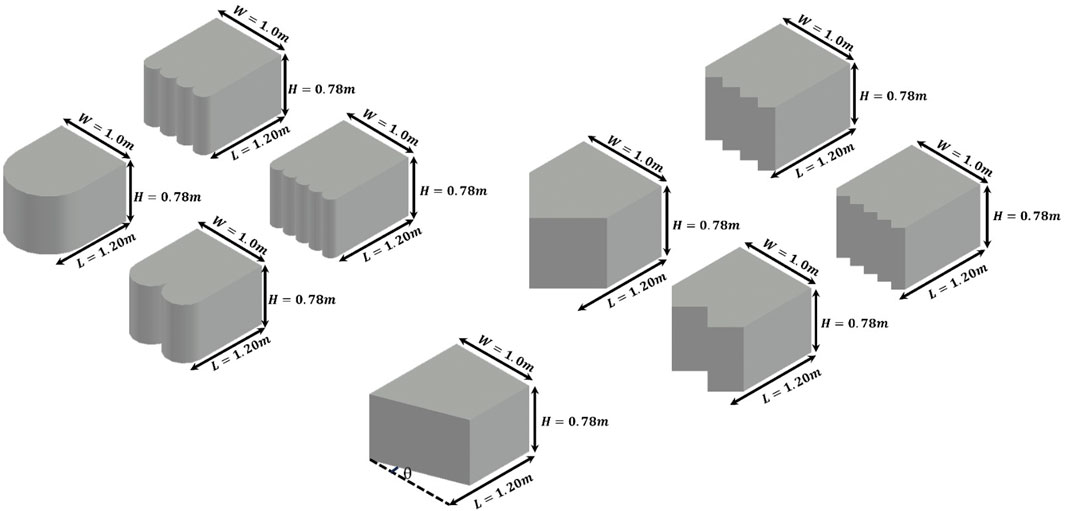
Figure 2. Solid geometric CAD representations of several 1.2-m-long bio-filters.
The continuity equation:
The momentum equation:
where
The volume of fluid (VOF) algorithm presented by Hirt and Nichols (1981) was utilized to perform the free surface profile. The function (F) displays the fluid occupancy of a grid cell. F has a value between zero and unity, where zero indicates that no fluid is present in the grid cell and unity indicates that the fluid fills the grid cell to the fullest. Equation 3 shows the free surface forms for grid cells whose (F) values range from zero to unity.
where (Ax, Ay, Az) are the area fractions and (u, v, w) are the velocity components in (x, y, z) coordinates, respectively.
2.3 Boundary and initial conditions
To increase the accuracy of the numerical model outputs, it is crucial to precisely define the boundary conditions. To shorten the simulation’s runtime, one mesh block was selected. The mesh block’s 3D boundary conditions were ascertained as follows: the X-direction’s inlet was identified as the volume flow rate, and the outlet as a designated pressure with a fluid elevation assigned to 0 points 6 m. The two sides of the mesh block were identified as a wall in the Y-direction. The bottom was identified as a wall in the Z-direction, and the top was identified as a given pressure with a given atm as depicted in Figure 3. The configuration, temperature, velocity, and pressure distributions are the initial conditions of the numerical model. The geometry of the waterway dictated the fluid configuration. During the simulation, the specific mass was set to a standard 1,000 kg/m3, the temperature was set to a standard 25°C. Furthermore, 0.0 m/s was chosen as the starting velocity. Hydrostatic pressure was the final pressure distribution to be established.
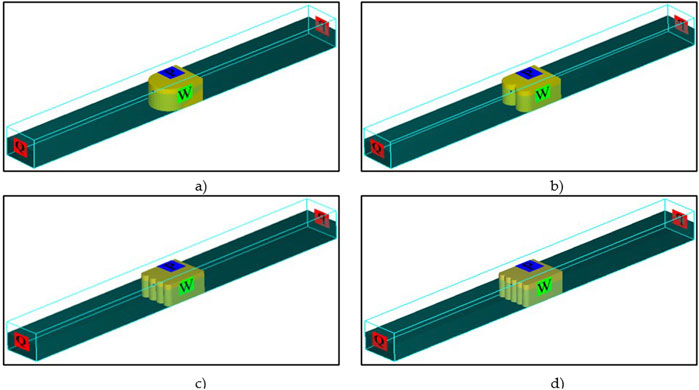
Figure 3. The rounded forms of the bio-filter inlet’s (A) one, (B) two, (C) four, and (D) five boundary conditions.
2.4 Grid type and time step
FLOW-3D reduces required memory, streamlines mesh creation, and increases numerical accuracy using simple rectangular orthogonal elements in planes and hexahedral elements in volumes. To optimize the numerical model’s accuracy and efficiency, a grid convergence test was utilized to determine the optimal mesh size. The grid convergence test indicated that 0.035 m was the ideal cell size. A Courant number was used to determine the maximum time-step size. This number controls the maximum flow distance allowed at each time step in the simulation. To avoid the flow passing through more than 1 cell in a time step, the Courant number was set to 0.25 in this study. Depending on the Courant number, 0.00075 s was the maximum time step value.
2.5 Turbulent and porous media models
Turbulence is the chaotic, unstable moving fluid that occurs when there are insufficient stabilizing viscous forces. The two-equation (k - ε) model, the two-equation (k - ω) models, and the renormalization-group (RNG) model are some of the turbulence behavior models in FLOW-3D that are most often used. Flow motion is represented using the RNG model as it more accurately replicates motion behavior than the (k - ε) and (k - ω) models (Alemi and Maia, 2018). The turbulent kinetic energy
In Equations 4, 5,
The model of the porous media is employed for calculating the drag and capillary pressure impacts in porous media such as soils, cracked rock, sponges, and paper. Solid materials that have linked interstitial spaces that allow fluid to pass through are referred to as porous media. When the pores of a material like sandstone or gravel are significantly smaller than the control volume, the porous media model makes sense. A porous medium’s porosity is calculated by dividing its open volume by its overall volume. Porosity, as defined in Equation 6, is equivalent to volume fraction
Materials with porosities close to 1.0, such as metallic foam filters, are entirely open. The gravel bio-filter’s porosity utilized was 39%, even though depending on the packing configuration, the porosity of closely packed spheres, or gravel ranges from 25% to 47%. After building the porous material’s continuum model and averaging each control volume, the standard preservation equations were derived. Equation 7 expresses conservation of mass:
where
Utilizing Henry Darcy’s (1856) discovery that the unidirectional flow rate via porous medium is directly related to the applied pressure differential, one may determine the momentum equation in porous media. Equation 8 expresses this relationship,
where
For gravel, the values of K are (10–7 to 10–9) m2, while for clay, they are in the range (10–13 to 10–16) m2. The resistance to flow increases with decreasing permeability. Drag is the term used to describe this resistance in porous medium modelling. Equation 9 illustrates how the drag term proportional to the velocity in the Navier-Stokes equations represents the porous medium’s flow resistance,
where
The microscopic velocity in a porous media containing coarse particles or fibers can be rather high, and the resulting flow losses can be both linear and proportional to the flow velocity square. Equation 10 provides the pressure decrease in Forchhemer’s equation,
where K2 is the non-Darcian or inertial permeability.
A single expression for Fd may be obtained by combining the linear Darcian and quadratic non-Darcian flow loss equations, as shown in Equation 11,
where
3 Numerical modeling validation
The accuracy of numerical model was adjusted depending on the values of different parameters, which were determined in the previous study by Alrowais et al. (2023a). The comparison in the previous investigation was conducted between the experimental work given by El-Saiad et al. (2021) and the results of the numerical model. According to the previous comparison, there was a difference in the results of relative heading up (hup/H) between the experimental and numerical results attributed to the bio-filter orientation with respect to the direction of flow. The turbulent kinetic energy against time is shown in Figure 4, and it is evident that the 200-second time frame was appropriate for reaching the steady state under various flow conditions and bio-filter configurations (i.e., the shape of bio-filter at the upstream and its U.S. face angle with respect to horizontal direction).
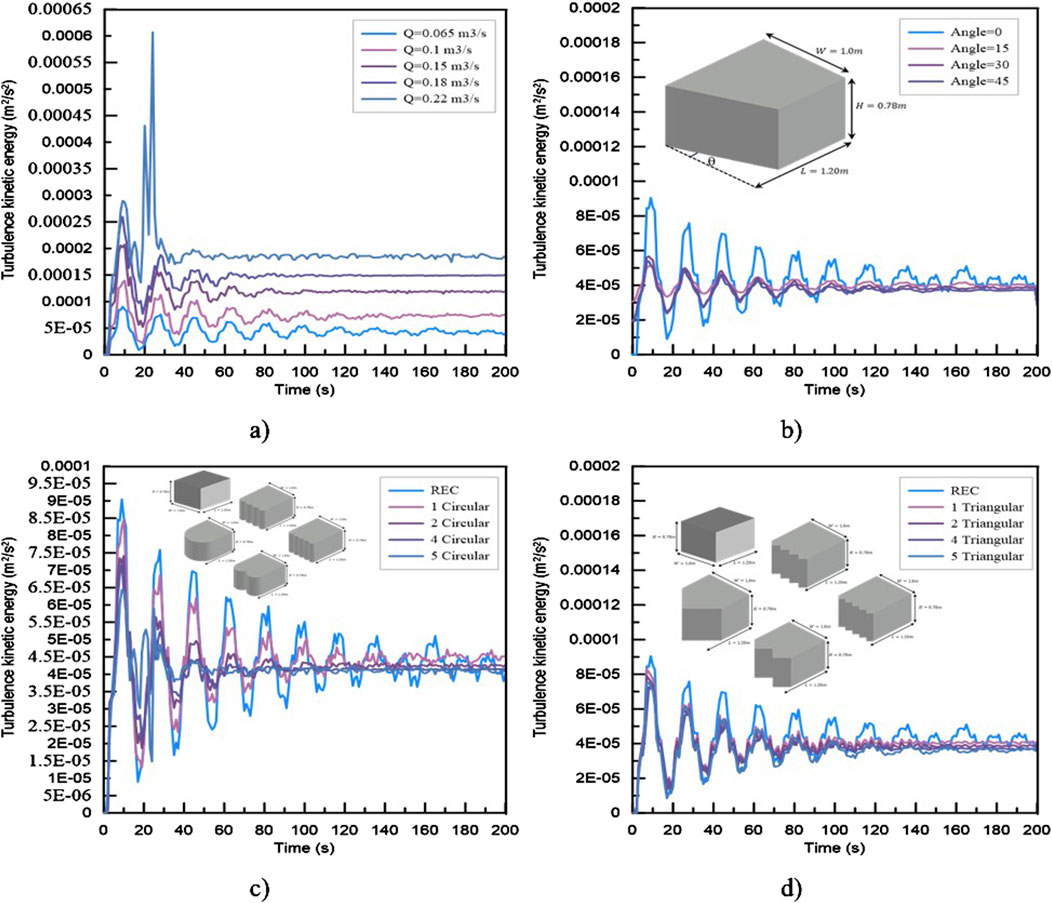
Figure 4. Energy of turbulent flow vs. time, (A) different water flow, (B) different sloped angles with respect to horizontal direction for U.S. face, (C) rounded shape for inlet, and (D) triangular shape for inlet.
4 Results and discussion
The use of bio-filter in watercourses can trigger the occurrence of heading-up due to a sudden contraction in the waterway, which can have significant effects on the surrounding environment. When water passes through a narrow-contracted section of the channel, its velocity increases while the pressure decreases. This sudden change in flow dynamics can lead to a rise in water level upstream of the contraction, known as heading-up. The increased water level can result in flooding of adjacent areas, erosion of banks, and disruption of habitats for aquatic life. Additionally, heading-up can impact structures built near the waterway, such as bridges and culverts, potentially leading to structural damage or failure. Thus, good knowledge and proper design and management of waterway contractions that may be induced from using bio-filters are essential to mitigate the adverse effects of heading-up and ensure the stability and functionality of the surrounding environment. Figure 5 presents the relationship between the relative heading-up (hup/H) and Froude’s number for different inlet configurations of a bio-filter with the same overall length of 1.20 m, which is useful for analyzing the effects of discharge and velocity on the heading-up. Regardless of the inlet configuration, the relative heading-up increases as Froude’s number increases. Moreover, a linear direct proportionality was found for every design of bio-filter. The bio-filter was perceived as an unforeseen impediment in the water flow channel that slowed the water’s passage past it, which could account for the observed increase in velocity. As a result, the heading-up developed, and the amount of water accumulated in front of the bio-filter grew as the flow velocity rose. Additionally, Froude’s number was directly correlated with flow velocity, meaning that as Froude’s number rose, so did the heading up. Moreover, when the discharge grew, so did the velocity and Froude’s number, which ultimately caused the relative heading to increase. It was also evident that the relative heading-up of the basic bio-filter (i.e., rectangular bio-filter inlet shape) with 1.20 m in length had the maximum value of heading up when it was at the same value as Froude’s number for other inlet shapes. Through changing the shape of the bio-filter inlet to be rounded, sloping U.S. face with respect to horizontal direction, and triangular with the same overall length, the value of the relative heading up dramatically lowered. For instance, the relative heading-up values for a Froude’s number of 0.1 were 0.0710, 0.0778, 0.0811, and 0.0871, which corresponded to bio-filters with the following shapes: triangular, 45° Hl angle (i.e., sloped U.S. face by 45° with respect to horizontal direction), rounded, and basic, respectively. When a 45° Hl angle was used in place of a triangular shape for the bio-filter inlet, the rate of increase in the relative heading up was 10.32%. The rate of increase was 24.67% when the bio-filter’s rounded inlet was used instead of a triangular one, and the increase ratio was 31.86% when a basic bio-filter was used instead of a triangle one. It is possible to draw the conclusion that a triangle bio-filter inlet was hydraulically better than one with a basic bio-filter, rounded, or a sloped U.S. face with respect to horizontal direction of the same length. The water surface profiles of the various bio-filters are displayed in Figure 6. The basic bio-filter inlet had the highest heading-up value, followed by the rounded, 45° Hl angle, and then the triangular shape of the bio-filter inlet, which supported the earlier finding. Additionally, the heading-up and its induced back water curve disappeared at a distance of around 4.0 m, or almost 3.3 times the length of the bio-filter that was being employed.
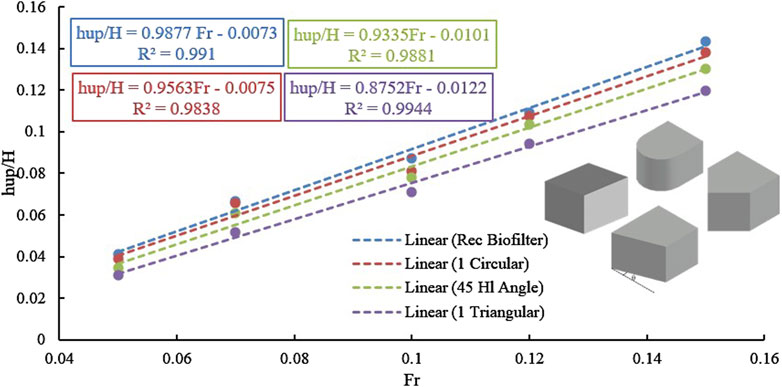
Figure 5. Relative heading-up with different Froude’s numbers.
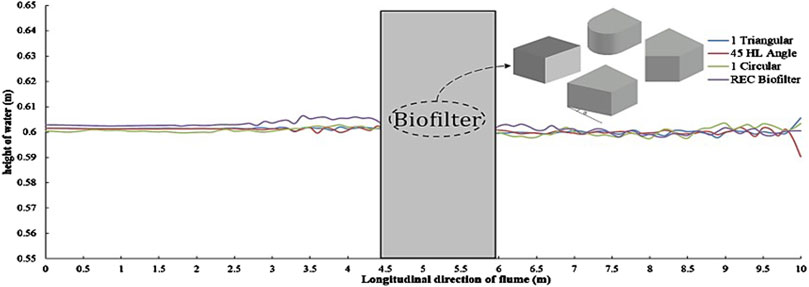
Figure 6. Surface water profile at a time of 200 s at Fr = 0.05.
Figure 7 illustrates the relationship between the bio-filter’s relative heading-up and its triangular inlet shape. The bio-filter and its total length of 1.20 m are both at the same Froude’s number. When the number of triangular shapes in the bio-filter inlet increase, the relative heading-up increases linearly. Additionally, at the same 1.2 m bio-filter length, Figure 8 shows the relative heading-up against the rounded shapes of the bio-filter inlet. When the number of rounded shapes in the bio-filter inlet increase, the relative heading-up increases linearly. Using a large number of any shape (i.e., triangular or rounded) at the inlet of the bio-filter makes the bio-filter near to rectangular shape, which causes the bio-filter’s length to increase and its flow velocity to decrease. This can be explained as follows: Darcy’s law, which governs flow through porous media, states that as the length of the bio-filter segment increases, the velocity through it decreases. Velocity is directly proportional to the hydraulic gradient, which in turn is inversely proportional to the length. Consequently, the velocity through the bio-filter media decreases as the length increases. Thus, extending the length of the bio-filter results in a longer obstacle, leading to higher heading-up values being triggered.
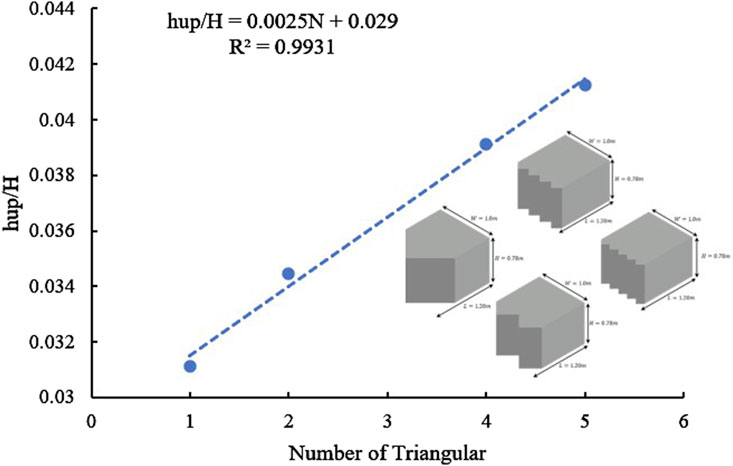
Figure 7. Variation in the number of triangles forming the bio-filter inlet in relation to the relative heading-up at Fr = 0.05.
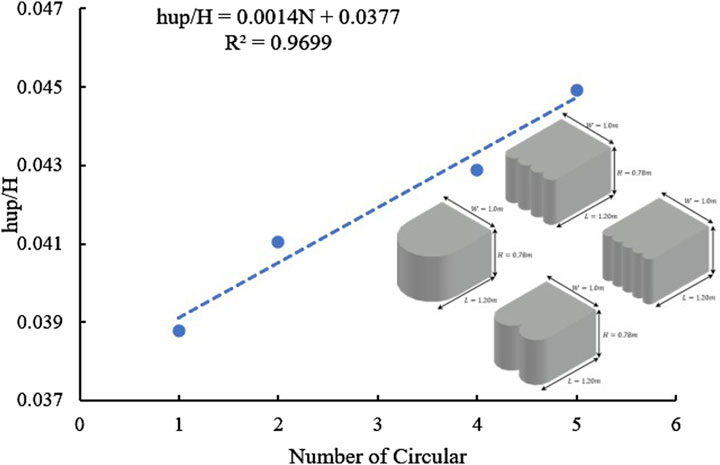
Figure 8. The bio-filter intake has a different quantity of rounded shapes compared to a relative heading-up at Fr = 0.05.
Figure 9 shows the correlation between the incline angles of the U.S. face of the bio-filter in relation to the horizontal direction and the relative heading-up is shown. This study analyzed four different angles. The results showed that as the incline angle increased, the heading-up decreased. The angle of 45° had the smallest relative heading-up value, followed by 30°, 15°, and 0°. This can be attributed to the inclined bio-filter face, in which the inclined face leads to a decrease in the length of the bio-filter from one edge so that the velocity of flow is affected lightly, followed by low heading-up values. Low heading up was also caused by the inclined face, which increased the bio-filter face area. Moreover, the relative heading-up values rose at a slower rate as the inclination angle increased. For angles of 0°, 15°, 30°, and 45°, respectively, the relative heading-up values were 0.041, 0.0394, 0.0352, and 0.0343. This indicates that when the inclination angle is 45° HL, the increasing ratios of the relative heading up due to other angles were 2.55%, 14.81%, and 19.53% for angles 30°, 15°, and 0°, respectively.
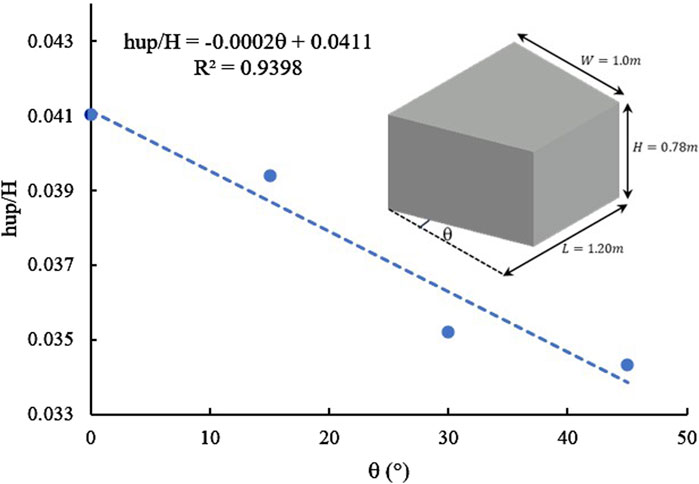
Figure 9. Different U.S. face angles with respect to horizontal direction of bio-filter vs relative heading-up.
Figure 10 illustrates the relationship between the sloping angles of the bio-filter’s U.S. face with respect to the vertical direction and the relative heading-up; in this study, four distinct angles were examined. The heading up decreases as the inclination angle increases. The angle with the least relative heading-up value was 45°, which was followed by 30°, 15°, and 0°. The relative heading-up values decreased as the inclination angle increased. For angles of 0°, 15°, 30°, and 45°, respectively, the relative heading-up values were 0.0411, 0.0399, 0.0393, and 0.0343. This indicates that when the inclination angle is 45° VL, the increasing ratios of the relative heading-up due to other angles were 14.55%, 16.16%, and 19.78% for angles 30°, 15°, and 0°, respectively. Evidently, the bio-filter’s up-stream face’s sloping angles responded similarly in both horizontal and vertical directions, with the relative heading-up. Where, as the angle increased, the heading-up values decreased. The vertical face angle of 0° exhibited the highest relative heading-up value, followed by 15°, 30°, and lastly 45°. This can be attributed to the increased area of the inclined bio-filter face, where the length of the inclined section increases as the angle of inclination increases, this matches closely with (Zayed et al., 2018) and (Braschi et al., 2022). However, the sloping angle of 30° with respect to the horizontal direction was more effective than that of with respect to the vertical direction (Alrowais et al., 2023a).
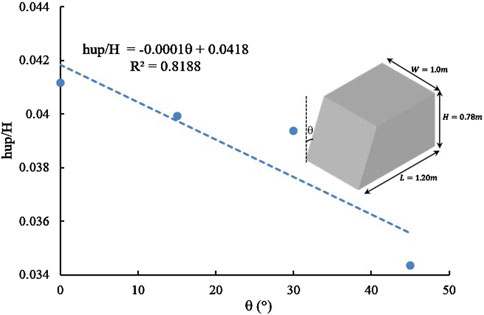
Figure 10. Different U.S. face angles with respect to vertical direction of bio-filter vs relative heading-up.
In the experimental study implemented by El-Saiad et al. (2021), a bio-filter with a star-shaped medium, 87% porosity, and a length of 1.20 m was examined, yielding a relative heading-up (hup/H) of 0.1025. In contrast, our current research utilized a porous media with 39% porosity and varied the incline angles of the upstream (U.S.) face. Adjusting these angles in both directions significantly reduced the relative heading-up compared to a straight face (i.e., 0° inclination in both vertical and horizontal directions). This is clear when comparing the 0° relative heading-up in our study (0.0411) with that by El-Saiad et al. (2021). The higher heading-up in their experiment is likely due to the orientation of the star-shaped medium. The increase in relative heading-up observed with rising Froude numbers, regardless of the bio-filter inlet shape, is consistent with previous research, which has emphasized the correlation between flow velocity and hydraulic behavior in bio-reactor systems El-Saiad et al. (2021); Alrowais et al. (2023a). One of the key contributions of this research is the identification of the impact of bio-filter inlet shapes on hydraulic performance, where triangular configurations consistently outperformed, rounded, and sloped U.S. face. This offers valuable insight into the design of bio-reactors, particularly for applications in open water channels, and reinforces the importance of customized configurations based on specific flow conditions. Moreover, the study highlights the role of bio-filter length and shape in controlling flow dynamics, especially in minimizing backwater effects that could lead to upstream flooding and habitat disruption. The results suggest that by optimizing the bio-filter’s geometric design, it is possible to reduce these risks while enhancing water purification efficiency. Future studies could explore the integration of more complex bio-filter materials and configurations, as well as long-term field trials to assess performance under varied environmental conditions. In conclusion, this research underscores the importance of hydraulic considerations in bio-filter design and highlights potential pathways for enhancing the self-purification capacity of contaminated watercourses in agricultural settings.
5 Conclusion
Considering global climate change and the triggered water scarcity, unconventional water resource management has gained significant importance. Recycling agricultural drainage water is increasingly recognized as a viable solution for addressing water scarcity in regions with limited water resources. However, agricultural drains often contain pollutants, rendering the water unsuitable for direct use and necessitating treatment to meet international standards. The following main findings can be concluded from this study:
1. The relative heading-up increased as the Froude number increased, irrespective of the shape of the bio-filter inlet. This indicates that as the velocity and discharge of flow increases, so does the relative heading-up. The value of heading-up reduced dramatically when the shape of the bio-filter inlet was changed (basic shape, rounded, sloping U.S face with respect to horizontal or vertical direction, and triangular shapes) while keeping the overall length same.
2. Using a basic bio-filter, rounded, or sloped U.S face 45° VL and 45° HL instead of a triangular shape resulted in a 31.86%, 24.67%, 10.44%, and 10.32% increase in relative heading-up values. This confirms that changing the bio-filter inlet shape was hydraulically better than using a basic shape of the same length. When the number of triangular shapes in the bio-filter inlet increase, the relative heading-up linearly increases.
3. For a specific bio-filter length, the relative heading-up increased linearly with the number of rounded shapes in the bio-filter inlet. The inclination angle of 0° (i.e., basic shape of bio-filter) had the highest relative heading-up value, followed by the 15° angle, 30° angle, and 45° angle in both directions, vertical and horizontal. This can be attributed to the inclined bio-filter face, which leads to a decrease in the length of the bio-filter from one edge so that the velocity of flow is affected lightly, followed by low heading-up values, in addition to increasing of the bio-filter’s face area subjected to the flow. However, as the U.S sloped angle increased, the rate of rise in relative heading-up values decreased. It indicates that the smaller the inclination angle of the bio-filter’s face, the higher the heading-up and vice versa.
However, future studies are urgently needed and should focus on experimental investigations exploring alternative bio-reactor configurations for optimal hydraulic performance and pollutant removal. Additionally, research should examine the impact of different pollutant concentrations on bio-reactor efficiency and assess the effectiveness of various porous, environmentally friendly materials for bio-filters. These materials could be reused after contaminant absorption, potentially generating energy or organic power, thus enhancing the sustainability of the water treatment process.
Data availability statement
The data analyzed in this study is subject to the following licenses/restrictions: restrictions will added by RA, cm5hbHJvd2Fpc0BqdS5lZHUuc2E=. Requests to access these datasets should be directed to RA, cm5hbHJvd2Fpc0BqdS5lZHUuc2E=.
Author contributions
RA: Conceptualization, Formal Analysis, Funding acquisition, Validation, Writing–original draft. AJ: Conceptualization, Data curation, Methodology, Software, Validation, Writing–original draft, Writing–review and editing. MB: Conceptualization, Formal Analysis, Resources, Writing–review and editing. MA: Conceptualization, Formal Analysis, Writing–review and editing, Data curation, Methodology, Validation. BA: Conceptualization, Methodology, Validation, Writing–original draft, Writing–review and editing. EE: Conceptualization, Methodology, Resources, Validation, Visualization, Writing–original draft, Writing–review and editing.
Funding
The author(s) declare that financial support was received for the research, authorship, and/or publication of this article. This work was funded by the Deanship of Graduate Studies and Scientific Research at Jouf University under grant No. (DGSSR-2023-02-02227).
Conflict of interest
Author EE was employed by Abaalkhail Consulting Engineering Co.
The remaining authors declare that the research was conducted in the absence of any commercial or financial relationships that could be construed as a potential conflict of interest.
Generative AI statement
The author(s) declare that no Generative AI was used in the creation of this manuscript.
Publisher’s note
All claims expressed in this article are solely those of the authors and do not necessarily represent those of their affiliated organizations, or those of the publisher, the editors and the reviewers. Any product that may be evaluated in this article, or claim that may be made by its manufacturer, is not guaranteed or endorsed by the publisher.
References
Abdel Daiem, M. M., Hatata, A., El-Gohary, E. H., Abd-Elhamid, H. F., and Said, N. (2021). Application of an artificial neural network for the improvement of agricultural drainage water quality using a submerged biofilter. Environ. Sci. Pollut. Res. 28, 5854–5866. doi:10.1007/s11356-020-10964-0
Abd-Elhamid, H. F., El-Saiad, A. A., Salama, Z. I., Zeleňáková, M., and El-Gohary, E. H. (2022). Evaluating the hydraulic effects of the flow through and over the submerged biofilter installed in polluted streams. Int. J. Environ. Res. Public Health 19, 10324. doi:10.3390/ijerph191610324
Alemi, M., and Maia, R. (2018). Numerical simulation of the flow and local scour process around single and complex bridge piers. Int. J. Civ. Eng. 16, 475–487. doi:10.1007/s40999-016-0137-8
Aljubiri, S. M., Younes, A. A., Alosaimi, E. H., Abdel Daiem, M. M., Abdel-Salam, E. T., and El-Shwiniy, W. H. (2024). Recycling of sewage sludge: synthesis and application of sludge-based activated carbon in the efficient removal of cadmium (II) and lead (II) from wastewater. Int. J. Mol. Sci. 25 (18), 9866. doi:10.3390/ijms25189866
Alrowais, R., Abdel Daiem, M. M., Nasef, B. M., and Said, N. (2023c). Activated carbon fabricated from biomass for adsorption/bio-adsorption of 2, 4-D and MCPA: kinetics, isotherms, and artificial neural network modeling. Sustainability 16 (1), 299. doi:10.3390/su16010299
Alrowais, R., Bashir, M. T., Khan, A. A., Bashir, M., Abbas, I., and Abdel Daiem, M. M. (2024b). Adsorption and kinetics modelling for chromium (Cr6+) uptake from contaminated water by quaternized date palm waste. Water 16 (2), 294. doi:10.3390/w16020294
Alrowais, R., Ibrahim, E. S., El-Hefny, D. E., Helmy, R., Yousef, R. S., Mottaleb, S. A., et al. (2024a). Removal of cyantraniliprole from aquatic environments by chlamydomonas reinhardtii. BioResources 19 (3), 6653–6669. doi:10.15376/biores.19.3.6653-6669
Alrowais, R., Jatwary, A., Abdel daiem, M. M., Ghazy, A., Alwushayh, B., Akrami, M., et al. (2023a). Numerical investigation of the hydraulic impacts induced by a bioreactor installed in a contaminated waterway. Water 15, 117. doi:10.3390/w15010117
Alrowais, R., Yousef, R. S., Ahmed, O. k., Mahmoud-Aly, M., Abdel daiem, M. M., and Said, N. (2023b). Enhanced detoxification methods for the safe reuse of treated olive mill wastewater in irrigation. Environ. Sci. Eur. 35, 95. doi:10.1186/s12302-023-00797-2
Braschi, I., Blasioli, S., Lavrnić, S., Buscaroli, E., Di Prodi, K., Solimando, D., et al. (2022). Removal and fate of pesticides in a farm constructed wetland for agricultural drainage water treatment under Mediterranean conditions (Italy). Environ. Sci. Pollut. Res. 29 (5), 7283–7299. doi:10.1007/s11356-021-16033-4
Burgan, H. I. (2021). Numerical modeling of structural irregularities on unsymmetrical buildings. Teh. Vjesn. 28 (3), 856–861. doi:10.17559/TV-20200328103359
Çinar, Ö., Hasar, H., and Kinaci, C. (2006). Modeling of submerged membrane bioreactor treating cheese whey wastewater by artificial neural network. J. Biotechnol. 123 (2), 204–209. doi:10.1016/j.jbiotec.2005.11.002
El-Agha, D. E., Molden, D. J., and Ghanem, A. M. (2011). Performance assessment of irrigation water management in old lands of the Nile delta of Egypt. Irrigation Drainage Syst. 25, 215–236. doi:10.1007/s10795-011-9116-z
Elkamhawy, E., Zelenakova, M., and Abd-Elaty, I. (2021). Numerical canal seepage loss evaluation for different lining and crack techniques in arid and semi-arid regions: a case study of the river Nile, Egypt. Water 13 (21), 3135. doi:10.3390/w13213135
El Monayeri, D. S., Atta, N. N., El Mokadem, S., and Aboul-Fotoh, A. M. (2007). “Effect of organic loading rate and temperature on the performance of horizontal biofilters,” in Proceedings of eleventh international water technology conference, 671–682.
El-Saiad, A. A., Abd-Elhamid, H. F., Salama, Z. I., Zeleňáková, M., Weiss, E., and El-Gohary, E. H. (2021). Improving the hydraulic effects resulting from the use of a submerged biofiter to enhance water quality in polluted streams. Int. J. Environ. Res. Public Health 18, 12351. doi:10.3390/ijerph182312351
El-Shatoury, S., El-Baz, A., Daiem, M. A., and El-Monayeri, D. (2014). Enhancing wastewater treatment by commercial and native microbial Inocula with factorial design. Life Sci. J. 11 (7), 736–742.
Fan, M., Hu, J., Cao, R., Ruan, W., and Wei, X. (2018). A review on experimental design for pollutants removal in water treatment with the aid of artificial intelligence. Chemosphere 200, 330–343. doi:10.1016/j.chemosphere.2018.02.111
FLOW-3D (2025). FLOW-3D. Version 11.1.1 flow science, I., santa Fe, NM. Available at: https://www.flow3d.com/ (Accessed March 27, 2024).
Hirt, C. W., and Nichols, B. D. (1981). Volume of fluid (VOF) method for the dynamics of free boundaries. J. Comput. Phys. 39 (1), 201–225. doi:10.1016/0021-9991(81)90145-5
Liu, J., Liu, L., Huang, Z., Fu, Y., and Huang, Z. (2020). Contaminant removal and optimal operation of bio-slow sand filtration water treatment based on nature-based solutions. Pol. J. Environ. Stud. 29 (2), 1703–1713. doi:10.15244/pjoes/109728
Md Anawar, H., and Chowdhury, R. (2020). Remediation of polluted river water by biological, chemical, ecological and engineering processes. Sustainability 12 (17), 7017. doi:10.3390/su12177017
National Research Council (1999). “Division on earth, life studies, commission on geosciences,” in Identifying future drinking water contaminants. Washington, DC: National Academies Press.
Ramírez-Baca, N., Saucedo-Terán, R., Manzanares-Papayanopoulos, L. I., Carrazco-Palafox, J., and Nevárez-Moorillón, G. V. (2005). Treatment for small polluted rivers: design and performance of an experimental structure. Water sa. 31 (1), 101–106. doi:10.4314/wsa.v31i1.5126
Saravanan, A., Kumar, P. S., Jeevanantham, S., Karishma, S., Tajsabreen, B., Yaashikaa, P. R., et al. (2021). Effective water/wastewater treatment methodologies for toxic pollutants removal: processes and applications towards sustainable development. Chemosphere 280, 130595. doi:10.1016/j.chemosphere.2021.130595
Tao, Z., Han, L. H., Uy, B., and Chen, X. (2011). Post-fire bond between the steel tube and concrete in concrete-filled steel tubular columns. J. Constr. Steel Res. 67 (3), 484–496. doi:10.1016/j.jcsr.2010.09.006
Keywords: sustainability, bioreactor, self-purification, hydraulic characteristics, bio-filter
Citation: Alrowais R, Jatwary A, Bindzarova Gergelova M, Akrami M, Alwushayh B and Elkamhawy E (2025) Influence of bio-filter configurations on hydraulic aspects while enhancing the sustainable self-purification of agricultural drainage water. Front. Environ. Sci. 13:1515879. doi: 10.3389/fenvs.2025.1515879
Received: 23 October 2024; Accepted: 07 January 2025;
Published: 29 January 2025.
Edited by:
Ionut Minea, Alexandru Ioan Cuza University, RomaniaReviewed by:
Ahmed El-Shafei, Alexandria University, EgyptHalil Ibrahim Burgan, Akdeniz University, Türkiye
Copyright © 2025 Alrowais, Jatwary, Bindzarova Gergelova, Akrami, Alwushayh and Elkamhawy. This is an open-access article distributed under the terms of the Creative Commons Attribution License (CC BY). The use, distribution or reproduction in other forums is permitted, provided the original author(s) and the copyright owner(s) are credited and that the original publication in this journal is cited, in accordance with accepted academic practice. No use, distribution or reproduction is permitted which does not comply with these terms.
*Correspondence: Raid Alrowais, cm5hbHJvd2Fpc0BqdS5lZHUuc2E=; Marcela Bindzarova Gergelova, bWFyY2VsYS5iaW5kemFyb3ZhLmdlcmdlbG92YUB0dWtlLnNr