 Jixuan Yan1*
 Jie Li1Xiangdong Yao1
 Qiang Li1Zhiqin Zheng1Guang Li2Guangping Qi1Weiwei Ma1Miao Song1Pengcheng Gao1
- 1College of Water Conservancy and Hydropower Engineering, Gansu Agricultural University, Lanzhou, China
- 2College of Forestry, Gansu Agricultural University, Lanzhou, China
The Yellow River Basin is one of the most ecologically fragile zones in China. Landscape ecological risk assessment and ecological security pattern construction are effective ways to find out and solve the problems of the ecological environment in this region. In this study, based on LUCC and driving factor data, we evaluated the spatial distribution characteristics of landscape ecological risk from the grid scale using the ecological risk index (ERI) and minimum cumulative resistance (MCR) models, especially proposing a new method for constructing the ecological security pattern from the perspective of landscape ecological risk assessment and finally forming an ecological security pattern network composed of points, lines, and surfaces. The results indicated that the ecological risk of the Yellow River basin showed a spatial distribution pattern of “High in southwest and northwest, low in other regions.” The middle–low level ecological risk accounted for more than 86% of the total area. The study has formed an ecological security pattern network consisting of 12 core ecological sources, 92 ecological nodes, 12 key corridors, 16 auxiliary corridors, and 4 different controlled areas. According to these study findings, we provide ecological protection strategies that strengthen the ecological source conservation, attaching importance to the construction of ecological corridor, increasing the restoration of ecological nodes, and carrying out the zoning regulation. This study will provide a new insight for the construction of the ecological security pattern network based on the results of landscape ecological risk assessment.
1 Introduction
As an important part of national security, ecological security is an important bridge connecting the integrity of ecosystems and sustainable development of human beings. It is also an important guarantee for maintaining social stability, political security, and economic security (Xie and Li, 2004). In recent years, with the global climate change and the increasing interference of human activities, the contradiction between resources, environment, and land use is becoming increasingly sharp. Ecological problems such as fragile ecological environments, water resource shortage, soil erosion, and flood disasters have become increasingly prominent (Wang et al., 2008). Therefore, a scientific understanding of landscape ecological risk and ecological security patterns in the Yellow River basin is an important prerequisite for comprehensively improving the ecological security level of the Yellow River Basin, and it is also a necessary way to achieve high-quality development of the Yellow River Basin (Gao et al., 2008).
In recent years, landscape ecological risk assessment has become one of the hot spots in fields of environmental science and ecology. In the early stage, the risk source–sink model of “risk source analysis-receptor recognition-exposure and hazard assessment-risk characterization” was used to assess ecological risk, mainly focusing on specific pollution sources such as heavy metal pollution, soil erosion, floods, and droughts, which leads to blurred research results (Li et al., 2008; Peng et al., 2015). Currently, landscape ecological risk assessment based on LUCC refers to the possible negative impact of landscape patterns and ecological processes under the interference of natural or human factors, reflecting landscape anti-interference ability through the ecosystem service level. Compared with the traditional evaluation, it pays more attention to landscape element mosaic, landscape pattern evolution, and landscape ecological process. It can better represent the spatio-temporal heterogeneity of landscape pattern and ecological process, as well as providing a scientific basis for regional ecological risk prediction and prevention, landscape pattern supervision, and optimization. It has gradually become the mainstream of ecological risk research, but there are relatively few evaluations of the Yellow River Basin. However, the evaluation of the Yellow River Basin is relatively less (Zhu et al., 2013; Sheng et al., 2022). The Yellow River is not only the mother river of China but also the river of life for sustainable development of the Chinese civilization, which plays an important role in the national social economy. At present, the problems in the Yellow River Basin are mainly flood and drought disasters, water resource shortage, water-sediment aberration, sediment reduction, suspended river cutoffs, and the interwoven environment and ecology, which restricts the coordinated development of economic society and ecological environment (Xiao, 2021).
The landscape ecological risk assessment of the Yellow River Basin serves as a realistic basis for the construction of the ecological security pattern. The construction of the ecological security pattern is an effective way to restore and maintain the ecological environment of river basins (Peng et al., 2017). In the construction of the ecological security pattern, the research mode of the source–resistance surface–ecological corridor node–ecological security pattern has been initially formed. In addition, an attempt was made to bridge the gap between landscape ecological risk and ecological security pattern construction (Xu et al., 2015). Pan and Liu (2016) used the MCR model to select the ecological security level, elevation, and slope to construct the resistance surface. The optimized ecological security network of the Shule River basin was established (Pan and Liu, 2016). Yu et al. (2022) selected landscape ERI, vegetation coverage, elevation, slope, and distance from road and water system to construct the resistance surface and ecological security pattern. Li et al. (2019) constructed a landscape ecological evaluation based on the dimension of “nature-human society-landscape pattern.” Based on the evaluation results, the landscape pattern of the Ningjiang River basin was optimized (Li et al., 2019). From this point of view, the general idea of using the MCR model to construct the resistance surface, determining the source, and constructing the ecological security pattern based on the results of ecological sensitivity evaluation has been basically formed. However, there are relatively few studies on how to scientifically identify ecological sources, ecological corridors, and ecological nodes and then construct ecological resistance surfaces, divide ecological functional areas, and construct ecological security patterns from the perspective of landscape ecological risk assessment.
Therefore, this study takes the Yellow River basin as the research object. Based on 2020 LUCC and driving factor data, landscape ecological risk was evaluated, and the ecological security pattern was constructed. It provides scientific guidance for regional ecological environment construction and risk prevention. The specific objectives of this study are as follows: 1) the ERI model was combined to evaluate landscape ecological risk from the grid scale. 2) Based on the results of landscape ecological risk assessment, the MCR model was used to construct the ecological security pattern and carry out the ecological restoration zoning of land space. 3) The ecological security protection strategy was put forward.
2 Materials and methods
2.1 Overview of the study area
The Yellow River Basin flows through nine provinces (regions), covering an area of approximately 790,000 km2 (Figure 1), in the middle latitude zone. The climate distribution is significantly different, with an average annual precipitation of 447 mm, which is far lower than the national average of 628 mm. The precipitation in the flood season accounts for more than 60% of the annual precipitation, the annual evapotranspiration is 300∼700 mm, and the average annual temperature is −3.4∼14.8°C, including arid, semi-arid, and semi-humid areas, with more hail, sandstorm, and other weather conditions. The elevation gradually decreases from northwest to southeast. The upper reaches are dominated by mountains, and the lower reaches are dominated by plains and hills (Liu et al., 2008). The Yellow River Basin is an ecological corridor connecting the Qinghai–Tibet Plateau, the Loess Plateau, and the North China Plain. It is also an important link for covering and radiating the economic and social development of the eastern, central, and western provinces. Maintaining the health of the Yellow River plays a very important role in national economic and social development and ecological security (Cong et al., 2009). The Yellow River is the river with the largest sediment concentration in the world. Soil erosion is a severe concern in the basin, and the ecosystem is fragile. It is also one of the regions with the strongest human activities in the world (Chen et al., 2005).
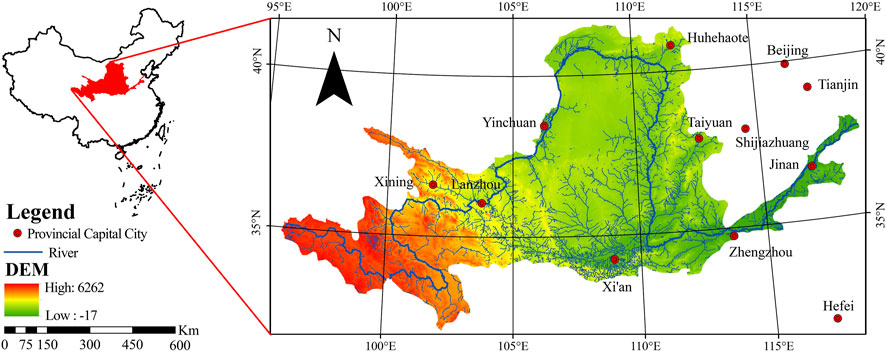
Figure 1. Location of the study area.
2.2 Data sources
The data collected in this study include the following: 1) LUCC data in 2020: from the website of National Geographic Information Resources Directory Service System (https://www.webmap.cn). 2) Driving factor data: including terrain factors (DEM and slope), climatic factors (temperature and precipitation), socioeconomic factors (population and GDP), and distance factors (distance from road and distance from habitation). The data of these driving factors were obtained from the website of the Resource and Environmental Science Data Center (http://www.resdc.cn).
2.3 Landscape ecological risk assessment model
The LUCC type in 2020 is the landscape component type. The Yellow River Basin was divided into 3,868 grids via ArcGIS. The landscape ERI of each grid was calculated by using the landscape structure index, the landscape vulnerability index, and the area proportion of each landscape component type in the grid (Zhang et al., 2012). Formula 1 is given as follows:
where
where
2.4 Ecological security pattern construction
2.4.1 Identification of core ecological source
The average value of the landscape integral index of connectivity (IIC) and the probability index of connectivity (PC) is taken as the importance indicators to measure the ecological source of the Yellow River Basin, and the ecological source with high connectivity is taken as the core ecological source of the Yellow River Basin (Urban and Keitt, 2001). Formulas 3, 4 are represented as
where n is the number of patches,
2.4.2 Ecological resistance surface and MCR value calculation
According to the research results of landscape ecological risk assessment, the ecological resistance surface index system was constructed by choosing the landscape ecological risk index and key driving factors, and the weight of each factor was calculated using the coefficient of the variation method. The spatial distribution data of the ecological resistance surface were obtained by grid operation according to the weight value of each factor through the grid calculator function in the ArcGIS spatial analysis tool. Based on the core ecological source and ecological resistance surface, the ArcGIS cost distance tool was used to calculate the minimum cumulative resistance surface.
2.4.3 Ecological corridor and ecological node extraction
Based on the spatial distribution data of the centroid, the ecological resistance surface, and the minimum cumulative resistance surface of the core ecological sources, the MCR model was used to extract information on the ecological corridors between the ecological sources. By using the ArcGIS hydrological analysis tool, the intersection point of the “valley line” with low resistance value distribution of minimum cumulative resistance surface and ecological corridor was determined as an ecological node, and the number of ecological nodes exceeding 4 was classified as a key corridor, and the number less than or equal to 4 was classified as an auxiliary corridor (Liu et al., 2010). The minimum cumulative resistance model can be realized using the ArcGIS tool, and the calculation formula is Equation 5:
where
2.4.4 Ecological security control area division
Taking full account of the ecological resistance value and the important ecological status of the core ecological source, ecological corridor, and ecological node, the ecological security control zoning of the study area was divided into the key controlled area, strictly controlled area, general controlled area, and non-key controlled area.
2.4.5 Construction of the ecological security pattern
According to the ecological security pattern elements and the MCR model, the important ecological functions of “point - core ecological source, ecological node, line - key corridor, auxiliary corridor, surface - key control area, strict control area, general control area and non-key control area” were extracted to form the ecological security pattern of the Yellow River Basin.
3 Results
3.1 Landscape ecological risk assessment
The landscape ERI of the Yellow River Basin was divided into five grades by using Kriging interpolation and the natural breakpoint method of ArcGIS: highest risk (ERI > 0.20), higher risk (0.16 < ERI ≤ 0.20), middle risk (0.14 < ERI ≤ 0.16), lower risk (0.12 < ERI ≤ 0.14), and lowest risk (ERI ≤ 0.12). The spatial distribution map of ecological risk in the Yellow River basin in 2020 is obtained (Figure 2).
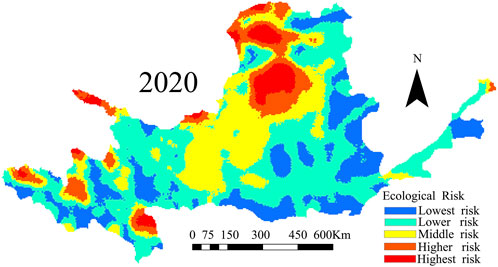
Figure 2. Spatial distribution map of landscape ecological risk in the Yellow River basin.
Figure 2 shows that the ecological risk level of the Yellow River Basin in 2020 is mainly lowest risk, lower risk, and middle risk, accounting for more than 86% of the total area. The spatial distribution of ecological risk in the study area is significantly different, showing a landscape pattern of “high in southwest and northwest , low in other areas.” The lowest-risk areas are concentrated in Shanxi province, Shaanxi province, the southern part of Qinghai province, the junction of the southwestern part of Henan province, and the boundary line of the study area. It is scattered in Jinan city and Zibo city of Shandong province, Baotou city and the central part of Hohhot city of the Inner Mongolia Autonomous Region, and the west of Gannan Prefecture of Gansu Province, the junction of Hainan Prefecture, and Guoluo Prefecture in Qinghai province. The lower-risk areas are concentrated in the western part of Shanxi province and the northern part of Shaanxi province. It is scattered in the junction of Henan province and Shandong province, the junction of Shanxi province and Inner Mongolia Autonomous Region, and the northern part of the junction of Gansu Province and Qinghai Province. The moderate-risk areas are concentrated in all areas of the Ningxia Hui Autonomous Region, the junction of Gansu province and the Ningxia Hui Autonomous Region, and the southeast of Yulin city, Shaanxi Province. The higher-risk areas are concentrated at the junction of the Inner Mongolia Autonomous Region and Shaanxi province, the surrounding areas of Hangjinqi county, and the south of Bayanzhuoer city in the Inner Mongolia Autonomous Region. It is scattered in most areas of Qinghai province. The highest-risk areas are mainly distributed in the southeast of Ordos City and the north of Hangjinqi county in the Inner Mongolia Autonomous Region and the northwest corner of the Ningxia Hui Autonomous Region. It is scattered in the junction of Aba Prefecture in Sichuan province and Gansu province, with distribution in Qumalai County, Yushu Prefecture, Qinghai province, the northwest corner of Xinghai County, Hainan Prefecture, Qinghai province, and the west of Haibei Prefecture, Qinghai province.
3.2 Determination of the core ecological source
According to the data from natural protected areas in the Yellow River Basin, the average value of the landscape integral index of connectivity and connectivity probability index is larger. Twelve national and provincial forest ecological parks, wild plant gardens, desert ecological areas, wildlife parks, and marine coastal zones were selected as the core ecological sources from the types and levels, as shown in Table 1. The total core ecological source area of the Yellow River Basin is 24,540 km2 and accounts for 3.11% of the study area.

Table 1. List of core ecological source patches.
3.3 Constructing ecological resistance surface
Research findings on the spatiotemporal distribution characteristics and key influencing factors of ecological risk, as determined by landscape ecological risk assessment in the Yellow River Basin, combined with the ecological environment quality of the study area, from the five aspects of landscape ecology, terrain factors, climate factors, socio-economic factors, and distance factors. Nine resistance factors including landscape ERI, DEM, slope, temperature, precipitation, population, GDP, distance from road, and distance from habitation were selected. Each resistance factor is divided into five grades and given different resistance values (Table 2). The variation coefficient method was used to determine the weight of each resistance factor, and the grid calculator of ArcGIS was used for multi-factor weighted superposition to obtain the resistance value of ecological resistance surface. The MCR value is calculated by using the cost distance tool of ArcGIS (Figure 3).
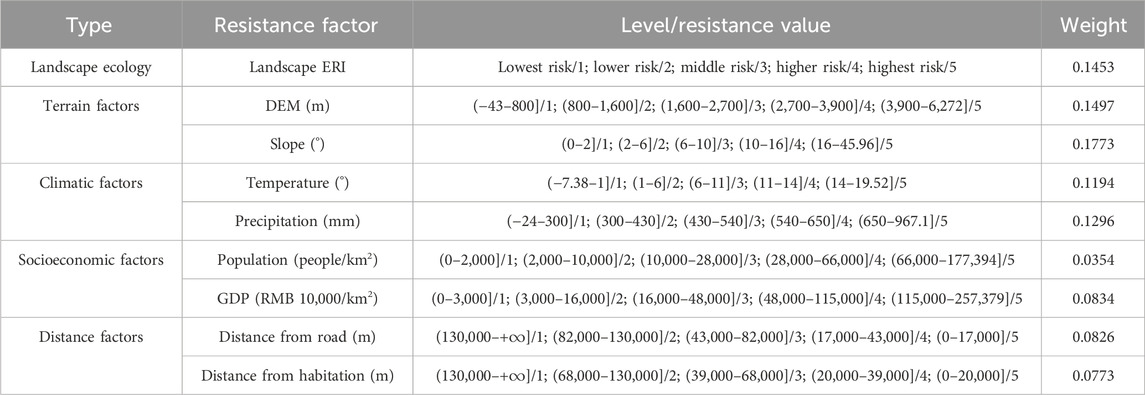
Table 2. Ecological resistance surface evaluation index system.

Figure 3. Ecological resistance surface and MCR value.
It can be seen from Table 2 and Figure 3 that the greater the landscape ERI, the more fragile the landscape and the more unstable the structure. The resistance value of the species increases during the migration process. Terrain factors, climatic factors, and socio-economic factors are proportional to the size of the resistance value. The greater the DEM, slope, temperature, precipitation, population, and GDP, the greater the resistance value. The distance factors include the distance from road and the distance from habitation, which are inversely proportional to the resistance value. The ecological resistance surface of the Yellow River Basin shows a “spatial variation law of increasing from west to east.” The lowest resistance values are mainly distributed in the Qinghai–Tibet Plateau area of the Yellow River Basin. The middle resistance values are mainly distributed in the Loess Plateau and Inner Mongolia Plateau in the Yellow River Basin. The highest resistance values are concentrated in the Huang-Huai Plain area of the Yellow River. The MCR value shows a spatial distribution pattern of “high in the middle and low around.” The MCR values are relatively high in the central part of the Loess Plateau and Shandong province and Henan Province in Huang-Huai Plain.
3.4 Identifying ecological corridors and ecological nodes
The cost path tool of ArcGIS was used to determine the ecological corridor with the core ecological source centroid, ecological resistance surface, and MCR value. Using the hydrological analysis tool of ArcGIS, the “ridge line” of the high resistance value distribution is intersected with the ecological corridor. The intersection point of the lowest and highest resistance paths obtained by ArcGIS is determined as the ecological node. In order to classify the importance of different corridors, the ecological corridors with more than four ecological nodes are defined as key corridors, and the remaining are auxiliary corridors.
After the calculation using ArcGIS software, the distribution map of ecological corridors and ecological nodes in the Yellow River Basin was obtained (Figure 4). The total length of 28 ecological corridors in the Yellow River Basin is 12,828.03 km, of which 12 key corridors are up to 6,842.79 km, accounting for 53.34% of the total length of ecological corridors in the study area. There are 16 auxiliary corridors, with a total length of 5,985.24 km, accounting for 46.66% of the total length of ecological corridors in the study area. The ecological corridors in the whole study area are roughly in the spatial distribution pattern of “three horizontal and three vertical.” The “three horizontal” connect east and west and are distributed along Changsha Gongma alpine wetland ecology and Tibetan wild ass wildlife in Changsha, Sichuan; forest ecology of Taohe River in Gansu province; Shaanxi Zhouzhi golden monkeys and other wild animals and their habitats; Huanglong mountain brown-eared pheasant and its habitat in Yan ’an, Shaanxi; Yellow River estuary wetland and rare and endangered bird ocean coast in Shandong Yellow River Delta, Badain Jaran Desert ecology and lake wetland; desert and wetland ecology of Haba Lake in Yanchi, Ningxia; Heicha Mountain in Shanxi province forest ecology and brown-eared pheasant wild animals, endangered plants such as Tetraena mongolica and desert ecology in western Ordos, Inner Mongolia; and forest ecology of Daqing Mountain in Inner Mongolia. The “three vertical” run through the north and south and are distributed along Badain Jaran Desert ecology and lake wetland; water conservation forest and wild animal forest ecology in Liupan Mountains in Ningxia; Shaanxi Zhouzhi golden monkeys and other wild animals and their habitats, endangered plants such as Tetraena mongolica, and desert ecology in western Ordos, Inner Mongolia; desert and wetland ecology of Haba Lake in Yanchi, Ningxia; Huanglong mountain brown-eared pheasant and its habitat in Yan’an, Shaanxi and Forest ecology of Daqing Mountain in Inner Mongolia; Heicha Mountain in Shanxi province forest ecology and brown-eared pheasant wild animals; Taihang monkey and forest ecology in Henan Province.
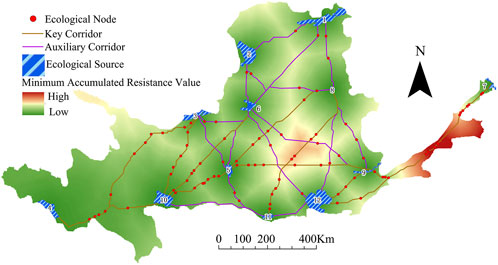
Figure 4. Distribution map of ecological corridors and ecological nodes.
The 92 ecological nodes in the Yellow River Basin generally show the landscape pattern of “more in the south and less in the north, more in the middle and less in the west in spatial distribution. Specifically, it is mainly distributed in Changsha Gongma alpine wetland ecology and Tibetan wild ass wildlife in Changsha, Sichuan; forest ecology of Taohe River in Gansu province; water conservation forest and wild animal forest ecology in Liupan Mountains in Ningxia; Taihang monkey and forest ecology in Henan province, Huanglong mountain brown-eared pheasant and its habitat in Yan’an, Shaanxi; Yellow River estuary wetland and rare and endangered bird ocean coast in Shandong Yellow River Delta, Shaanxi Zhouzhi golden monkeys, and other wild animals and their habitats; Heicha Mountain in Shanxi province forest ecology and brown-eared pheasant wild animals and other key ecological corridors.
3.5 Ecologically controlled zoning
According to the ecological resistance value of the Yellow River Basin, considering the important ecological status of the core ecological source, ecological corridor, and ecological node, the ecological controlled area of the study area is divided into key controlled area, strictly controlled area, general controlled area, and non-key controlled area (Figure 5). We found that the area/proportion of key controlled areas is 228,600 km2/28.94%, which is mainly distributed in most areas of Shandong province, Henan province, Shaanxi province, the southern area of Shanxi province, and the northern area of the Ningxia Hui Autonomous Region. The area/proportion of strictly controlled areas is 367,300 km2/46.49%, which is mainly distributed in most areas of the Inner Mongolia Autonomous Region, Gansu province, the south of the Ningxia Hui Autonomous Region, the northwest of Shaanxi province, and the northeast of Shanxi province. The area/proportion of general controlled areas is 148,900 km2/18.86%, which is mainly distributed in most areas of Qinghai province, southwest of Gansu province, and northeast of Sichuan province. The area/proportion of non-key controlled areas is 46,100 km2/5.83%, which is mainly distributed in the south and west of Qinghai province.
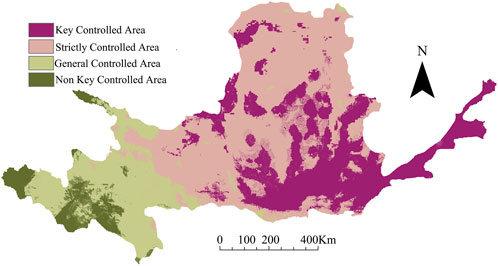
Figure 5. Divided Map of ecologically controlled area.
3.6 Construction of the ecological security pattern in the Yellow River Basin
According to the landscape integral index of connectivity, connectivity probability index, and MCR model analysis, important ecological function “points”—12 core ecological sources and 92 ecological nodes, “lines”—12 key corridors and 16 auxiliary corridors, and “areas”—4 controlled areas, namely, key controlled area, strictly controlled area, general controlled area, and non-key controlled area are extracted, which together constitute the ecological security pattern of the Yellow River Basin (Figure 6).
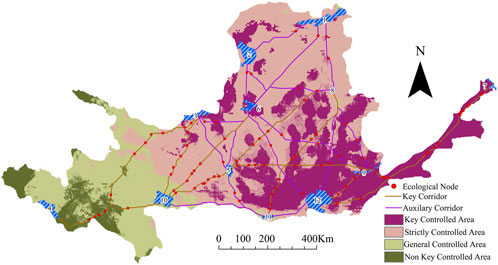
Figure 6. Ecological security pattern of the Yellow River basin.
4 Discussions
4.1 Landscape ecological risk assessment
The Yellow River Basin has a large span, and due to major significant spatial differences in terrain, climate, and socio-economic development, the resulting landscape ecological risk presents a “high in southwest and northwest, low in other areas” spatial landscape pattern (Li et al., 2008; Peng et al., 2015). The lowest-risk area of the Yellow River Basin is dominated by the continuous distribution of forest, with grassland distribution in between, which has a high landscape ecological value. The disturbance degree of human activities is the lowest, the landscape function and structure are relatively stable, and the landscape ecological risk is stable at a low level. In the lower-risk areas of the Yellow River basin, grassland and farmland are mainly interlaced in a large area, with low fragmentation, general patch stability, and wide distribution rage, and the landscape ecological risk is kept at a low level (Yang et al., 2023). The middle-risk areas in the Yellow River basin are interlaced with farmland, urban, and grassland. The patch density is high, there are many human disturbances, and the landscape ecological risk is at a medium level. The higher-risk areas in the Yellow River basin are dominated by the interlaced distribution of bare land and grassland. The vulnerability of bare land is higher, and the patch fragmentation is the larger due to the change in the natural environment, and the landscape ecological risk is at a higher level (Shi et al., 2008). The highest-risk areas in the upper reaches of the Yellow River Basin are mainly distributed in the staggered distribution of forest, grassland, water, and bare land, with serious fragmentation and the larger degree of separation. Its poor resistance to the external environment leads to high ecological risk. The highest-risk areas in the north-central part of the Yellow River Basin are dominated by large areas of bare land. Moreover, the desert in the bare land accounts for a large proportion, and the landscape type is single, with higher fragility and poor stability, and the landscape ecological risk is maintained at a high level (Ayre and Landis, 2012; Yu et al., 2022).
4.2 Constructing the ecological security pattern based on landscape ecological risk assessment results
There is a close relationship between landscape ecological risk assessment and ecological security pattern construction. Ecological risk assessment can provide the direction of ecological security pattern construction. The construction of the ecological security pattern can maintain the integrity of regional ecological structure, restore regional biodiversity, and realize the rational allocation of ecological resources. It is of great significance to improve the level of regional ecological security, stabilize the ecological environment, and promote the harmonious development of man and nature. In the process of constructing ecological security pattern, the accurate definition of the core ecological source, ecological resistance surface, MCR value, ecological corridor, ecological node, and controlled area that constitute the ecological network is the focus of research (Peng et al., 2024; Yu et al., 2022).
This study combined the landscape integral index of connectivity, connectivity probability index, and nature-protected area data to determine the core ecological source, which improved the accuracy of ecological source identification (Li et al., 2004). The construction of an ecological resistance surface considers human factors such as landscape ERI, socio-economic factors, and distance factors. The resistance factor is calculated based on the variation coefficient method instead of simple equal weight superposition. The combination of qualitative and quantitative improves the scientificity and accuracy of the construction of the ecological resistance surface (Yuan et al., 2023; Ye et al., 2015). The areas with higher MCR values are the central parts of the Loess Plateau, as well as Shandong province and Henan province in the Huang-Huai Plain; it is mainly due to the high terrain of the Loess Plateau, less precipitation, and serious soil erosion. The Huang-Huai Plain is composed of alluvial plains. The river is suspended above the ground, and the flood threat is large. The landscape ecological risk in this area is high, resulting in a large MCR value. The ecological corridor is a strip area connecting the material flow, energy flow, and species flow of the ecological source. The ecological corridor extracted in this study showed a spatial distribution pattern of “three horizontal and three vertical.” Structurally, it connects the main nature reserves in the upper, middle, and lower reaches of the Yellow River basin, which reflects the important ecological strategic role of the Yellow River in the study area. The enhancement of the ecological quality of the basin should focus on the areas with the Yellow River as the center radiating outward (Zheng et al., 2019). The ecological node is an important node in the ecological flow. Analyzing the land cover-type composition of the ecological node is conducive to further optimizing the ecological security pattern. On the whole, the ecological nodes in the Yellow River basin show a distribution pattern of “more in the south and less in the north, more in the middle and less in the west.” Most of them are concentrated in areas with poor vegetation conditions such as naked land, bare rock, and low coverage grassland. We should minimize the interference of human activities as far as possible in the vicinity of ecological nodes and promote the natural restoration of vegetation (Yu et al., 2018). The division of ecological controlled areas takes into account the size of ecological resistance values, as well as the important ecological status of core ecological sources, ecological corridors, and ecological nodes, which improves the rationality and scientificity of the division of ecological controlled areas (Peng et al., 2017).
4.3 Ecological security protection strategy
Based on the natural landscape characteristics of the Yellow River Basin, combined with the core ecological sources, ecological corridors, ecological nodes, and controlled zoning of the Yellow River Basin, the ecological security protection strategy is proposed on the basis of the existing pattern:
(1) Strengthen the protection of ecological sources. First of all, the large-scale landscape land types such as forest and water in the study area are important ecological sources, and they should be strictly controlled by adhering to the principle of ecological priority. Then, the ecological source should be protected at different levels, including primary and secondary levels and stages. We should reasonably control the excessive impact of human activities such as urban development on the ecological environment, make full use of the self-repair ability of the ecosystem and people’s subjective initiative, and focus on the protection of the core ecological source. Finally, it is necessary to plan and construct a new ecological source. Through the construction of key protected areas and artificial afforestation, the unreasonable spatial distribution of regional ecological sources has been changed, enlarging the quantity and quality of core ecological sources to ensure that ecological sources can improve the function of regional ecosystems (Sun et al., 2012).
(2) Pay attention to the construction of ecological corridor. First of all, we must focus on the protection of key corridors and focus on the construction of key corridors for important woodlands and wetlands in the study area. The construction of landscape land types should be expanded in areas with larger ecological resistance values so as to improve the service value of the ecosystem and ensure the skeleton function of key corridors. Then, it is necessary to ensure that the auxiliary corridors complement and enhance the key corridors. Strengthen the construction and repair of auxiliary corridors to avoid the fracture of auxiliary corridors caused by human activities. Finally, we should highlight the key points, construct and optimize ecological corridors step by step, and ensure the stability of the ecological security pattern (Zhao, 2013).
(3) Strengthen the restoration of ecological nodes. First of all, the ecological nodes that are less disturbed by human activities should be strictly protected to prevent the destruction of the integrity of the ecological security pattern due to the disappearance of important ecological nodes. Then, the ecological nodes which are significantly affected by human activities should be protected. Human activities should avoid ecological nodes, and the interference of human activities can be reduced by setting up warning signs and underpasses. It can also carry out the reforestation in the ecological node areas involved in human activities and enhance the function of the ecosystem. Finally, we should focus on the sensitive points and fragile points on the ecological corridor. Especially, the ecological nodes with high ecological resistance values are easy to be destroyed, which leads to the fracture of ecological corridor and affects the function of ecosystem. Corresponding engineering and biological measures should be taken for these ecological nodes (Yang et al., 2014).
(4) Put forward the countermeasures of zoning regulation. The key controlled area is the key area for ecological restoration, and the ecological structure should be adjusted reasonably to control soil pollution. To reduce the damage caused by human activities to nature, methods such as treating river sources and purifying water are adopted. The ecological security level of the strictly controlled area is lower, so it is necessary to strengthen the main functions of each district and county and further improve the regional greening level. Enhance public awareness of ecological environmental protection, and create an ecological protection belt along the river. The general controlled area has transitional characteristics in the spatial form. In the development and construction of such areas, we should adhere to the policy of planning before construction, avoiding ecological damage caused by repeated construction and strengthening the stable function of the transition zone. The level of ecological security in non-key controlled areas is higher, and the development and construction activities that damage the ecology should be prohibited in such areas. Biodiversity protection and soil erosion control must be strengthened to ensure the overall ecological security level of the region (Sun, 2003).
4.4 Limitations and future research directions
The construction of the ecological security pattern based on the results of landscape ecological risk assessment has achieved ideal results, but there are also some limitations. First of all, the size of grid units affects the accuracy of landscape ecological risk assessment. Therefore, we should test the grid elements with the optimal size in the future research and verify the difference of landscape ecological risk between the administrative boundary and grid as the evaluation unit. Second, the width of corridor affects the accuracy of the construction of the ecological security pattern. In the future research, the MCR model should be combined with physical circuit theory to explore the corridor width that is consistent with the actual situation of the study area. Despite the abovementioned limitations, this study can provide theoretical basis for the healthy, coordinated, and high-quality development of the Yellow River Basin.
5 Conclusion
The construction process of the ecological security pattern in the Yellow River Basin is complicated. The ERI model is used to evaluate landscape ecological risk from the grid scale in this paper. Combined with the MCR model, the ecological security pattern network is constructed from the perspective of landscape ecological risk assessment, and the ecological security protection strategy is put forward. It is found that
(1) The spatial distribution of landscape ecological risks in the Yellow River Basin is significantly different. Generally speaking, it is a spatial landscape pattern of “high in southwest and northwest, low in other areas.” In 2020, the study area is dominated by low risk, lower risk, and middle risk, accounting for more than 86% of the total area.
(2) The ecological resistance surface, MCR value, ecological corridor, and ecological node of the Yellow River Basin showed a spatial distribution pattern of “increasing from west to east,” “high in the middle and low around,” “three horizontal and three vertical,” “more in the south and less in the north”, and “more in the middle and less in the west.”
(3) The Yellow River Basin has formed an ecological security pattern network composed of “points-12 core ecological sources, 92 ecological nodes, lines-12 key corridors, 16 auxiliary corridors, and areas-key controlled areas, strictly controlled areas, general controlled areas, and non key control areas.”
(4) In view of the actual situation of the ecological security pattern in the Yellow River Basin, the protection of ecological sources should be further strengthened. We should pay attention to the construction of ecological corridors, strengthen the restoration of ecological nodes, and put forward zoning regulation strategies in order to promote the sustainable and healthy development of the Yellow River Basin.
Data availability statement
The raw data supporting the conclusions of this article will be made available by the authors, without undue reservation.
Author contributions
JY: Funding acquisition, Writing–original draft, Conceptualization. JL: Writing–review and editing. XY: Data curation, Software, Writing–review and editing. QL: Writing–review and editing. ZZ: Writing–review and editing. GL: Methodology, Writing–review and editing. GQ Methodology, Writing–review and editing. WM: Data curation, Software, Writing–review and editing. MS: Writing–review and editing. PG: Writing–review and editing.
Funding
The author(s) declare that financial support was received for the research, authorship, and/or publication of this article. This work was sponsored in part by Gansu Province 2024 Central Government-Guided Local Science and Technology Development Fund Project (Key Technology Research and Development for High Water Efficiency Precision Agriculture in the Hexi Oasis Irrigation District) (24ZYQA023); National Natural Science Foundation of China (Research on Ecological Risk Assessment and Control Mechanisms of the Gannan Plateau Landscape in the Upper Reaches of the Yellow River) (42461060); Gansu Provincial Key R&D Special Project on Ecological Civilization Construction (24YFFA059); Gansu Province Department of Education Industry Support Program Project (2022CYZC-41); and Gansu Province Financial Special Fund (GSCZZ 20160909).
Conflict of interest
The authors declare that the research was conducted in the absence of any commercial or financial relationships that could be construed as a potential conflict of interest.
Generative AI statement
The author(s) declare that no Generative AI was used in the creation of this manuscript.
Publisher’s note
All claims expressed in this article are solely those of the authors and do not necessarily represent those of their affiliated organizations, or those of the publisher, the editors and the reviewers. Any product that may be evaluated in this article, or claim that may be made by its manufacturer, is not guaranteed or endorsed by the publisher.
References
Ayre, K. K., and Landis, W. G. (2012). A Bayesian approach to landscape ecological risk assessment applied to the upper grande ronde watershed, Oregon. Hum. Ecol. Risk Assess. 18 (4-6), 946–970. doi:10.1080/10807039.2012.707925
Chen, J. S., Wang, F. Y., Meybeck, M., He, Q. W., Xia, X. H., and Zhang, L. T. (2005). Spatial and temporal analysis of water chemistry records (1958-2000) in the Huanghe (Yellow River) basin. Glob. Biogeochem. Cycles 19 (3). doi:10.1029/2004gb002325
Cong, Z. T., Yang, D. W., Gao, B., Yang, H. B., and Hu, H. P. (2009). Hydrological trend analysis in the Yellow River basin using a distributed hydrological model. Water Resour. Res. 45 (7). doi:10.1029/2008wr006852
Gao, X. W., Feng, Z. J., and Ge, J. F. (2008). Analysis of landscape security pattern in western mountains of shijiazhuang. Proc. SPIE. Int. Soc. Opt. Eng. 7145, 561–568. doi:10.1117/12.813043
Li, J. G., He, C. Y., and Li, X. B. (2008). Landscape ecological risk assessment of natural/semi-natural landscapes in fast urbanization regions-a case study in Beijing, China. J. Nat. Resour. 23 (1), 33–47. doi:10.3321/j.issn:1000-3037.2008.01.005
Li, Q. P., Zhang, Z. D., Wan, L. W., Yang, C. X., Zhang, J., Ye, C., et al. (2019). Optimization of landscape pattern in Ningjiang River Basin based on landscape ecological risk assessment. J. Geogr. Soc. China 74 (7), 1420–1437. doi:10.5846/stxb202101040027
Li, X. Y. (2004). The regional pattern for ecological security (RPES): designing principles and method. Acta Ecol. Sin. 24 (5), 1055–1062. doi:10.3321/j.issn:1000-0933.2004.05.029
Liu, Q., Yang, Z. F., and Cui, B. S. (2008). Spatial and temporal variability of annual precipitation during 1961-2006 in Yellow River Basin, China. J. Hydrol. 361 (3-4), 330–338. doi:10.1016/j.jhydrol.2008.08.002
Liu, X. F., Shu, J. M., and Zhang, L. B. (2010). Research on applying minimal cumulative resistance model in urban land ecological suitability assessment: as an example of Xiamen City. Acta Ecol. Sin. 20 (2), 421–428. doi:10.20103/j.stxb.2010.02.018
Pan, J. H., and Liu, X. (2016). Landscape ecological risk assessment and ecological security pattern optimization construction in Shule River Basin. Chin. J. Ecol. 35 (3), 791–799. doi:10.13292/j.1000-4890.201603.022
Peng, J., Dang, W. X., Liu, Y. X., Zong, M. L., and Hu, X. X. (2015). Review on landscape ecological risk assessment. Acta Geogr. Sin. 2015 (4), 664. doi:10.11821/dlxb201504013
Peng, J., Zhao, H. J., Liu, Y. X., and Wu, J. S. (2017). Research progress and prospect on regional ecological security pattern construction. Geogr. Res. 2017, 585. doi:10.11821/dlyj201703001
Peng, Q. L., He, W. J., KongY, S. J. Q., Yuan, L., Ramsey, T. S., and Stephen Ramsey, T. (2024). Spatio-temporal analysis of water sustainability of cities in the Yangtze River Economic Belt based on the perspectives of quantity-quality-benefit. Ecol. Indic. 160, 111909. doi:10.1016/j.ecolind.2024.111909
Sheng, Q. J., Tian, S. Z., and Cai, H. H. (2022). Integrating potential distribution of dominant vegetation and land use into ecological restoration in the Yellow River Basin, China. J. Mt. Sci. 19 (10), 2886–2904. doi:10.1007/s11629-021-6966-1
Shi, P. J., Yuan, Y., He, C. Y., Li, X. B., and Chen, Y. H. (2008). Land use pattern adjustment under ecological security: look for secure land use pattern in China. Geogr. Rev. Jpn. 77 (12), 866–882. doi:10.4157/grj.77.866
Sun, H. L., Zheng, D., Yao, T. D., and Zhang, Y. L. (2012). Protection and construction of the national ecological security shelter zone on Tibetan Plateau. Acta Geogr. Sin. 67 (01), 3–12. doi:10.11821/xb201201001
Sun, S. Y. (2003). Characteristics of ecological environment and its protection along the qinghai-tibet railway. J. Glaciol. Geocryol. 25 (1), 182–185.
Urban, D., and Keitt, T. H. (2001). Landscape connectivity: a graph-theoretic perspective. Ecology 82 (5), 1205–1218. doi:10.2307/2679983
Wang, Y. S., Lou, Z. P., Sun, C. C., and Sun, S. (2008). Ecological environment changes in daya bay, China, from 1982 to 2004. Mar. Pollut. Bull. 56 (11), 1871–1879. doi:10.1016/j.marpolbul.2008.07.017
Xiao, F. J. (2021). Impact of climate change on ecological security of the Yellow River Basin and its adaptation countermeasures. Landsc. Res. Engl. version. 13 (4), 51–56. doi:10.16785/j.issn1943-989x.2021.4.012
Xie, H. L., and Li, B. (2004). A study on indices system and assessment criterion of ecological security for city. J. Beijing Normal Univ. 40 (5), 705–710.
Xu, D. L., Zou, C. X., Xu, M. J., You, G. Y., and Wu, D. (2015). Ecological security pattern construction based on ecological protection redlines. Biodiv. Sci. 23 (6), 740–746. doi:10.17520/biods.2015132
Yang, B. J., Gao, J. X., and Zou, C. X. (2014). The strategic significance of drawing the ecological protection red line. China Dev. 14 (1), 1–4.
Yang, L. A., Li, Y. L., Jia, L. J., Ji, Y. F., and Hu, G. G. (2023). Ecological risk assessment and ecological security pattern optimization in the middle reaches of the Yellow River based on ERI+MCR model. J. Geogr. Soc. 33 (4), 823–844. doi:10.1007/s11442-023-2108-8
Ye, Y. Y., Su, Y. X., Zhang, H. O., Wu, Q. T., and Liu, K. (2015). Construction of an ecological resistance surface model and its application in urban expansion simulations. J. Geogr. Sci. 25, 211–224. doi:10.1007/s11442-015-1163-1
Yu, J., Tang, B., Chen, Y. H., Zhang, L., Nie, Y., and Deng, W. S. (2022). Landscape ecological risk assessment and ecological security pattern construction in landscape resource-based city: a case study of Zhangjiajie City. Acta Ecol. Sin. 42 (4), 1290–1299. doi:10.5846/stxb202012313341
Yu, Q., Yue, D. P., Wang, Y. H., Kai, S., Fang, M. Z., Ma, H., et al. (2018). Optimization of ecological node layout and stability analysis of ecological network in desert oasis: a typical case study of ecological fragile zone located at Deng Kou County (Inner Mongolia). Ecol. Indic. 84 (JAN.), 304–318. doi:10.1016/j.ecolind.2017.09.002
Yuan, L., Li, R., Wu, X., He, W., Kong, Y., Ramsey, T. S., et al. (2023). Decoupling of economic growth and resources-environmental pressure in the Yangtze river economic belt, China. Ecol. Indic. 153, 110399. doi:10.1016/j.ecolind.2023.110399
Zhang, C., Teng, Y. G., Lv, S. H., Li, D. Q., Feng, C. Y., and Zheng, Z. R. (2012). Regional ecological risk assessment index-A case study at hulunbeier. Adv. Mater. Res. 524-527, 2827–2835. doi:10.4028/www.scientific.net/amr.524-527.2827
Zhang, Y. J., Qu, J. G., Liang, X., Li, D., and Tian, Z. Y. (2019). New method of constructing landscape ecological vulnerability index and rationality verification. Sci. Surv. Mapp. 44 (11), 129–136.
Zhao, F. (2013). Impact of ecological corridor construction on urban space-A case study of fen river park in taiyuan city. Landsc. Res. 5 (4), 23.
Zheng, H., Gao, J. X., Xie, G. D., Zou, C. X., and Jin, Y. (2019). Ecological corridor. J. Ecol. Rural Environ. 35 (2), 137–144.
Keywords: ecological risk assessment, construction of ecological security pattern, Yellow River Basin, MCR, landscape
Citation: Yan J, Li J, Yao X, Li Q, Zheng Z, Li G, Qi G, Ma W, Song M and Gao P (2025) Ecological security pattern construction based on landscape ecological risk assessment in the Yellow River basin. Front. Environ. Sci. 13:1514599. doi: 10.3389/fenvs.2025.1514599
Received: 31 October 2024; Accepted: 13 January 2025;
Published: 14 February 2025.
Edited by:
Bo Jiang, Changjiang River Water Resources Protection Institute, ChinaReviewed by:
Liang Yuan, China Three Gorges University, ChinaRonghua Zhong, Yunnan University, China
Copyright © 2025 Yan, Li, Yao, Li, Zheng, Li, Qi, Ma, Song and Gao. This is an open-access article distributed under the terms of the Creative Commons Attribution License (CC BY). The use, distribution or reproduction in other forums is permitted, provided the original author(s) and the copyright owner(s) are credited and that the original publication in this journal is cited, in accordance with accepted academic practice. No use, distribution or reproduction is permitted which does not comply with these terms.
*Correspondence: Jixuan Yan, eWFuaml4dWFuZEBzaW5hLmNvbQ==