 Mingxing Zhong
 Qingqing Liu2
- 1Tourism College, Xinyang Normal University, Xinyang, China
- 2Hubei Key Laboratory of Regional Ecology and Environmental Change, School of Geography and Information Engineering, China University of Geosciences, Wuhan, China
Global population growth has increasingly intensified human interferences with natural ecosystems. These interferences often exhibit complexity and diversity characteristics. Understanding the relationship between population growth and environmental issues has become a focus in the current scientific community. This study, leveraging multi-source remote sensing and census data from China for the years 2000, 2010, and 2020, utilized multiple spatial econometric models to investigate the pressure of population dynamics on Ecological Environment Quality (EEQ). A bivariate local spatial autocorrelation model was applied to pinpoint regions that experienced significant population pressure in China over the past two decades. Results showed that there was a rise in population density, with larger cities attracting more migrants to become residents and EEQ declining in most counties. The analysis revealed a strong spatial dependence between changes in EEQ and population. Spatial regression models were more effective than non-spatial models in explaining population pressure on EEQ. Population growth was significantly associated with EEQ decline. Based on the spatial regression model, EEQ decreased by 0.029% for every 1% increase in population from 2000 to 2010. During 2010–2020, this impact was more pronounced, with a 1% population associated with a 0.069% decline in EEQ. Pressure zones analysis showed the most widespread regions were unsustainable zones (decreases in population and EEQ), followed by areas with both population increases and EEQ declines, with fewer regions demonstrating coordinated development improvements. Effective solutions to address the challenges of population pressure on EEQ involve government regulation, strategic planning, cross-regional management, and the sharing of responsibilities and benefits.
1 Introduction
According to the 2024 World Population Prospects, the global population reached approximately 8.2 billion in mid-2024 and will peak at 10.3 billion by the mid-2080s (The United Nations, 2024). Increasing global population pressures and human impacts on EEQ are a major global challenge (Kii, 2021; Chi and Ho, 2018). Especially, in the 21st century, the global population continues to grow, creating or aggravating a series of problems, including global warming (Li L. et al., 2022), food security (Chen et al., 2023; Zheng et al., 2023), and EEQ deterioration (Chen et al., 2023; Delgado and Marín, 2020), among others. The increasingly deteriorating eco-environment not only threatens human beings’ survival and social development but also affects the coordinated human-land relationship regional systems (Liu et al., 2023; Zhou et al., 2023; Myers, 1987). As one of the most populous countries, China faces intense population-resource-environment challenges, which exert significant pressure on EEQ (Zhou et al., 2023). China’s diverse environmental and resource conditions, combined with socioeconomic imbalances, create large spatial variations in population impact on EEQ (Li et al., 2020; Song et al., 2021; Xu et al., 2020). The conflict between population and EEQ has become the focus in various fields, such as demography, ecology, geography, and economics, but their spatial relationship is still unclear and needs further exploration (Yang et al., 2024a; Bu et al., 2022).
Population growth is a direct factor that increasingly cause pressure on EEQ (Chi and Ho, 2018; Xu et al., 2020). The conflicts between population and EEQ are complex and diverse. First, population growth has intensified the demand for energy, water, food, and other resources, leading to extensive deforestation, wetland filling, overgrazing of grasslands, overfishing of oceans, and ultimately resulting in the destruction and degradation of natural ecosystems (Yang et al., 2024b; Liu et al., 2021). Second, the increasing scope and intensity of human activities have led to a further increase in the demand for land for infrastructure construction such as houses, roads, and factories. A large amount of ecological land has been occupied, resulting in the destruction and degradation of natural habitats and biodiversity loss (Zeng et al., 2023; Li G. et al., 2022; Ren et al., 2022). Additionally, the continuous acceleration of industrialization and urbanization leads to a large number of pollutants discharged into the environment, causing serious pollution (Gao et al., 2023; Zhao and Wang, 2022).
Previous studies have constructed appropriate population and EEQ indicators to clarify the impact mechanism of population growth on EEQ (Chi and Ho, 2018; Chen D. et al., 2020; Yan et al., 2017). A series of indicators such as moderate population, population carrying capacity, and population pressure are used to measure the characteristics of population change (Molotoks et al., 2021; Zhang et al., 2020; McCool et al., 2024). Moreover, these indicators have certain advantages in the studying the relationship between population, resources, and environment (Zhang et al., 2019; Fang et al., 2024). For example, the population carrying capacity index considers more the supply capacity of various resources such as mineral resources, land resources, water resources, atmospheric environment, geological environment, water environment, ecological environment, etc. for population growth (Chen D. et al., 2020; Yan et al., 2017; Fang et al., 2024). However, population pressure is generally considered to be the level of pressure exerted by the existing population in a region on the resources and the surrounding environment (Chi and Ho, 2018). With the deepening understanding of its concept, the measurement of population pressure is no longer limited to the number of people, but more extensively represented by other properties in various dimensions (Shen et al., 2023; Zhang et al., 2020; Mahmoud and Gan, 2018). The population pressure is not only the inappropriate state of the occupation of tangible resources, but also the inadaptability of intangible resources, economy, and social system (Zhou et al., 2020). Per capita cropland area, per capita grain output, per capita water resources, and per capita economic density, have been used as indicators of population pressure in previous studies (Chi and Ho, 2018; Wang and Li, 2021; Holdren and Ehrlich, 1974). These indicators were constructed mainly to find the appropriate point of population pressure on resources, environment, and socioeconomic factors, rather than to measure population pressure from the essence of population quantity (Wang and Li, 2021; Holdren and Ehrlich, 1974).
The variation in regional population is tightly linked to local resources, environmental conditions, and regional economic development. For example, areas with higher population density (PD) require more resources to meet the demands for food, water, ecological balance, and infrastructure. Economic growth, industrialization, and urbanization within a region by population growth inevitably exert pressure on EEQ (Chi and Ho, 2018). Since population is the primary agent of socioeconomic activities, population activity intensity serves as a key indicator reflecting the social background within the population-environment system (Chi and Ho, 2018). The intensity of population activity is not only related to changes in population size, but also more closely related to changes in PD. The increase in PD can lead to a series of problems, such as excessive resource consumption, environmental pollution, and ecosystem destruction, thereby increasing ecological pressure. Additionally, the increase in PD can indirectly place pressure on EEQ through socioeconomic development, urbanization, and industrial restructuring, influencing the stability and sustainability of ecosystems. Therefore, PD has advantages in measuring population pressure.
In the process of exploring the relationship between population and EEQ, how to characterize the regional EEQ scientifically and reasonably is an important issue (Li et al., 2023). Many previous studies measured regional EEQ by developing EEQ index evaluation systems and methods (Fu et al., 2022; Juntti et al., 2021; Xu et al., 2021). The 3S technology was also used to extract ecological monitoring index data to measure regional EEQ. Some studies on measured EEQ index and ecosystem services value through land use/cover change data (Jiang et al., 2022; Silva et al., 2024; Costanza et al., 1997), while others based on multi-source remote sensing data (e.g., NDVI, soil erosion) weighted EEQ index (Xu et al., 2021; Li et al., 2023). EEQ, fusing multi-source remote sensing data, can make up for the dynamic monitoring of EEQ by remote sensing (Li et al., 2023). Among them, the remote sensing ecological index proposed by Xu et al. (2021) has decent applicability, especially in the evaluating EEQ in large regions. This index was later optimized to be more adaptable and hence widely applied (Xu et al., 2022; Li et al., 2023).
The human-land relationship regional system is a complex, open system that integrates natural geographic and socioeconomic, characterized by specific structural and functional mechanisms (Alberti et al., 2011). Population and EEQ are important socioeconomic and natural geographic elements, respectively. Therefore, exploring the relationship between population and EEQ is beneficial for better understanding the internal structure and functional mechanisms of the human-environment system. In the context of sustainable global population growth, this study provides theoretical support and practical guidance for formulating scientifically reasonable population and environmental protection policies.
2 Materials and methods
2.1 Data sources
In this study, the high-resolution EEQ datasets of China in 2000, 2010, and 2020 were obtained from the National Earth System Science Data Center. National Science and Technology Infrastructure of China (http://www.geodata.cn). The spatial resolution is 1 km × 1 km. Due to the unavailability of data for 2000, data from 2001 was used as a substitute. The original sources of this data were MOD09A1, MOD11A2, and MCD12Q1, which were calculated in the Google Earth Engine platform (Xu et al., 2021; Li et al., 2023). The verification results showed that EEQ dataset was largely consistent with the environmental index provided by China’s Ministry of Ecology and Environment, with an RMSE of 0.11 and an R2 of 0.71 (Xu et al., 2021). EEQ dataset has filled the research gap in the field of EEQ monitoring in China. The population data for 2000, 2010, and 2020 were derived from the fifth, sixth, and seventh censuses of the county units, and the PD is the ratio of the number of people living in the county to the area of that county (unit: person/km2).
2.2 Measurement of EEQ
EEQ dataset was constructed using four indicators: humidity, greenness, heat, and dryness, each of which directly reflects the ecosystem status. Specifically, humidity, greenness, heat, and dryness were respectively characterized by humidity index, vegetation index, surface temperature, and bare soil index. After the standardization of different ecological indices, the principal component analysis was employed to reduce the dimensionality of the standardized indicators, and the contribution rate of each indicator to the first principal component was determined (Li et al., 2023). The specific calculation equation can be referred to Xu et al. (2021).
2.3 Population pressure on EEQ change
In this study, three sets of regression models were conducted to investigate the impact of population on EEQ change (Chi, 2010; Chi and Ho, 2018), including the ordinary least squares (OLS) model, three spatial regression models [spatial lag model (SLM), spatial error model (SEM), and spatial error model with lagged-dependence (SEMLD)], and geographically weighted regression (GWR) model. In the OLS model, population pressure was regarded as an independent variable, and its direct effect on EEQ change was reflected by the regression coefficient, without considering the spatial impact of neighboring units. In the SLM model, the influence of population pressure on EEQ change was not only reflected in the direct effect but also reflected in the indirect effect of population pressure from adjacent units on the current EEQ change by the spatial lag term. As for the SEM model, the spatial autocorrelation of the error term was incorporated into the model, thus improving the accuracy of the estimation. This model can reveal the potential spatial effects of population pressure on EEQ change. The SEMLD model included the spatial lag and spatial error models and spatial autoregressive models enhanced by adding spatial lag explanatory variables (Chi and Zhu, 2008). The GWR model was used to detect whether there was spatial heterogeneity in the dependent and independent variables in the study, and was mainly used as a tool for explanation (Videras, 2014). The influence of population pressure on EEQ change may be different in different spatial locations. By calculating the regression coefficient of each spatial unit, the degree of local influence of population pressure on EEQ change can be obtained. The GWR model can more accurately reflect the spatial heterogeneity of population pressure on EEQ change. The OLS and spatial regression models were implemented in Geoda095i and the GWR model was implemented in the ArcTool function of ArcGIS 10.3. The model calculation equations were shown in the corresponding references (Chi and Zhu, 2008; Videras, 2014).
2.4 Population stress areas identification
Local Moran’s I was often used to estimate the spatial autocorrelation of adjacent features between geographical factors (Anselin, 1995). To identify the stress areas of the population on EEQ, bivariate local autocorrelation was introduced in this study to provide a feasible method for identifying population pressure areas (Chi and Ho, 2018). Through the analysis of local Moran’s I, the relationship between the change of population size and the change of EEQ was identified. The “high-low” type was defined as a population-EEQ improvement zone, indicating that a 1% decrease in population size corresponded to an increase in EEQ by more than 1%. The “low-high” type was defined as a population-EEQ pressure zone, showing that an increase in the number of population size in 1% of the area corresponded to a decrease in EEQ of more than 1%. The “high-high” type indicated that the increase in the number of regional populations corresponded to the increase in EEQ, and was defined as the improvement of the coordinated development zone. The “low-low” type indicated that the decrease of the regional population corresponded to the decrease of the regional EEQ, and was defined as an unsustainable zone. The calculation Equations 1–3 was as follows:
where,
3 Results
3.1 Population dynamics
The distribution map of China’s PD shows that, from 2000 to 2020, the spatial pattern of “more in the southeast and less in the northwest” remained largely unchanged (Figure 1). Densely, populated areas were mainly located in the eastern coastal regions, the Huang-Huai-Hai Plain (HHHP), the Yangtze River Delta (YRD), the Sichuan Basin (SCB), the middle reaches of the Yangtze River (MRYR), and the Pearl River Delta (PRD). On the contrary, in the northwest region, except for a few provincial capitals such as Urumqi and Xining with high PD, most areas had sparse populations.
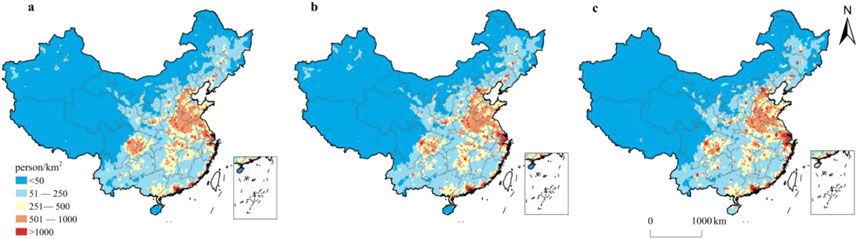
Figure 1. Spatial patterns of PD in China in 2000, 2010, and 2020. (A) 2000. (B) 2010. (C) 2020.
The percentage of county units with population decreased between 2000–2010 and 2010–2020 were 35.8% and 55.5%, respectively. From 2000 to 2010, 6.8% of the counties had a population decrease with a magnitude greater than 50 person/km2, 22.1% of the counties had a population increase greater than 50 person/km2, and the proportions were 13.3% and 21.9%, respectively, from 2010 to 2020. Between 2000 and 2010, the regions with significant population reduction were mainly distributed in central Sichuan, southern Hubei, southeastern Henan, Anhui, and northern Jiangsu, while the regions with significant population growth were mainly distributed in the central areas of the three major urban agglomerations of Beijing-Tianjin-Hebei, YRD, and PRD.
During 2010–2020, the number of counties with population decline had increased evidently, and the main distribution area had gradually spread to the middle and lower reaches of the Yellow River and south of the Yangtze River (Figure 2). Moreover, the areas of PD decline in some parts of Xinjiang and Northeast China had further expanded, and the magnitude of the decline had further increased. In addition, the areas with a slight decrease in PD had the largest area and the widest distribution. However, the main distribution areas of counties with increasing populations also expanded, and the PD in Hainan Province shifted from decreasing to rapidly increasing. Other regions with sporadic distribution of counties exhibited increased PD.
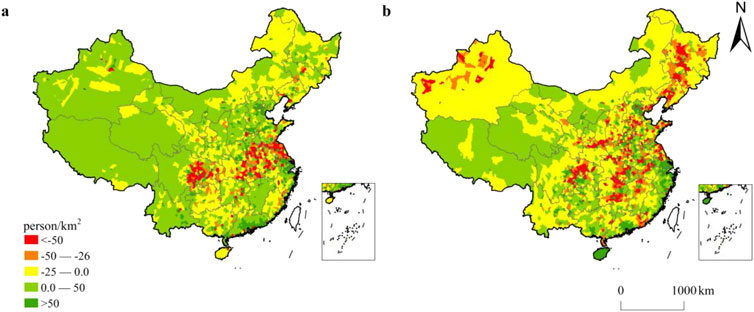
Figure 2. Spatial patterns of PD change in China from 2000 to 2010 and from 2010 to 2020. (A) 2000–2010. (B) 2010–2020.
3.2 EEQ changes
In 2000, 2010, and 2020, China’s average EEQ scores were 0.393, 0.391, and 0.391, respectively, indicating a trend of decreasing and then slightly stabilizing in EEQ (Figure 3). Overall, China’s EEQ showed a pattern of low in northwestern China and high in southeastern and northeast China. Moreover, EEQ in China demonstrated a clear trend of spatial clustering. Due to unfavorable natural conditions, the northwest region exhibited a low level of EEQ clustering. Due to high forest coverage, some sub-regions in the south and northeast exhibited high-level clustering of EEQ. Due to the intensive agricultural activities in the Northeast Plain, North China Plain, and SCB, EEQ showed moderate-level clustering of EEQ.
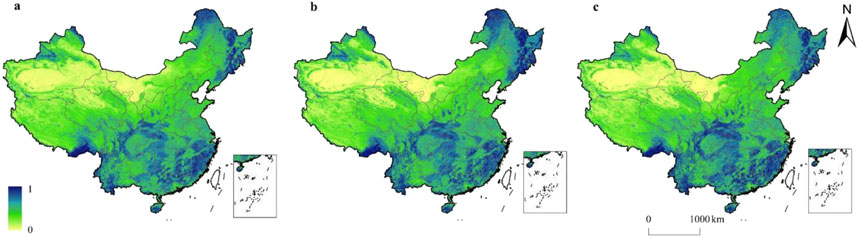
Figure 3. Spatial patterns of EEQ in China in 2000, 2010, and 2020. (A) 2000. (B) 2010. (C) 2020.
During 2000–2010, EEQ of 57.0% of counties in China decreased, especially in Tibet, southern Qinghai, Hunan-Guangxi-Guangdong-Jiangxi-Fujian border area, YRD, and HHHP. In 23.6% of the counties, EEQ decreased by more than 0.028. However, there are also some areas where EEQ has shown an improvement trend, such as the Northeast region, northern Hebei, Shanxi, Shaanxi, southern Henan, and some areas in Xinjiang. From 2010 to 2020, the proportion of units with reduced EEQ was 43.4%, and more than 13.9% of the county EEQ decreased by more than 0.028. The area with improved EEQ increased, mainly in eastern Inner Mongolia, the southern Qinghai, the southern part of Gansu, and Yunnan, Guizhou, Guangxi, Guangzhou, and Fujian in southern China. There was a decrease in all other regions (Figure 4). Overall, there were certain differences in the trend of EEQ changes between the two decades of 2000–2010 and 2010–2020. The EEQ scores of some counties in the northwest border, northeast and central China had changed from increase to decrease. However, the EEQ scores of some counties in southern coastal provinces, Xizang and Qinghai had changed from decrease to increase.
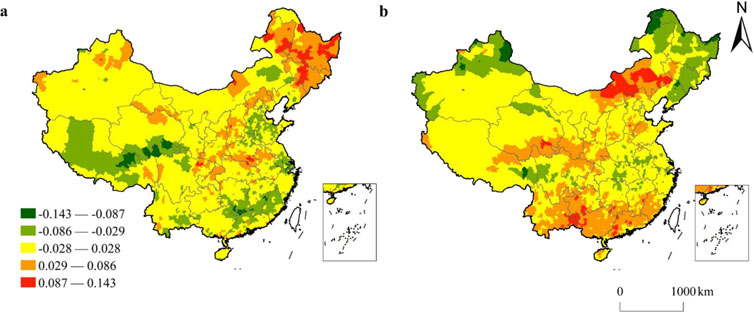
Figure 4. Spatial patterns of EEQ change in China from 2000 to 2010 and from 2010 to 2020. (A) 2000–2010. (B) 2010–2020.
3.3 Impact of population on EEQ
The regression analysis for the periods of 2000–2010 and 2010–2020 revealed that the Breusch-Pagan and Koenker-Bassett test statistics were significant at the 0.001 level, suggesting that the data for the independent variables did not exhibit heteroscedasticity. When the spatial effects of adjacent counties were not considered, the OLS regression results exhibited a negative relationship between population change and EEQ change in EEQ in China from 2000 to 2020 (p < 0.001, Tables 1, 2). This suggested that population growth was strongly linked to the decline in EEQ. Comparing the results of the four models, it was found that the SEMLD model had the highest Log likelihood value, the lowest AIC and SC values, and the best fitting effect, making it the most suitable model for this analysis. According to the SEMLD model results, there was a negative association between population change and EEQ change from 2000 to 2010. Specifically, a 1% increase in population was associated with a 0.029% decrease in EEQ. From 2010 to 2020, a 1% increase in population was associated with a 0.069% decline in EEQ (Tables 1, 2).

Table 1. Regression results during 2000–2010.
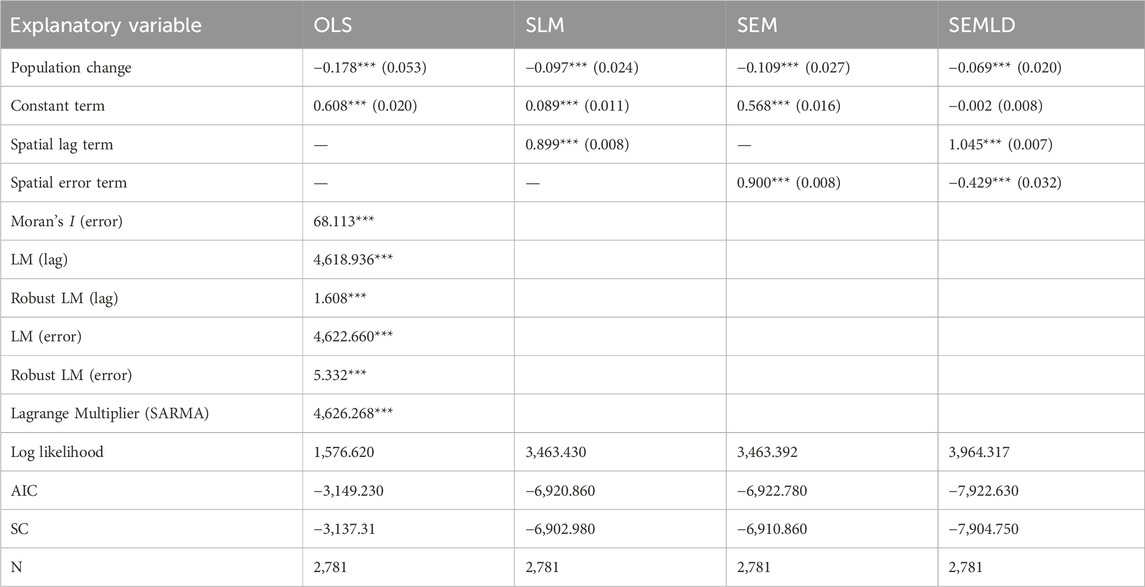
Table 2. Regression results during 2010–2020.
The regression coefficient obtained by OLS and spatial regression models was the effect of population pressure on EEQ change in the whole study area, but the impact degree may be different from county to county. It is more realistic to assume that the population change and EEQ change between regions had spatial heterogeneity. Therefore, the GWR model was used to generate local variation coefficients. According to the GWR regression results, only 0.8% of counties were severely underestimated during 2000–2010 with the standard deviation of the residual less than −2.5, and only 2.0% of counties were severely overestimated with the standard deviation of the residual greater than 2.5. In contrast, 43.1% of the counties’ standard deviations of the residuals was between −0.5 and 0.5, suggesting that GWR results can more accurately reflect the relationship between EEQ change and population change. During 2010–2020, only 0.8% of counties were extremely undervalued with a standard deviation of the residual below −2.5, and only 1.1% were extremely overvalued with a standard deviation of the residual above 2.5. In contrast, the standard deviations of 42.0% of the county residuals were between −0.5 and 0.5, further indicating that GWR results can well reflect the relationship between EEQ change and population change (Figure 5). GWR results showed that EEQ decreased with population increase during 2000–2010, especially in western Inner Mongolia, southern Gansu, Ningxia, Shanxi, Shaanxi, Henan, Hubei, Anhui, and other regions. The increase in population in the west of Xinjiang and Tibet and the Heilongjiang region of northeast China during 2010–2020 led to an EEQ increase, and a population increase in other regions led to a decrease in EEQ.
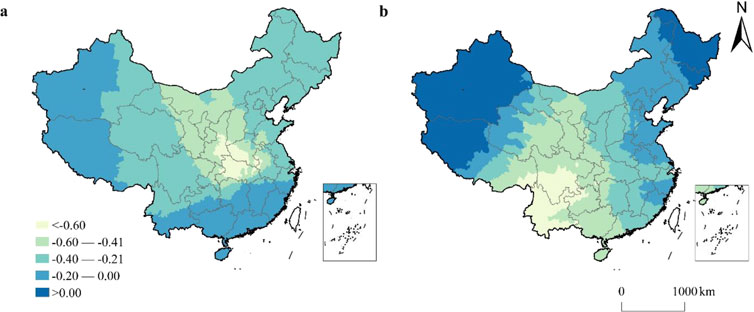
Figure 5. Spatial patterns of coefficients of the GWR model for population change and EEQ change in China during 2000–2010 and during 2010–2020. (A) 2000–2010. (B) 2010–2020.
3.4 Identification of population stress zones
Bivariate local Moran’s I was used to identify population pressure zones, and based on the Z-test (p = 0.01), bivariate local spatial autocorrelation Local Indicators of Spatial Association (LISA) aggregation plots were drawn for changes in EEQ and population size in China during 2000–2010 and 2020–2020 (Figure 6). The “low-low” zoning, which refers to areas with decreasing EEQ and continuously decreasing population, is considered an unsustainable development area. During 2000–2010, it was mainly distributed in most areas of Xinjiang, Xizang and Yunnan, as well as the border areas of Sichuan, Qinghai and Gansu. However, during 2010–2020, the region mainly shifted to Xinjiang and Northeast China. Therefore, the region needs to strengthen the dual management of the economy and environment. The “low high” zone refers to the area where EEQ decreases while PD increases, and the increase in PD was the main factor causing the decrease in EEQ. This area belongs to a typical population pressure zone. During 2000–2010, it was mainly distributed in the East China region, including Liaoning, Shandong, Jiangxi, Jiangsu, Anhui, Shanghai, Zhejiang, Guangdong, Fujian, and other areas. Distributed in Hubei, Zhejiang, Hunan, Jiangxi, Shanghai, Anhui, southern Jiangsu, parts of Shandong, Henan and other areas during 2010–2020. Therefore, the region should strengthen the management of human activities and balance the relationship between population and environment. Then there were the “high-high” type zones, which were dispersed in the eastern part of China from 2000 to 2010, including northern Hebei, parts of Liaoning, northern Anhui, and parts of Jiangxi and Zhejiang. From 2010 to 2020, it was dispersed in parts of north China, southern Jiangxi, Fujian, Guangdong, Guangxi, and Hainan. The population and EEQ in these areas increased at the same time, which was defined as the improvement of coordinated development areas. The second was the “high-low” type area. During 2000–2010, the “high-low” type areas were widely distributed, mainly in the western region, including the western part of Xinjiang, Qinghai, Gansu, Shaanxi, Sichuan, Chongqing, Guizhou, and Yunnan, and the western part of Hubei. From 2010 to 2020, there were few high-low type areas, and the discrete distribution was in the western region. These areas were mainly concentrated in mountainous areas, where the population was mainly reduced and EEQ was mainly improved. A decrease of 1% of the population corresponded to an increase of >1% of EEQ, which was a population-EEQ improvement zone.
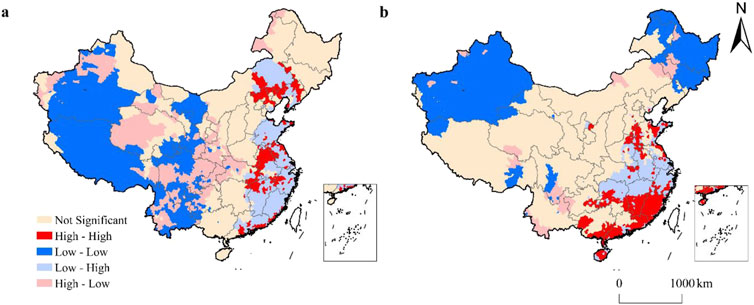
Figure 6. LISA aggregation diagram of bivariate spatial autocorrelation between EEQ and PD change in China during 2000–2010 and during 2010–2020. (A) 2000–2010. (B) 2010–2020.
4 Discussion
4.1 Population pressure on EEQ in China
The overall pattern of population in China has remained relatively stable throughout the study period (2000–2020), characterized by high population density in the southeast and low density in the northwest of China. A combination of factors is responsible for this pattern, including social, economic, natural, and historical influences (Xu et al., 2021). Due to its geographical advantages and favorable national policies, the eastern region of China was the first to undergo reform and opening up, which has significantly accelerated urbanization and industrialization. Consequently, China’s regional economic development has displayed a distinct spatial pattern of “high in the east and low in the west.” Various economic production factors have continuously shifted from the central and western regions to the east, from rural to urban areas, and from less developed to more developed regions. This concentration of resources and factors has driven the spatial shifts in population distribution (Liu et al., 2022; Qi et al., 2022). During the study period, China’s EEQ has increased on the whole, and the proportion of county units with increased EEQ has increased evidently from 2000 to 2010 to 2010–2020. This indicated that EEQ in China has improved significantly in the past two decades. This was consistent with the results of a number of studies (Chen et al., 2024).
The regression results showed that population change exerted great pressure on EEQ. The relationship between population changes and EEQ change in China has a strong spatial spillover effect, which also suggested that future regional EEQ governance and protection and population adjustment should be carried out in the whole region, rather than in a single administrative region. Establishing a cross-administrative management mechanism can improve the efficiency of resource use and management, as well as coordinate the sharing of responsibilities and benefits across the region (Chen W. et al., 2020).
The results of pressure zone identification showed that the “low-low” zone was the most widely distributed, and the number of populations in these zones was decreasing, but EEQ was constantly deteriorating, which was an unsustainable development zone, and the management of EEQ needed to be strengthened. This is followed by the “low-high” type, which was a population-EEQ pressure area. The “high-high” and “high-low” types represented the improved coordinated development area and the population-EEQ improvement area, respectively, but the number of these type areas was small.
4.2 Coping strategies of population pressure on EEQ
The study uncovered that the continuous increase in population and the rising frequency of human activities have placed unprecedented pressure on EEQ. Based on assessing the pressure of population growth on EEQ, the study identified the areas in China experiencing significant ecological stress. These findings lay a scientific foundation for optimizing land use in China and help guide regional population redistribution. Based on these insights, the study offered the following countermeasures and recommendations.
4.2.1 Population quality and environmental awareness
Improving population quality and environmental awareness has become one of the important ways to alleviate the pressure of EEQ (Chien, 2023; Dabbous et al., 2023). The improvement of the quality of the population means that people can better understand and respect the laws of nature, and the enhancement of environmental awareness can encourage the public to adopt more environmentally friendly lifestyles and production methods, thereby reducing the damage to EEQ. The quality of the population is one of the most significant indicators of the overall growth of a country or region, which covers many aspects such as education level, moral concepts, and scientific literacy. Environmental awareness refers to the public’s understanding, attitude, and action of EEQ protection. The awareness of environmental protection to protect EEQ should be strengthened. First of all, environmental awareness can lead people to adopt a more environmentally friendly lifestyle. Secondly, environmental awareness can push enterprises to adopt more environmentally friendly production methods. Finally, environmental awareness can promote the participation and collaboration of government and society.
4.2.2 Optimize population distribution and urban planning
Optimizing population distribution and urban planning is a key measure to alleviate the pressure on EEQ and realize sustainable development. Uneven population distribution and resource mismatch are important sources of EEQ pressure (Zeng et al., 2021). Optimizing the population distribution and realizing the rational allocation of population and resources is vital for reducing the pressure of EEQ. First of all, optimizing population distribution can help alleviate the population pressure in big cities and reduce urban congestion, pollution, and other problems. Secondly, by guiding the flow of population to areas with rich resources and strong environmental carrying capacity, the efficient use of resources can be achieved and the environmental pressure can be reduced. Finally, the optimization of population distribution can also promote the balanced development of urban and rural areas, the narrowing of the gap between urban and rural areas, and the improvement of residents’ quality of life.
Specifically, the government should develop relevant policies, such as those related to employment, education, and healthcare, to encourage the migration of people to regions with abundant resources and a high environmental carrying capacity. Industrial restructuring and enhancing infrastructure are key strategies for optimizing population distribution. Additionally, it is essential to refine the industrial framework, promote emerging and green industries, and create job opportunities to facilitate population relocation. By adjusting the industrial layout, the government can guide population movement toward industrial hubs, ensuring balanced development between population and industry. Furthermore, establishing an evaluation system to assess the alignment between population dynamics and EEQ, improving the mechanisms for real-time monitoring of population, resources, and environment in China’s ecologically sensitive regions, and guiding regulatory measures for adjusting regional population distribution is also critical.
Urban planning is an important means to optimize population distribution and a key link to protect the eco-environment (Liu and Russo, 2021). Reasonable urban planning can relieve the pressure of population activities on EEQ. For example, ecological priority, compact development, green transportation, and green buildings are all strategies that can be considered in planning. In urban planning, the principle of ecological priority and eco-environmental protection should be put in the first place. In addition, the compact development model is adopted to improve urban land use efficiency and reduce land waste. Meanwhile, by optimizing the urban spatial layout, reducing traffic congestion and energy consumption, reducing the pressure on the environment. We should make urban planning more scientific and forward-looking, and give full consideration to the coordinated development of population, resources, environment, and other factors (Zeng et al., 2021). Eco-environmental protection indicators into the national economic development planning system, in the multi-planning regional planning system, eco-environmental protection targets as constraints for other socioeconomic development, and incorporate them into the performance assessment system of administrative organs at all levels. In addition, the development of sustainable production and consumption patterns is an effective way to alleviate the pressure of population activities on EEQ. It is essential to promote green production technology, practice circular economy, promote clean production, and other measures to build sustainable production modes.
4.3 Limitations
This study used counties as the research units to examine the relationship between changes in EEQ and population in China from 2000 to 2020, employing an EEQ index derived from multi-source remote sensing data to represent EEQ in China. Note that different ecological indicators may affect research results in different ways. Future research could explore the relationship between changes in other ecological indicators and population size. The indicators used in this study’s model were somewhat simplified, and future studies could incorporate factors such as transportation infrastructure, socioeconomic conditions, and natural elements. While such additions might increase the model’s complexity, they could offer clearer insights into the interplay between population and EEQ changes.
This study primarily focused on the effects of population activities on EEQ within China. Although it provides a certain level of representativeness, it may not fully capture the relationship between population dynamics and EEQ on a global scale. Furthermore, insufficient consideration of the unique characteristics and differences among countries and regions could limit the generalizability of the findings. Future research should emphasize the global relationship between population and EEQ, uncovering both universal patterns and distinct differences through comparative studies across various countries and regions. Additionally, in-depth studies of specific areas and particular population groups should be strengthened to enhance the relevance and practical application of the research.
5 Conclusion
This study utilized the population data at the county level and high-resolution EEQ data for China to examine how PD relates to EEQ. The analysis employed spatial regression and local spatial autocorrelation models to investigate this relationship. The key findings were outlined as follows: Over the past few decades, China’s population distribution has largely followed a consistent pattern of “denser in the southeast and sparser in the northwest.” EEQ in China showed a notable pattern of clustering. Low EEQ values were predominantly found in the northwest. EEQ was relatively higher in northeast China, and south China. However, there are certain differences in the trend of EEQ changes between the two decades of 2000–2010 and 2010–2020. The EEQ scores of some counties in the northwest border, northeast and central China has changed from increase to decrease. However, the EEQ scores of some counties in southern coastal provinces, Xizang, and Qinghai changed from decrease to increase. The results of the spatial regression model indicate a significant negative correlation between changes in EEQ and population growth. Moreover, the association between population with EEQ become stronger through time. For every 1% increase in population, the distribution leads to a decrease in EEQ of 0.029% between 2000 and 2010 and 0.069% between 2010 and 2020, respectively. The analysis of pressure zones identified that “low-low” areas, which were unsustainable zones, were the most widespread during the study period. These were followed by “low-high” zones, which were regions facing pressure from both populations increase and EEQ decline, and “high-high” zones, which reflected areas with improved and coordinated development. Therefore, in the face of China’s current challenge of population pressure on EEQ, policymakers should improve the population quality and environmental awareness, guide people to adopt environmentally friendly lifestyles and production methods in order to reduce environmental damage. Policy that optimizes population distribution and urban planning and allocates population-resources-environment reasonably can help better achieve sustainable development of the human-environmental system.
Data availability statement
The original contributions presented in the study are included in the article/supplementary material, further inquiries can be directed to the corresponding author.
Author contributions
MZ: Conceptualization, Writing–original draft, Writing–review and editing. QL: Data curation, Methodology, Software, Writing–original draft. XH: Data curation, Methodology, Supervision, Writing–original draft.
Funding
The author(s) declare that financial support was received for the research, authorship, and/or publication of this article. This research was supported by the Henan Province Science and Technology Research Projects (No. 242102321157) and Postgraduate Education Reform and Quality Improvement Project of Henan Province (No. YJS2022JD30).
Conflict of interest
The authors declare that the research was conducted in the absence of any commercial or financial relationships that could be construed as a potential conflict of interest.
Generative AI statement
The author(s) declare that no Generative AI was used in the creation of this manuscript.
Publisher’s note
All claims expressed in this article are solely those of the authors and do not necessarily represent those of their affiliated organizations, or those of the publisher, the editors and the reviewers. Any product that may be evaluated in this article, or claim that may be made by its manufacturer, is not guaranteed or endorsed by the publisher.
References
Alberti, M., Asbjornsen, H., Baker, L. A., Brozovic, N., Drinkwater, L. E., Drzyzga, S. A., et al. (2011). Research on coupled human and natural systems (CHANS): approach, challenges, and strategies. Bull. Ecol. Soc. Am. 92, 218–228. doi:10.1890/0012-9623-92.2.218
Anselin, L. (1995). Local indicators of spatial association-LISA. Geogr. Anal. 2, 93–115. doi:10.1111/j.1538-4632.1995.tb00338.x
Bu, Y., Wang, E., Qiu, Y., and Möst, D. (2022). Impact assessment of population migration on energy consumption and carbon emissions in China: a spatial econometric investigation. Environ. Impact. Asses. 93, 106744. doi:10.1016/j.eiar.2022.106744
Chen, D., Zhou, Q., and Yu, L. (2020a). Response of resources and environment carrying capacity under the evolution of land use structure in Chongqing Section of the Three Gorges Reservoir Area. J. Environ. Manage. 274, 111169. doi:10.1016/j.jenvman.2020.111169
Chen, W., Chi, G., and Li, J. (2020b). The spatial aspect of ecosystem services balance and its determinants. Land Use Policy 90, 104263. doi:10.1016/j.landusepol.2019.104263
Chen, W., Wang, G., Cai, W., Che, X., Zhou, W., Zhang, C., et al. (2023). Spatiotemporal mismatch of global grain production and farmland and its influencing factors. Resour. Conserv. Recy. 194, 107008. doi:10.1016/j.resconrec.2023.107008
Chen, W., Yang, L., Chi, G., and Zeng, J. (2024). Ecosystem degradation or restoration? The evolving role of land use in China, 2000–2020. Environ. Monit. Assess. 196, 304. doi:10.1007/s10661-024-12464-x
Chi, G. (2010). The impacts of highway expansion on population change: an integrated spatial approach. Rural. Sociol. 75, 58–89. doi:10.1111/j.1549-0831.2009.00003.x
Chi, G., and Ho, H. C. (2018). Population stress: a spatiotemporal analysis of population change and land development at the county level in the contiguous United States, 2001–2011. Land Use Policy 70, 128–137. doi:10.1016/j.landusepol.2017.10.008
Chi, G., and Zhu, J. (2008). Spatial regression models for demographic analysis. Popul. Res. Policy Rev. 27, 17–42. doi:10.1007/s11113-007-9051-8
Chien, F. (2023). The role of technological innovation, carbon finance, green energy, environmental awareness and urbanization towards carbon neutrality: evidence from novel CUP-FM CUP-BC estimations. Geosci. Front. 15, 101696. doi:10.1016/j.gsf.2023.101696
Costanza, R., Darge, R., DeGroot, R., Farber, S., Grasso, M., Hannon, B., et al. (1997). The value of the world's ecosystem services and natural capital. Nature 387, 253–260. doi:10.1038/387253a0
Dabbous, A., Horn, M., and Croutzet, A. (2023). Measuring environmental awareness: an analysis using google search data. J. Environ. Manag. 346, 118984. doi:10.1016/j.jenvman.2023.118984
Delgado, L. E., and Marín, V. H. (2020). Ecosystem services and ecosystem degradation: environmentalist’s expectation?. Ecosyst. Serv. 45, 101177. doi:10.1016/j.ecoser.2020.101177
Fang, C., Li, G., Bao, C., Wang, Z., Qi, W., Ma, H., et al. (2024). How many people can the Qinghai-Tibet Plateau hold, and how large cities can be built in recent hundred years?. Sci. Total Environ. 927, 172404. doi:10.1016/j.scitotenv.2024.172404
Fu, Q., Wang, J., Xiang, Y., Yasmeen, S., and Zou, B. (2022). Does financial development and renewable energy consumption impact on environmental quality: a new look at China’s economy. Front. Psychol. 13, 905270. doi:10.3389/fpsyg.2022.905270
Gao, Y., Wang, S., Zhang, C., Xing, C., Tan, W., Wu, H., et al. (2023). Assessing the impact of urban form and urbanization process on tropospheric nitrogen dioxide pollution in the Yangtze River Delta, China. Environ. Pollut. 336, 122436. doi:10.1016/j.envpol.2023.122436
Holdren, J. P., and Ehrlich, P. R. (1974). Human Population and the Global Environment: population growth, rising per capita material consumption, and disruptive technologies have made civilization a global ecological force. Am. Sci. 62, 282–292. PMID: 4832978.
Jiang, X., Zhai, S., Liu, H., Chen, J., Zhu, Y., and Wang, Z. (2022). Multi-scenario simulation of production-living-ecological space and ecological effects based on shared socioeconomic pathways in Zhengzhou, China. Ecol. Indic. 137, 108750. doi:10.1016/j.ecolind.2022.108750
Juntti, M., Costa, H., and Nascimento, N. (2021). Urban environmental quality and wellbeing in the context of incomplete urbanisation in Brazil: integrating directly experienced ecosystem services into planning. Prog. Plann. 143, 100433. doi:10.1016/j.progress.2019.04.003
Kii, M. (2021). Projecting future populations of urban agglomerations around the world and through the 21st century. Urban Sus 1, 10. doi:10.1038/s42949-020-00007-5
Li, G., Fang, C., Li, Y., Wang, Z., Sun, S., He, S., et al. (2022b). Global impacts of future urban expansion on terrestrial vertebrate diversity. Nat. Commun. 13, 1628. doi:10.1038/s41467-022-29324-2
Li, L., Zhang, Y., Zhou, T., Wang, K., Wang, C., Wang, T., et al. (2022a). Mitigation of China’s carbon neutrality to global warming. Nat. Commun. 13, 5315. doi:10.1038/s41467-022-33047-9
Li, W., An, M., Wu, H., An, H., Huang, J., and Khanal, R. (2023). The local coupling and telecoupling of urbanization and ecological environment quality based on multisource remote sensing data. J. Environ. Manage. 327, 116921. doi:10.1016/j.jenvman.2022.116921
Li, Y., Kong, X., and Zhu, Z. (2020). Multiscale analysis of the correlation patterns between the urban population and construction land in China. Sustain. Cities Soc. 61, 102326. doi:10.1016/j.scs.2020.102326
Liu, H., Cheng, Y., Liu, Z., Li, Q., Zhang, H., and Wei, W. (2023). Conflict or coordination? The spatiotemporal relationship between humans and nature on the Qinghai-Tibet Plateau. Earth's Future 11, e2022EF003452. doi:10.1029/2022EF003452
Liu, O. Y., and Russo, A. (2021). Assessing the contribution of urban green spaces in green infrastructure strategy planning for urban ecosystem conditions and services. Sustain. Cities Soc. 68, 102772. doi:10.1016/j.scs.2021.102772
Liu, T., Peng, R., Zhuo, Y., and Cao, G. (2022). China's changing population distribution and influencing factors: insights from the 2020 census data. Acta Geogr. Sin. 77, 381–394. doi:10.11821/dlxb202202008
Liu, Z., Wu, R., Chen, Y., Fang, C., and Wang, S. (2021). Factors of ecosystem service values in a fast-developing region in China: insights from the joint impacts of human activities and natural conditions. J. Clean. Prod. 297, 126588. doi:10.1016/j.jclepro.2021.126588
Mahmoud, S. H., and Gan, T. Y. (2018). Impact of anthropogenic climate change and human activities on environment and ecosystem services in arid regions. Sci. Total Environ. 633, 1329–1344. doi:10.1016/j.scitotenv.2018.03.290
McCool, W. C., Anderson, A. S., Baide, A. J., Gonzalez, T., and Codding, B. F. (2024). Evaluating the relationships between climate change, population pressure, economic intensification, and childhood stress in the Prehispanic Nasca region of Peru. Quatern. Int. 689, 120–134. doi:10.1016/j.quaint.2023.06.003
Molotoks, A., Smith, P., and Dawson, T. P. (2021). Impacts of land use, population, and climate change on global food security. Food Energy Secur 10, e261. doi:10.1002/fes3.261
Myers, N. (1987). Population, environment, and conflict. Environ. Conserv. 14, 15–22. doi:10.1017/S037689290001105X
Qi, W., Liu, S., and Liu, Z. (2022). The novel pattern and driving factors of population spatial distribution on both sides of the “Hu Line” based on seventh census in China. Acta Geogr. Sin. 77, 3023–3040. doi:10.11821/dlxb202212006
Ren, Q., He, C., Huang, Q., Shi, P., Zhang, D., and Güneralp, B. (2022). Impacts of urban expansion on natural habitats in global drylands. Nat. Sustain. 5, 869–878. doi:10.1038/s41893-022-00930-8
Shen, W., Li, Y., Qin, Y., and Cheng, J. (2023). Influencing mechanism of climate and human activities on ecosystem health in the middle reaches of the Yellow River of China. Ecol. Indic. 150, 110191. doi:10.1016/j.ecolind.2023.110191
Silva, J. F., Santos, J. L., Ribeiro, P. F., Marta-Pedroso, C., Magalhães, M. R., and Moreira, F. (2024). A farming systems approach to assess synergies and trade-offs among ecosystem services. Ecosyst. Serv. 65, 101591. doi:10.1016/j.ecoser.2023.101591
Song, X., Feng, Q., Xia, F., Li, X., and Scheffran, J. (2021). Impacts of changing urban land-use structure on sustainable city growth in China: a population-density dynamics perspective. Habitat Int. 107, 102296. doi:10.1016/j.habitatint.2020.102296
The United Nations (2024). World population Prospects 2024. Available at: https://www.un.org/development/desa/pd/node/4324.
Videras, J. (2014). Exploring spatial patterns of carbon emissions in the USA: a geographically weighted regression approach. Popul. Environ. 36, 137–154. doi:10.1007/s11111-014-0211-6
Wang, Q., and Li, L. (2021). The effects of population aging, life expectancy, unemployment rate, population density, per capita GDP, urbanization on per capita carbon emissions. Sustain. Prod. Consump. 28, 760–774. doi:10.1016/j.spc.2021.06.029
Xu, D., Cheng, J., Xu, S., Geng, J., Yang, F., Fang, H., et al. (2022). Understanding the relationship between China’s eco-environmental quality and urbanization using multisource remote sensing data. Remote Sens. 14, 198. doi:10.3390/rs14010198
Xu, D., Yang, F., Yu, L., Zhou, Y., Li, H., Ma, J., et al. (2021). Quantization of the coupling mechanism between eco-environmental quality and urbanization from multisource remote sensing data. J. Clean. Prod. 321, 128948. doi:10.1016/j.jclepro.2021.128948
Xu, F., Wang, Z., Chi, G., and Zhang, Z. (2020). The impacts of population and agglomeration development on land use intensity: new evidence behind urbanization in China. Land Use Policy 95, 104639. doi:10.1016/j.landusepol.2020.104639
Yan, H., Liu, F., Liu, J., Xiao, X., and Qin, Y. (2017). Status of land use intensity in China and its impacts on land carrying capacity. J. Geogr. Sci. 27, 387–402. doi:10.1007/s11442-017-1383-7
Yang, L., Chen, W., Fang, C., and Zeng, J. (2024a). How does the coordinated development of population urbanization and land urbanization affect residents' living standards? Empirical evidence from China. Cities 149, 104922. doi:10.1016/j.cities.2024.104922
Yang, L., Xu, H., Pan, S., Chen, W., and Zeng, J. (2024b). Identifying the impact of global human activities expansion on natural habitats. J. Clean. Prod. 434, 140247. doi:10.1016/j.jclepro.2023.140247
Zeng, J., Cui, X., Chen, W., and Yao, X. (2023). Impact of urban expansion on the supply-demand balance of ecosystem services: an analysis of prefecture-level cities in China. Environ. Impact. Asses. 99, 107003. doi:10.1016/j.eiar.2022.107003
Zeng, X., Xiang, H., Xue, Y., Su, Y., Tong, Y., and Mao, Z. (2021). A scenario-based optimization frame to adjust current strategy for population-economy-resource-environment harmony in an urban agglomeration, China. Sustain. Cities Soc. 67, 102710. doi:10.1016/j.scs.2021.102710
Zhang, H., Wang, Z., Liu, J., Chai, J., and Wei, C. (2019). Selection of targeted poverty alleviation policies from the perspective of land resources-environmental carrying capacity. J. Rural. Stud. 93, 318–325. doi:10.1016/j.jrurstud.2019.02.011
Zhang, L., Li, W., and Streimikiene, D. (2020). Measurement of population carrying capacity based on a P–S model: a case study of Zhejiang province. Amfiteatru Econ. 22 (54), 552–566. doi:10.24818/EA/2020/54/552
Zhao, C., and Wang, B. (2022). How does new-type urbanization affect air pollution? Empirical evidence based on spatial spillover effect and spatial Durbin model. Environ. Int. 165, 107304. doi:10.1016/j.envint.2022.107304
Zheng, Q., Ha, T., Prishchepov, A. V., Zeng, Y., Yin, H., and Koh, L. P. (2023). The neglected role of abandoned cropland in supporting both food security and climate change mitigation. Nat. Commun. 14, 6083. doi:10.1038/s41467-023-41837-y
Zhou, T., Liu, H., Gou, P., and Xu, N. (2023). Conflict or Coordination? measuring the relationships between urbanization and vegetation cover in China. Ecol. Indic. 147, 109993. doi:10.1016/j.ecolind.2023.109993
Keywords: population stress, EEQ, spatial regression, population pressure zone identification, China
Citation: Zhong M, Liu Q and Hu X (2025) Understanding the county-level relationship between population change and ecological environment quality dynamic in China, 2000–2020. Front. Environ. Sci. 13:1513998. doi: 10.3389/fenvs.2025.1513998
Received: 25 October 2024; Accepted: 06 January 2025;
Published: 22 January 2025.
Edited by:
Qi Zhang, University of North Carolina at Chapel Hill, United StatesReviewed by:
Eve Bohnett, University of Florida, United StatesJunyi Chen, Kunming University of Science and Technology, China
Copyright © 2025 Zhong, Liu and Hu. This is an open-access article distributed under the terms of the Creative Commons Attribution License (CC BY). The use, distribution or reproduction in other forums is permitted, provided the original author(s) and the copyright owner(s) are credited and that the original publication in this journal is cited, in accordance with accepted academic practice. No use, distribution or reproduction is permitted which does not comply with these terms.
*Correspondence: Mingxing Zhong, emhvbmdteEB4eW51LmVkdS5jbg==