 Shun Li
 Jie Hua
 Xin Chi2
94% of researchers rate our articles as excellent or good
Learn more about the work of our research integrity team to safeguard the quality of each article we publish.
Find out more
ORIGINAL RESEARCH article
Front. Environ. Sci., 12 March 2025
Sec. Environmental Policy and Governance
Volume 13 - 2025 | https://doi.org/10.3389/fenvs.2025.1513751
This article is part of the Research TopicAdvancing Carbon Reduction and Pollution Control Policies Management: Theoretical, Application, and Future ImpactsView all 36 articles
Introduction: As the world’s largest carbon emitter, China’s decarbonization efforts are critical to global climate governance. Existing studies have mainly focused on carbon emissions at the national level in China, with less attention paid to the provincial level, especially in analyzing less developed regions in northwest China (e.g., Qinghai Province). This study explores specific carbon reduction pathways for less developed provinces, represented by Qinghai Province, by analyzing in depth the potential carbon emission risks in the province.
Methods: Using data from Qinghai Province’s 14th Five-Year Plan and Vision 2035 documents, we developed three carbon reduction scenarios (baseline, moderate, and stringent). We used the extended STIRPAT (Stochastic Impacts of Population, Affluence, and Technology Regression) model and ridge regression to analyze the impacts of five key drivers: population size, primary electricity utilization, GDP per capita, primary industry output, and agricultural fertilizer use. Scenario projections are complemented by advanced visualization techniques to improve policy relevance.
Results: Our analysis reveals three important findings: (1) an environmental Kuznets curve pattern emerges between GDP per capita and carbon emissions; (2) population growth is recognized as a major driver of carbon emissions, with each 1% increase in population leading to a 3.184% rise in carbon emissions; and (3) the strategic development of primary electricity shows a huge potential for emission reduction. With stringent environmental protection measures, Qinghai can cap its carbon emissions by 2030, in line with national climate goals.
Discussion: These findings challenge conventional assumptions about underdeveloped regions’ climate roles, demonstrating that targeted provincial strategies can significantly contribute to national decarbonization goals. The inverted U-curve relationship suggests economic development and emission reduction can be synergistic post-threshold GDP levels. We recommend prioritized investments in renewable energy infrastructure and population-optimized urbanization policies. This provincial-level modeling approach provides a replicable framework for other developing regions balancing economic growth with climate commitments.
The global acceleration of industrialisation and urbanisation has intensified carbon emissions, positioning them as a pivotal challenge in addressing climate change. The 2015 Paris Agreement underscored this urgency by setting a long-term temperature control goal, urging nations to strive to limit global warming to 1.5°C. Achieving this target necessitates unprecedented global efforts, including rapid decarbonisation and enhanced policy measures (Rogelj et al., 2018). Despite such initiatives, the global greenhouse effect remains unmitigated, highlighting the need for targeted interventions. As the largest developing nation and the world’s leading carbon emitter, China’s efforts in carbon reduction hold critical global significance. Comprehensive datasets and analyses of China’s carbon emissions from 1997 to 2015 have spotlighted its pivotal role in global mitigation strategies (Shan et al., 2018).
China’s ambitious “dual-carbon” targets—peaking emissions by 2030 and achieving carbon neutrality by 2060—reflect its commitment to sustainable development and global climate governance. However, existing research has predominantly focused on national-level analyses or economically advanced provinces, often neglecting the carbon dynamics of less developed regions (Yang et al., 2022; Wang et al., 2021; Ma et al., 2021; Zhang et al., 2022). Studies investigating regional disparities reveal that less developed provinces, such as those in northwestern China, possess significant yet underexplored carbon potential (Zha et al., 2010; Liu et al., 2011; Zhu et al., 2012; Fan et al., 2013; Li et al., 2024; Wang et al., 2016; Chandler et al., 2002). For instance, while provinces like Fujian and Guangdong have been examined for their carbon drivers, Qinghai Province remains underrepresented in these analyses despite its unique socio-economic and environmental profile.
Qinghai Province, located in northwestern China, exemplifies the intricate interplay between economic growth, resource utilisation, and environmental sustainability. With a GDP ranking 30th nationwide and carbon emissions accounting for only 0.5% of the national total, Qinghai represents a microcosm for studying the nuanced drivers of carbon emissions in less developed regions (Economic Performance, 2023; Chen et al., 2024; Zhao X. et al., 2022; Guan et al., 2021; Tian et al., 2024). Its socio-economic structure, marked by a rising secondary industry share and ambitious clean energy initiatives, presents a compelling case for examining the balance between industrialisation and environmental stewardship (Chen et al., 2020; Liu et al., 2021; National Development and Reform Commission of the People’s Republic of China, 2022; O rganic et al., 2024; Xiong et al., 2016; Si et al., 2024; World Development, 2021; Carbon-Neutral Future, 2022; National Bureau of Statistics, 2023).
However, existing studies often overlook critical dimensions in Qinghai’s carbon emission dynamics. While methodologies such as the Tapio decoupling model and logarithmic mean division index (LMDI) decomposition have revealed correlations between economic development and carbon emissions (Zhao X. et al., 2022), their applicability to less developed provinces require further refinement. Additionally, despite Qinghai’s strides in green agricultural practices, studies have not thoroughly explored the localised impacts of emission reduction initiatives (Liu et al., 2021; National Development and Reform Commission of the People’s Republic of China; O rganic et al., 2024). Furthermore, Qinghai’s clean energy potential—88.2% of its total power generation is from renewable sources—remains insufficiently analysed in terms of its mitigating effects on carbon emissions (Si et al., 2024; World Development, 2021; Carbon-Neutral Future, 2022; National Bureau of Statistics, 2023; Zhao C. et al., 2022).
Research methodologies employed in previous studies also present limitations. Analyses often lack advanced visualisation techniques to effectively communicate findings, and broad regional studies dilute the specificities of less developed provinces like Qinghai (Fang et al., 2019). The scalable STIRPAT model, an extension of the foundational IPAT framework, provides an opportunity to address these gaps by capturing the intricate causal relationships in environmental dynamics (Rokhmawati et al., 2024; Dietz and Rosa, 1997; Shahbaz et al., 2016). The Environmental Kuznets Curve (EKC) hypothesis further complements this approach, offering insights into the interplay between economic growth and environmental degradation (Hassan et al., 2024; Aminzadeh et al., 2021). However, these theoretical frameworks have rarely been applied in conjunction with robust statistical methods to study Qinghai Province’s unique characteristics.
To address these limitations, this study employs the extended STIRPAT model and EKC hypothesis to examine the drivers of carbon emissions in Qinghai Province. By focusing on key factors such as economic growth, energy development, and agricultural practices, the study aims to elucidate the main contributors to carbon emissions and evaluate the province’s progress toward its carbon peak target. The study also incorporates advanced econometric techniques, including the ADF test and Johansen’s cointegration equation, to ensure data accuracy and mitigate potential methodological biases (Lv and Wang, 2016; Adewale Alola, 2021; Li J. et al., 2023; Wang et al., 2019).
In doing so, this research fills critical gaps in existing literature, providing nuanced insights into the carbon dynamics of less developed regions. The findings are expected to inform targeted policy measures, facilitating Qinghai’s alignment with China’s broader “dual carbon” goals and contributing to global climate change mitigation efforts.
This focused analysis lays the groundwork for the subsequent section, which formulates specific hypotheses to investigate Qinghai Province’s carbon emission drivers.
Against the backdrop of China’s dual-carbon target and the unique socio-economic and environmental characteristics of Qinghai Province, this study aims to explore the drivers of carbon emissions in less developed regions. The extended STIRPAT model and the Environmental Kuznets Curve (EKC) hypothesis are the theoretical foundations of this study. The STIRPAT model, an extension of the IPAT framework, provides a powerful analytical tool to study the impacts of human activities on environmental pressures, especially carbon emissions (York et al., 2003). Meanwhile, the EKC hypothesis offers insights into the relationship between economic growth and environmental degradation, proposing an inverted U-shaped curve that suggests environmental quality improves after a certain level of economic development (Dinda, 2004).
Based on these theoretical frameworks, the following hypotheses are proposed:
Hypothesis 1. Economic growth is the most important driver of carbon emissions in Qinghai Province.
As industrialisation accelerates in Qinghai Province, the demand for energy-intensive activities is expected to increase, leading to a rise in carbon emissions. This hypothesis aligns with previous studies demonstrating that economic growth is a primary driver of carbon emissions, particularly in developing regions (Wang and Zhang, 2021).
Hypothesis 2. Strong development of primary electricity will effectively mitigate carbon emissions.
This assumption is based on the premise that clean energy sources such as solar, wind, and hydropower can significantly reduce carbon emissions. The abundance of clean energy resources in Qinghai Province and its strategic position in China’s clean energy policy provide a unique opportunity to test this hypothesis. The extended STIRPAT model incorporates energy-related variables to provide a nuanced analysis of the impact of primary electricity development on carbon emissions. A study validating the dual role of renewable energy in reducing carbon emissions and promoting economic growth supports this premise, providing essential guidance for energy policy formulation (Saidi and Omri, 2020).
Hypothesis 3. Qinghai Province’s per capita GDP and carbon emissions support the EKC hypothesis.
This hypothesis is based on the EKC framework, which suggests that environmental degradation initially worsens with economic growth but eventually improves at higher income levels. By examining the relationship between GDPs per capita and carbon emissions in Qinghai Province, this study seeks to verify the applicability of the EKC hypothesis in less developed regions. A study examining the relationship between economic complexity and carbon emissions in EU countries, based on the EKC framework, supports the hypothesis’s applicability in different contexts (Neagu, 2019).
Hypothesis 4. Under at least one scenario, Qinghai Province will reach its carbon peak in 2030.
This scenario evaluates the feasibility of Qinghai Province achieving China’s dual-carbon target. By modelling three economic development scenarios—high economic growth (FLW), medium economic growth (FBU), and green development (FHG)—this study assesses the effectiveness of policy interventions in reducing carbon emissions. Previous studies employing scenario analysis have demonstrated that targeted policy interventions can enable Chinese provinces to achieve their carbon peak targets (Sun et al., 2022).
Based on these hypotheses, this study aims to reveal the impact of various factors on regional carbon emissions. The findings are expected to provide an empirical basis for formulating and optimising carbon emission reduction policies in Northwest China, as well as offer a reference for nationwide carbon emission management strategies.
Our study covers data collection, cleaning, and analysis. The collection included three official data sources: the Qinghai Provincial Bureau of Statistics, the Qinghai Provincial Statistical Yearbook, and the China Statistical Yearbook and the data cleaning was carried out using the screening method (the observation time series of the model is between 2001 and 2021). The purpose of this study is to predict the carbon emissions in Qinghai Province by building the extended STIRPAT model, which contains several variables, including the amount of agricultural fertiliser used in Qinghai Province. Firstly, all the variables in the model were tested for smoothness using the ADF (Augmented Dickey-Fuller) method, and the Johansen cointegration test was used to verify the cointegration of the variables that did not pass the smoothness test, and the cointegration of the variables that did not pass the smoothness test. Tests for cointegration of the variables, grey scale correlation, and VIF analysis of the smoothed data revealed strong correlations and multicollinearities between some of the variables involved in this model. To avoid covariance and overfitting, this study used ridge regression to construct the equations to predict the carbon emissions in Qinghai Province from 2022 to 2035. Three scenarios, FLW, FAU and FHG, are simulated in this study, and the specific time of Qinghai Province’s arrival at the carbon peak and the carbon emissions under the three scenarios are compared to verify whether they can meet the target of the Qinghai government to reach the carbon peak before 2030, and to put forward reasonable suggestions.
Data was sourced from three reputable official datasets that are pertinent to the research objectives and inquiries. The selection of publicly accessible datasets was strategic, as they offer greater transparency and ease of access, facilitating the research community’s validation and replication of results. Such datasets, issued by governmental bodies, international organisations, or authoritative entities, are endowed with heightened credibility and authority. Furthermore, these sources are typically subject to rigorous quality control and oversight, which minimises the potential for data inaccuracies or manipulation. The comprehensive nature of these datasets, with minimal gaps, also helps to mitigate the effects of data bias.
We collected primary electricity production and total primary energy production from the Qinghai Provincial Bureau of Statistics (Bureau of Statistics, 2024), population size, GDP per capita, coal production, industrial output, primary industry output, total energy consumption, fertiliser use, and related data from the Qinghai Provincial Statistical Yearbook (Statistical Yearbook, 2023), and data related to the level of urbanisation from the China Statistical Yearbook (China Statistical, 2023).
The study implemented an outlier screening technique to bolster the data’s reliability. This involved the initial identification of outliers, followed by their subsequent removal to mitigate their effects on data analysis and modelling (Soule et al., 2005).
The fundamental concept of the outlier screening method is to pinpoint and eliminate data points that deviate significantly from the norm within a dataset, thereby minimising their influence on subsequent analysis and modelling. This approach is predicated on establishing a set of thresholds corresponding to each variable’s intrinsic meaning and context. Data points that fall outside these predefined thresholds are classified as outliers and are earmarked for additional processing. For instance, in the case of Qinghai Province’s fertiliser usage data for the year 2000, a null value was encountered, leading to its exclusion from the dataset.
Table 1 shows the data sources, and Figure 1 shows the administrative divisions and geographic location of Qinghai Province, which is mapped by ArcMap 10.8.
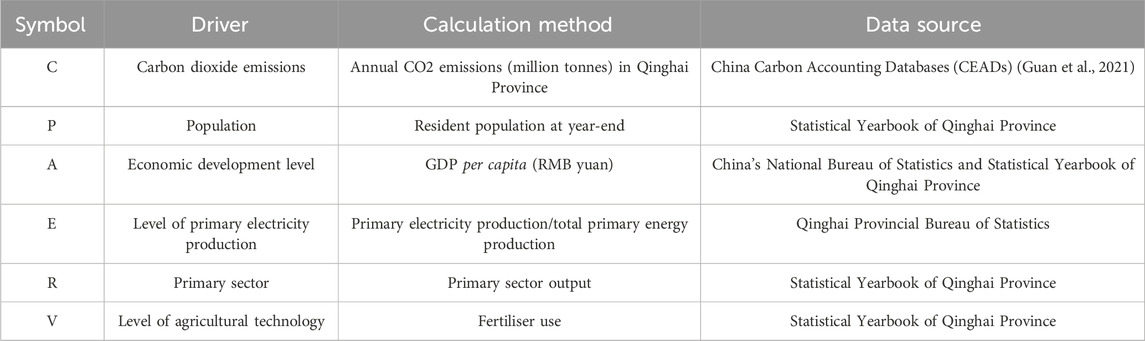
Table 1. Significance and source of the six independent variable representations.
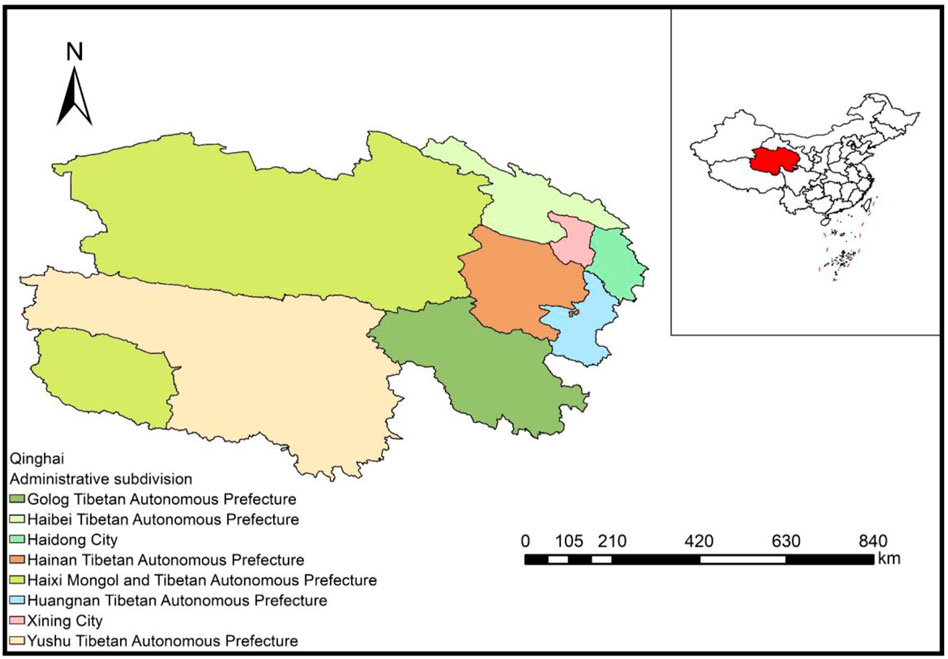
Figure 1. The rows and districts and geographic location of Qinghai Province.
In this study, PyCharm 2024.2.1 was used to plot the trend of total population and urbanisation rate in Qinghai Province from 2010 to 2022, as shown in Figure 2. The total population of Qinghai Province grew from 5,634,700 in 2010 to 5,950,000 in 2022, with an average annual growth rate of about 0.44 per cent. Although the growth rate is relatively flat, it shows an overall trend of steady growth. It is worth noting that the population growth rate in Qinghai Province has accelerated in recent years, which may be related to factors such as the province’s economic development, policy guidance and population migration. The urbanisation rate in Qinghai Province rose from 44.72 per cent in 2010 to 61.51 per cent in 2022, with an average annual growth rate of approximately 1.33 percentage points.
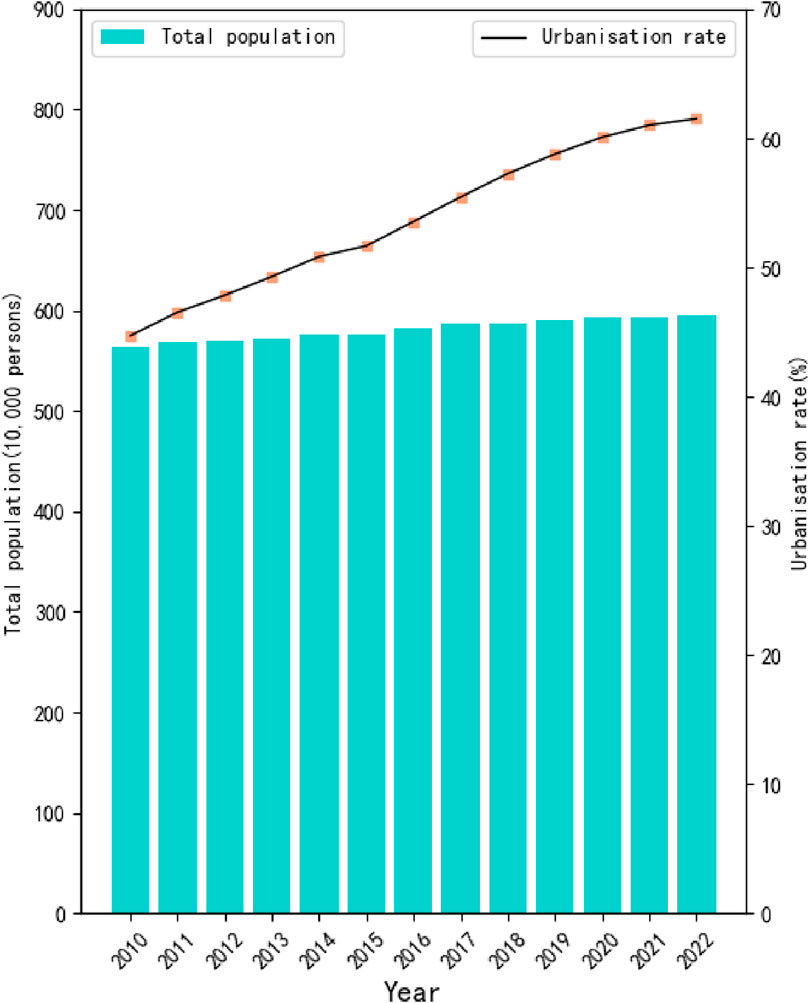
Figure 2. Trends in resident population and urbanisation rate in qinghai province, 2010-2022.
In this study, PyCharm 2024.2.1 was used to map the trend of disposable income of all residents in various parts of Qinghai Province from 2010 to 2022, as shown in Figure 3. Disposable income per capita in all regions of Qinghai Province has grown significantly. Although the growth rate fluctuates between years and regions, the overall trend of positive growth has been maintained. In the initial period (e.g., 2010–2015), the growth rate may be relatively fast, reflecting a phase of rapid economic development. Over time, the growth rate may gradually stabilise or slow down slightly, which may be related to a number of factors such as economic restructuring, policy changes and the external environment. There are differences in growth rates between different regions. Generally speaking, regions with relatively developed economies and optimised industrial structures (such as Xining City, with an annual growth rate of 12.3 per cent) are likely to grow faster. In contrast, regions with relatively backward economies and a single industrial structure (such as some of the Tibetan Autonomous Prefectures, with an annual growth rate of 10.4 per cent) are likely to grow at a slower rate.
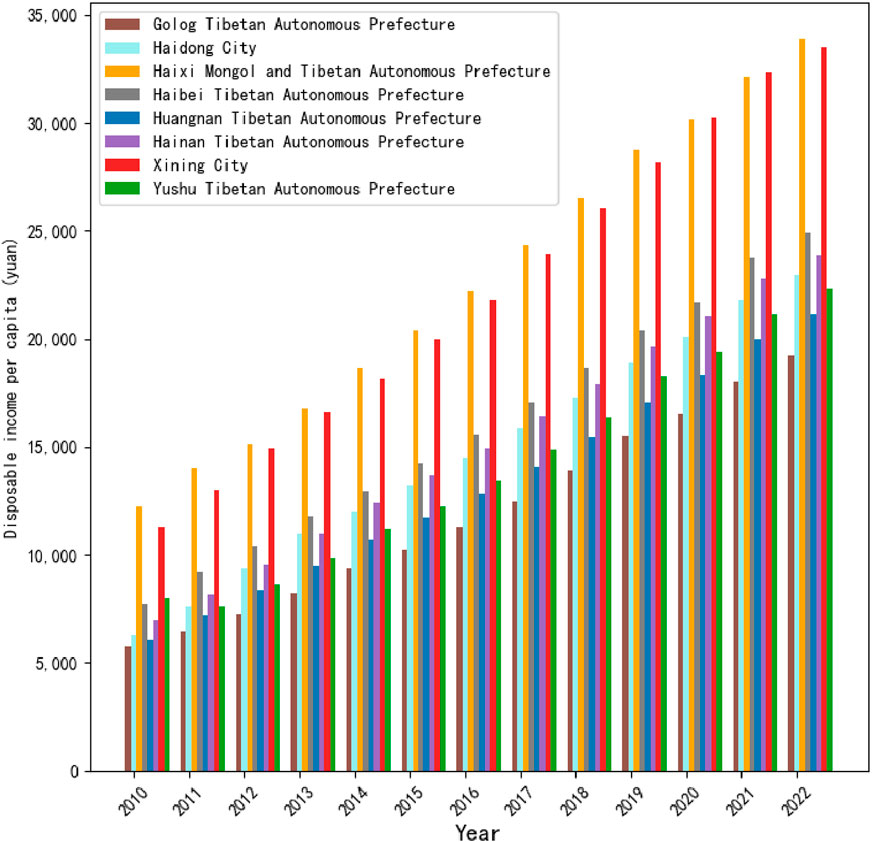
Figure 3. Trends in disposable income of all residents in Qinghai Province by region, 2010-2022.
Utilising Tableau 2023, longitudinal trend plots were created for six key variables. These plots aimed to provide a holistic overview of the variables’ progression and to discern which variables might hold greater significance than others over time.
For the construction of these trend graphs, data from 2001 to 2021 was initially gathered and processed. Subsequent steps included data aggregation, filtering, and grouping to showcase the interrelationships and trends among the variables more effectively. In the graph design phase, considerations were given to elements such as colour schemes, labelling, and line styles to ensure a clear and precise representation of the variables’ changes.
The trend charts display the trajectories of the six variables from 2001 to 2021, enabling viewers to observe their development and recognise significant patterns.
To ascertain the reliability of the input data, the study employs the ADF (Augmented Dickey-Fuller) test to assess the stability of the independent variables. This test extends the autoregressive component of the series using a regression model and evaluates the regression’s underlying assumptions. The ADF test ascertains the presence of a unit root in the series by examining if the autoregressive coefficients significantly deviate from one. A unit root’s presence signifies a non-stationary series, whereas its absence indicates stationarity (Liang et al., 2021).
According to Table 2, when the significance is less than 0.05, it can be judged as a smooth series by the ADF test, and from this principle, we find that the three independent variables entered the model are non-smooth series.
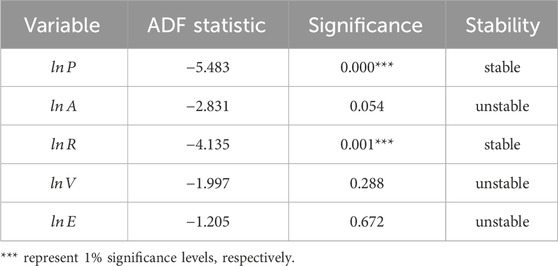
Table 2. The results of the ADF (Augmented Dickey-Fuller) test for the model variables.
The non-stationary series will cause pseudo-regression. To avoid this problem, three non-stationary series will be used for the cointegration test. Engel-Granger (E.G.,) cointegration test method is only applicable to judge the cointegration between two independent variables. Johansen cointegration test applies to three or more independent variables, and the method is more explanatory of the independent variables (Grabowski and Welfe, 2016). In this study, we used the Johansen cointegration test. The Johansen cointegration test’s interpretation dictates that the null hypothesis is to be rejected if the trace statistic surpasses the 5% critical value. As depicted in Table 3, the hypothesis of no more than one cointegration relationship among the variables is rejected, thereby affirming the presence of a cointegration relationship among them.
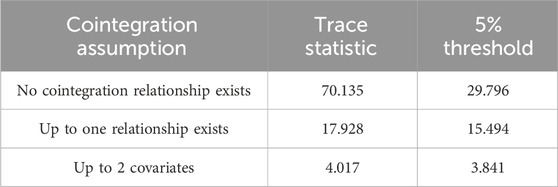
Table 3. The results of the Johansen cointegration test.
The data series entered into the model passed the ADF test with the Johansen cointegration test, and these methods ensure the smoothness of the data. In this study, to further ensure the reliability of the model, we developed a grey correlation analysis model, which is represented as Equation 1:
The Grey Relational Analysis (GRA) model is a multivariate analysis method used to explore the correlation between different variables. The core idea of the model is to identify the degree of similarity, association, and influence between variables by calculating the degree of association between them (Gerus-Gościewska and Gościewski, 2022).
where the reference series
After establishing the grey correlation analysis model, we summarised the grey correlation coefficient matrix, which is used to measure the degree of similarity between two sequences. Its main purpose is to identify the key factors affecting the target variable by calculating the correlation between sequences of different variables. This complements our analytical approach and provides additional data clustering and correlation analysis perspectives. We found that there are some coefficients higher than 0.9 in the grey correlation coefficient matrix, which suggests that there is a strong correlation between these data series, and there may be a problem of multicollinearity (Mausam et al., 2023).
To mitigate the impact of multicollinearity on the regression model, the variance inflation factor (VIF) for the six variables was evaluated. Detecting multicollinearity involves examining if the VIF surpasses 10, signifying its presence. A VIF exceeding 100 points to severe multicollinearity, may render the ordinary least squares (OLS) regression method inapplicable due to the potential for unstable or inexplicable coefficient estimates. Ridge regression tackles multicollinearity by incorporating a regularisation term, thereby enhancing model stability and generalizability. Adjusting the ridge parameter diminishes the influence of multicollinearity on the coefficient estimates, yielding more dependable outcomes (Li et al., 2024).
Research by (Firinguetti et al., 2017) indicated that ridge regression offers superior explanatory power compared to PLS regression, particularly with a limited number of independent variables (Firinguetti et al., 2017). Consequently, ridge regression was selected as the analytical technique to ensure the precision and reliability of the model.
Having confirmed the dataset’s suitability for linear regression analysis, the study applied the STIRPAT model. This model can be mathematically represented as Equation 2:
Where
Within the model framework, the variable I denotes the environmental impact, with P, A, and T representing population size, GDP per capita, and energy intensity, respectively. The constant term of the model is denoted by
Where
This extended STIRPAT model (Lohwasser et al., 2020) was then used to examine the relationship between annual CO2 emissions and various independent variables (including population, GDP per capita, primary industry output, fertiliser use, and primary electricity production as a percentage of total energy production) in Qinghai Province employing linear regression, which is represented as Equation 4:
Where
Ridge trace plots were generated using SPSS 24.0 to ascertain the minimum value of K, at which point the standardised regression coefficients of the variables become stable. These plots offer a visual aid for selecting suitable ridge parameters and enhancing model performance. Origin was utilised to graph the comparison between the model’s fitted and actual carbon emissions values, with the visualisation technique facilitating a more precise assessment of the model’s accuracy.
Drawing from the 14th Five-Year Plan data for Qinghai Province, three carbon emission modelling scenarios were devised: the high economic growth scenario (FLW), the baseline scenario (FBU), and the green scenario (FHG). The green scenario incorporates stricter environmental protections, such as reduced fertiliser usage and controlled primary industry output.
By integrating data from these three carbon emission simulation scenarios into the ridge regression model, carbon emissions for Qinghai Province can be forecasted. PyCharm2023 software was employed to visualise the predicted data, allowing for an intuitive examination of trends, changes, and patterns within the prediction outcomes. This visualisation provides a more comprehensive understanding of the model’s predictive capabilities for carbon emissions in Qinghai Province.
Using the various data visualisation techniques outlined, we have plotted graphs to help illustrate our findings.
Figure 4 shows the trend of the six variables included in this model from 2001 to 2021. According to Figure 4, we find that C, A, R, P, and E show an overall increasing trend, and V shows an overall decreasing trend between 2001 and 2021.
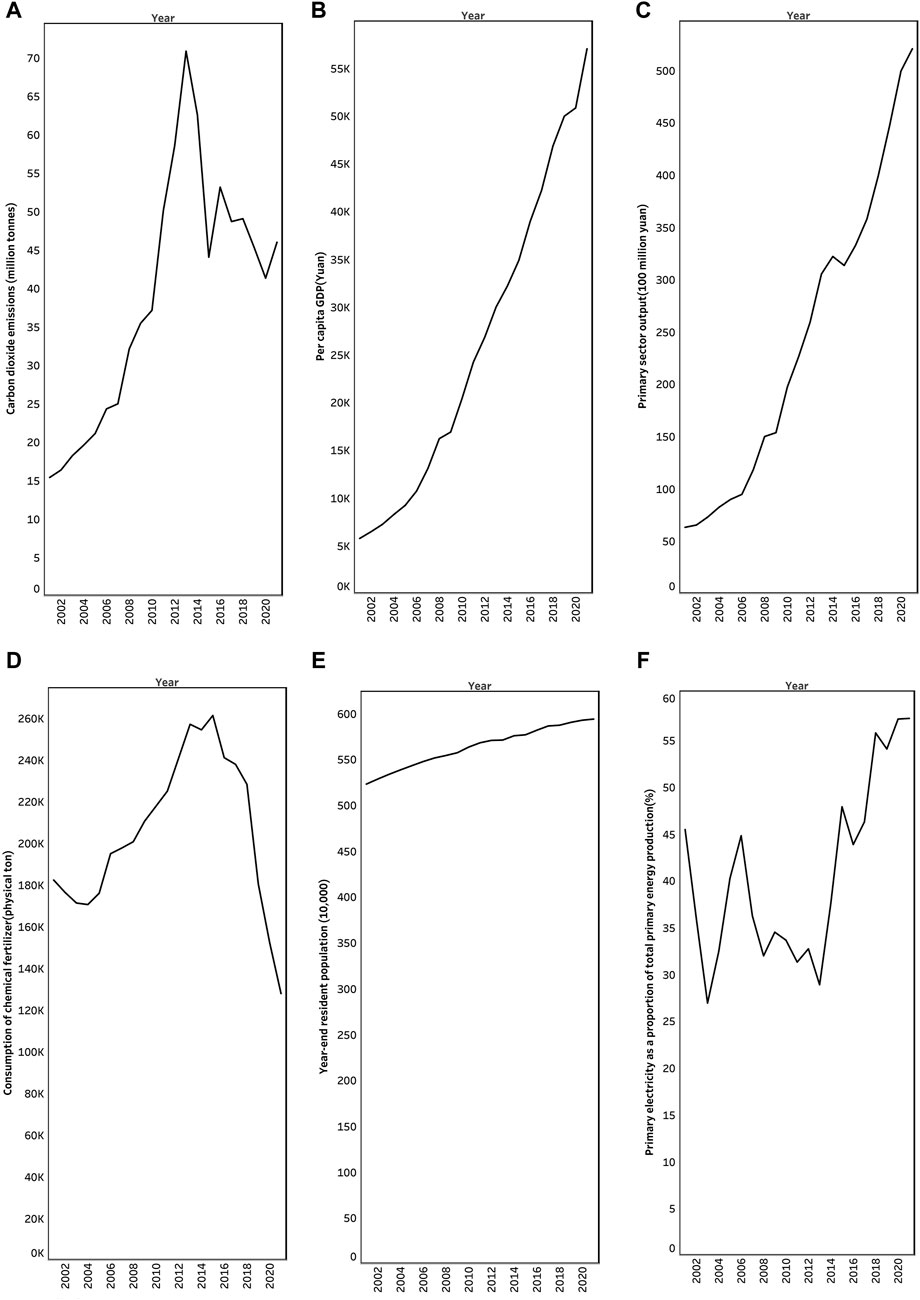
Figure 4. Trends in annual carbon dioxide emissions and their influencing factors in Qinghai Province, 2001-2021. (A) Carbon dioxide emissions. (B) Economic development level. (C) Primary sector output. (D) Fertiliser use. (E) Resident population. (F) Level of primary electricity.
Table 2 presents the results of the ADF test, which shows that A, V and E are not smooth series (p > 0.05) while all other variables are smooth (p < 0.05).
Table 3 displays the outcomes of the Johansen cointegration test, which validates the existence of a robust, long-term association among the variables. The test results indicate a stable linear relationship, reinforcing the linear regression analysis findings.
Table 4 shows the matrix of grey correlation coefficients between the six variables in the model.

Table 4. Grey correlation coefficients for six variables.
According to the grey correlation analysis model in Table 4, we found that the grey correlation coefficients between some of the variables are higher than 0.9, presenting a strong correlation, so we tested the variables entered the model for multiple covariance detection (VIF), and the test results are shown in Table 5.
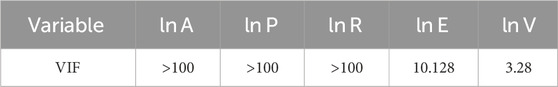
Table 5. Results of covariance detection between multiple variables.
In multicollinearity detection, when VIF>10 indicates the existence of covariance between variables, and when VIF>100 indicates the existence of severe covariance. According to Table 5, we found that some of the variables have serious multicollinearity. To avoid the effect of multicollinearity on the model’s reliability, we used ridge regression to construct the prediction model. Ridge regression deals with the problem of multicollinearity through the introduction of the regularisation term, and it performs well in terms of both stability and generalisation ability, and it has good explanatory power of the variables (Firinguetti et al., 2017).
Table 6 shows the results of the Shapiro-Wilk test for carbon dioxide emissions in Qinghai Province, and Figure 5 illustrates the standard Q–Q plot derived from the Shapiro–Wilk test, which verifies that the dataset utilised in this study conforms to a normal distribution, with a p-value of 0.122 exceeding the 0.05 threshold. This affirmation permits the execution of linear regression analysis on the data.

Table 6. Results of Shapiro-Wilk test.
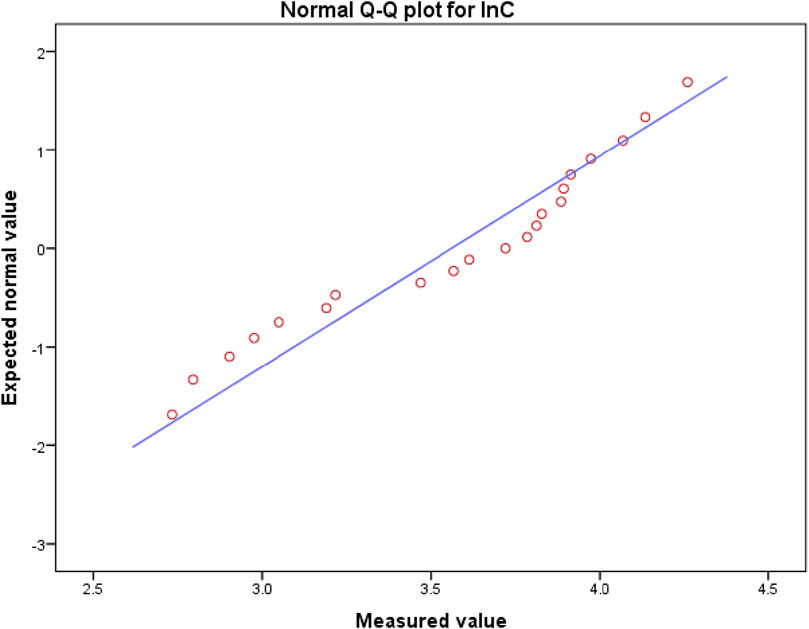
Figure 5. Standard Q–Q plot of annual CO2 emissions.
Table 7 illustrates the projected contribution of each input variable to the model’s value-added between 2021 and 2030, with adjustments made following Qinghai Province’s 14th Five-Year Plan.
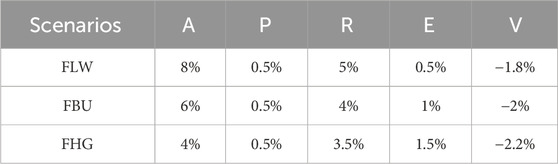
Table 7. The qinghai province CO2 emission control strategies: SLA, BAU, and VEH modelling policies.
Table 8 displays the findings from the ridge regression analysis. The F-value derived from the ridge regression, as shown in Table 8, was determined to be highly significant, with a p-value less than 0.01, signifying the statistical significance of the regression model. The R2 value of 0.952 suggests that the model accounts for the majority of the influential factors effectively, with the fitted data points closely aligning with the regression line. This alignment denotes a robust performance and high reliability of the model. The regression equation is as follows:
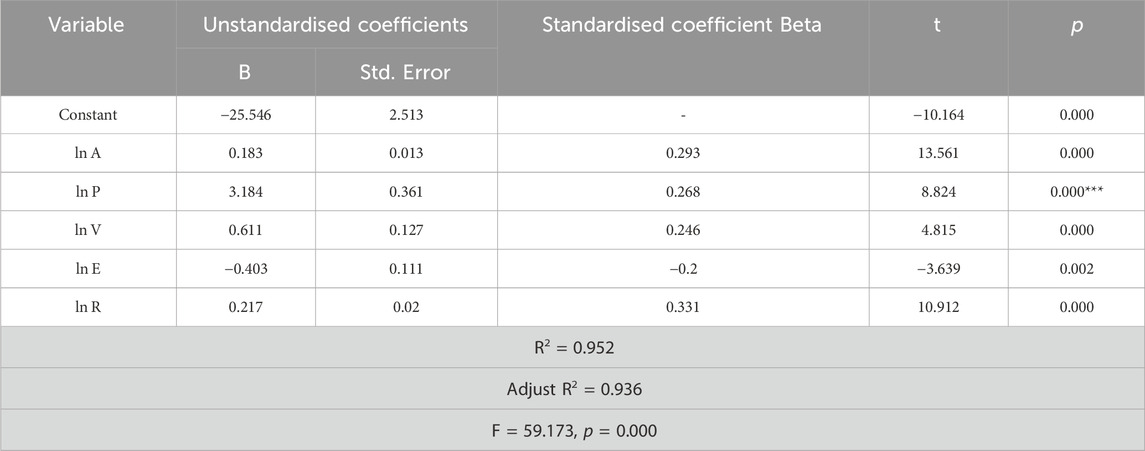
Table 8. The results of the ridge regression analysis.
Projections of CO2 emissions in Qinghai Province based on the extended STIRPAT model:
Based on Equations 5, 6, it can be concluded that the independent variables in the model have a significant effect on the annual carbon dioxide emissions in Qinghai Province. Among these factors, the most influential one is the population size, which increases carbon emissions by 3.184 per cent for every 1 per cent increase. The weakest factor is the level of economic development, with carbon emissions rising by 0.183 per cent for every 1 per cent increase.
Figure 6A depicts the correlation between the regression coefficients and the K value, with the Y-axis representing the standardised coefficients of the independent variables and the X-axis representing the K value. The selection criterion for K is based on the smallest value at which the standardised regression coefficients of the independent variables begin to stabilise. Figure 6B shows the relationship between R2 and K value, while a reference line is set around 0.172. When the coefficient is before 0.172, it fluctuates a lot, and when it passes 0.172, the independent variable’s standardised coefficient gradually stabilises.
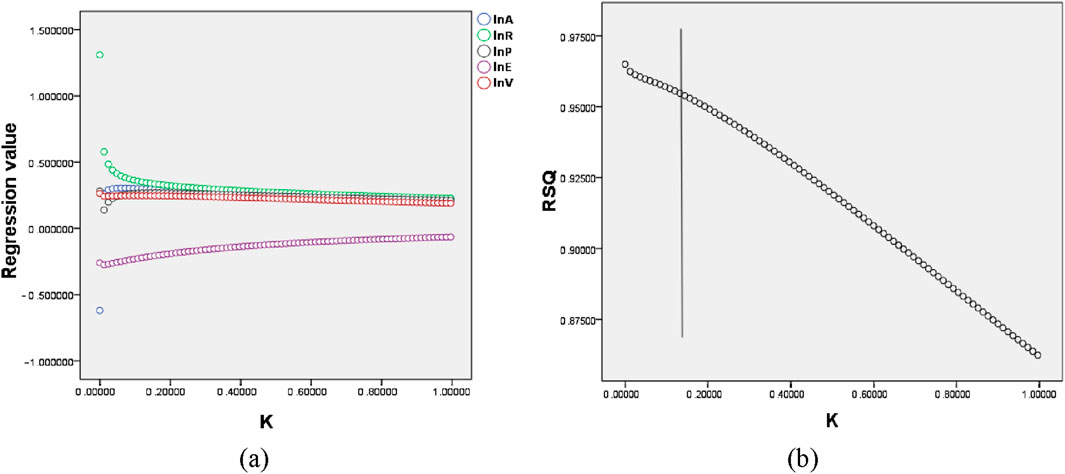
Figure 6. The ridge traces of the model variables, the relationship between R2, and the ridge regression coefficient K (A) illustrates the link between the regression estimates of the variables and the ridge regression coefficient K, while (B) details the connection between the model’s R2 value, indicative of its goodness-of-fit, and the ridge regression coefficient K.
Figure 7 Juxtaposes the fitted and actual values of carbon emissions, where the black curve signifies the actual values, the red curve represents the fitted values, and the cyan-filled area denotes the discrepancy between the fitted and actual values. Analysis of Figure 7 reveals that the fitted curve closely mirrors the actual curve, with a minimum error rate of 0.09% and an average error rate below 8.3%. This proximity suggests a high degree of reliability for the fitted curve.
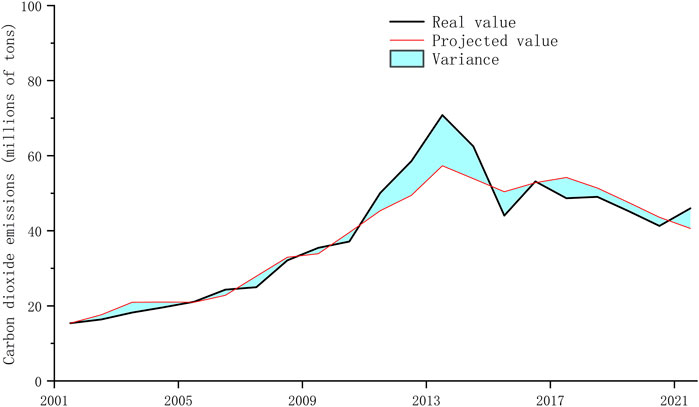
Figure 7. Comparison of predicted and actual values from ridge regression.
Figures 8A–C show three scenarios of carbon emissions and GDP per capita projections for Qinghai Province from 2022 to 2035, highlighting the temporal fluctuations in emissions and GDP per capita. The FHG scenario predicts an earlier peak in carbon emissions, specifically before 2030, whereas the FBU and FLW scenarios do not project such a turning point within the same timeframe. Figures 8A–C also show the curvilinear relationship between expected GDPs per capita and carbon emissions in Qinghai Province over the same period. It is evident that as per capita wealth increases, environmental pollution peaks and subsequently declines, a pattern reflected in the inverted U-shaped curve. This trend aligns with the Environmental Kuznets Curve (EKC) hypothesis (Chen et al., 2019; Tenaw and Beyene, 2021; Dogan and Inglesi-Lotz, 2020).
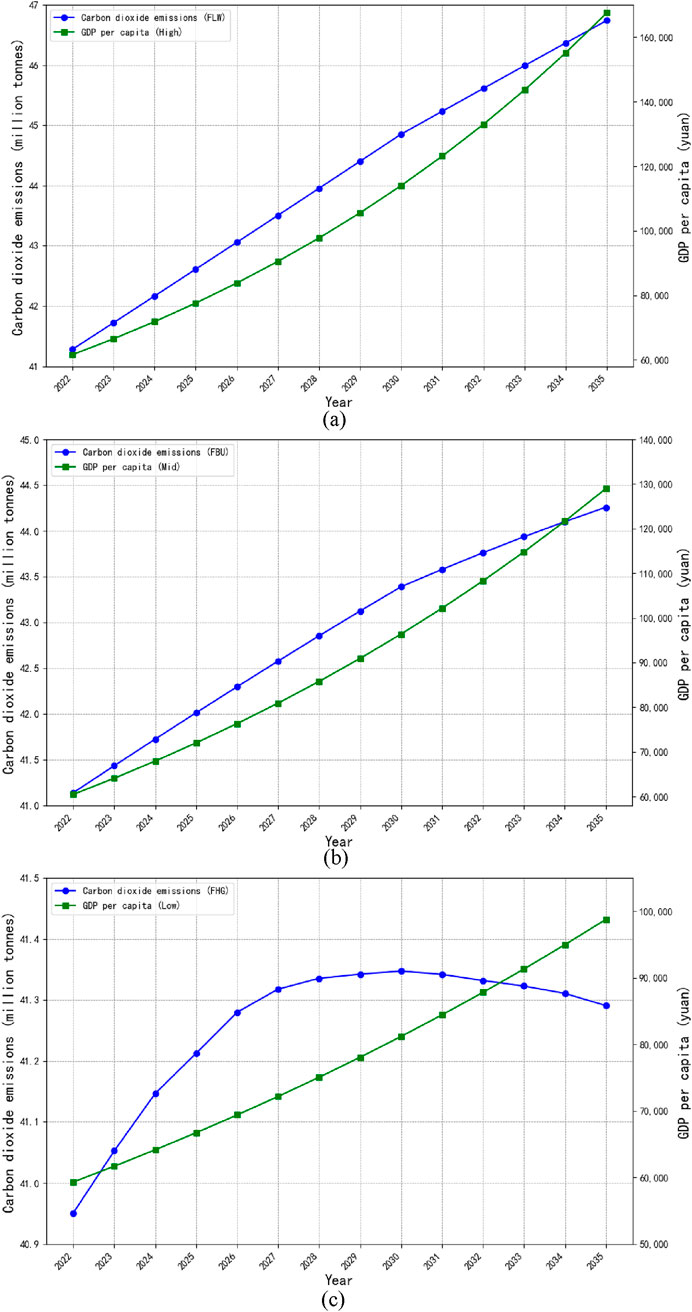
Figure 8. Carbon emissions and GDP per capita in qinghai province under three policy scenarios, 2022-2035. (A) FLW-High. (B) FBU-Mid. (C) FHG-Low.
This study examines the factors influencing carbon emissions in Qinghai Province using panel data from 2001 to 2021. The extended STIRPAT model revealed that population size is the primary positive driver of carbon emissions, while GDP per capita has the weakest influence. Under the three economic growth scenarios (FLW, FBU, FHG), Qinghai’s carbon emissions are projected to peak between 41.1 and 46.7 million tons by 2030, with only the FHG scenario achieving China’s peak carbon emission target within the specified timeframe.
The goodness-of-fit value (R2 = 0.952) validates the reliability of the model, and the findings align with prior studies demonstrating that renewable energy consumption significantly reduces carbon emissions (Wu et al., 2024). According to this study’s equations, a 1% increase in primary electricity use leads to a 0.403% reduction in carbon emissions, while a 1% increase in fertiliser use results in a 0.611% increase in emissions. Additionally, a 1% increase in population size raises emissions by 3.184%, confirming population growth as a more significant driver than economic development. The Environmental Kuznets Curve (EKC) hypothesis is supported, as the relationship between GDPs per capita and carbon emissions follows an inverted U-shaped trajectory, consistent with findings from other regions (Bibi and Jamil, 2021).
Under the FHG scenario, stricter environmental policies and renewable energy development lead to Qinghai Province achieving its carbon peak by 2030, corroborating earlier research that highlighted the importance of environmental protection policies for carbon reduction (Fang et al., 2019). These findings confirm Hypotheses 2, 3, and 4, while Hypothesis 1 is not supported, as population size exerts a greater influence than economic growth on carbon emissions.
The results indicate that expanding the use of primary electricity is an effective strategy for reducing carbon emissions, consistent with a 2020 study that highlighted the dual benefits of renewable energy in promoting economic growth and environmental sustainability (Saidi and Omri, 2020). The adoption of renewable energy sources in Qinghai Province aligns with global trends and plays a critical role in achieving carbon reduction goals. A phased approach, beginning with pilot projects in high-potential areas, coupled with financial incentives, can further accelerate the transition to renewable energy.
The study demonstrates that optimising fertiliser use significantly reduces carbon emissions, a finding supported by previous research using the PSM-DID method (Du et al., 2023). Rationalising fertiliser application in Qinghai Province can enhance agricultural sustainability while mitigating environmental impacts. Training programs, extension services, and financial assistance could encourage small-scale farmers to adopt efficient fertilisation techniques.
Population growth is identified as the most substantial driver of carbon emissions in Qinghai Province, with a 1% increase in population size leading to a 3.184% rise in emissions. This result aligns with studies from populous Asian nations that underscore the influence of population expansion on carbon emissions (Rehman and Rehman, 2022). Sustainable urban planning, including improved public transportation, energy-efficient buildings, and green spaces, can mitigate the environmental impacts of population growth. Economic policies encouraging low-carbon industries and promoting carbon trading schemes will further support emission reduction efforts.
The findings confirm that stringent environmental policies and renewable energy expansion are essential for Qinghai Province to achieve its carbon peak by 2030. This aligns with research from BRICS nations, which demonstrated the effectiveness of enhanced tax revenues, renewable energy use, and stricter regulations in reducing emissions (Li et al., 2023).
Strategic recommendations include:
• Raising public environmental awareness to foster community participation in carbon reduction initiatives.
• Advancing agricultural technologies to reduce emissions while maintaining productivity.
• Promoting economic restructuring to support industries with smaller carbon footprints.
• Enhancing renewable energy development to reduce reliance on fossil fuels.
• Encouraging low-carbon practices in primary industries.
These strategies provide a roadmap for Qinghai Province to balance economic growth with environmental sustainability, aligning with China’s dual-carbon targets.
While the study provides valuable insights, its scope was confined to panel data analysis without direct collaboration with environmental specialists or practical validation. The extended STIRPAT model, while robust, may not capture all factors influencing carbon emissions, requiring further refinement and validation in future research.
This study investigates the drivers of carbon emissions in Qinghai Province by analysing economic activities, primary industry output, year-end resident population, primary electricity consumption, and agricultural fertiliser use. To enhance the model’s relevance to local conditions, the extended STIRPAT model integrates renewable energy utilization. Statistical methods such as the ADF test and Johansen cointegration test ensure the robustness and predictive accuracy of the model.
The findings highlight that population size is the most significant driver of carbon emissions, while GDP per capita has the smallest impact. The relationship between economic development and carbon emissions follows an inverted “U”-shaped curve, validating the Environmental Kuznets Curve (EKC) hypothesis and supporting Hypothesis 3. If stricter environmental protection policies are implemented, Qinghai Province could achieve peak emissions by 2030, aligning with Hypothesis 4.
Policy recommendations derived from this study emphasize:
• Promoting renewable energy use: Expanding primary electricity generation to reduce dependence on fossil fuels, directly addressing Hypothesis 2.
• Optimizing agricultural technology: Implementing sustainable fertiliser practices to mitigate emissions from the agricultural sector.
• Managing population growth impacts: Developing urban planning strategies that minimize the environmental effects of population increases.
• Encouraging sustainable industrial practices: Transitioning primary industries toward low-carbon production methods.
These recommendations align with the FHG scenario, ensuring that Qinghai’s policies effectively contribute to achieving the dual-carbon targets. Policymakers must prioritize long-term strategies that balance economic development with environmental sustainability, providing a model for other less-developed regions.
While this study offers valuable insights into the drivers of carbon emissions in Qinghai Province, several limitations warrant consideration. First, the analysis relies on data specific to Qinghai, which may not fully capture conditions in other regions. This limits the generalizability of the findings. Additionally, the accuracy and timeliness of the data could affect the reliability of the results. Second, although the study proposes actionable policy recommendations, their implementation may encounter financial constraints, technical challenges, and stakeholder coordination issues.
The study’s analytical framework, while robust, may not encompass all relevant factors influencing emissions, such as the detailed mechanisms of economic restructuring or the evolving impacts of population dynamics.
Future research should address these limitations by:
• Expanding regional applicability: Applying the model to other provinces or countries to validate its generalizability and refine its assumptions.
• Incorporating additional variables: Introducing economic restructuring, market mechanisms, and technological advancements to improve the model’s predictive power and applicability.
• Collaborating with environmental experts: Strengthening interdisciplinary research to enhance the robustness and practical relevance of the model.
• Adopting advanced testing methods: Utilizing techniques such as the Granger causality test to explore the causal relationships between variables and emissions.
• Developing hybrid models: Combining the STIRPAT framework with system dynamics (STIRPAT-SD) to improve forecast reliability and provide more comprehensive insights for achieving carbon neutrality.
By addressing these areas, future studies can refine the analytical framework and extend its applicability, offering more actionable strategies for reducing emissions. Such advancements will not only support Qinghai Province in achieving its dual-carbon targets but also contribute to broader efforts in mitigating global climate change.
Publicly available datasets were analyzed in this study. This data can be found here: The data that support the findings of this study are available in [Qinghai Statistical Yearbook] at [http://tjj.qinghai.gov.cn/nj/2023/indexch.htm]. These data were derived from the following resources available in the public domain: http://tjj.qinghai.gov.cn/nj/2023/indexch.htm.
SL: Conceptualization, Data curation, Formal Analysis, Investigation, Methodology, Project administration, Resources, Software, Supervision, Validation, Visualization, Writing–original draft, Writing–review and editing. JH: Funding acquisition, Investigation, Project administration, Resources, Supervision, Validation, Writing–review and editing. XC: Formal Analysis, Investigation, Project administration, Resources, Supervision, Validation, Writing–review and editing.
The author(s) declare that financial support was received for the research, authorship, and/or publication of this article. This research was funded by Shaoyang University Innovation Foundation for Postgraduate, grant number CX2023SY045.
The authors declare that the research was conducted in the absence of any commercial or financial relationships that could be construed as a potential conflict of interest.
The author(s) declare that no Generative AI was used in the creation of this manuscript.
All claims expressed in this article are solely those of the authors and do not necessarily represent those of their affiliated organizations, or those of the publisher, the editors and the reviewers. Any product that may be evaluated in this article, or claim that may be made by its manufacturer, is not guaranteed or endorsed by the publisher.
Adewale Alola, A. (2021). Risk to investment and renewables production in the United States: an inference for environmental sustainability. J. Clean. Prod. 312, 127652. doi:10.1016/j.jclepro.2021.127652
Aminzadeh, K., Bakhtiari, S., and Daei-karimzadeh, S. (2021). Environmental pollution and economic growth based on the theory of environmental Kuznets curve (EKC) in Iran’s provinces (1997–2017). Environ. Energy Econ. Res. 5 (1–15.4). doi:10.22097/eeer.2021.287650.1200
Bibi, F., and Jamil, M. (2021). Testing environment Kuznets curve (EKC) hypothesis in different regions. Environ. Sci. Pollut. Res. 28 (11), 13581–13594. doi:10.1007/s11356-020-11516-2
Bureau of Statistics. Qinghai provincial Bureau of statistics (2024). Available online at: http://tjj.qinghai.gov.cn/ (accessed on 8 August 2024).
Carbon-Neutral Future (2022). China and UK increase commitment to a carbon-neutral future. Available online at: https://cen.acs.org/energy/China-UK-increase-commitment-carbon/98/i40 (accessed on 2 March 2024).
Chandler, W., Secrest, T. J., Logan, J., Schaeffer, R., Szklo, A. S., Schuler, M. E., et al. (2002). “Climate change mitigation in developing countries. Brazil, China, India, Mexico, South Africa, and Turkey. Arlington, VA: Pew Center on Global Climate Change.
Chen, J., Yan, F., and Lu, Q. (2020). Spatiotemporal variation of vegetation on the qinghai–tibet plateau and the influence of climatic factors and human activities on vegetation trend (2000–2019). Remote Sens. 12, 3150. doi:10.3390/rs12193150
Chen, W., Alharthi, M., Zhang, J., and Khan, I. (2024). The need for energy efficiency and economic prosperity in a sustainable environment. Gondwana Res. 127, 22–35. doi:10.1016/j.gr.2023.03.025
Chen, Y., Wang, Z., and Zhong, Z. (2019). CO2 emissions, economic growth, renewable and non-renewable energy production and foreign trade in China. Renew. Energy 131, 208–216. ISSN 0960-1481. doi:10.1016/j.renene.2018.07.047
China Statistical. China statistical Yearbook (2023). Available online at: https://www.stats.gov.cn/sj/ndsj/2023/indexch.htm (accessed on 8 August 2024)
Dietz, T., and Rosa, E. A. (1997). Effects of population and affluence on CO2 emissions. Proc. Natl. Acad. Sci. 94 (1), 175–179. doi:10.1073/pnas.94.1.175
Dinda, S. (2004). Environmental Kuznets curve hypothesis: a survey. Ecol. Econ. 49 (4), 431–455. doi:10.1016/j.ecolecon.2004.02.011
Dogan, E., and Inglesi-Lotz, R. (2020). The impact of economic structure to the environmental Kuznets curve (EKC) hypothesis: evidence from European countries. Environ. Sci. Pollut. Res. 27, 12717–12724. doi:10.1007/s11356-020-07878-2
Du, Y., Liu, H., Huang, H., and Li, X. (2023). The carbon emission reduction effect of agricultural policy——evidence from China. J. Clean. Prod. 406, 137005. doi:10.1016/j.jclepro.2023.137005
Economic Performance. Economic performance of Qinghai province in 2023 released. (2023). Available online at: http://www.qinghai.gov.cn/zwgk/system/2024/01/26/030035853.shtml (accessed on 6 August 2024).
Fan, J.-L., Liao, H., Liang, Q.-M., Tatano, H., Liu, C.-F., and Wei, Y.-M. (2013). Residential carbon emission evolutions in urban–rural divided China: an end-use and behavior analysis. Appl. Energy 101, 323–332. doi:10.1016/j.apenergy.2012.01.020
Fang, K., Tang, Y., Zhang, Q., Song, J., Wen, Q., Sun, H., et al. (2019). Will China peak its energy-related carbon emissions by 2030? Lessons from 30 Chinese provinces. Appl. Energy 255, 113852. doi:10.1016/j.apenergy.2019.113852
Firinguetti, L., Kibria, G., and Araya, R. (2017). Study of partial least squares and ridge regression methods. Commun. Statistics-Simulation Comput. 46 (8), 6631–6644. doi:10.1080/03610918.2016.1210168
Gerus-Gościewska, M., and Gościewski, D. (2022). Grey relational analysis (gra) as an effective method of research into social preferences in urban space planning. Land 11 (1), 102. doi:10.3390/land11010102
Grabowski, W., and Welfe, A. (2016). An exchange rate model with market pressures and a contagion effect. Emerg. Mark. Finance Trade 52 (12), 2706–2720. doi:10.1080/1540496x.2016.1216931
Guan, Y., Shan, Y., Huang, Q., Chen, H., Wang, D., and Hubacek, K. (2021). Assessment to China's recent emission pattern shifts. Earth's Future 9, e2021EF002241. doi:10.1029/2021ef002241
Hassan, A., Haseeb, M., Bekun, F. V., Haieri Yazdi, A., Ullah, E., and Hossain, M. E. (2024). Does nuclear energy mitigate CO2 emissions in the USA? Testing IPAT and EKC hypotheses using dynamic ARDL simulations approach. Prog. Nucl. Energy 169, 105059. doi:10.1016/j.pnucene.2024.105059
Li, J., Irfan, M., Samad, S., Ali, B., Zhang, Y., Badulescu, D., et al. (2023b). The relationship between energy consumption, CO2 emissions, economic growth, and health indicators. Int. J. Environ. Res. Publ. Health 20 (3), 2325. doi:10.3390/ijerph20032325
Li, S., Samour, A., Irfan, M., and Ali, M. (2023). Role of renewable energy and fiscal policy on trade adjusted carbon emissions: evaluating the role of environmental policy stringency. Renew. Energy 205, 156–165. doi:10.1016/j.renene.2023.01.047
Li, X., Lin, C., Lin, M., and Jim, C. (2024). Drivers, scenario prediction and policy simulation of the carbon emission system in Fujian Province (China). J. Clean. Prod. 434, 140375. doi:10.1016/j.jclepro.2023.140375
Liang, C., Liu, Z., and Geng, Z. (2021). Assessing e-commerce impacts on China's CO2 emissions: testing the CKC hypothesis. Environ. Sci. Pollut. Res. 28 (40), 56966–56983. doi:10.1007/s11356-021-14257-y
Liu, D., Zhu, X., and Wang, Y. (2021). China's agricultural green total factor productivity based on carbon emission: an analysis of evolution trend and influencing factors. J. Clean. Prod. 278, 123692. doi:10.1016/j.jclepro.2020.123692
Liu, L.-C., Wu, G., Wang, J.-N., and Wei, Y.-M. (2011). China's carbon emissions from urban and rural households during 1992–2007. J. Clean. Prod. 19, 1754–1762. doi:10.1016/j.jclepro.2011.06.011
Liu, T. Q., Li, S. H., Guo, L. G., Cao, C. G., Li, C. F., Zhai, Z., et al. (2020). Advantages of nitrogen fertilizer deep placement in greenhouse gas emissions and net ecosystem economic benefits from no-tillage paddy fields. J. Clean. Prod. 263, 121322. doi:10.1016/j.jclepro.2020.121322
Lohwasser, J., Schaffer, A., and Brieden, A. (2020). The role of demographic and economic drivers on the environment in traditional and standardized STIRPAT analysis. Ecol. Econ. 178, 106811. doi:10.1016/j.ecolecon.2020.106811
Lv, P., and Wang, J. (2016). “Research on electricity consumption and economic growth based on variable coefficient panel data regression[C],” in 2016 international seminar on education innovation and economic management (SEIEM 2016). Atlantis Press, 492–495. doi:10.2991/seiem-16.2016.126
Ma, Q., Murshed, M., and Khan, Z. (2021). The nexuses between energy investments, technological innovations, emission taxes, and carbon emissions in China. Energy Policy 155, 112345. doi:10.1016/j.enpol.2021.112345
Maidin, N. A., Mohd Sapuan, S., Taha, M. M., and Yusoff, M. Z. M. (2022). Material selection of natural fibre using a grey relational analysis (GRA) approach. BioResources 17 (1), 109–131. doi:10.15376/biores.17.1.109-131
Mausam, K., Pare, A., Ghosh, S. K., and Tiwari, A. (2023). Thermal performance analysis of hybrid-nanofluid based flat plate collector using Grey relational analysis (GRA): an approach for sustainable energy harvesting. Therm. Sci. Eng. Prog. 37, 101609. doi:10.1016/j.tsep.2022.101609
National Bureau of Statistics (2023). China national Bureau of statistics (CNBS). Available online at: https://www.stats.gov.cn/(accessed on 4 March 2024)
National Development and Reform Commission of the People's Republic of China (2022). Available online at: https://www.ndrc.gov.cn/fggz/jjmy/zyspqk/202212/t20221227_1344041.html (accessed on August 3, 2024).
Neagu, O. (2019). The link between economic complexity and carbon emissions in the European Union countries: a model based on the Environmental Kuznets Curve (EKC) approach. Sustainability 11 (17), 4753. doi:10.3390/su11174753
Organic Agricultural. (2024). Qinghai to build green organic agricultural and livestock products exporting place achieved promising results Available online at: http://www.qinghai.gov.cn/zwgk/system/2024/08/29/030052272.shtml (accessed on 3 August 2024).
Rehman, E., and Rehman, S. (2022). Modeling the nexus between carbon emissions, urbanization, population growth, energy consumption, and economic development in Asia: evidence from grey relational analysis. Energy Rep. 8, 5430–5442. doi:10.1016/j.egyr.2022.03.179
Rogelj, J., Popp, A., Calvin, K. V., Luderer, G., Emmerling, J., Gernaat, D., et al. (2018). Scenarios towards limiting global mean temperature increase below 1.5 °C. Nat. Clim. change 8 (4), 325–332. doi:10.1038/s41558-018-0091-3
Rokhmawati, A., Sarasi, V., and Berampu, L. T. (2024). Scenario analysis of the Indonesia carbon tax impact on carbon emissions using system dynamics modeling and STIRPAT model. Geogr. Sustain. 5 (4), 577–587. doi:10.1016/j.geosus.2024.07.003
Saidi, K., and Omri, A. (2020). The impact of renewable energy on carbon emissions and economic growth in 15 major renewable energy-consuming countries. Environ. Res. 186, 109567. doi:10.1016/j.envres.2020.109567
Shahbaz, M., Loganathan, N., Muzaffar, A. T., Ahmed, K., and Ali Jabran, M. (2016). How urbanisation affects CO2 emissions in Malaysia? The application of STIRPAT model. Renew. Sustain. Energy Rev. 57, 83–93. doi:10.1016/j.rser.2015.12.096
Shan, Y., Guan, D., Zheng, H., Ou, J., Li, Y., Meng, J., et al. (2018). China CO2 emission accounts 1997–2015. Sci. data 5 (1), 170201–170214. doi:10.1038/sdata.2017.201
Si, L., Wang, P., and Cao, D. (2024). Towards sustainable development goals: assessment of wind and solar potential in northwest China. Environ. Res. 252, 118660. doi:10.1016/j.envres.2024.118660
Soule, A., Salamatian, K., and Taft, N. (2005). “Combining filtering and statistical methods for anomaly detection,” in Proceedings of the 5th ACM SIGCOMM conference on Internet Measurement, 31–31. doi:10.5555/1251086.1251117
Statistical Yearbook. Statistical Yearbook of Qinghai province (2023). Available online at: http://tjj.qinghai.gov.cn/nj/2023/indexch.htm (accessed on 8 August 2024)
Sun, L. L., Cui, H. J., and Ge, Q. S. (2022). Will China achieve its 2060 carbon neutral commitment from the provincial perspective? Adv. Clim. Change Res. 13 (2), 169–178. doi:10.1016/j.accre.2022.02.002
Tenaw, D., and Beyene, A. D. (2021). Environmental sustainability and economic development in sub-Saharan Africa: a modified EKC hypothesis. Renew. Sustain. Energy Rev. 143, 110897. doi:10.1016/j.rser.2021.110897
Tian, J., Ding, J., Zhong, F., and Lyu, X. (2024). Application of shared socioeconomic pathways at the subnational level: carbon emission forecasts in Qinghai Province, China, integrating socioeconomic models. J. Environ. Plan. Manag. 67 (11), 2627–2644. doi:10.1080/09640568.2023.2197142
Wang, Q., and Zhang, F. (2021). The effects of trade openness on decoupling carbon emissions from economic growth–evidence from 182 countries. J. Clean. Prod. 279, 123838. doi:10.1016/j.jclepro.2020.123838
Wang, S., Wang, J., Li, S., Fang, C., and Feng, K. (2019). Socioeconomic driving forces and scenario simulation of CO2 emissions for a fast-developing region in China. J. Clean. Prod. 216, 217–229. doi:10.1016/j.jclepro.2019.01.143
Wang, W., Zhao, D., and Kuang, Y. (2016). Decomposition analysis on influence factors of direct household energy-related carbon emission in Guangdong province-Based on extended Kaya identity. Environ. Prog. Sustain. Energy 35, 298–307. doi:10.1002/ep.12219
Wang, Y., Guo, C.-H., Chen, X.-J., Jia, L.-Q., Guo, X.-N., Chen, R.-S., et al. (2021). Carbon peak and carbon neutrality in China: goals, implementation path and prospects. China Geol. 4 (4), 720–746. doi:10.31035/cg2021083
World Development. Indicators data catalog (2021). Available online at: https://datacatalog.worldbank.org/search/dataset/0037712/World-Development-Indicators (accessed on 2 March 2024)
Wu, L., Hu, S., and Zhao, Z. (2024). Environmental regulation and renewable energy technology innovation: firm-level evidence from China. Energy 312, 133655. doi:10.1016/j.energy.2024.133655
Xiong, C., Yang, D., Xia, F., and Huo, J. (2016). Changes in agricultural carbon emissions and factors that influence agricultural carbon emissions based on different stages in Xinjiang, China. Sci. Rep. 6 (1), 36912. doi:10.1038/srep36912
Yang, H., Huang, X., Hu, J., Thompson, J. R., and Flower, R. J. (2022). Achievements, challenges and global implications of China’s carbon neutral pledge. Front. Environ. Sci. and Eng. 16 (8), 111. doi:10.1007/s11783-022-1532-9
York, R., Rosa, E. A., and Dietz, T. (2003). STIRPAT, IPAT and ImPACT: analytic tools for unpacking the driving forces of environmental impacts. Ecol. Econ. 46 (3), 351–365. doi:10.1016/s0921-8009(03)00188-5
Zha, D., Zhou, D., and Zhou, P. (2010). Driving forces of residential CO2 emissions in urban and rural China: an index decomposition analysis. Energy Policy 38, 3377–3383. doi:10.1016/j.enpol.2010.02.011
Zhang, L., Xu, M., Chen, H., Li, Y., and Chen, S. (2022). Globalization, green economy and environmental challenges: state of the art review for practical implications. Front. Environ. Sci. 10, 870271. doi:10.3389/fenvs.2022.870271
Zhao, C., Ju, S., Xue, Y., Ren, T., Ji, Y., and Chen, X. (2022b). China’s energy transitions for carbon neutrality: challenges and opportunities. Carbon Neutrality 1 (1), 7. doi:10.1007/s43979-022-00010-y
Zhao, X., Jiang, M., and Zhang, W. (2022a). Decoupling between economic development and carbon emissions and its driving factors: evidence from China. Int. J. Environ. Res. Public Health 19, 2893. doi:10.3390/ijerph19052893
Keywords: data analysis, relationship analytics, decarbonisation pathways, Environmental Kuznets Curve hypothesis, CO2 emission, sustainability, visual analysis
Citation: Li S, Hua J and Chi X (2025) Assessing decarbonisation pathways in Qinghai Province, China: an analysis based on the extended STIRPAT model and data visualisation. Front. Environ. Sci. 13:1513751. doi: 10.3389/fenvs.2025.1513751
Received: 19 October 2024; Accepted: 24 February 2025;
Published: 12 March 2025.
Edited by:
Nikolaos Voulvoulis, Imperial College London, United KingdomReviewed by:
Fei Wang, Hebei University of Technology, ChinaCopyright © 2025 Li, Hua and Chi. This is an open-access article distributed under the terms of the Creative Commons Attribution License (CC BY). The use, distribution or reproduction in other forums is permitted, provided the original author(s) and the copyright owner(s) are credited and that the original publication in this journal is cited, in accordance with accepted academic practice. No use, distribution or reproduction is permitted which does not comply with these terms.
*Correspondence: Jie Hua, amllLmh1YUBhbHVtbmkudXRzLmVkdS5hdQ==
Disclaimer: All claims expressed in this article are solely those of the authors and do not necessarily represent those of their affiliated organizations, or those of the publisher, the editors and the reviewers. Any product that may be evaluated in this article or claim that may be made by its manufacturer is not guaranteed or endorsed by the publisher.
Research integrity at Frontiers
Learn more about the work of our research integrity team to safeguard the quality of each article we publish.