 Leah M. Crossley
 Kerry T. B. MacQuarrie
 Serban Danielescu3,4†
- 1Department of Civil Engineering, University of New Brunswick, Fredericton, NB, Canada
- 2Canadian Rivers Institute, University of New Brunswick, Fredericton, NB, Canada
- 3Fredericton Research and Development Centre, Agriculture and Agri-Food Canada, Fredericton, NB, Canada
- 4Canada Centre for Inland Waters, Environment and Climate Canada, Burlington, ON, Canada
Nitrate contamination of freshwater systems is common in agricultural watersheds, leading to human and environmental health concerns. The Bells Creek watershed, located in central Prince Edward Island (PEI), Canada, is dominated by agricultural land use and has elevated nitrate concentrations in groundwater and surface water. Beneficial Management Practices (BMPs), such as constructed wetlands, may provide a means of mitigating such contamination; however, the significance of small wetlands in regulating or attenuating nitrate in PEI has yet to be investigated. In this year-long (August 2023 – July 2024) study, the nitrate loads delivered to a small (1.2 ha) groundwater-influenced, stream-wetland system were quantified using high-frequency monitoring techniques. Results indicate that discharge variability is the primary control on the observed variability of surface and subsurface nitrate loads. The total annual nitrate load to the wetland was approximately 30,000 kg NO3-N/yr. Groundwater discharge, which bypasses the wetland riparian zone, contributed approximately 67% of the total load to the wetland. Weekly flux calculations revealed that the wetland behaved as a nitrate sink for 49 out of 52 weeks of the year. Overall, the wetland attenuated 39% of the imported annual nitrate load which, on a wetland catchment area basis, is equivalent to 21.1 kg NO3-N/ha catchment/yr. A positive, non-linear trend between the imported nitrate load and the percent change in nitrate load revealed that the wetland attenuated disproportionately more nitrate during periods of high imported loads. These findings indicate that small, constructed wetlands may be an effective component of BMPs aimed at reducing nitrate loads in agriculturally dominated watersheds like those in Prince Edward Island.
1 Introduction
Agricultural activities may produce excess nutrients, such as nitrogen (N) and phosphorus (P), and pesticides, that can enter freshwater systems via surface and subsurface transport pathways (Dunn et al., 2011; Mackie et al., 2021; Crawford and Alexander, 2024). Nitrate-nitrogen (NO3-N) contamination of freshwater systems is of increasing concern within agriculturally dominated watersheds, such as those in the province of Prince Edward Island (PEI), Canada, where elevated nitrate levels in groundwater and surface water have been linked to areas of intense agricultural land use (e.g., Benson et al., 2006; Danielescu and MacQuarrie, 2011; Liang et al., 2019; Crawford and Alexander, 2024). PEI’s fractured sandstone aquifer, the province’s sole source of potable water, is susceptible to contamination due to its unconfined (locally semi-confined) nature (Zebarth et al., 2015). Despite the presence of glacial till overburden, Lamb et al. (2019) demonstrated that infiltrating water and dissolved contaminants primarily move downward toward the aquifer, where contaminants such as nitrate can reside for several decades (Jiang and Somers, 2009; Critchley et al., 2014). Groundwater also contributes between 65% and 85% of annual stream discharge in PEI and, as such, the groundwater contribution to streams can have a major impact on surface water quality (Danielescu et al., 2009; Savard et al., 2010; Crawford and Alexander, 2024). Nitrate entering surface water bodies can put aquatic ecosystems at risk, as excess concentrations increase the likelihood of algal blooms, potentially causing anoxic conditions that, in addition to other factors such as the presence of agricultural pesticides and increasing water temperatures, have been linked to fish kills in PEI (Crawford and Alexander, 2024).
In working towards a sustainable balance between agriculture and freshwater systems, Beneficial Management Practices (BMPs), such as crop rotation, spring tillage, and buffer zones (Dunn et al., 2011; Zebarth et al., 2015), have been introduced to mitigate the amount of nutrients entering surface waters and aquifers. As discussed by Zebarth et al. (2015), agricultural systems are very complex, and in order to alleviate the perceived economic risk that farmers have with adopting BMPs, financial compensation or subsidies are typically required. Besides economic considerations, additional field investigations are required to demonstrate the effectiveness of BMPs for N reduction in connected groundwater-surface water-wetland systems, where multiple transport pathways may exist for delivery of N to riparian lowlands, streams or wetlands (e.g., Conant et al., 2016; Steiness et al., 2021).
The role of wetlands as nitrate sinks in agricultural catchments has been the subject of a number of studies within North America, with most showing the potential for significant removal. Cheng et al. (2020) used an empirical nitrate removal model to estimate, on a continental US-scale, that a 10% increase in strategically placed wetlands would result in a 54% decrease in N loads to surface water. A study conducted within the Minnesota River Basin by Hansen et al. (2018) found that wetland restoration would be five times more effective in reducing nitrate loads compared to other agricultural land management strategies. Hansen et al. (2021) used an integrated model of a subwatershed of the Minnesota River Basin to show that small (<2 ha) and shallow (<1.1 m deep) fluvial wetlands (i.e., wide, slowing, vegetated water bodies within a riverine corridor) were the most cost-effective nitrate management action in agricultural watersheds. Cheng and Basu (2017) found, through a meta-analysis of a global data base, that wetlands <0.03 ha in area accounted for 50% of N removal due to the larger sediment area to water volume ratio in small wetlands, emphasizing the disproportion role small wetlands play in nutrient processing within a landscape. A field-based study by Botrel et al. (2022) over six summers within the St. Lawrence River, in Québec, Canada found an aquatic vegetation meadow, located at the confluence of two agriculturally impacted tributaries, reduced NO3-N loads by 47%–87%. Steiness et al. (2021) found that a riparian wetland in Denmark attenuated between 45% and 83% of the annual NO3-N load, with the variability arising because of the uncertainty in the surface and subsurface pathways of nitrate delivery to the stream. While these results emphasize the potential of wetlands to be used as an adaptive BMP down-gradient of agriculturally intensive areas, studies are generally lacking with respect to small, groundwater-influenced, wetlands; wetlands <2 ha in area are relatively common in PEI, comprising 67% of the wetlands in the province (Dibblee, 2000). In addition, the influence of seasonal climate variability on nitrate loads and wetland attenuation capacity has seldom been investigated.
Although multi-year investigations of nitrate transport in freshwater systems in PEI have been conducted through discrete sampling (e.g., Savard et al. (2010), where samples were collected once per season over two years; Danielescu and MacQuarrie (2013), where no samples were collected between December and February), the sampling frequencies do not provide a comprehensive understanding of the variability of nitrate transport and attenuation in connected groundwater-surface water systems. Bowes et al. (2009) concluded that weekly sampling for N would be the minimum interval required to accurately represent nutrient dynamics in a riverine setting. A weekly sampling frequency was also adopted in a two year study by Beltran et al. (2021), where they assessed the seasonality within NO3-N loads exported from a stream impacted by urbanization and channelization, finding that the stream reach that was disconnected from groundwater interactions was always a NO3-N source, while the groundwater-connected reach oscillated seasonally between a source and sink. Miller et al. (2016) employed a 15-min sampling frequency, averaged daily in post-processing, at three sites within a watershed in a year long study and used hydrograph separation and daily NO3-N concentrations to estimate the NO3-N load via baseflow and runoff. In a PEI-based study conducted by Pavlovskii et al. (2023), high-frequency (i.e., 15-min interval) NO3-N concentration data were collected at a single stream location for the month of September, revealing that heavy rainfall caused a sustained increase in groundwater nitrate load via baseflow up to 10 days following a storm event; however, the limited spatial and temporal extent of the data collection were not amenable to assessing attenuation or long-term trends. Climate projections for PEI indicate that while storm events may become less frequent, they will become more intense (Bhatti et al., 2022), potentially having implications for N transport and monitoring in agricultural watersheds, as high NO3-N concentrations in the shallow portion of the PEI aquifer can be quickly discharged to surface water during heavy rainfall (Pavlovskii et al., 2023). As such, to better resolve nitrate loads delivered to small wetlands via surface and subsurface transport pathways, and potential nitrate attenuation within small wetlands, high-frequency (e.g., ≥2 measurements per day) and relatively long-term (e.g., ≥1 year) time series are required.
Given the need for an improved understanding of nitrate transport and attenuation within small, groundwater-influenced, wetlands, the objectives of this study were to: 1) collect high-frequency data for a small constructed wetland (<2 ha) to enable quantification of short-term (e.g., daily) and seasonal trends in nitrate loads; 2) to establish the contributions of surface water and groundwater transport pathways to the nitrate loads; and, 3) to quantify the short-term and annual efficiency of nitrate load reduction within the wetland system. While this study is important in the context of nitrate contamination in PEI, as it is the first high-frequency and year-long groundwater-surface water-wetland study to be conducted in the region, this work can potentially translate to other groundwater-influenced systems within agricultural watersheds located in similar climates or hydrogeological settings. Investigating nitrate transport and attenuation in relatively small wetlands also offers the opportunity to better constrain nitrate loads and provide greater confidence in estimating nitrate load variations, which has proved challenging for many groundwater-influenced riparian systems (e.g., Steiness et al., 2021).
2 Site description
The study site is located 11 km north of the City of Charlottetown, adjacent to the Agriculture and Agri-Food Canada (AAFC) Experimental Farm in Harrington, PEI, within the Bells Creek watershed (Figure 1). Bells Creek, a 2 m wide second-order stream, flows northward through an open water wetland area known as Mill Pond, ultimately discharging to Covehead Bay estuary along the northern PEI coastline.

Figure 1. Location of the study site within the Bells Creek watershed. The map inset shows the site location within the province of PEI. Land use within the study site catchment area for the year 2010 is denoted in the legend. Winter River is the location of a Water Survey of Canada hydrometric station (01CC010).
Mill Pond is a small (1.2 ha) wetland constructed in the 1950s with a single, well-defined outflow location (Outlet, Figure 2). The constructed wetland occupies a topographically low area and has an average water depth of approximately 2 m. Multiple underwater springs occur along the western shoreline where groundwater discharge can be observed year-round (Springs, Figure 2). A buffer of mature riparian vegetation surrounds the wetland, varying in width from approximately 18 m–250 m (Figure 2). Although an aquatic vegetation survey was not conducted as part of this work, a previous PEI-based study by Stevens et al. (2003) noted flora such as cattails (Typha spp.), common duckweed (Lemna minor), water-starwort (Callitriche spp.), water lilies (Nuphar luteum and Nymphaea odorata), pondweeds (Potamogeton spp.), algae (Chara spp.), and northern wild rice (Zizania palustris) in similar open water wetlands. Filamentous green algae, likely a form of Cladophora (Cynthia Crane, personal communication, 17 April 2024) has been observed growing loosely attached to the bottom sediments and, seasonally, a portion of the wetland surface is covered with floating green algae mats (see Supplementary Figure S1).

Figure 2. Sampling locations, including an upgradient groundwater monitoring well, Well #6, located on the AAFC Harrington Experimental Farm property.
The wetland catchment area is approximately 555 ha. Figure 1 shows the land usage upgradient of the study site for 2010; for the period of 2013–2023 the catchment land use was predominantly agricultural (67% on average) (Agriculture and Agri-Food Canada, 2024), with fields used for potato production at some time within the minimum 3-year crop rotation representing 13% of the total catchment area (Government of Prince Edward Island, 2019). As per the classification used in Crawford and Alexander (2024), having more than 50% of land use attributed to agriculture would imply that surface water quality may be severely impacted. In addition to agricultural sources of N, homes and businesses within the catchment area rely on septic systems for wastewater treatment. Using the typical septic system load of 1.6 kg NO3-N/yr proposed for rural PEI by Grizard (2013), and given that there are approximately 40 residences within the catchment area that have septic systems, the total NO3-N load from the wetland catchment area due to wastewater is approximately 0.12 kg NO3-N/ha catchment/yr.
The climate in PEI is humid-continental, with long and mild winters and moderately warm summers (Zebarth et al., 2015; Bhatti et al., 2021). The Harrington Experimental Farm climate station recorded 1,035 mm of precipitation for the period of August 2023 to July 2024, and average monthly temperatures ranging from −4.4°C in February 2024 to 20.7°C in July 2024 (Environment and Climate Change Canada, 2024).
The geology of PEI consists of Carboniferous-aged, highly fractured sandstone intermixed with shale bedrock overlain by a thin mantle of glacial till with depths up to 15 m (Somers, 1992; Zebarth et al., 2015). Zebarth et al. (2015) have previously reported on the geology and aquifer conditions at the AAFC Harrington Experimental Farm site, where they indicate intensely to very intensely fractured sandstone bedrock overlain by argillaceous sandstone with intense horizontal to subvertical fractures, and sandy loam surface soils approximately 1 m deep that allow for rapid infiltration of rainfall and snowmelt. Groundwater flow in the fractured sandstone aquifer is controlled primarily by the extensive fractures, resulting in rapid movement of water and dissolved contaminants in the saturated zone with flow velocity estimates of 0.25–0.76 m/day (Zebarth et al., 2015). However, Malenica (2015) found that the majority of the NO3-N mass within the aquifer underlying the AAFC Harrington Experimental Farm was stored within the bedrock matrix, rather than the fractures, with the highest NO3-N concentrations primarily occurring within the vadose and shallow saturated bedrock zone. Malenica (2015) also found conditions within the aquifer to be unsuitable for microbial denitrification due to high dissolved oxygen concentrations and limited electron donors (i.e., organic carbon and/or mineral).
3 Methods
3.1 Wetland discharges
The total inflow of water to the constructed wetland is assumed to consist of the upstream surface water inflow (i.e., generated from the Bells Creek catchment area upgradient of the Upstream location, Figure 2), direct overland flow from the immediate wetland catchment area, and direct groundwater discharge. As has been visually confirmed, all outflow from the wetland occurs via surface water discharge at the Outlet location (Figure 2).
3.1.1 Surface water inflows and outflows
To obtain times series for surface water inflow and outflow, stage-discharge relationships were developed over the study period (August 2023-July 2024) for both the Upstream and Outlet locations. Discharge (Q) was measured at these locations near-monthly using FlowTracker 1 or FlowTracker 2 Acoustic Doppler Velocimeters (Sontek, Ohio, United States of America) and the velocity-area method; two measurements of Q were completed on all occasions at each location. Stilling wells equipped with Levelogger Model 5 pressure transducers (Solinst Canada Ltd.) were deployed to record water levels at 1-h intervals for the duration of the study period. While the Upstream stilling well was installed next to the Upstream stream-gauging location, the water level control for the Outlet location was a log that spanned the width of the Outlet channel and effectively functioned as a weir. The water head for the wetland was found to correlate well with the Outlet discharge and thus the water level was monitored in a stilling well located within the wetland. To provide barometric compensation of the pressure transducer readings, a Barologger Model 5 barometric pressure logger (Solinst Canada Ltd.) was installed near the Outlet. The developed stage-discharge relationships were used to calculate discharge at 1-h intervals using the 1-h water stage records. To ensure the pressure transducer water level and discharge time series were reasonable, the data collected at the Upstream and Outlet locations were compared to the discharge record at the nearby Water Survey of Canada winter River hydrometric station (01CC010; Figure 1).
3.1.2 Direct overland flow
Direct overland flow (i.e., runoff) from the area adjacent to the wetland was modelled using the Green-Ampt infiltration method in PCSWMM (Computational Hydraulics Inc.). The sandy loam surface soils observed at the AAFC Harrington site (Zebarth et al., 2015) were assumed to be consistent across the catchment. The Green-Ampt soil properties for sandy loam and other relevant inputs are presented in Supplementary Table S1A. The potential monthly evapotranspiration was calculated using the Thornthwaite method and adjusted for latitude (Supplementary Table S1B). A time series for direct runoff to the wetland, between the Upstream and Outlet locations, was found by summing the runoff from the four delineated subcatchments highlighted in Figure 3.
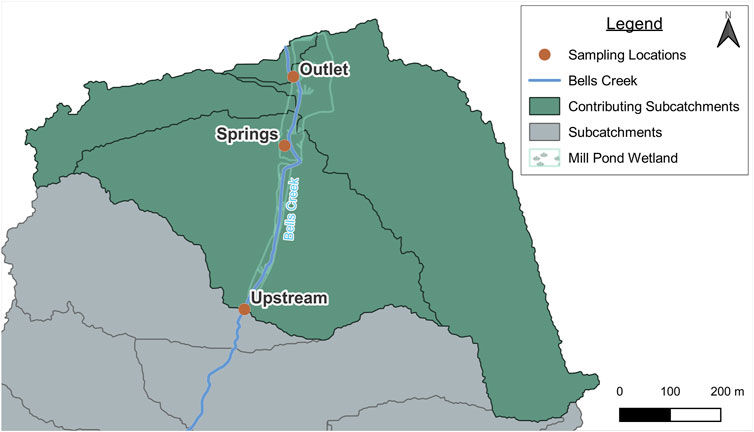
Figure 3. Catchment area for the Outlet location located within the Bells Creek watershed. The subcatchments contributing directly to the Mill Pond wetland are highlighted in green, with key monitoring locations indicated.
3.1.3 Direct groundwater discharge
Although direct groundwater discharge to the wetland was apparent as a series of underwater springs visible along the western shoreline (Figure 2), it was not feasible to instrument this area to quantify this discharge. Instead, groundwater discharge to the wetland was computed using Equation 1, under the assumption that the only other inflows to the wetland were those measured at the Upstream location and the computed runoff.
where
3.2 Water quality data collection
Samples were collected for water quality analyses approximately monthly between May 2023 and July 2024 at the Upstream, Outlet, and Springs locations (Figure 2). Samples from the Springs area were collected using a peristaltic pump and a dedicated drive-point piezometer penetrating ∼0.6 m into the fractured sandstone bedrock below the wetland. All samples were passed through a 0.45 µm filter and were refrigerated until analysis. Samples for cation analysis were acidified using 67%–70% nitric acid. Anions were analyzed using a Metrohm ion chromatograph (761 Compact IC equipped with a Metrosep A Supp 5 column, Switzerland), and cations were analyzed using an inductively coupled plasma-optical emission spectrometer (Varian Vista MPX, Australia) at the University of New Brunswick, Department of Civil Engineering Water Quality Laboratory. Field parameters including pH, temperature, specific conductivity, and dissolved oxygen (DO) were measured using a portable water quality meter (Thermo-Scientific Orion Star A329 Portable Meter). Field alkalinity values were obtained using a HACH digital titrator (Hach, Canada). Charge balance errors were calculated for all samples and a Piper plot of the major ion results was used to assess the hydrochemical facies of the water.
To obtain high-frequency data for NO3-N, the dominant form of nitrogen in PEI freshwaters (Somers et al., 1999; Danielescu and MacQuarrie, 2011), Submersible Ultra-Violet Nitrate Analyzers (SUNA V2, Seabird Scientific, United States), were installed at the Outlet, Upstream, and in Well #6 (Figure 2). NO3-N concentrations were recorded at 6-h intervals. The SUNAs were powered using 40 W solar panels and 12 V batteries protected inside large plastic bins (Supplementary Figure S2). The SUNAs at the Upstream and Outlet sites were secured inside stainless-steel cages, which were then fixed within the middle of the channel by driving rebar through the gaps in the cage and into the streambed. Between August 2023-March 2024, the Upstream SUNA was equipped with a copper biofouling guard while awaiting a SUNA equipped with a wiper that would clean the optical window prior to every sampling event. The Upstream SUNA was replaced by a SUNA with a wiper in March 2024. The Outlet SUNA was equipped with a wiper for the entirety of the study period. The sensor performance was verified using SUNA’s internal diagnostics and concentration standards (i.e., 0, 0.5, 1, 2.5, 5, and 10 mg NO3-N/L) before field deployment and on all field visits where the air temperature was above freezing to avoid damaging the optical lens. SUNA readings were also compared to concentrations measured in discrete NO3-N samples collected at each of the locations (Supplementary Figure S3). As discussed by Miller et al. (2016), SUNAs do not explicitly account for absorbance by nitrite in the range of 210–220 nm; however, at the study site the concentration of nitrite is known to be less than laboratory detection limits.
To assess whether the NO3-N concentrations from the Springs location were representative of the concentrations within the aquifer, and to provide groundwater NO3-N data between the times of manual sampling, concentrations from the Springs location were compared to continuous nitrate concentrations obtained from Well #6, located approximately 400 m upgradient from the Springs location (Figure 2). To account for the lag time arising for groundwater to travel from Well #6 to the Springs sampling location, the Well #6 nitrate concentration time series was shifted forward by 748 days, which was found to provide the best correlation with the discrete samples collected from the Springs. This time shift falls within the range of travel times (519–1,600 days) estimated using the groundwater velocity range of 0.25–0.76 m/d previously estimated for the aquifer underlying Harrington Experimental Farm (Zebarth et al., 2015).
3.3 Loads
The results for dissolved chloride and NO3-N from the manual water sampling were used with the corresponding stream discharge values, obtained on the same day as the water samples, to determine discrete (i.e., approximately monthly) loads. Chloride was used in this study as a conservative tracer as it is unlikely to be affected by biogeochemical reactions in either the subsurface or surface water system. The discrete Upstream and Outlet loads for both chloride and NO3-N were computed using Equation 2.
where LD is the load (M/T), C is the concentration (M/L3), and Q is the corresponding discharge (L3/T).
To produce a time series of NO3-N loads, linear interpolation was used between the SUNA concentration data (i.e., obtained at 6-h intervals) to estimate NO3-N concentrations at 1-h intervals for all surface water monitoring locations. The NO3-N load was then calculated at 1-h intervals for the duration of the study period using Equation 2. Equation 3 was used to calculate the cumulative NO3-N load over a particular time interval (e.g., week, month).
where
During the study there were several periods when the SUNA at the Upstream site did not record NO3-N concentrations (equivalent to 119 days of missing data or ∼33% of the study period), and thus the Upstream NO3-N loads could not be directly computed. For the first nine months of the study the Upstream SUNA did not have a wiper, and it appears that periods of missing data were related to high sediment loads in Bells Creek. Also, on one occasion, the power cable to the SUNA was damaged by animals. To estimate the missing NO3-N load values, scikit-learn’s implementation of gradient boosting regression was used (Pedregosa et al., 2011). Based on the results of a manual feature selection process, six features were used as input to the model: Upstream discharge, Upstream water temperature, Outlet NO3-N load, atmospheric pressure, wetland water temperature, and air temperature. To evaluate the performance of the regressor, a 10-fold cross validation approach was taken whereby 90% of the data were used for training and the other 10% for testing. To explain the output of the model, Shapley Additive exPlantations (SHAP) values (Lundberg and Lee, 2017) were determined, which indicate the impact each model feature had on the predicted Upstream NO3-N load time series.
3.4 Statistical analysis
The NO3-N removal efficiency of the wetland was assessed on a weekly basis. A paired two-sample t-test for means was run on weekly subsets of the data for the duration of the study period (52 weeks), allowing for 168 observations per t-test (i.e., 168 h per week). A statistical significance level of p < 0.05 was used.
4 Results
4.1 Discharge
Discharge results showed good agreement between the measured stream discharge values and the values obtained from the stage-discharge relationships (i.e., rating curves) (Figures 4A–C). The best-fit rating curve for the Upstream stage-discharge relationship was a linear function (R2 = 0.86, n = 21), while the best-fit rating curve for the Outlet location was a power function (R2 = 0.78, n = 24).
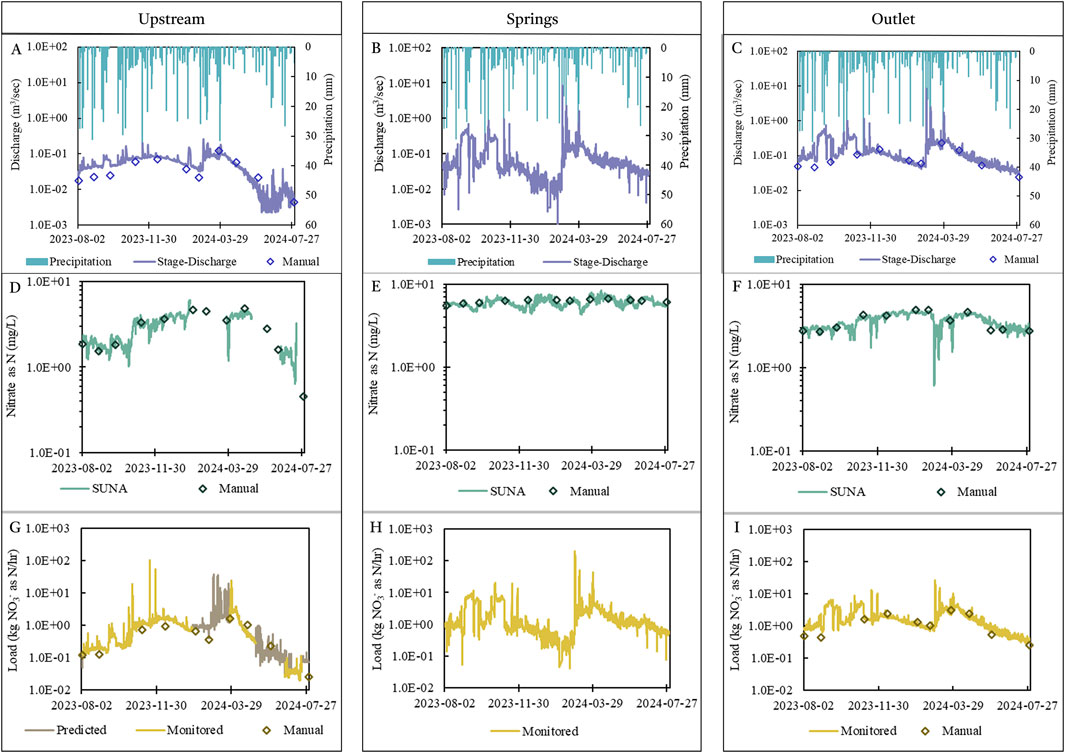
Figure 4. Plots of daily precipitation and discharge (A–C); NO3-N concentrations (D–F); and NO3-N loads (G–I) for each monitoring location. The Upstream plot for load (G) also shows the predicted values using the regression model during periods where the Upstream SUNA did not record concentration (Section 4.3.2).
Stream discharge at the Upstream and Outlet surface water sites was seasonally variable (Figures 4A, C; Table 1), with the highest discharge observed in the late winter-early spring and the lowest discharge observed in the early summer months. The computed groundwater discharge to the wetland also exhibited seasonal variability (Figure 4B; Table 1), with the highest discharge coinciding with the two primary groundwater recharge periods (late fall and early spring). The average discharge from the wetland (0.160 m3/s) was consistently higher than the average Upstream (surface water) inflow (0.055 m3/s) due to the direct groundwater discharge to the wetland (0.110 m3/s average). The cumulative direct overland flow simulated from the four subcatchments adjacent to the wetland (Figure 3) was only 1.04% of the cumulative Upstream flow, therefore, for subsequent computation of NO3-N loads the load due to direct runoff was assumed negligible. Stream discharge at the Upstream and Outlet locations shows good correspondence (e.g., similar response to short-term precipitation events, and long-term seasonal trends) with the Winter River hydrometric station data (Supplementary Figure S4).
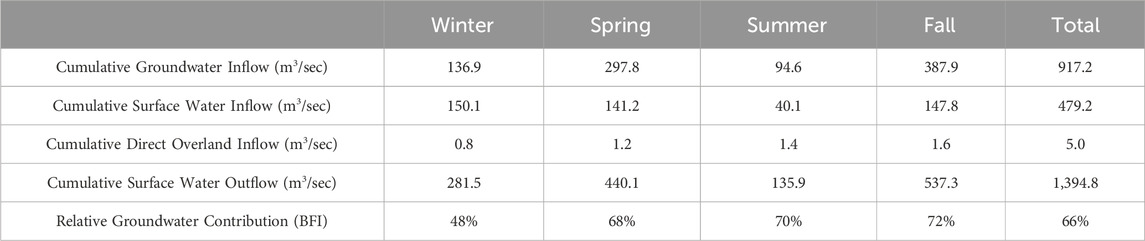
Table 1. Cumulative groundwater inflow, surface water inflow, overland inflow, and surface water outflow to/from the constructed wetland, along with the relative groundwater contribution (BFI) for the year and seasonally where: winter (Dec-Feb), spring (Mar-May), summer (Jun-Aug), and fall (Sep-Nov).
4.2 General water quality
The results of the major ion analyses exhibited little variability, with all surface water and groundwater samples being calcium-bicarbonate-type waters (Figure 5). The similarity of the major ion chemistry results indicates that groundwater has a strong influence on surface water quality at the study site. The pH of the surface water ranged from 7.1–9.4, and the average pH of the groundwater was 7.1. The dissolved oxygen (DO) concentration of surface water ranged from 7.2–17.0 mg/L, while the average DO of the groundwater was 9.5 mg/L (see also Supplementary Table S2).
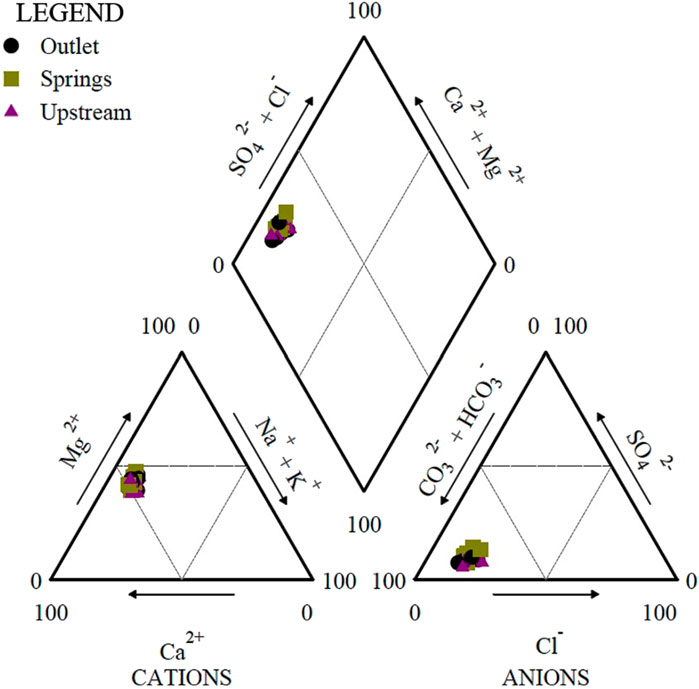
Figure 5. Piper plot for surface water (Outlet and Upstream) and groundwater (Springs) facies classification.
4.3 Loads
4.3.1 Chloride load
Chloride concentrations ranged from 12.7 to 15.5 mg/L at the Upstream location, 13.6–15.7 mg/L at the Outlet location, and 14.1–16.1 mg/L at the Springs groundwater discharge location. The chloride load delivered to the wetland ranged from 33 kg/day in July 2024 to 296 kg/day in March 2024 (see Supplementary Figure S5). The chloride load variations are therefore primarily related to changes in discharge, not changes in chloride concentrations.
For the year-long investigation groundwater contributed 53% (∼21,000 kg/yr) of the total chloride load (∼40,000 kg/yr) to the wetland. The average change in chloride load through the wetland was −0.5% (Supplementary Figure S5), indicating that chloride is transported conservatively in the groundwater-surface water-wetland system. Although chloride may be subject to uptake by wetland plants (e.g., Schück and Greger, 2022), that does not appear to be a significant sink in this wetland. The small mass balance difference for chloride provides confidence in the methods employed to quantify discharge and solute loads for this system.
4.3.2 Regression model for missing Upstream nitrate load data
The results of the ten-fold model cross-validation for the training and testing data revealed average R2 values of 0.997 and 0.927, respectively, therefore validating that the approach is a good predictor of the Upstream NO3-N load. SHAP values for features within the regression model are presented in Figure 6, where a larger SHAP value indicates a more significant impact on the model prediction. Overall, the Upstream discharge (UQ, Figure 6) data points have the greatest SHAP values and thus the greatest impact on the model output. It is also observed that the highest SHAP values for Upstream discharge occur when the magnitude of these points is greatest.
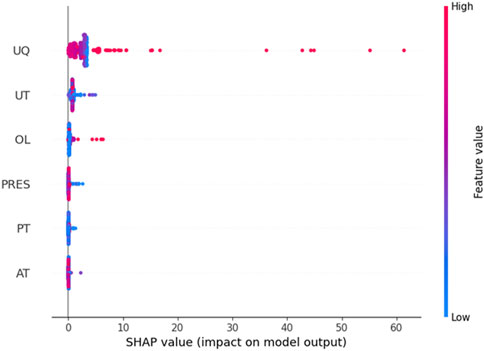
Figure 6. SHAP values determined for the gradient boosting regression model used to compute missing Upstream NO3-N loads. Features included in model were: Upstream discharge (UQ), Upstream water temperature (UT), Outlet load (OL), atmospheric pressure (PRES), wetland water temperature (PT), and air temperature (AT).
4.3.3 Nitrate loads
The average Upstream NO3-N concentration (Figure 4D) for the study period was 2.8 mg/L, while for the Outlet it was 3.6 mg/L. Continuous groundwater NO3-N concentrations from Well #6 (Figure 4E), and the NO3-N concentrations from manual sampling at the Springs were consistently elevated (>4.3 mg/L). NO3-N concentrations in the Outlet surface water are seasonally variable, but less so than at the Upstream location, exhibiting peak concentrations in the late fall-early winter (Figure 4F). The NO3-N loads at all three locations have trends that closely follow the discharge data at each respective location, indicating that, like chloride, load variations are primarily related to changes in discharge, not NO3-N concentrations (Figures 4G–I).
There is a strong correlation between the discrete load results, based on manual measurements, and the continuous NO3-N loads recorded at the corresponding times for both the Upstream and Outlet locations, with R2 values of 0.92 and 0.89, respectively (Figures 4G, I, respectively). This suggests that the methods employed to obtain the continuous time series for NO3-N loads have produced reliable results.
The cumulative groundwater and surface water NO3-N loads to the wetland for the 363-day study period were 20,000 kg and 10,000 kg, respectively, giving a relative contribution of groundwater to the total imported NO3-N load of 67%. Seasonally, the relative contribution of groundwater to the total imported NO3-N load for the winter (Dec-Feb), spring (Mar-May), summer (Jun-Aug), and fall (Sep-Nov) was 50%, 61%, 89%, and 77%, respectively. The estimated contribution of NO3-N from septic system wastewater (64 kg NO3-N/yr) was approximately 0.2% of the total load, indicating that agricultural sources dominate.
4.4 Wetland nitrate attenuation
To assess whether the Mill Pond wetland was functioning as a nitrate sink or source, the weekly NO3-N loads imported and exported to the wetland during the 52-week study period were compared. As shown in Figure 7, the imported NO3-N load exceeded the exported NO3-N load during 50 of 52 weeks. The t-test results indicated that 51 out of 52 weeks had statistically significant differences (p < 0.05) between the imported and exported loads. The wetland had the greatest imported and exported loads in late winter and early spring; however, it also had the greatest removal rate during this time, with a maximum weekly removal rate of 82% in February-March 2024. The lowest imported and exported loads were observed in July 2024. During the two weeks when the wetland behaved as a nitrate source, the maximum increase in NO3-N load was 8%.
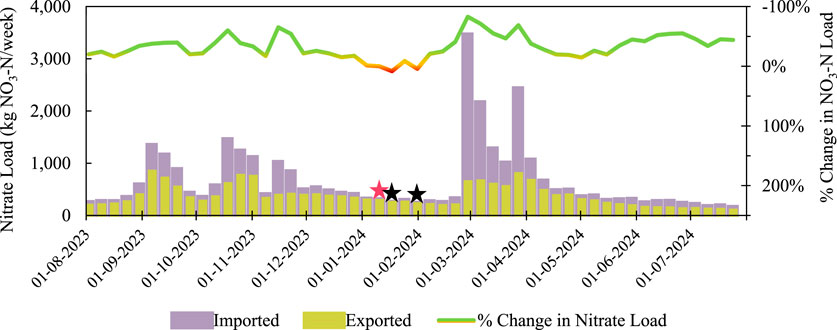
Figure 7. Weekly NO3-N loads imported and exported from the wetland. The two weeks where the wetland behaves as a NO3-N source are indicated with a black star above the bar. The week when there was no significant difference (p > 0.05) between the imported and exported loads is indicated with a pink star. The secondary axis shows the change in NO3-N load (as %) using a gradient line with green indicating the highest removal rates. When the % change in load is negative, the wetland is a NO3-N sink, whereas a positive value indicates that the wetland is a NO3-N source.
5 Discussion
5.1 Using machine learning to fill data gaps
Unfortunately, missing data within long-term, high-frequency monitoring studies is a common hindrance to compiling a continuous data set (e.g., Pavlovskii et al., 2023). As such, using machine learning models to fill data gaps within datasets is an emerging sub-field of water quality studies. Sierra-Porta (2024) recently evaluated the suitability of ten machine learning models for filling water quality data gaps, finding that the gradient boosting model was among the most effective and accurate in predicting missing values. In the current study the gradient boosting model was also found to be effective at predicting the NO3-N loads at the Upstream monitoring location, as shown by the results of the model cross-validation (see Section 4.3.2). Given the increased use of in situ nitrate monitoring instruments, such as SUNAs, and the continual challenges related to long-term field deployment, it is likely that the gradient boosting model, or other machine learning models, will become commonplace in water quality studies.
5.2 Groundwater-surface water connectivity
Throughout the study period, groundwater contributed 66% of the total freshwater discharge to the wetland; however, as seen in Table 1, the groundwater contribution varied seasonally. The maximum relative contribution occurred in the fall (72%), while the minimum occurred in the winter (48%).
In PEI, groundwater recharge typically occurs in late October due to reduced evapotranspiration, and again in March to early May due to snowmelt/rainfall (Jiang et al., 2015; Danielescu et al., 2022). These recharge periods correspond to peak groundwater baseflow periods and, consequently, peak groundwater nitrate contributions to the wetland (Figures 4B, H). Figure 8 shows the groundwater level measured in Well #6, upgradient of the wetland, and the computed groundwater discharge to the wetland. The occurrence of two principal recharge periods is reflected in both time series. The earlier increase observed in groundwater discharge at the Springs location may be explained by shorter flow paths adjacent to the wetland discharge area, whereas the water level in Well #6 shows a slower response due to the presence of a thick unsaturated zone (approximately ∼16 m) (Figure 8).
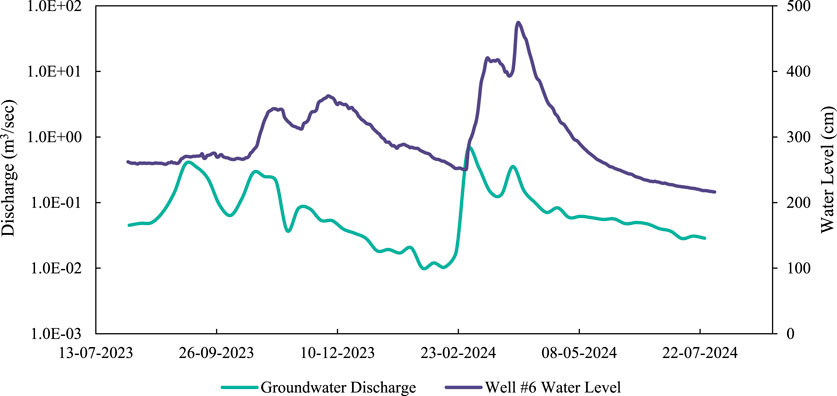
Figure 8. Weekly groundwater discharge to the wetland compared to the water level monitored in Well #6 over the study period.
5.3 Short and long-term trends in NO3-N loads
As seen in Figure 4G, in late November 2023, the NO3-N load at the Upstream location reached a maximum; however, as seen in Figure 4D, the NO3-N concentrations decreased due to a dilution effect caused by heavy rain events (Figure 4A), indicating that the increases in surface water NO3-N loads were driven by discharge. Moreover, the groundwater nitrate concentrations remained relatively constant throughout the study period (Figure 4E), whereas the groundwater NO3-N load (Figure 4H) trended with the groundwater discharge (Figure 4B). Hence, as mentioned previously, discharge variability is the dominant control on nitrate loads delivered to the wetland via surface and subsurface pathways. This is further confirmed by the SHAP values obtained from application of the machine learning model, which indicated that the Upstream discharge had the greatest impact on the NO3-N load at that location (Figure 6).
As seen in Figure 7, the NO3-N load to the wetland was high in the fall, then again in March and April, corresponding to the periods with the highest groundwater discharge rates (Figure 4B). These findings are consistent with a study by Miller et al. (2016), which found a positive relationship between base flow index (BFI) and in-stream NO3-N loads. Therefore, estimating BFI over short periods (i.e., monthly) within PEI watersheds could aid in understanding NO3-N load dynamics within groundwater-influenced systems. The seasonal trends and magnitude of loads in this study should be interpreted with caution due to the inter-annual variability in weather patterns (e.g., precipitation and temperature) that can significantly impact local and regional hydrological processes (Danielescu, 2023; Pavlovskii et al., 2023). For example, Oliver et al. (2024), using a PEI-based hydrologic model and future climate projections, showed that the fall peak in nitrate loads may shift from late fall to early December, while the spring peak may occur earlier in the season. Furthermore, Oliver et al. (2024) found that baseflow may increase during the winter and early spring as a result of increased precipitation as rainfall, more mid-winter thaws, and an earlier spring melt period, and a projected five-fold increase in February by the end of the century (2070–2100). In the current study the groundwater contribution to the Mill Pond wetland bypasses the riparian zone and enters the wetland via underwater springs, which allows for nitrate-rich groundwater to directly enter the receiving water body. As such, a potential five-fold increase in bypass flows during colder months (January and February), when the removal of NO3-N within the wetland is at a minimum (Figure 7), could significantly increase the impact of nitrate in these freshwater systems.
5.4 The wetland response to nitrate loads
Danielescu et al. (2024) simulated a 3-year potato-barley-clover crop rotation for a field at the Harrington Experimental Farm and found that ∼90 kg NO3-N/ha/yr leached below the root zone in the potato year, while the barley and red clover (catch crops) years leached ∼29 kg NO3-N/ha/yr each. Interestingly, the load data from this study results in a catchment-based loading rate of 54.1 kg NO3-N/ha catchment/yr (i.e., using the catchment area upgradient of the study site, Figure 1), which falls within the simulated leaching loads for potatoes and catch crops. In 2023 only 5.5% of the upgradient catchment was cropland in potato phase (Agriculture and Agri-Food Canada, 2024), which suggests that the NO3-N loads we have determined are related to agricultural land use in previous years (i.e., legacy NO3-N). For the study period the total NO3-N load to the wetland was approximately 30,000 kg NO3-N/yr. Steiness et al. (2021) estimated that a 1.3 ha wetland within an agricultural landscape in Denmark received an average annual NO3-N load of 1,033 kg NO3-N/yr (41 kg NO3-N/ha catchment/yr) between 1990 and 2008, noting that these loads were, at the time, on the high end of reported values. A recent study by Oliver et al. (2024) in the Basin Head Lagoon, located in northeastern PEI, found that the annual NO3-N load to the lagoon between 1990–2020 was 7 kg NO3-N/ha catchment/yr, where groundwater contributed 83% of the load. The annual NO3-N load we have determined for the Mill Pond wetland (54.1 kg NO3-N/ha catchment/yr) is thus relatively high in comparison.
The small (1.2 ha) groundwater-influenced wetland investigated here attenuated approximately 39% of the total annual NO3-N load (30,000 kg NO3-N/yr); on catchment area basis this is equivalent to 21.1 kg NO3-N/ha catchment/yr. The wetland behaved as a NO3-N sink for approximately 94% of the study period, or 49 out of 52 weeks, a NO3-N source for two weeks during January and February, and neither a NO3-N source nor sink for one week in January (Figure 7). As seen in Figure 9, there is notable seasonal variability in the NO3-N attenuation capacity of the wetland, with the winter (Dec-Feb) having removal rates in the range of 8 to −41% (where the data point in late February-early March with a removal rate of −82% is excluded), the spring (Mar-May) having removal rates in the range of −15% to −71%, the summer (Jun-Aug) having removal rates in the range of −15% to −55%, and the fall (Sep-Nov) having removal rates in the range of −17% to −65%, where negative values indicate a net reduction in load. Although previous studies did not report nitrate removal rates on a seasonal basis, Steiness et al. (2021) found that a 1.3 ha wetland attenuated between 43% and 83% of the annual NO3-N load, while Cheng et al. (2020) found that strategically placed wetlands could reduce NO3-N loads by 54%. The ranges of removal rates observed in the Mill Pond wetland are similar to previously reported values; however, they also highlight the significant seasonal variability in NO3-N dynamics which may be missed with low-frequency monitoring.

Figure 9. The imported NO3-N load and the % change in NO3-N load by season, where a negative % change in NO3-N load indicates the wetland is a NO3-N sink.
As shown in a previous study in a constructed wetland (Kuschk et al., 2003), seasonal variation in nitrate attenuation within wetlands in temperate climates should be expected, given that lower water temperatures would reduce the amount of vegetative uptake and biological activity. However, as seen in Figure 9, the NO3-N load reductions for all four seasons generally overlap in the range of −15% to −55%, indicating that the wetland investigated here may attenuate nitrate regardless of season. Figure 9 reveals a positive, non-linear trend between the imported NO3-N load and the change in NO3-N load and, by extension, the impact of increased discharge to the wetland. These results suggest that the wetland attenuates disproportionately more nitrate during high imported loads, especially during the spring and fall periods. Veraart et al. (2011) found that temperature disproportionately increases denitrification rates within constructed wetlands, which could be a potential factor producing the trend observed in the Mill Pond wetland.
As discussed in Mitsch and Wilson (1996), constructed wetlands could take 15–20 years to reach their full biologically viability and sustainability. The Mill Pond wetland was constructed in the 1950s and is considered well established. However, wetlands continuously evolve over time, notably due to sediment accumulation driven by factors such as geomorphology and hydrology (Anderson and Mitsch, 2006). The findings reported here provide a one-year snapshot of the wetland functioning, but it is possible that the nitrate attenuation capacity may change over longer time periods due to changes in wetland vegetation, land use and climate.
5.5 Potential nitrate removal processes
Previous studies by Jiang and Somers (2009) and Malenica (2015) have found that denitrification is not significant in attenuating nitrate within the PEI sandstone aquifer. This finding, combined with groundwater flow paths that apparently bypass the riparian zone, indicates that nitrate in groundwater is likely not attenuated before entering the Mill Pond wetland. This is also supported by the significant DO concentrations (>8.0 mg/L) determined at all locations, including the groundwater springs within the wetland (see Supplementary Table S2). While it was beyond the scope of the current study to identify specific NO3-N removal mechanisms, and there is limited evidence of denitrification (Crossley et al., 2024), it is possible that denitrification may be occurring in regions of the wetland bottom sediments not influenced by groundwater discharge, where low DO levels (i.e., <0.5 mg/L; Savard et al., 2010) may exist. In addition, the role of wetland vegetation, such as filamentous green algae, which proliferates during the summer months (e.g., Supplementary Figure S1) and is commonly observed in PEI freshwater wetlands (Cynthia Crane, personal communication, 17 April 2024), is not well understood. Additionally, it is understood that wetlands may remove other contaminants such as phosphorus and pesticides that were not investigated in this study (e.g., Kennedy and Mayer, 2002; Nowell, 2000). In future work, a multi-year study investigating the attenuation of various agricultural contaminants within a constructed wetland may provide greater insight into the removal potential of small wetlands as they evolve.
6 Conclusion
This study has assessed the surface and subsurface nitrate loads delivered to a small (1.2 ha) groundwater-influenced constructed wetland using high-frequency NO3-N concentration and discharge data. Because NO3-N concentrations in groundwater and surface water were relatively constant during the year-long investigation, variations in discharge rates were the dominant factor affecting the variation in nitrate loads delivered to the wetland. Groundwater discharge, bypassing the riparian zone, had higher NO3-N concentrations than surface water inflows and contributed 67% of the total nitrate load to the wetland. The total nitrate load to the wetland from the 555 ha catchment area was approximately 30,000 kg NO3-N/yr, (i.e., 54.1 kg NO3-N/ha catchment/yr) which is substantial in comparison to other studies.
The constructed wetland behaved as a nitrate sink for 94% of the year-long study period, attenuating approximately 11,600 kg NO3-N/yr or 39% of the total annual NO3-N load. The average weekly NO3-N removal rate was 33%, with variations depending on the time of year; weekly removal rates were in the range of 8%–41% during colder months and 16%–71% during the warmer months. These removal rates highlight the potential of small, constructed wetlands to be used as effective year-round nitrate attenuation systems within agricultural watersheds in PEI. Furthermore, a positive non-linear trend between the imported NO3-N load and the change in NO3-N reduction was identified, which is an important finding given that PEI climate change projections indicate higher intensity storms may result in larger event-based groundwater nitrate loads to surface waters.
As the first high-frequency, and four-season, groundwater-surface water-wetland nitrate study to be conducted in the region, these findings highlight not only the substantial NO3-N loads within a typical rural watershed, but also the potential for small, constructed wetlands to be used as an effective component of nitrate BMP strategies.
Data availability statement
The raw data supporting the conclusions of this article will be made available by the authors, without undue reservation.
Author contributions
LC: Conceptualization, Data curation, Formal Analysis, Investigation, Methodology, Visualization, Writing–original draft. KM: Conceptualization, Data curation, Funding acquisition, Investigation, Methodology, Resources, Supervision, Validation, Writing–review and editing. SD: Conceptualization, Data curation, Resources, Supervision, Validation, Writing–review and editing.
Funding
The author(s) declare that financial support was received for the research, authorship, and/or publication of this article. Funding for this research is provided by the Natural Sciences and Engineering Council of Canada (Discovery Grant held by K. T. B MacQuarrie) with support from Agriculture and Agri-Food Canada’s Living Labs program.
Acknowledgments
We thank Dennis Connor (UNB), Mona Levesque (AAFC), Jared Wright (AAFC), and the Harrington Experimental Farm staff for valuable field and/or laboratory assistance. We acknowledge Ethan Eddy (UNB and E2 Analytics) for his expertise in machine learning models and Sheldon Hann (AAFC) for his assistance in acquiring land use and GIS files. We acknowledge Megan Stone (CBCL) for her guidance in developing a surface water model in PCSWMM, and Computational Hydraulics Inc. (CHI) for providing a student license for PCSWMM for this study. Cynthia Crane, formerly with the PEI Department of Environment, Energy and Climate Action, provided insight regarding the algae occurrence within the study wetland. We thank the Holmes family, local landowners, for generously allowing access to the site and for providing historical information about the area.
Conflict of interest
The authors declare that the research was conducted in the absence of any commercial or financial relationships that could be construed as a potential conflict of interest.
Generative AI statement
The author(s) declare that no Generative AI was used in the creation of this manuscript.
Publisher’s note
All claims expressed in this article are solely those of the authors and do not necessarily represent those of their affiliated organizations, or those of the publisher, the editors and the reviewers. Any product that may be evaluated in this article, or claim that may be made by its manufacturer, is not guaranteed or endorsed by the publisher.
Supplementary material
The Supplementary Material for this article can be found online at: https://www.frontiersin.org/articles/10.3389/fenvs.2025.1513704/full#supplementary-material
References
Agriculture and Agri-Food Canada (2024). Annual crop inventory. Available at: https://agriculture.canada.ca/atlas/apps/aef/main/index_en.html?AGRIAPP=23.
Anderson, C. J., and Mitsch, W. J. (2006). Sediment, carbon, and nutrient accumulation at two 10-year-old created riverine marshes. Wetlands 26 (3), 779–792. doi:10.1672/0277-5212(2006)26[779:SCANAA]2.0.CO;2
Beltran, J., Lautz, L. K., and Slosson, J. R. (2021). The impact of stream-groundwater exchange on seasonal nitrate loads in an urban stream. Hydrol. Process. 35 (8), e14324. doi:10.1002/hyp.14324
Benson, V. S., VanLeeuwen, J. A., Sanchez, J., Dohoo, I. R., and Somers, G. H. (2006). Spatial analysis of land use impact on ground water nitrate concentrations. J. Environ. Qual. 35 (2), 421–432. doi:10.2134/jeq2005.0115
Bhatti, A. Z., Farooque, A. A., Krouglicof, N., Peters, W., Acharya, B., Li, Q., et al. (2021). Climate change impacts on precipitation and temperature in Prince Edward Island, Canada. World Water Policy 7 (1), 9–29. doi:10.1002/wwp2.12046
Bhatti, A. Z., Farooque, A. A., Krouglicof, N., Peters, W., Li, Q., and Acharya, B. (2022). Prospective climates, and water availabilities under different projections of environmental changes in Prince Edward Island, Canada. Water 14 (5), 740. doi:10.3390/w14050740
Botrel, M., Hudon, C., Heffernan, J. B., Biron, P. M., and Maranger, R. (2022). Climate-driven variations in nitrogen retention from a riverine submerged aquatic vegetation meadow. Water Resour. Res. 58 (10), e2022WR032678. doi:10.1029/2022WR032678
Bowes, M. J., Smith, J. T., and Neal, C. (2009). The value of high-resolution nutrient monitoring: a case study of the River Frome, Dorset, UK. J. Hydrology 378 (1), 82–96. doi:10.1016/j.jhydrol.2009.09.015
Cheng, F. Y., and Basu, N. B. (2017). Biogeochemical hotspots: role of small water bodies in landscape nutrient processing. Water Resour. Res. 53 (6), 5038–5056. doi:10.1002/2016WR020102
Cheng, F. Y., Van Meter, K. J., Byrnes, D. K., and Basu, N. B. (2020). Maximizing US nitrate removal through wetland protection and restoration. Nature 588 (7839), 625–630. Article 7839. doi:10.1038/s41586-020-03042-5
Conant, B., Danielescu, S., Reeves, H., and Coulibaly, P. (2016). “Groundwater/surface water interaction. Chapt. 2,” in Groundwater science relevant to the great lakes water quality agreement: a status report. Editors G. Grannemann,, and D. Van Stempvoort (Environment and Climate Change Canada and U.S. Environmental Protection Agency).
Crawford, M., and Alexander, A. C. (2024). Fish kills and insecticides: historical water quality patterns in 10 agricultural watersheds in Prince Edward Island, Canada (2002–2022). Front. Sustain. Food Syst. 8. doi:10.3389/fsufs.2024.1356579
Critchley, K., Rudolph, D. L., Devlin, J. F., and Schillig, P. C. (2014). Stimulating in situ denitrification in an aerobic, highly permeable municipal drinking water aquifer. J. Contam. Hydrology 171, 66–80. doi:10.1016/j.jconhyd.2014.10.008
Crossley, L. M., MacQuarrie, K. T. B., and Danielescu, S. (2024). “Agricultural nitrate attenuation in a small groundwater-influenced wetland system,” in [conference paper], GeoMontreal: CGS/IAH-CNC groundwater conference (Montreal, Quebec).
Danielescu, S. (2023). Development and application of ETCalc, a unique online tool for estimation of daily evapotranspiration. Atmosphere-Ocean 61 (3), 135–147. doi:10.1080/07055900.2022.2154191
Danielescu, S., and MacQuarrie, K. T. (2013). Nitrogen and oxygen isotopes in nitrate in the groundwater and surface water discharge from two rural catchments: implications for nitrogen loading to coastal waters. Biogeochemistry 115 (1), 111–127. doi:10.1007/s10533-012-9823-z
Danielescu, S., MacQuarrie, K. T., Zebarth, B., Nyiraneza, J., Grimmett, M., and Levesque, M. (2022). Crop water deficit and supplemental irrigation requirements for potato production in a temperate humid region (Prince Edward Island, Canada). Water 14 (17), 2748. doi:10.3390/w14172748
Danielescu, S., and MacQuarrie, K. T. B. (2011). Nitrogen loadings to two small estuaries, Prince Edward Island, Canada: a 2-year investigation of precipitation, surface water and groundwater contributions. Hydrol. Process. 25 (6), 945–957. doi:10.1002/hyp.7881
Danielescu, S., MacQuarrie, K. T. B., and Faux, R. N. (2009). The integration of thermal infrared imaging, discharge measurements and numerical simulation to quantify the relative contributions of freshwater inflows to small estuaries in Atlantic Canada. Hydrol. Process. 23 (20), 2847–2859. doi:10.1002/hyp.7383
Danielescu, S., MacQuarrie, K. T. B., Nyiraneza, J., Zebarth, B., Sharifi-Mood, N., Grimmett, M., et al. (2024). Development and validation of a crop and nitrate leaching model for potato cropping systems in a temperate–humid region. Water 16 (3), 475. doi:10.3390/w16030475
Dibblee, R. (2000). PEI Wetlands [Vector digital data]. Available at: www.gov.pe/gis.
Dunn, A. M., Julien, G., Ernst, W. R., Cook, A., Doe, K. G., and Jackman, P. M. (2011). Evaluation of buffer zone effectiveness in mitigating the risks associated with agricultural runoff in Prince Edward Island. Sci. Total Environ. 409 (5), 868–882. doi:10.1016/j.scitotenv.2010.11.011
Environment and Climate Change Canada (2024). Historical data—climate. Available at: https://climate.weather.gc.ca/historical_data/search_historic_data_e.html.
Government of Prince Edward Island (2019). Corporate landuse inventory 2010. Available at: https://data.princeedwardisland.ca/.
Grizard, P. (2013). Modelling nitrate loading from watersheds to coastal waters of the northumberland strait. [master’s thesis]. Canada: The University of New Brunswick.
Hansen, A. T., Campbell, T., Cho, S. J., Czuba, J. A., Dalzell, B. J., Dolph, C. L., et al. (2021). Integrated assessment modeling reveals near-channel management as cost-effective to improve water quality in agricultural watersheds. Proc. Natl. Acad. Sci. 118 (28), e2024912118. doi:10.1073/pnas.2024912118
Hansen, A. T., Dolph, C. L., Foufoula-Georgiou, E., and Finlay, J. C. (2018). Contribution of wetlands to nitrate removal at the watershed scale. Nat. Geosci. 11 (2), 127–132. doi:10.1038/s41561-017-0056-6
Jiang, Y., Nishimura, P., van den Heuvel, M. R., MacQuarrie, K. T. B., Crane, C. S., Xing, Z., et al. (2015). Modeling land-based nitrogen loads from groundwater-dominated agricultural watersheds to estuaries to inform nutrient reduction planning. J. Hydrology 529, 213–230. doi:10.1016/j.jhydrol.2015.07.033
Jiang, Y., and Somers, G. (2009). Modeling effects of nitrate from non-point sources on groundwater quality in an agricultural watershed in Prince Edward Island, Canada. Hydrogeology J. 17 (3), 707–724. doi:10.1007/s10040-008-0390-2
Kennedy, G., and Mayer, T. (2002). Natural and constructed wetlands in Canada: an overview. Water Qual. Res. J. 37 (2), 295–325. doi:10.2166/wqrj.2002.020
Kuschk, P., Wiessner, A., Kappelmeyer, U., Weissbrodt, E., Kästner, M., and Stottmeister, U. (2003). Annual cycle of nitrogen removal by a pilot-scale subsurface horizontal flow in a constructed wetland under moderate climate. Water Res. 37 (17), 4236–4242. doi:10.1016/S0043-1354(03)00163-5
Lamb, K. J., MacQuarrie, K. T. B., Butler, K. E., Danielescu, S., Mott, E., Grimmet, M., et al. (2019). Hydrogeophysical monitoring reveals primarily vertical movement of an applied tracer across a shallow, sloping low-permeability till interface: implications for agricultural nitrate transport. J. Hydrology 573, 616–630. doi:10.1016/j.jhydrol.2019.03.075
Liang, K., Jiang, Y., Nyiraneza, J., Fuller, K., Murnaghan, D., and Meng, F.-R. (2019). Nitrogen dynamics and leaching potential under conventional and alternative potato rotations in Atlantic Canada. Field Crops Res. 242, 107603. doi:10.1016/j.fcr.2019.107603
Lundberg, S. M., and Lee, S.-I. (2017). “A unified approach to interpreting model predictions,” in [conference paper], 31st conference on neural information processing systems (Long Beach, CA, USA).
Mackie, C., Levison, J., Binns, A., and O’Halloran, I. (2021). Groundwater-surface water interactions and agricultural nutrient transport in a Great Lakes clay plain system. J. Gt. Lakes. Res. 47 (1), 145–159. doi:10.1016/j.jglr.2020.11.008
Malencia, A. (2015). Evaluation of nitrate distribution and matrix storage effects in a dual permeability fractured bedrock aquifer with heterogeneous hydrochemistry [master's thesis]. Canada: The University of Guelph.
Miller, M. P., Tesoriero, A. J., Capel, P. D., Pellerin, B. A., Hyer, K. E., and Burns, D. A. (2016). Quantifying watershed-scale groundwater loading and in-stream fate of nitrate using high-frequency water quality data. Water Resour. Res. 52 (1), 330–347. doi:10.1002/2015WR017753
Mitsch, W. J., and Wilson, R. F. (1996). Improving the success of wetland creation and restoration with know-how, time, and self-design. Ecol. Appl. 6 (1), 77–83. doi:10.2307/2269554
Nowell, L. H. (2000). Pesticides in stream sediments and aquatic biota (pesticides in stream sediment and aquatic biota) [fact sheet]. Sacramento, CA: USGS Publications. Available at: https://pubs.usgs.gov/fs/2000/0092/fs20000092.pdf.
Oliver, A. C., Kurylyk, B. L., Johnston, L. H., LeRoux, N. K., Somers, L. D., and Jamieson, R. C. (2024). Impacts of climate change and best management practices on nitrate loading to a eutrophic coastal lagoon. Front. Environ. Sci. 12. doi:10.3389/fenvs.2024.1468869
Pavlovskii, I., Jiang, Y., Danielescu, S., and Kurylyk, B. L. (2023). Influence of precipitation event magnitude on baseflow and coastal nitrate export for Prince Edward Island, Canada. Hydrol. Process. 37 (5), e14892. doi:10.1002/hyp.14892
Pedregosa, F., Varoquaux, G., Gramfort, A., Michel, V., Thirion, B., Grisel, O., et al. (2011). Scikit-learn: machine learning in Python. J. Mach. Learn. Res. 12, 2825–2830. doi:10.48550/arXiv.1201.0490
Savard, M. M., Somers, G., Smirnoff, A., Paradis, D., Bochove, E. van, and Liao, S. (2010). Nitrate isotopes unveil distinct seasonal N-sources and the critical role of crop residues in groundwater contamination. J. Hydrology 381 (1), 134–141. doi:10.1016/j.jhydrol.2009.11.033
Schück, M., and Greger, M. (2022). Chloride removal capacity and salinity tolerance in wetland plants. J. Environ. Manag. 308, 114553. doi:10.1016/j.jenvman.2022.114553
Sierra-Porta, D. (2024). Assessing the impact of missing data on water quality index estimation: a machine learning approach. Discov. Water 4 (1), 11. doi:10.1007/s43832-024-00068-y
Somers, G. (1992). “Agricultural impacts on water quality—a P.E.I. perspective [national workshop proceedings],” in Agricultural impacts on water quality (Ottawa, Ontario).
Somers, G., Raymond, B., and Uhlman, W. (1999). P.E.I. Water quality interpretive report. doi:10.13140/RG.2.1.1872.9442
Steiness, M., Jessen, S., van’t Veen, S. G. M., Kofod, T., Højberg, A. L., and Engesgaard, P. (2021). Nitrogen-loads to streams: importance of bypass flow and nitrate removal processes. J. Geophys. Res. Biogeosciences 126 (5), e2020JG006111. doi:10.1029/2020JG006111
Stevens, C. E., Gabor, T. S., and Diamond, A. W. (2003). Use of restored small wetlands by breeding waterfowl in Prince Edward Island, Canada. Restor. Ecol. 11 (1), 3–12. doi:10.1046/j.1526-100X.2003.00107.x
Veraart, A. J., de Klein, J. J. M., and Scheffer, M. (2011). Warming can boost denitrification disproportionately due to altered oxygen dynamics. PLoS ONE 6 (3), e18508. doi:10.1371/journal.pone.0018508
Keywords: nitrate attenuation, constructed wetland, agricultural watershed, nitrate load pathways, beneficial management practices, high-frequency data
Citation: Crossley LM, MacQuarrie KTB and Danielescu S (2025) Agricultural nitrate attenuation in a small groundwater-influenced wetland system. Front. Environ. Sci. 13:1513704. doi: 10.3389/fenvs.2025.1513704
Received: 18 October 2024; Accepted: 10 February 2025;
Published: 28 February 2025.
Edited by:
Jana Levison, School of Engineering, University of Guelph, CanadaReviewed by:
Doru Stelian Banaduc, Lucian Blaga University of Sibiu, RomaniaHenrique J. O. Pinho, Polytechnic Institute of Tomar (IPT), Portugal
Copyright © 2025 Crossley, MacQuarrie and Danielescu. This is an open-access article distributed under the terms of the Creative Commons Attribution License (CC BY). The use, distribution or reproduction in other forums is permitted, provided the original author(s) and the copyright owner(s) are credited and that the original publication in this journal is cited, in accordance with accepted academic practice. No use, distribution or reproduction is permitted which does not comply with these terms.
*Correspondence: Kerry T. B. MacQuarrie, a3RtQHVuYi5jYQ==
†ORCID ID: Serban Danielescu, orcid.org/0000-0001-8555-9708