 Runjia Yang1
 Tingting Feng
94% of researchers rate our articles as excellent or good
Learn more about the work of our research integrity team to safeguard the quality of each article we publish.
Find out more
ORIGINAL RESEARCH article
Front. Environ. Sci., 25 March 2025
Sec. Environmental Economics and Management
Volume 13 - 2025 | https://doi.org/10.3389/fenvs.2025.1511025
Industrial carbon emission reduction is not only the need to cope with climate change and environmental pollution, but also an important way to achieve sustainable economic development. This paper first constructs an evaluation system of urban green development index from four dimensions: economy, society, resources and environment. Then, the undesirable super-efficiency SBM model is used to measure the static industrial carbon emission efficiency, and the spatiotemporal characteristics of the dynamic industrial carbon emission efficiency are analyzed by combining the Malmquist index. Finally, the urban green development index was incorporated into the Tobit regression model, and the impact of energy intensity, urban structure and other factors on industrial carbon emission efficiency was considered. This paper cited 18 cities in Sichuan Province from 2015 to 2022 as an example for analysis. The results show that the overall green development level of Sichuan from 2015 to 2022 shows a downward trend, and there is great room for improvement in the level of green development. The average industrial carbon emission efficiency in Sichuan is 0.740, and the difference in industrial carbon emission efficiency is mainly due to the difference in pure technical efficiency. From 2015 to 2022, Sichuan’s industrial carbon emission efficiency showed a trend of first stable and then decreasing. There is a significant positive correlation between the level of green development and the efficiency of industrial carbon emissions. Altogether, the industrial carbon emission efficiency model established in this paper is of vital magnitude to the low-carbon development of regional industry.
With the rapid development of the economy and the acceleration of urbanization, energy consumption and environmental problems are becoming increasingly serious (Ye et al., 2019). In detail, total energy consumption augmented from 1.47 billion tons of standard coal equivalent in 2000 to 5.97 billion tons of standard coal equivalent in 2024. Industry is the predominant driving force to energy consumption and carbon dioxide emissions (Muhammad et al., 2020). China’s industrial carbon emissions account for about 80% of total carbon emissions (Wang et al., 2024). Industrial carbon emissions have emerged as a pressing issue that cannot be overlooked and demands immediate attention. Green development has become an issue of common concern to the international community. In 2015, the Chinese government put forward the concept of “green development,” which means that while developing the economy, it should concentrate on ecological environmental protection and sustainable use of resources to actualize coordinated development of the economy, society and ecology (Lin and Liu, 2022).
This paper selects Sichuan Province as a case study. Sichuan Province is one of the paramount economic centers in western China. While its economy is developing speedily, it is also facing the dual challenges of environmental protection and energy consumption. Sichuan Province is actively exploring green development models, but faces a multitude of difficulties in achieving urbanization, encompassing environmental pollution. The level of industrialization in Sichuan Province continues to increase, the processing manufacturing industry and high-tech industries continue to grow, and industrial carbon emissions account for a crucial part of Sichuan’s total carbon emissions. In contrast to other provinces, Sichuan Province has a unique geographical environment and abundant natural resources, which poses special challenges to urban green development. Meanwhile, Sichuan Province is also part of the upper reaches of the Yangtze River and the Minjiang River Basin, and has strong relevance and interactivity with environmental protection and green development in other provinces. Thus, studying the spatiotemporal differentiation and influencing factors of regional industrial carbon emission efficiency in Sichuan Province has pivotal practical significance for a comprehensive understanding of the correlation between regional economic development and environmental protection.
The purpose of this study is to push ahead sustainable economic development and facilitate economic transformation and upgrading. This study first measures the city’s green development index to assess the city’s green development level. Aside from that, the undesirable super-efficiency SBM model is utilized to measure the static industrial carbon emission efficiency and delve into the carbon emission efficiency of each city at a specific time. Subsequently, the Malmquist index is employed to look into the changing characteristics of dynamic industrial carbon emission efficiency as well as its temporal and spatial discrepancies, and to dig into the changes in efficiency in different time periods. Last but not least, the green development index is incorporated into the Tobit regression model on the basis of evaluating the changes in static and dynamic industrial carbon emission efficiency. Additionally, its impact on industrial carbon emission efficiency is analyzed in combination with multiple factors comprising energy intensity and urban structure. This paper conducts an in-depth analysis of 18 cities in Sichuan Province, which is intended to provide reference and lessons for the green and sustainable development of regional industry. This study is not only advantageous for us to delve into the association between green development and carbon emission efficiency, but also can offer adequate data support for policy formulation and practice of relevant departments. The rest of the paper is structured as follows: Section 2 presents the research methodology, Section 3 provides an overview of the study area and data sources, Section 4 presents the results of this study, and Section 5 presents the research conclusions and recommendations.
The green development index is an important reference for measuring the level of green development, and the construction of urban green development index plays an important role in regional sustainable development. Common evaluation methods for green development index include entropy method, cluster analysis, DDF-GML index system (Yu and Luo, 2024), Quantile Regression model (Lin and Tan, 2019), DEA model, and GML index method (He H. F. et al., 2024). Scholars have carried out multi-dimensional research on the construction of green economy evaluation system. Based on the green economy measurement framework, the United Nations Environment Programme has developed a comprehensive evaluation system covering three dimensions: resource efficiency, economic transition, and human wellbeing (UNEP, 2012). The Organisation for Economic Co-operation and Development has established a system of indicators for green growth, including economic systems, environmental quality and people’s wellbeing (OECD, 2011). Ouyang et al. (2009) systematically evaluated the level of urban green development in China through indicators such as investment intensity in environmental governance and urban green space coverage. Huang et al. (2012) constructed an evaluation index system for urban green development from three dimensions: urban construction, industrial development and technological innovation. The construction of the evaluation index system of green development index should be in line with the overall idea of combining green and development, and realize the unified and coordinated development of economy, society, ecology and resources.
Carbon emission efficiency refers to the amount of carbon emissions produced per unit of output, which is a kind of input-output efficiency. First of all, in terms of input-output indicators of carbon emission efficiency, the early research mainly focused on the evaluation of single factor indicators such as carbon productivity, carbon index (Mielnik and Goldemberg, 1999), and carbon intensity (Sun, 2005). However, due to the consideration of a single factor, it can only reflect the carbon emissions per unit of output (Zhang and Gong, 2022), and cannot reflect the impact of other elements on carbon emissions. As a result, scholars integrate other factors of production into a multi-input model to assess carbon emission efficiency, such as capital, labor, energy, and others (Keskin, 2021; Zhang et al., 2021; Zhou et al., 2022). Compared with the single-factor carbon emission efficiency, the total factor carbon emission efficiency fully reflects the complexity of economic activities and has the advantages of being more comprehensive, accurate and scientific.
Secondly, in terms of measurement methods, common methods for measuring carbon emission efficiency include stochastic frontier analysis (SFA) and data envelopment analysis (DEA). SFA needs to determine the specific form of the production frontier and can only consider a single output (Zhu and Lan, 2023), while DEA can process multiple-input, multiple-output data without setting the specific form of the production function (Taylan and Konstantinos, 2022; Zhu et al., 2023). Therefore, DEA is widely used in carbon emission measurement (Zhang et al., 2023; Liu and Zheng, 2023). With the deepening of research, the traditional DEA model lacks the consideration of undesired outputs, and cannot solve the problem of relaxation of input-output variables. Scholars are beginning to improve methods to measure carbon emission efficiency, such as the super-efficient SBM model (Shu et al., 2024; Wang et al., 2023), the Environmental DEA Crossover Model for Information Entropy Improvement (Han et al., 2018), and the Non-radial Direction Distance Function (Zhou et al., 2019).
The combination of DEA and Malmquist index is an effective way to quantify the dynamic change of carbon emission efficiency. The Malmquist index can measure the characteristics of efficiency over time (Lou, 2022), and the Malmquist index can be decomposed into changes in technological efficiency and changes in technological progress (Zheng, 2021), which can help managers identify specific areas of improvement that contribute the most to efficiency improvement. Wei et al. (2024) used the Malmquist index to evaluate the carbon emission efficiency of China’s transportation industry from 2010 to 2020. Cheng and Li (2022) investigated the carbon emission performance of China’s construction industry from 2004 to 2016 through the Malmquist index. Cheng and Li (2022) based on the relationship between energy input and carbon dioxide emissions, the Malmquist index measures the global total factor carbon emission productivity. Ding et al. (2019) combined a cross-efficiency model with the Malmquist Productivity Index to explore the dynamics of carbon emission efficiency in provinces in China. Most of the existing studies are limited to a single static or dynamic perspective, and a “static-dynamic” binary analytical framework has not yet been formed. By constructing a measurement system combining dynamic and static, this study can not only characterize the spatial heterogeneity characteristics of industrial carbon emission efficiency, but also analyze its temporal evolution dynamic mechanism, so as to provide methodological support for improving low-carbon economic policies.
In addition, with the deepening of the research on carbon emission efficiency, domestic and foreign scholars have formed a multi-dimensional and multi-scale research system in the field of research on the influencing factors of carbon emission efficiency. Zhang et al. (2023) systematically reveals the mechanism of structural imbalances in labor and energy allocation on the inhibition of China’s industrial carbon emission efficiency. Si et al. (2023) confirmed the synergistic effect of industrial structure optimization, transportation network improvement and economic development improvement on tourism efficiency. Guo and Li (2023) systematically analyze the key role of government policy support and logistics infrastructure modernization in improving the energy efficiency of the logistics industry. Lin et al. (2021) constructs an analytical framework that includes four dimensions: openness to the outside world, energy consumption intensity and structure, and R&D investment, revealing the differentiated driving paths of regional industrial carbon emission efficiency. Zhang et al. (2018) confirmed that the deepening of opening-up and the upgrading of industrial structure are the core driving forces to break through the bottleneck of carbon emission efficiency. Xie et al. (2021) revealed the contribution of technological progress to carbon emission efficiency by constructing a dynamic panel data model. Based on the existing research and the characteristics of regional industrial development, this paper selects six factors, namely economic development level, green development level, urban structure, industrial structure, energy intensity, and scientific research intensity, as the explanatory variables of industrial carbon emission efficiency.
The main contributions of this study are as follows: (1) This paper constructs an urban green development index system from the four dimensions of economy, society, resources and environment, aiming to comprehensively evaluate the level of urban green development and realize the coordinated development of urban economy, society, resources and environment. (2) Most of the studies only stop at the measurement of static efficiency, and lack the analysis of dynamic indicators. In order to comprehensively explore the industrial carbon emission situation, this paper uses undesirable super-efficiency SBM and Malmquist index to analyze the characteristics of industrial carbon emission efficiency from both static and dynamic aspects. (3) Although many scholars have studied the influencing factors of carbon emission efficiency, few studies have considered the impact of green development level on industrial carbon emission efficiency. This paper considers the impact of the level of green development on the efficiency of industrial carbon emissions, which can help the industrial sector improve production methods and reduce carbon emissions.
In order to promote regional green development, this paper first constructs the urban green development index from four aspects: economy, society, resources and environment, and then uses the undesirable super-efficiency SBM model to measure the industrial carbon emission efficiency by taking the original price of industrial fixed assets, the number of industrial employees, and the industrial terminal energy consumption as inputs, and the industrial sales revenue and industrial carbon emissions as outputs, and further uses the Malmquist index to analyze the dynamic industrial carbon emission efficiency. Then, the green development index was incorporated into the Tobit regression model, and the impact of economic development level, urban structure, industrial structure, energy intensity, and R&D intensity on industrial carbon emission efficiency was analyzed. The research framework is shown in Figure 1.
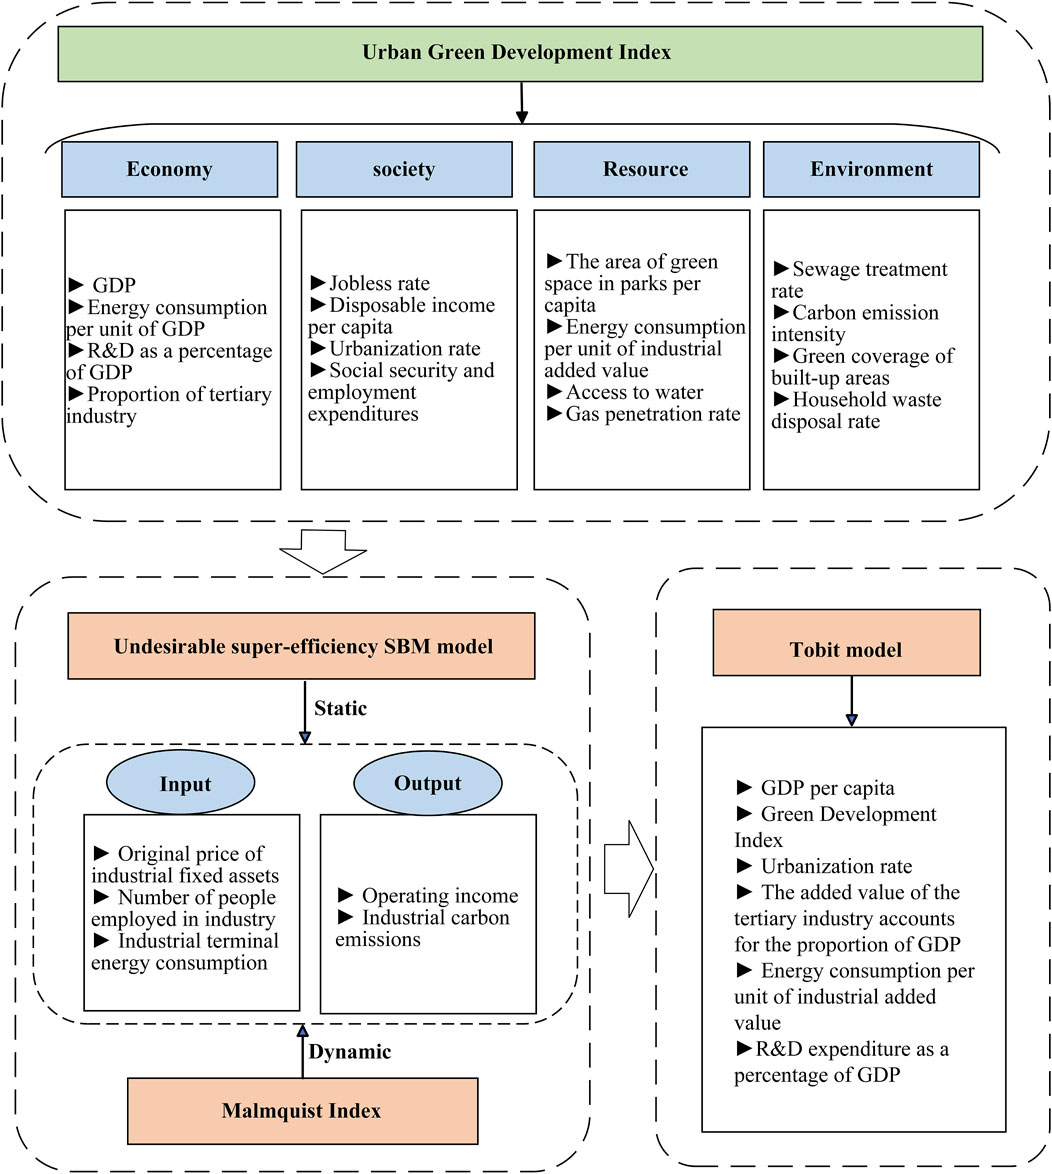
Figure 1. Research framework.
The accounting methodologies of energy carbon emissions are generally divided into top-down and bottom-up approaches (Wang and Zhu, 2024). The top-down method is usually adopted to measure carbon emissions from global or national data. This method usually collects global and national economic statistics and energy use data, encompassing data from multifarious links comprising production, consumption, import, and export, and uses complex mathematical models and algorithms for calculation (He L. et al., 2024). This method is comparatively difficult to calculate. The bottom-up method is a carbon emission accounting method grounded in energy use data. On the basis of multifarious energy consumption data, this method not only calculates the carbon emissions of each energy source by employing standard energy consumption and energy carbon emission coefficients, but also further sums up to obtain the total carbon emissions of a certain region. It’s pivotal to mention that this method unnecessarily involve excessive complex models and algorithms. On the contrary, it is comparatively intuitive and easy to be implemented, which thereby is extensively employed in associated research on carbon emissions.
Regarding the availability of energy-relevant data in Sichuan Province, this paper adopts a bottom-up approach to calculate carbon emissions, that is, converting the terminal energy consumption of raw coal, washed coal, coke and other energy sources into standard coal consumption, multiplying it by the carbon emission factor of each energy source, and finally summing up to obtain the total carbon emissions (Equation 1):
Among them,
This paper constructs an evaluation index system of urban green development index from four perspectives: economic development, social security, resource allocation and environmental protection. Economic growth is a prerequisite for the green and sustainable development of a region, and only continuous economic growth can further drive growth in other aspects. The level of economic development is reflected in GDP, scientific and technological development, etc., so the economic dimension selects GDP, energy consumption per unit of GDP, the proportion of R&D expenditure in GDP, and the proportion of tertiary industry. Social living conditions refer to the level of people’s quality of life, construction of living facilities, etc., and the indicators of unemployment rate, urbanization rate, per capita disposable income, social security and employment expenditure are selected from the social dimension. Resources are the basic material conditions for social development, and the rational overall allocation of resources is of great significance to social development. In this paper, the per capita park green space area, energy consumption per unit of industrial added value, water penetration rate, and gas penetration rate are selected from the resource dimension. The environmental dimension mainly includes pollution and treatment, and the sewage treatment rate, green coverage rate of built-up areas, domestic waste treatment rate, and carbon emission intensity indicators are selected. Table 1 shows the index system of urban green development index in Sichuan Province.
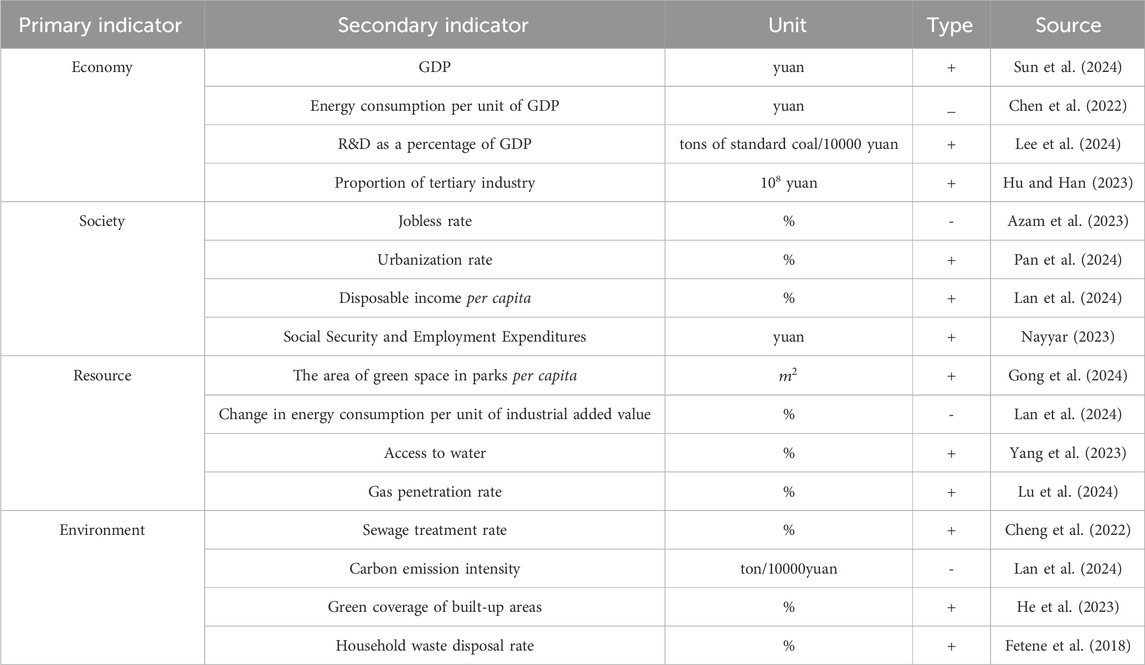
Table 1. Indicator system of urban green development index.
With an aim to eliminating the impact of dissimilar dimensions on the evaluation results, this paper first standardizes the various evaluation indicators in the green development index. The standardization of positive and negative indicators is presented as follows (Equations 2, 3):
Among them,
Then calculate the information entropy and weight of each indicator (Equations 4, 5):
Among them,
Finally, according to the linear weighted comprehensive evaluation formula, the green development index of the region in the year is obtained as follows (Equation 6):
The Data Envelopment Model (DEA) is a method to evaluate the relative effectiveness of the same type of decision-making unit based on multi-input and multi-output variables. Tone further proposes a super-efficient SBM model based on undesirable outputs, which considers the problem of “relaxation” in production, and directly incorporates the relaxation variables into the objective function to solve the relaxation problem of input-output variables. Moreover, the efficiency value of the decision unit of the super-efficient SBM model is not limited by [0,1]. When the super-efficiency value of the decision-making unit is greater than 1, the high-efficiency decision-making unit greater than 1 can be further accurately distinguished, and the efficiency evaluation problem is optimized. Therefore, in order to measure the efficiency of industrial carbon emissions more accurately, this paper considers the super-efficiency SBM model of undesired output. The specific model settings are as follows:
Assume there are
Among them,
According to the current situation of industrial carbon emissions in Sichuan Province and the characteristics of the industry itself, combined with the principle of data availability, this paper systematically constructs an evaluation index system of industrial carbon emission efficiency from five aspects: capital input, labor input (Guo et al., 2024), energy input, expected output, and undesired output, as shown in Table 2. The original capital price of industrial fixed assets is selected as capital input, the number of industrial employees is labor input, industrial energy consumption is energy input, industrial operating income is expected output, and industrial carbon emissions are undesired output.
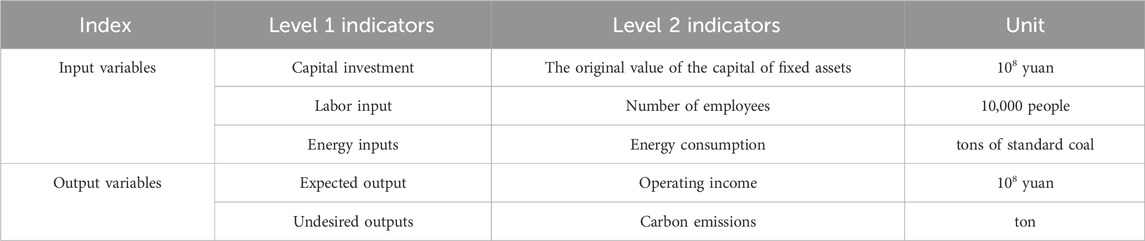
Table 2. Index system of industrial carbon emission efficiency in Sichuan Province.
The efficiency values calculated by the DEA model cannot be compared continuously in dissimilar time periods. The Malmquist index makes up for this shortcoming. This method measures the ratio of the efficiency of the current year to the efficiency of the previous year in a certain area, which is described from the viewpoint of dynamic changes. This method was first suggested by Sten Malmquist and is often utilized to measure changes in production efficiency. This paper analyzes the dynamic changes in industrial carbon emission efficiency in cities in Sichuan Province from 2015 to 2022 by calculating the Malmquist index. The formula is as follows (Equation 8):
Among them,
The Malmquist index can be decomposed into technical efficiency change (
If
The industrial carbon emission efficiency value of each decision-making unit is evaluated by the undesirable super-efficiency SBM model, so that the comprehensive technical efficiency is taken as the dependent variable and the relevant environmental variables are selected as the independent variables, and the environmental factors affecting the industrial carbon emission efficiency are further studied. In this paper, the Tobit model is used to conduct an empirical analysis of the influencing factors of industrial carbon emission efficiency. Compared with other regression models, the Tobit model can solve the problem of truncated values under the model of continuous variables, and can better understand the relationship between variables and the degree of influence on the dependent variables, which has certain flexibility and applicability. At the same time, the Tobit model can also handle the case of right-biased distribution, making the results more accurate. The formula for Tobit is as follows (Equation 12):
Among them,
Based on the research status and the actual industrial development of Sichuan Province, this paper selects six factors, namely economic development level, green development level, urban structure, industrial structure, energy intensity and scientific research intensity, as the explanatory variables of industrial carbon emission efficiency: (1) economic development level: this paper measures the economic development level by per capita GDP. (2) Green development level: the green development index is used as the measurement standard. (3) Urban structure: urban structure is measured by urbanization rate. (4) Industrial structure: the proportion of the added value of the tertiary industry in GDP is used as the standard to measure the industrial structure. (5) Energy intensity: energy intensity is measured by energy consumption per unit of industrial added value. (6) R&D intensity: R&D expenditure is measured by the proportion of R&D expenditure in GDP.
This paper selects 18 cities in Sichuan Province from 2015 to 2022 as research objects. Ascribable to the lack of data in some parts of Aba, Ganzi and Liangshan, they are not comprised in the research scope. As the economic center of southwest China, the Sichuan Provincial Government attaches enormous importance to the development of low-carbon economy. The “13th Five-Year Plan” and “14th Five-Year Plan” propose low-carbon and green development of industry. In line with the “Sichuan Statistical Yearbook”, the added value of industrial enterprises above designated size in Sichuan Province augmented by 3.8% in 2022 compared with the previous year. Ascribable to the diverse development stages, industrial composition and geographical conditions of various cities in Sichuan Province, their energy consumption and carbon emissions vary considerably in space. For this reason, under the background of low-carbon and green development, studying the industrial carbon emissions of diverse cities in Sichuan Province will help provide a scientific theoretical basis for future industrial development.
The research data predominantly comes from statistical yearbooks, government reports and website surveys. In detail, the per capita resource volume and industrial water consumption in the urban green development index data are extracted from the Sichuan Water Resources Bulletin from 2015 to 2022, the R&D expenditure to GDP ratio data are obtained from the Sichuan Science and Technology Funding Statistical Bulletin (http://tjj.sc.gov.cn/scstjj/tjgb/2022/9/7/657b925e009f43e5af845ad8f38f77ad.shtml), and other data are taken from the Sichuan Statistical Yearbook from 2016 to 2023 (http://tjj.sc.gov.cn/scstjj/c105855/nj.shtml). Industrial data includes operating income, number of employees, original price of fixed assets, total energy consumption and consumption by energy type. Industrial energy consumption data originate from the Statistical Yearbooks of 18 cities from 2016 to 2023, and the total industrial assets, number of industrial employees and original price of industrial fixed assets sourced from the Statistical Yearbook of Sichuan Province from 2016 to 2023. The standard coal conversion coefficients of multifarious energy sources originate from the China Energy Statistical Yearbook, and the carbon emission coefficients are sourced from relevant literature (Wen and Zhang, 2019; Hu et al., 2023).
In order to measure the level of coordinated social development, this paper measures the green development index from four dimensions: economy, society, environment and resources, as shown in Figure 2. From the perspective of regional differences, Chengdu has the highest level of green development, with an average green development index of 0.77 during the study period, of which the green development index in 2015 was 0.84. Secondly, Mianyang has a relatively high level of green development, with an average green development index of 0.53. There is little difference in the level of green development in other cities, and the green development index value fluctuates in the range of 0.25-0.46. From the perspective of time change, the overall green development level of 18 cities in Sichuan Province has decreased from 2015 to 2022, and there is great room for improvement in green development. The average green development index of Sichuan Province was 0.44 in 2015 and 0.40 in 2020, and the green development index decreased by 8.14% during the study period. From 2015 to 2022, the level of green development in most cities in Sichuan Province showed a gradual downward trend. Guang’an’s urban green development level decreased the most, from 0.56 in 2015 to 0.31 in 2020, a decrease of 44.59%. Secondly, the level of urban green development in Panzhihua, Mianyang and Ya’an decreased relatively more, by 25.81%, 19.56% and 20.28% respectively. The level of urban green development in Suining, Leshan, Nanchong, Meishan, Dazhou and Bazhong showed an upward trend, with an increase of 10.56%, 23.01%, 19.83%, 5.77%, 20.37% and 38.81% respectively.
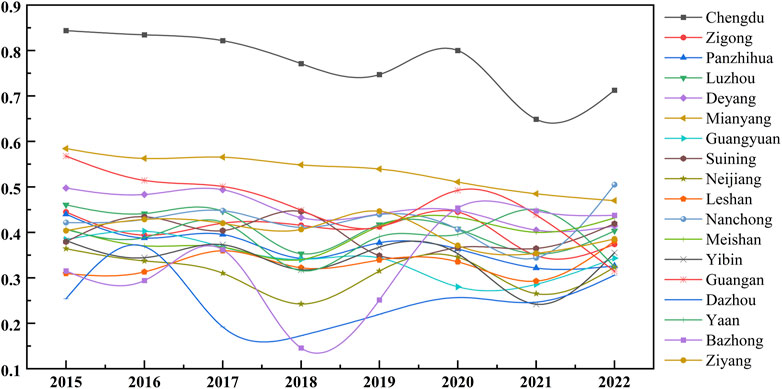
Figure 2. Green development levels of 18 cities in Sichuan Province.
Figure 3 displays the industrial carbon emissions of 18 cities in Sichuan Province from 2015 to 2022. As clearly revealed by the results, the overall industrial carbon emissions of 18 cities in Sichuan Province augmented during the study period, which corresponds to the downward trend in the green development level. Specifically, the total industrial carbon emissions displayed a downward trend from 2015 to 2018, which is consistent with the research findings of Li et al. (2022). The total industrial carbon emissions from 2015 to 2018 were 895.44
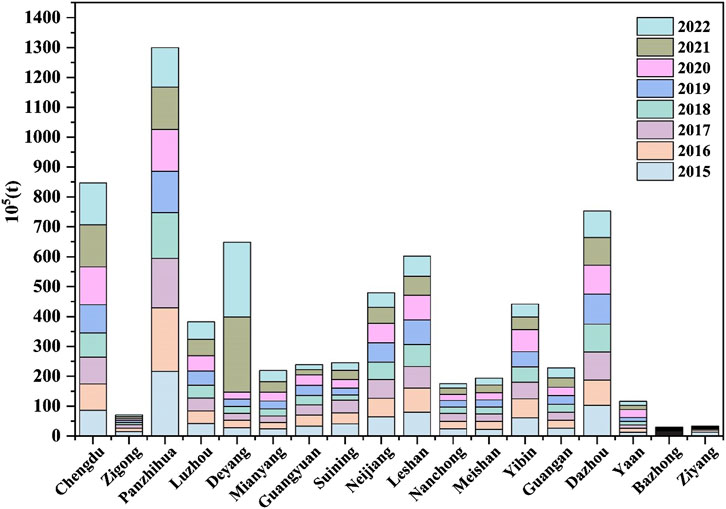
Figure 3. Industrial carbon emissions in 18 cities in Sichuan Province.
The input-output data of 18 cities in Sichuan Province from 2015 to 2022 were brought into the DEA model for analysis, and the static industrial carbon emission efficiency results of the cities were obtained, as shown in Table 3. From the perspective of time, from 2015 to 2022, the industrial carbon emission efficiency of Sichuan Province showed a trend of “decreasing-rising-declining.” In 2015–2017, the efficiency decreased. At this stage, facing the problem of overcapacity in traditional industries, and the environmental protection policy has not been strictly implemented at this time, enterprises do not have enough incentive to reduce emissions, resulting in reduced energy efficiency and increased carbon emissions. From 2017 to 2019, efficiency rebounded. At this stage, Sichuan Province adjusted its industrial structure and reduced the proportion of energy-intensive industries, thereby improving the efficiency of carbon emissions. From 2019 to 2022, the efficiency of industrial carbon emissions decreased again. During the pandemic, industrial production was hit, and companies temporarily relaxed environmental protection measures in order to maintain production, resulting in an increase in carbon emissions. In addition, in the process of economic recovery, in order to stimulate economic growth, priority is given to the recovery of energy-intensive and high-emission industries, resulting in a reduction in carbon emission efficiency. The overall level of industrial carbon emission efficiency in Sichuan Province is low, with an average industrial carbon emission efficiency of 0.740. Zigong, Deyang and Ziyang have relatively high industrial carbon emission efficiency, with average industrial carbon emission efficiency of 1.081, 1.010 and 1.043, respectively. Zigong implements the policy of “retreating from the city and entering the park,” eliminating backward production capacity and retaining efficient enterprises to promote refined and low-carbon production. Deyang Industry focuses on low-carbon fields such as nuclear power and wind power equipment, and has been selected as a national “Green Manufacturing Demonstration Park.” Relying on the Chengdu-Chongqing Economic Circle, Ziyang focuses on the development of emerging low-carbon industries such as new energy vehicles. As a result, these cities have a comparative advantage in industrial production and carbon emission management. In contrast, Neijiang, Dazhou and Ya’an have relatively low carbon emission efficiency, among which Dazhou has the lowest industrial carbon emission efficiency, with an average efficiency of 0.413, indicating that there is serious resource waste and carbon emission redundancy in their industrial production. This is due to the fact that Dazhou has abundant coal resources, its energy structure is heavily dependent on fossil energy, and its industrial structure is biased towards high-carbon industries.
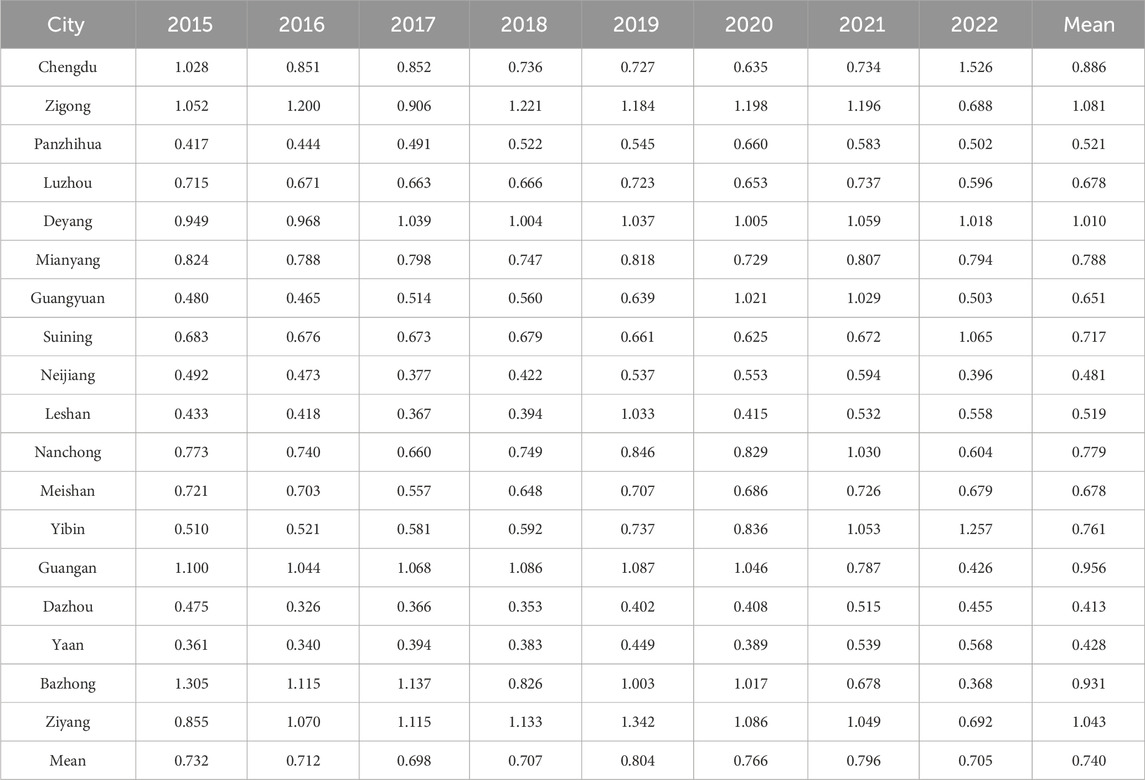
Table 3. Urban static industrial carbon emission efficiency.
The static industrial carbon emission efficiency can be decomposed into the pure technical efficiency of industrial carbon emissions and the scale efficiency of industrial carbon emissions, and the pure technical efficiency and scale efficiency are shown in Figure 4. It can be seen from the figure that the difference in urban industrial carbon emission efficiency is mainly due to the difference in pure technical efficiency, with the average pure technical efficiency value of only 0.844 and the average scale efficiency value of 0.897. From 2015 to 2022, the net technical efficiency of industrial carbon emissions in Sichuan Province showed an overall upward trend, and the average pure technical efficiency of Sichuan Province in 2019 was 0.941. During the study period, Chengdu, Deyang, Guang’an, Bazhong and Ziyang all had a pure technical efficiency value greater than 1, which means that these cities performed well in terms of technology and management. Chengdu implements total energy consumption control and energy-saving target management, and at the same time, introduces advanced production technology and equipment, so that enterprises can use resources and energy more efficiently, so as to maintain a relatively stable level of carbon emissions per unit of output.

Figure 4. Decomposition of static industrial carbon emission efficiency.
In this paper, the Malmquist index is further used to analyze the changes in the dynamic industrial carbon emission efficiency of 18 cities in Sichuan Province (Figure 5). From 2015 to 2022, the dynamic industrial carbon emission efficiency of Sichuan Province showed a trend of first stable and then decreasing. From 2015 to 2021, the dynamic industrial carbon emission efficiency of Sichuan changed little, and from 2021 to 2022, the dynamic industrial carbon emission efficiency of Sichuan was 0.802, a decrease of 26.86% compared with the initial stage of the study. In 2022, Sichuan suffered from extreme drought, with a decline in hydropower generation and a surge in thermal power generation, resulting in an increase in industrial carbon emission intensity and a significant deterioration in industrial carbon emission efficiency. The Malmquist index of most cities is greater than 1, which indicates that the industrial carbon emission efficiency of most cities has improved during the study period. Among them, Leshan and Yibin have a large dynamic industrial carbon emission efficiency, with an average dynamic industrial carbon emission efficiency of 1.184 and 1.181, respectively. In recent years, Leshan has vigorously implemented the strategy of strengthening the city through industry and accelerated the construction of a modern industrial system dominated by industry, resulting in great dynamic changes in its industrial carbon emission efficiency. The dynamic industrial carbon emission efficiency of Guang’an and Bazhong is small, with the average dynamic industrial carbon emission efficiency of 0.921 and 0.875, respectively.
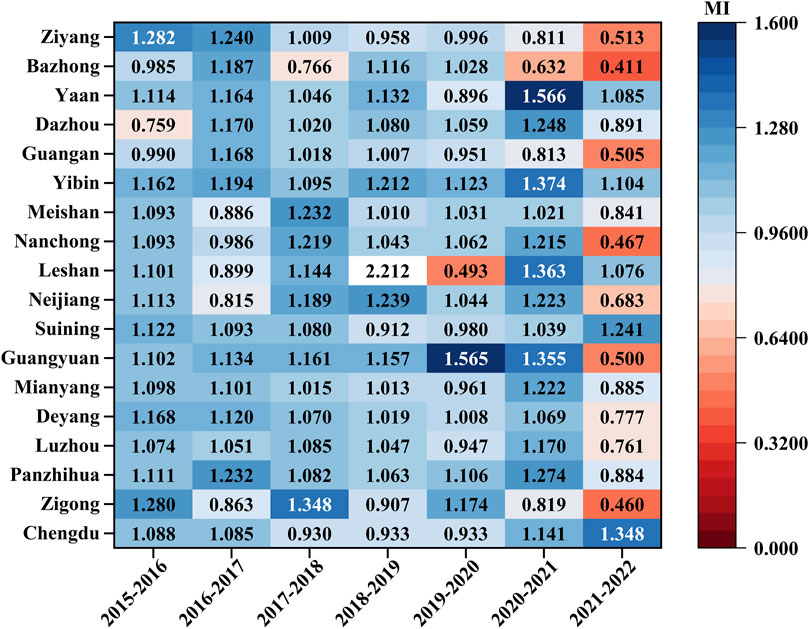
Figure 5. Dynamic industrial carbon emission efficiency.
In general, dynamic industrial carbon emission efficiency can be decomposed into technical efficiency change (
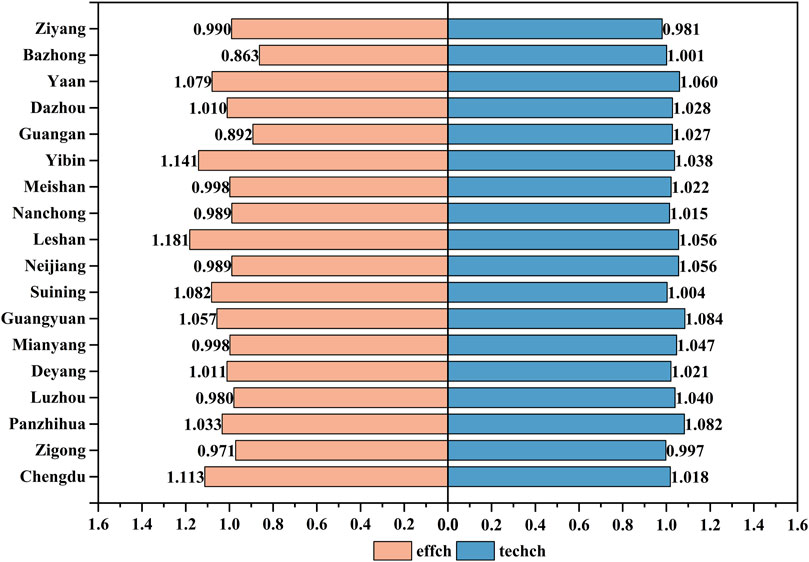
Figure 6. Decomposition of dynamic industrial carbon emission efficiency.
In an effort to facilitate the betterment of industrial carbon emission efficiency and investigate the path to elevate industrial carbon emission efficiency in Sichuan Province, this paper uses Tobit regression to investigate the influencing factors of industrial carbon emission efficiency in Sichuan Province. The findings are depicted in Table 4.
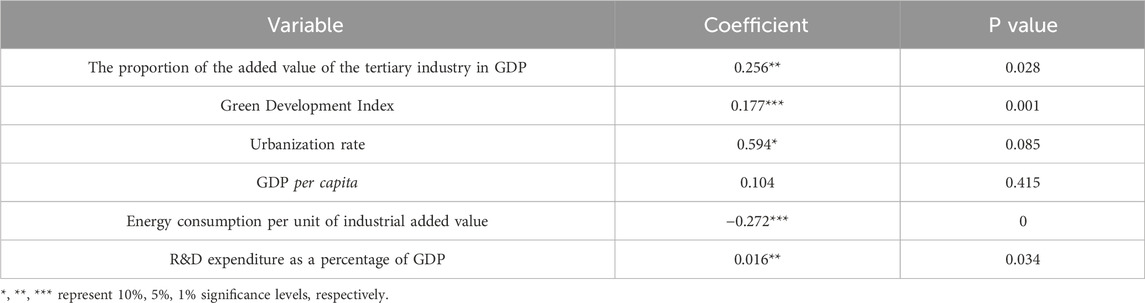
Table 4. Regression results of factors affecting industrial carbon emission efficiency.
It can be seen from Table 4 that:
(1) The impact of the proportion of added value of the tertiary industry in GDP on the efficiency of industrial carbon emissions is at the statistical level of 5%, and there is a positive correlation. This indicates that the efficiency of industrial carbon emissions will increase with the increase of the added value of the tertiary industry as a proportion of GDP. The increase in the proportion of the tertiary industry is accompanied by the contraction of industrial scale, which promotes the industrial sector to carry out intensive production and improve efficiency. The development of the tertiary industry can provide low-carbon technology support for industry, such as intelligent manufacturing, energy management systems, etc., and then improve the efficiency of industrial carbon emissions.
(2) Compared with the previous study (Liu, 2022), this study found that the level of green development was positively correlated with the efficiency of industrial carbon emissions, and the significance was high. The improvement of green development is usually accompanied by the combined effect of multiple factors such as the application of environmental protection technology, policy and regulatory constraints, changes in market demand, and corporate social responsibility. Together, these factors are driving the industrial sector towards a greener and more efficient sector, which in turn promotes the efficiency of industrial carbon emissions.
(3) The impact of urbanization level on industrial carbon emission efficiency is at the statistical level of 10%, and the significant coefficient of impact on industrial carbon emission efficiency is positive. With the improvement of urbanization, the improvement of urban infrastructure, industrial agglomeration and other factors, the allocation of resources in the industrial production process is more reasonable, technological innovation is more active, and energy utilization is more efficient, which will have a positive effect on the efficiency of industrial carbon emissions.
(4) The impact of per capita GDP on industrial carbon emission efficiency is positive, but not significant. The results show that the increase in per capita GDP may promote technological progress and the improvement of production efficiency, but the impact of this increase on carbon emissions is often constrained by a variety of factors. Therefore, relevant departments should strengthen the adjustment of industrial structure, promote the application of green technologies, strengthen environmental supervision, and promote regional coordinated development, rather than relying solely on economic growth to improve the efficiency of industrial carbon emissions.
(5) The energy consumption per unit of industrial added value has a significant inhibitory effect on the efficiency of industrial carbon emissions, and it has passed the significance test of the 1% level, which is consistent with expectations. Energy consumption per unit of industrial added value refers to the amount of energy consumed per unit of industrial added value, which reflects the energy efficiency. Higher energy consumption means more energy is required to produce industrial products of the same value, which leads to higher carbon emissions. Therefore, high energy consumption per unit of industrial added value will reduce the efficiency of carbon emissions.
(6) The proportion of R&D expenditure in GDP has a significant role in promoting the efficiency of industrial carbon emissions. R&D funds can be transformed into technological progress, thereby promoting the upgrading of industrial technology, reducing the input of high-carbon and high-polluting resource elements to a certain extent, improving their resource utilization, and reducing energy consumption and carbon emissions. Therefore, increasing the proportion of R&D spending is crucial for key energy consumption companies.
In the context of green development, this paper enriches the urban green development index system and evaluates the level of urban green development. The undesirable super-efficiency SBM model is adopted to dig into the industrial carbon emission efficiency of cities in Sichuan Province from 2015 to 2022 from both static and dynamic aspects. Afterwards, the urban green development index is incorporated into the Tobit model, and the impact of factors such as urban structure on industrial carbon emission efficiency is considered. The results show that: (1) The overall green development level of cities in Sichuan Province decreased from 2015 to 2022. The average green development index of Sichuan Province was 0.44 in 2015 and 0.40 in 2020, and the green development index decreased by 8.14% during the study period. There is great room for improvement in the level of green development. (2) The overall level of static industrial carbon emission efficiency in Sichuan Province is low, and the average industrial carbon emission efficiency is only 0.740. The difference in the efficiency of urban industrial carbon emissions is mainly due to the difference in the efficiency of pure technology. From 2015 to 2022, the dynamic industrial carbon emission efficiency of Sichuan Province showed a trend of first stable and then decreasing. (3) The level of green development is positively correlated with the efficiency of industrial carbon emissions, and the significance is high. The impact of the proportion of added value of the tertiary industry in GDP on the efficiency of industrial carbon emissions is at the statistical level of 5%, and there is a positive correlation.
This study explores the spatiotemporal differentiation and influencing factors of regional industrial carbon emission efficiency in the context of green development, and provides a theoretical basis for sustainable urban development. First of all, in the carbon emission calculation, because it is impossible to obtain the key data of carbon emissions in the production process of the cement and steel industries, such as cement production and steel production, at the city level, this study limits the accounting boundary to the carbon emission range of energy terminal consumption, and does not cover the carbon emissions generated by the cement and steel industries. In future studies, we will try to obtain detailed production data for the cement and steel industries to further improve the carbon emission accounting boundary. Second, due to the unavailability of industrial solid waste data in the study area, we are temporarily unable to include it in the index system. We will continue to pay attention to this data in future studies in order to further improve the indicator system in subsequent studies.
In consideration of the above findings, this paper comes up with the following suggestions for the low-carbon development of Sichuan industry:
(1) Promote cleaner production technologies. Since the average industrial carbon emission efficiency of Sichuan Province is 0.740, and the main difference is the difference in pure technical efficiency, the promotion of technological innovation is crucial to the low-carbon development of Sichuan industry. Relevant government departments should vigorously encourage and support industrial enterprises to adopt cleaner production technology and equipment, reduce energy consumption and waste emissions, and promote the application of cleaner production technology through policy measures such as capital subsidies and tax incentives.
(2) Strengthen policy support and incentives. From 2021 to 2022, the dynamic industrial carbon emission efficiency has decreased, and the industrial carbon emission efficiency has great potential to be improved. Therefore, it is necessary to adopt a variety of policy measures to establish a sound reward and punishment mechanism to further encourage enterprises and citizens to participate in low-carbon development.
(3) Promote regional coordinated development. The level of green development has a significant impact on the efficiency of industrial carbon emissions, while the per capita GDP has no significant impact on the efficiency of industrial carbon emissions. Therefore, it is necessary to adjust and optimize the industrial structure according to the characteristics and resource advantages of each city, promote the application of green technology, strengthen environmental supervision, and promote regional coordinated development. Rather than relying solely on economic growth to improve the efficiency of industrial carbon emissions.
The data analyzed in this study is subject to the following licenses/restrictions: Data will be made available on request. Requests to access these datasets should be directed to Tingting Feng, ZnR0MTEyNjZAMTYzLmNvbQ==.
RY: Conceptualization, Methodology, Writing–original draft. TF: Methodology, Writing–original draft, Writing–review and editing. SZ: Software, Writing–review and editing.
The author(s) declare that financial support was received for the research and/or publication of this article. This work was supported by Sichuan Natural Science Foundation Program (2024NSFSC0078).
The authors declare that the research was conducted in the absence of any commercial or financial relationships that could be construed as a potential conflict of interest.
The author(s) declare that no Generative AI was used in the creation of this manuscript.
All claims expressed in this article are solely those of the authors and do not necessarily represent those of their affiliated organizations, or those of the publisher, the editors and the reviewers. Any product that may be evaluated in this article, or claim that may be made by its manufacturer, is not guaranteed or endorsed by the publisher.
Azam, A., Rafiq, M., Shafique, M., and Yuan, J. H. (2023). Interpreting the dynamic nexus between green energy, employment, fossil fuel energy, and human development index: a panel data investigation. Energies 16 (7), 3132. doi:10.3390/en16073132
Chen, S. S., Zhang, H. Y., and Wang, S. H. (2022). Trade openness, economic growth, and energy intensity in China. Technol. Forecast. Soc. Change. 179, 121608. doi:10.1016/j.techfore.2022.121608
Cheng, M., Lu, Y. J., Zhu, H., and Xiao, J. Z. (2022). Measuring CO2 emissions performance of China's construction industry: a global Malmquist index analysis. Environ. Impact. Assess. Rev. 92, 106673. doi:10.1016/j.eiar.2021.106673
Cheng, Z. H., and Li, X. (2022). Do raising environmental costs promote industrial green growth? A Quasi-natural experiment based on the policy of raising standard sewage charges. J. Clean. Prod. 343, 131004. doi:10.1016/j.jclepro.2022.131004
Ding, L. L., Yang, Y., Wang, W., and Calin, A. C. (2019). Regional carbon emission efficiency and its dynamic evolution in China: a novel cross efficiency-Malmquist productivity index. J. Clean. Prod. 241, 118260. doi:10.1016/j.jclepro.2019.118260
Fetene, Y., Addis, T., Beyene, A., and Kloos, H. (2018). Valorisation of solid waste as key opportunity for green city development in the growing urban areas of the developing world. J. Environ. Chem. Eng. 6 (6), 7144–7151. doi:10.1016/j.jece.2018.11.023
Gong, G. F., Guo, Q. H., Qiu, B. T., Tang, L. N., Mao, Q. Z., and He, Z. C. (2024). The meliorization process of urban green spaces: integrating landsense creation for sustainable development. J. Geogr. Sci. 34 (9), 1822–1840. doi:10.1007/s11442-024-2272-5
Guo, B. N., Feng, W. Z., and Lin, J. (2024). The impact of green finance on labor income share: evidence from green finance reform and innovation pilot zone. Econ. Anal. Policy 84, 1347–1358. doi:10.1016/j.eap.2024.10.014
Guo, X. Q., and Li, B. J. (2023). Efficiency evaluation of regional logistics industry and its influencing factors under low-carbon constraints. Environ. Dev. Sustain. 26 (6), 15667–15679. doi:10.1007/s10668-023-03268-z
Han, Y. M., Long, C., Geng, Z. Q., and Zhang, K. Y. (2018). Carbon emission analysis and evaluation of industrial departments in China: an improved environmental DEA cross model based on information entropy. J. Environ. Manage. 205, 298–307. doi:10.1016/j.jenvman.2017.09.062
He, H. F., Wang, H. R., Lin, H., Zheng, K., and Zhang, P. W. (2024a). Analysis of the spatio-temporal variability and convergence of green development efficiency of city clusters in the middle reaches of the Yangtze River in China. Heliyon 10 (18), 38060. doi:10.1016/j.heliyon.2024.e38060
He, L., Li, X. F., Cui, Q., Guan, B., Li, M., and Chen, H. (2024b). Decarbonization pathways to subregional carbon neutrality in China based on the top-down multi-regional CGE model: a study of Guangxi. Energy 294, 130846. doi:10.1016/j.energy.2024.130846
He, M. W., Ge, D. Y., Jiang, J. Y., Wang, P. C., and Yao, C. H. (2023). How do urban function and development level effect construction level of green infrastructure? A case study of 110 built-up areas of cities in the Yangtze River Economic Zone. Cities 143, 104620. doi:10.1016/j.cities.2023.104620
Hu, H., Lv, T. G., Zhang, X. M., Xie, H. L., Fu, S. F., Geng, C., et al. (2023). Spatiotemporal heterogeneity and decoupling decomposition of industrial carbon emissions in the Yangtze River Delta urban agglomeration of China. Environ. Sci. Pollut. Res. 30 (17), 50412–50430. doi:10.1007/s11356-023-25794-z
Hu, R., and Han, X. L. (2023). Toward a “smart-green” future in cities: system dynamics study of megacities in China. Energies 16 (17), 6395. doi:10.3390/en16176395
Huang, Y., Yang, L., Wang, X. X., et al. (2012). Research on the evaluation index system of urban green development: a case study of Guangzhou. Sci. Technol. Manag. Res. 17, 55–59. (Chinese).
Keskin, B. (2021). An efficiency analysis on social prosperity: OPEC case under network DEA slack-based measure approach. Energy 231, 120832. doi:10.1016/j.energy.2021.120832
Lan, G., Xiao, Y., Ci, X. H., Zhang, Y. J., and Xia, J. (2024). Spatial and temporal differentiation characteristics of green development levels in urban agglomerations within the Yangtze River Economic Belt and analysis of influencing factors. Ecol. Indic. 166, 112552. doi:10.1016/j.ecolind.2024.112552
Lee, C. C., Wang, C. W., and Liu, F. Y. (2024). Does green credit promote the performance of new energy companies and how? The role of R&D investment and financial development. Renew. Energy 235, 121301. doi:10.1016/j.renene.2024.121301
Li, Q. C., Chen, J. H., and Tang, L. (2022). Carbon emission characteristics of regional energy systems based on inventory algorithm: a case study of Sichuan Province. Nat. Gas. Technol. Econ. 5, 50–56. (Chinese).
Lin, B. Q., and Tan, R. P. (2019). Economic agglomeration and green economic efficiency in China. Econ. Res. 2, 119–132. (Chinese).
Lin, X. Q., Bian, Y., and Wang, D. (2021). Spatiotemporal evolution characteristics and influencing factors of industrial carbon emission efficiency in the Beijing-Tianjin-Hebei region. Econ. Geogr. 41 (6), 1–12. (Chinese).
Lin, Z., and Liu, S. (2022). Research on the coordinated development of green development and ecological innovation in the yellow River Basin. Greenh. Gases. 13, 201–204. (Chinese).
Liu, D. (2022). Convergence of energy carbon emission efficiency: evidence from manufacturing sub-sectors in China. Environ. Sci. Pollut. Res. 29 (21), 31133–31147. doi:10.1007/s11356-022-18503-9
Liu, J. F., and Zheng, L. (2023). Structure characteristics and development sustainability of municipal solid waste treatment in China. Ecol. Indic. 152, 110391. doi:10.1016/j.ecolind.2023.110391
Lou, S. (2022). The analysis of the spatio-temporal differentiation characteristics of total factor productivity of maize: introducing the perspective of financial support. Front. Environ. Sci. 10, 995576. doi:10.3389/fenvs.2022.995576
Lu, Q., Fang, H. X., and Hou, J. C. (2024). Renewable portfolio development in parallel with green industrial development policies towards the decarbonization targets of industrial gas producers in China. J. Clean. Prod. 460, 142501. doi:10.1016/j.jclepro.2024.142501
Mielnik, O., and Goldemberg, J. (1999). Communication the evolution of the “carbonization index” in developing countries. Energy Policy 27 (5), 307–308. doi:10.1016/s0301-4215(99)00018-x
Muhammad, J. S., Qiao, W. G., Cao, Q. R., and Kang, W. (2020). Prospects of industrial consumption embedded final emissions: a revision on Chinese household embodied industrial emissions. Sci. Rep. 10 (1), 1826. doi:10.1038/s41598-020-58814-w
Nayyar, D. (2023). Economic policies for human development: a neglected domain. J. Hum. Dev. Capab. 24 (4), 430–438. doi:10.1080/19452829.2023.2252646
OECD (2011). Towards green growth: monitoring progress OECD indicator. Paris, France: Organization for Economic Cooperation and Development.
Ouyang, Z. Y., Zhao, J. J., Gui, Z. H., et al. (2009). Evaluation of green development in Chinese cities. China Popul. Resour. Environ. 5, 11–15. (Chinese).
Pan, Y. J., Teng, T. W., Wang, S. P., and Wang, T. T. (2024). Impact and mechanism of urbanization on urban green development in the Yangtze River Economic Belt. Ecol. Indic. 158, 111612. doi:10.1016/j.ecolind.2024.111612
Shu, T. H., Liao, X., Yang, S., and Yu, T. F. (2024). Towards sustainability: evaluating energy efficiency with a super-efficiency SBM-DEA model across 168 economies. Appl. Energy 376, 124254. doi:10.1016/j.apenergy.2024.124254
Si, X. P., Tang, Z., Wang, W. L., and Liang, Y. (2023). Evaluation and influencing factors of the tourism industry efficiency under carbon emission constraints in China. Environ. Monit. Assess. 195 (9), 1093. doi:10.1007/s10661-023-11719-3
Sun, F. H., Jia, Z. M., Shen, J. Q., Xu, C. C., Huang, X., Shang, Z. L., et al. (2024). Research on the accounting and spatial effects of emergy ecological footprint and industrial green GDP—the case of Yangtze River Economic Belt. Ecol. Indic. 163, 112055. doi:10.1016/j.ecolind.2024.112055
Sun, J. W. (2005). The decrease of CO2 emission intensity is decarbonization at national and global levels. Energy Policy 33 (8), 975–978. doi:10.1016/j.enpol.2003.10.023
Taylan, G., and Konstantinos, T. (2022). An ex-ante DEA method for representing contextual uncertainties and stakeholder risk preferences. Ann. Oper. Res. 309 (1), 395–423. doi:10.1007/s10479-021-04271-1
UNEP (2012). Green economy indicator: briefing paper. Nairobi, Kenya: United Nations Environment Program.
Wang, Q., and Zhu, H. T. (2024). Combined top-down and bottom-up approach for CO2 emissions estimation in building sector of Beijing: Taking new energy vehicles into consideration. Energy 290, 130302. doi:10.1016/j.energy.2024.130302
Wang, Y. J., Chen, F. Y., Wei, F., Yang, M. H., Gu, X., Sun, Q. Q., et al. (2023). Spatial and temporal characteristics and evolutionary prediction of urban health development efficiency in China: based on super-efficiency SBM model and spatial Markov chain model. Ecol. Indic. 147, 109985. doi:10.1016/j.ecolind.2023.109985
Wang, Y. Y., Ji, H. Y., Wang, S. Q., Wang, H., and Shi, J. Y. (2024). Research on carbon emissions estimation in key industries based on the electricity-energy-carbon model: a case study of henan province. Energies 17 (12), 2933. doi:10.3390/en17122933
Wei, F. Q., Fan, Y. Y., Song, J. Y., Chu, J. F., and Sun, N. (2024). Carbon productivity growth in China’s transportation industry: empirical analysis using a global Malmquist-Luenberger productivity index based on an endogenous directional distance function. J. Environ. Plan. Manag., 1–25. doi:10.1080/09640568.2024.2351426
Wen, L., and Zhang, Z. Q. (2019). Probing the affecting factors and decoupling analysis of energy industrial carbon emissions in Liaoning, China. Environ. Sci. Pollut. Res. 26 (14), 14616–14626. doi:10.1007/s11356-019-04693-2
Xie, Z. H., Wu, D. R., and Wang, S. J. (2021). How technological progress affects the carbon emission efficiency? Evidence from national panel quantile regression. J. Clean. Prod. 307, 127133. doi:10.1016/j.jclepro.2021.127133
Yang, Y. F., Wang, H. R., Li, Y. Y., Zhang, L., and Zhao, Y. (2023). New green development indicator of water resources system based on an improved water resources ecological footprint and its application. Ecol. Indic. 148, 110115. doi:10.1016/j.ecolind.2023.110115
Ye, J., Dang, Y. G., Song, D., and Yang, Y. J. (2019). A novel energy consumption forecasting model combining an optimized DGM (1, 1) model with interval grey numbers. J. Clean. Prod. 229, 256–267. doi:10.1016/j.jclepro.2019.04.336
Yu, R. Q., and Luo, Z. Y. (2024). Evaluation of regional comprehensive development efficiency under low-carbon policy: based on optimized DDF-GML combined with unsupervised clustering method. Sci. Rep. 14 (1), 16217. doi:10.1038/s41598-024-67236-x
Zhang, H., Qiao, Z. K., Xu, K., et al. (2018). Dynamic spatiotemporal differences and influencing mechanisms of carbon emission efficiency in resource-based cities: a case study of prefecture-level resource-based cities in six central provinces. Ind. Technol. Econ. 37 (12), 1–10. (Chinese).
Zhang, N., and Gong, M. Y. (2022). Economic and environmental outcomes of economic transition: evidence from a quasi-experiment in China. J. Asian. Econ. 80, 101483. doi:10.1016/j.asieco.2022.101483
Zhang, N., Huang, X. H., and Liu, Y. X. (2021). The cost of low-carbon transition for China’s coal-fired power plants: a quantile frontier approach. Technol. Forecast. Soc. 169, 120809. doi:10.1016/j.techfore.2021.120809
Zhang, S., Yu, R., Wen, Z. H., Xu, J. Y., Liu, P. H., Zhou, Y. Q., et al. (2023). Impact of labor and energy allocation imbalance on carbon emission efficiency in China's industrial sectors. Renew. Sustain. Energy. Rev. 184, 113586. doi:10.1016/j.rser.2023.113586
Zheng, Z. (2021). Energy efficiency evaluation model based on DEA-SBM-Malmquist index. Energy. Rep. 7, 397–409. doi:10.1016/j.egyr.2021.10.020
Zhou, A. H., Xin, L., and Li, J. (2022). Assessing the impact of the carbon market on the improvement of China’s energy and carbon emission performance. Energy 258, 124789. doi:10.1016/j.energy.2022.124789
Zhou, Z. X., Wu, H. Q., and Song, P. F. (2019). Measuring the resource and environmental efficiency of industrial water consumption in China: a non-radial directional distance function. J. Clean. Prod. 240, 118169. doi:10.1016/j.jclepro.2019.118169
Zhu, Q. Y., Liu, C., Li, X. C., and Zhou, D. Q. (2023). The total factor carbon emission productivity in China’s industrial sectors: an analysis based on the global Malmquist-Luenberger index. Sustain. Energy. Technol. Assess. 56, 103094. doi:10.1016/j.seta.2023.103094
Keywords: industrial carbon emission efficiency, undesirable super-efficiency SBM model, urban green development, tobit model, influencing factors
Citation: Yang R, Feng T and Zhao S (2025) Study on the spatiotemporal differentiation and influencing factors of regional industrial carbon emission efficiency under the background of green development—a case study of Sichuan Province. Front. Environ. Sci. 13:1511025. doi: 10.3389/fenvs.2025.1511025
Received: 14 October 2024; Accepted: 10 March 2025;
Published: 25 March 2025.
Edited by:
Delu Wang, China University of Mining and Technology, ChinaReviewed by:
Bingnan Guo, Jiangsu University of Science and Technology, ChinaCopyright © 2025 Yang, Feng and Zhao. This is an open-access article distributed under the terms of the Creative Commons Attribution License (CC BY). The use, distribution or reproduction in other forums is permitted, provided the original author(s) and the copyright owner(s) are credited and that the original publication in this journal is cited, in accordance with accepted academic practice. No use, distribution or reproduction is permitted which does not comply with these terms.
*Correspondence: Tingting Feng, ZnR0MTEyNjZAMTYzLmNvbQ==
Disclaimer: All claims expressed in this article are solely those of the authors and do not necessarily represent those of their affiliated organizations, or those of the publisher, the editors and the reviewers. Any product that may be evaluated in this article or claim that may be made by its manufacturer is not guaranteed or endorsed by the publisher.
Research integrity at Frontiers
Learn more about the work of our research integrity team to safeguard the quality of each article we publish.