 Qiuhao Yun
 Qiang Zhang
95% of researchers rate our articles as excellent or good
Learn more about the work of our research integrity team to safeguard the quality of each article we publish.
Find out more
ORIGINAL RESEARCH article
Front. Environ. Sci. , 25 February 2025
Sec. Atmosphere and Climate
Volume 13 - 2025 | https://doi.org/10.3389/fenvs.2025.1510445
This article is part of the Research Topic Temperature and Hydrometeorological Extremes View all 5 articles
Introduction: Global warming has led to an increase in the frequency and intensity of extreme weather events. In Hainan Province, a key tropical agricultural region in China, extreme temperatures significantly affect crop yields, quality, and the sustainability of the agricultural economy. Understanding the temporal and spatial patterns of extreme temperature events in Hainan Province is crucial for formulating effective strategies for mitigating meteorological disasters and safeguarding agricultural productivity.
Methods: This study uses observational data from 21 meteorological stations in Hainan Province from 1980 to 2022. Eight extreme temperature indices were calculated using the RClimDex model. Temporal and spatial characteristics of extreme temperature events were analyzed through linear fitting, Mann-Kendall mutation tests, Morlet wavelet analysis, and principal component analysis.
Results: The results reveal that extreme temperature events in Hainan Province show an overall increasing trend over time. Spatially, most stations exhibit a similar increasing trend in extreme temperature events. Two indices, Maximum Daily Temperature of the Year (TXx) and Number of Days with Lowest Temperature >20°C (TR20), display upward mutations, particularly between 2000 and 2011. Additionally, cyclical patterns in extreme temperature indices include short (4 years), medium (8–14 years), and long (16–20 years) oscillatory cycles.
Discussion: The study highlights that the primary drivers of temperature variations in Hainan Province are warm temperature indicators, with significant changes in daily maximum temperatures playing a key role. These findings emphasize the need for further investigation into the long-term effects of temperature variations on agricultural production and suggest potential pathways for disaster mitigation and adaptation strategies in the region.
In the latest Sixth Assessment Report released by IPCC in 2023, it is clearly stated that the global temperature has already risen by 1.1°C compared with the pre-industrial level (Wang et al., 2023), and the global temperature increase is expected to reach or exceed 1.5°C in the future (Ren et al., 2012). In the context of global warming, meteorological disasters occur frequently, profoundly altering the Earth’s environment and seriously interfering with normal human production and life (Yang et al., 2010). Hainan Island, located at the southernmost point of China and surrounded by the South China Sea, boasts a unique geographical position that endows it with a distinct maritime climate. This maritime climate, characterized by its proximity to the ocean, typically moderates temperature fluctuations and brings abundant rainfall. However, it also makes the island particularly vulnerable to the impacts of climate change, including more frequent and intense extreme temperature events. Extreme temperatures pose a significant threat to tropical agriculture in Hainan Province, where high temperatures may lead to crop yield reduction and quality degradation, threatening food security and the sustainable development of the agricultural economy. The unique geographical setting of Hainan Island amplifies the need to study the spatial and temporal variation rules of extreme temperature events, as understanding these patterns is crucial for taking timely and responsive measures to mitigate the damage to the agricultural economy and safeguard the region’s overall well-being.
The Extreme Temperature Index (ETI), recommended by the Expert Team on Climate Change Detection and Indices (ETCCDI), is currently a very important method for characterizing extreme temperature events and is widely used. Alexander et al. (2006) summarized the global extreme temperature changes from 1951 to 2003 and found that 70% of the global regions show a decreasing trend of cold night days and an increasing trend of warm night days. This finding was confirmed by Rusticucci (Rusticucci, 2012) for South America and Ren et al. (2009) for Asia-Pacific Griffiths (Griffiths et al., 2005) for South Pacific and Southeast Asia, respectively. It was also found that the United States (Karl et al., 1995), Russia (Gruza et al., 1999), Australia (Plummer et al., 1999), Italy (Brunetti et al., 2004) and Antarctica (Meredith and King, 2005) have shown an increase in temperature. These studies strongly prove that the global climate is gradually warming. Most of China is located in the mid-latitude region of the Northern Hemisphere, so the trend of temperature change is the same as that of the Northern Hemisphere. Climate cold indicators such as cold night and cold day are gradually decreasing, while hot indicators such as hot night and hot day are increasing (Ren et al., 2010). It is noteworthy that although the overall temperature in China shows an increasing trend from the results of various studies, there are obvious geographical differences in the rate of increase. Taking the Yangtze River as the boundary, the temperature increase in the region south of the Yangtze River does not show a significant upward trend (Shackley and Wynne, 1996). In 2004, the Canadian Center for Meteorological Research (CCMR) developed the RClimDex software (Trenberth et al., 2007)- (Zhang et al., 2004). This software can calculate a variety of indices with the advantages of low noise and high significance (He et al., 2022). This software has been promoted by the World Meteorological Organization and has been widely used around the world to analyze extreme climate indices and detect climate change. Wu Xin (Du et al., 2022) and Sun Jiaxin (Zhu et al., 2024) used the RClimDex model to reveal the spatial and temporal change patterns of the Hongdu River and Hunchun River, respectively.
Hainan Province is a key tropical agricultural production area in China. In 2023, the total output value of agriculture, forestry, animal husbandry, and fishery in Hainan Province reached 241.033 billion yuan, reflecting a 4.9% increase compared to the previous year. The rice plantation area in 2023 covered 4.1 million mu, producing 1.47 million tons. The area of orchards and fruit production has increased for six consecutive years, with 3.426 million mu of orchards and 5.9164 million tons of fruit produced in 2022. Major fruits include bananas, mangoes, pineapples, lychees, oranges, lengmu, longans, cantaloupes, and melons. The annual rubber output remains stable at 347,900 tons, accounting for over one-third of the country’s total production. The area and production of coconuts are stabilizing, with an estimated output of approximately 230 million units in 2023. Betel nut production demonstrated continuous growth, reaching 301,000 tons in 2023. Pepper production reached 41,300 tons in 2022, accounting for over 97% of the total national production. The study of the temporal and spatial variation patterns of extreme temperature events in Hainan Province provides a scientific basis for future prevention and control of meteorological disasters in the region, thereby safeguarding the agricultural output value of Hainan Province.
This study quantitatively reveals the spatial and temporal evolution of extreme temperature events in Hainan Province, based on temperature observations from 21 meteorological stations in the region from 1980 to 2022, using methods such as the RClimDex model. The objectives of this study are: 1) to characterize the temporal evolution of extreme temperature events in Hainan Province over the past 40 years; 2) to elucidate the spatial variation pattern of extreme temperature events; 3) to determine whether extreme temperature events in Hainan Province are mainly driven by low or high temperatures, with the aim of improving the understanding of the temporal and spatial evolution of extreme high temperature events over the past 40 years, providing a scientific basis for the formulation of policies on extreme temperature events in Hainan Province, and offering a foundation for the development of similar policies in other regions. This study will provide a scientific basis for the formulation of policies related to extreme temperature events in Hainan Province and serve as a valuable reference for similar regions.
Hainan Province is situated at the southernmost point of China, with coordinates ranging from 108°37′ to 118°45′ east longitude and from 3°55′ to 20°10′ north latitude, as shown in Figure 1. It spans a total area of 33,900 square kilometers. Hainan Province’s primary land area is Hainan Island, which features terrain characterized by higher elevations in the central region and lower elevations along the coasts. The island’s elevations range from 500 m to 1,811 m, with most of the landmass consisting of hilly and low mountain terrain. The highest peak in Hainan is Wuzhi Mountain, with an elevation of 1,811.6 m. Hainan Province, located in the northern part of the tropics, experiences a tropical monsoon climate with mild seasonal variations. The annual temperature variation is relatively small, with average temperatures ranging from 22°C to 27°C. Even during the coldest month, temperatures remain between 17°C and 24°C. Hainan Province receives annual rainfall ranging from 1,000 mm to 2,600 mm, with an average annual rainfall of 1,639 mm. The province experiences distinct wet and dry seasons. Major rivers in the region include the Nandu, Changhua, and Wanquan rivers. The dominant soil types in the study area include red soil, lateritic red soil, dry red soil, marsh soil, and paddy soil. The forest cover in the province is as high as 62.1%.
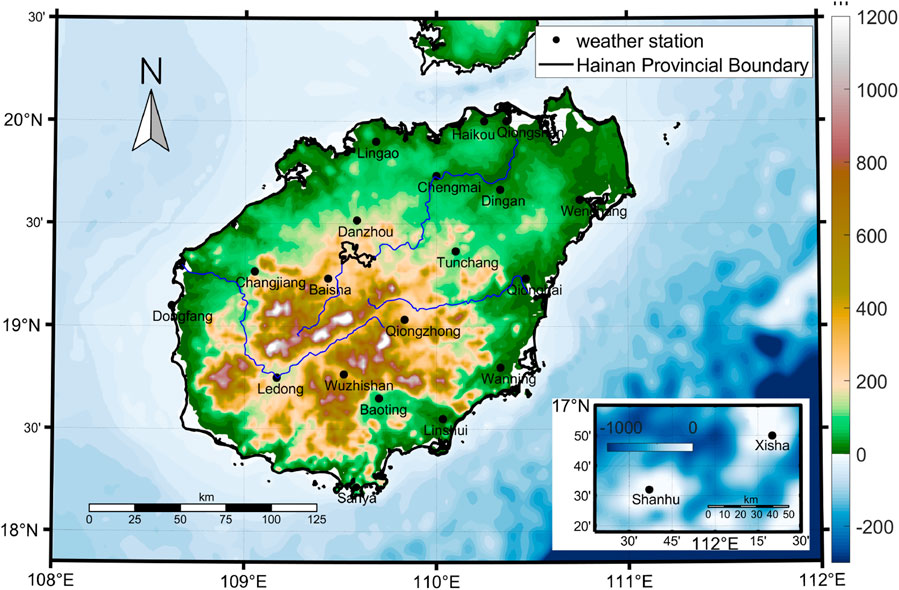
Figure 1. Overview of Hainan province data and method.
This study utilized daily temperature observation data from 21 meteorological observation stations in Hainan Province, China, spanning from 1980 to 2022. The data were obtained from the China Meteorological Administration (http://data.cma.cn/). The raw daily temperature data, which include both maximum and minimum temperatures, were processed to create monthly and yearly datasets as needed. To address occasional missing data from a small number of stations during certain periods, we used the average value of the 7 days before and after to complete the interpolation.
In this study, potential sources of error in the dataset were carefully considered. Sparse meteorological station distribution in certain regions of Hainan Province may limit the spatial representativeness of the data, potentially influencing the interpretation of spatial variability. Additionally, station relocation and instrument changes during the study period (1980–2022) might introduce data inconsistencies. The dataset used in this study has undergone quality control processes by the China Meteorological Administration, but some residual errors may still exist, and their impacts on the analysis are acknowledged as a limitation.
This study selected eight representative temperature indices from the extreme climate indices recommended jointly by the World Meteorological Organization (WMO) and the Climate Variability and Predictability (CLIVAR) research program. These indices were chosen to assess extreme temperature events (see Table 1). The RClimDex model is a user-friendly software package used to compute climate extreme indices for monitoring and detecting climate change. It was developed by Byron Gleason at the National Oceanic and Atmospheric Administration (NOAA) National Climatic Data Center (NCDC) and has been in use since 2001 at the Climate Variability and Predictability (CLIVAR) Climate Index Workshop.
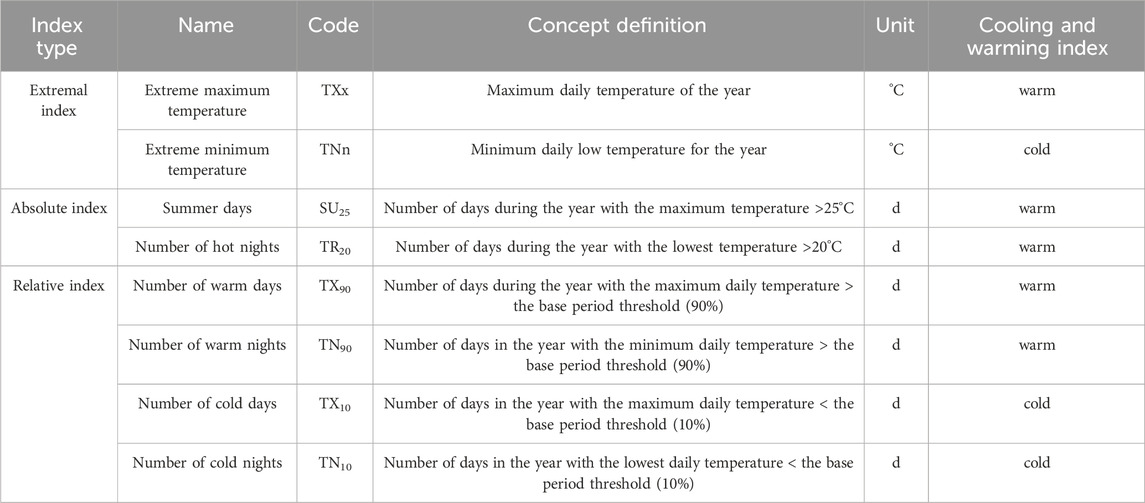
Table 1. Types and concepts of extreme temperature indexes.
RClimDex facilitates the computation of extreme climate indices, providing calculations for all 27 core indices recommended by the Expert Team on Climate Change Detection and Indices (ETCCDI) under the CCl/CLIVAR Climate Variability Detection Monitoring and Indices program. Furthermore, it can compute other temperature and precipitation indices using user-defined thresholds. Among these 27 core indices, this study selected eight temperature indices, which are part of those recommended by the ETCCDI.
Time series analysis is employed to examine the characteristics of a variable over time. Common methods for time series analysis include the trend method, smoothing method, Box-Jenkins method, ARMA model, ARIMA model, ARCH model, and the Mann-Kendall method. The first five methods require the data series to conform to a specific distribution pattern and involve assumptions during the analysis. The Mann-Kendall (MK) test is a widely used nonparametric statistical test in meteorological analysis. It is particularly suitable for analyzing the time series characteristics of natural factors such as climate. The advantages of the Mann-Kendall test include its ability to mitigate the influence of outliers on experimental results, its broad detection range, high quantifiability, applicability to data without a specific distribution pattern, suitability for both categorical and ordinal variables, and ease of computation. Therefore, this study employs the Mann-Kendall method to analyze the time series characteristics of extreme temperature events. MK consists of trend tests and change-point tests. The MK change-point test can be applied in climate analysis to determine whether a change point has occurred and identify the timing of such changes. In this study, the MK change-point test will be applied to identify the years in which extreme climate events in Hainan Province underwent significant changes. The calculation steps for the MK test are outlined as follows:
For a time series with n data points, x1, x2…, xn, create a rank series:
In Formula 1, when xi is greater than xj, ri = +1; when xi is less than xj, ri = 0 (for i = 1, 2, … , j); k is the length of the time series.
Assuming the time series is randomly independent, the statistic is defined as follows:
Where
In Formulas 2–4 UFk is a standard normal distribution, which is a series of statistical variables calculated in time series order. Given the significance level α, when UFi > Uα, indicates that there is a significant trend change in the series. The process is repeated in reverse order of the time series, and UBk = UFk. The significance level α = 0.05, then the critical value U0.05 = ±1.96. The two statistical series curves of UBk and UFk are compared with the ±1.96 curve. If the values of UBk and UFk are greater than 0, the sequence shows an upward trend, and if they are less than 0, the sequence shows a downward trend; When they exceed the critical line (±1.96), it indicates a clear upward or downward trend. If the UBk and UFk lines intersect, and the intersection is between the critical boundary (±1.96), then the moment corresponding to the intersection is the moment when the mutation begins (Qian and Qin, 2006).
Principal component analysis (PCA) does not require data to follow a normal distribution. It is a method of “dimensionality reduction” that combines multiple variables into a smaller set of variables that are uncorrelated. Due to its advantages of dimension reduction and elimination of collinearity between variables, PCA is widely used in research in both the social and natural sciences. In this study, PCA is used to explore whether extreme temperature events in Hainan Province are determined by low temperatures or high temperatures. The specific steps of PCA are shown as follows:
(1) Compute the correlation matrix:
In Formulas 5, 6, where p represents the number of variables and Xi represents the ith variable.
(2) Calculate the eigenvalues (λi) and corresponding eigenvectors (Ti) of R.
(3) Next, calculate the cumulative variance contribution rate to determine the number of principal components. The formula is given as follows:
Cumulative Variance Contribution Rate:
In Formulas 7, 8, when the percentage of cumulative variance contribution rate is high, it confirms that there are k principal components in the analysis, which are used to select essential influencing factors.
(4) The principal component expression defines the meaning of the principal components. The weighted composite principal component expression ranks and evaluates various samples based on the impact of each principal component on the actual problem.
Principal Component Expression:
Weighted Composite Principal Component Expression:
To standardize the original data, Formula 9 is generally used to unify the dimensions of the data. To eliminate redundant information, Formula 10 is used. PCA helps standardize data with different dimensions and replace the original indices with composite variables (Gao et al., 2022).
The Morlet wavelet is one of the commonly used wavelet functions, and it can discern the size and temporal distribution of multitime scale periodicities in a time series. In this study, Morlet wavelet analysis will be employed to investigate the periodic variation patterns in Hainan Province’s temperature. Through wavelet analysis, the periodic characteristics of the time series can be clearly displayed, providing insights into how the system changes at different time scales. It also allows for qualitative estimation of the variations in various climatic variables (Zhao et al., 2022). To analyze the periodic variations in Hainan Province’s temperature from 1980 to 2022, this study will use Morlet wavelet analysis to conduct time-frequency structural analysis on the temperature data. After reducing or eliminating boundary effects, the real part of the wavelet coefficients will be obtained, and contour plots will be generated. The basic expression is given as follows:
In Formula 11, transform the wavelet generating function
In Formula 12, when
In Formulas 13, 14,
Based on the information presented in Figure 2, from 1980 to 2022, both extreme maximum temperature (TXx) and extreme minimum temperature (TNn) in Hainan Province showed a fluctuating upward trend. The climatic tendencies for extreme maximum temperature and extreme minimum temperature were 0.023°C/10a and 0.029°C/10a, respectively (Figures 2A, B). The changing trends of extreme maximum temperature and extreme minimum temperature were both significant (p < 0.05). The maximum values for extreme maximum temperature and extreme minimum temperature were 37.88°C and 12.36°C, occurring in 2020 and 1998, respectively. The minimum values were 35.54°C and 6.08°C, occurring in 1997 and 1999, respectively. When examining the decadal changes, both TXx and TNn exhibited an upward trend. These results indicate that from 1980 to 2022, temperatures in Hainan Province showed an increasing trend, consistent with the findings of Yang Fuzhen et al. (Yao et al., 2021).
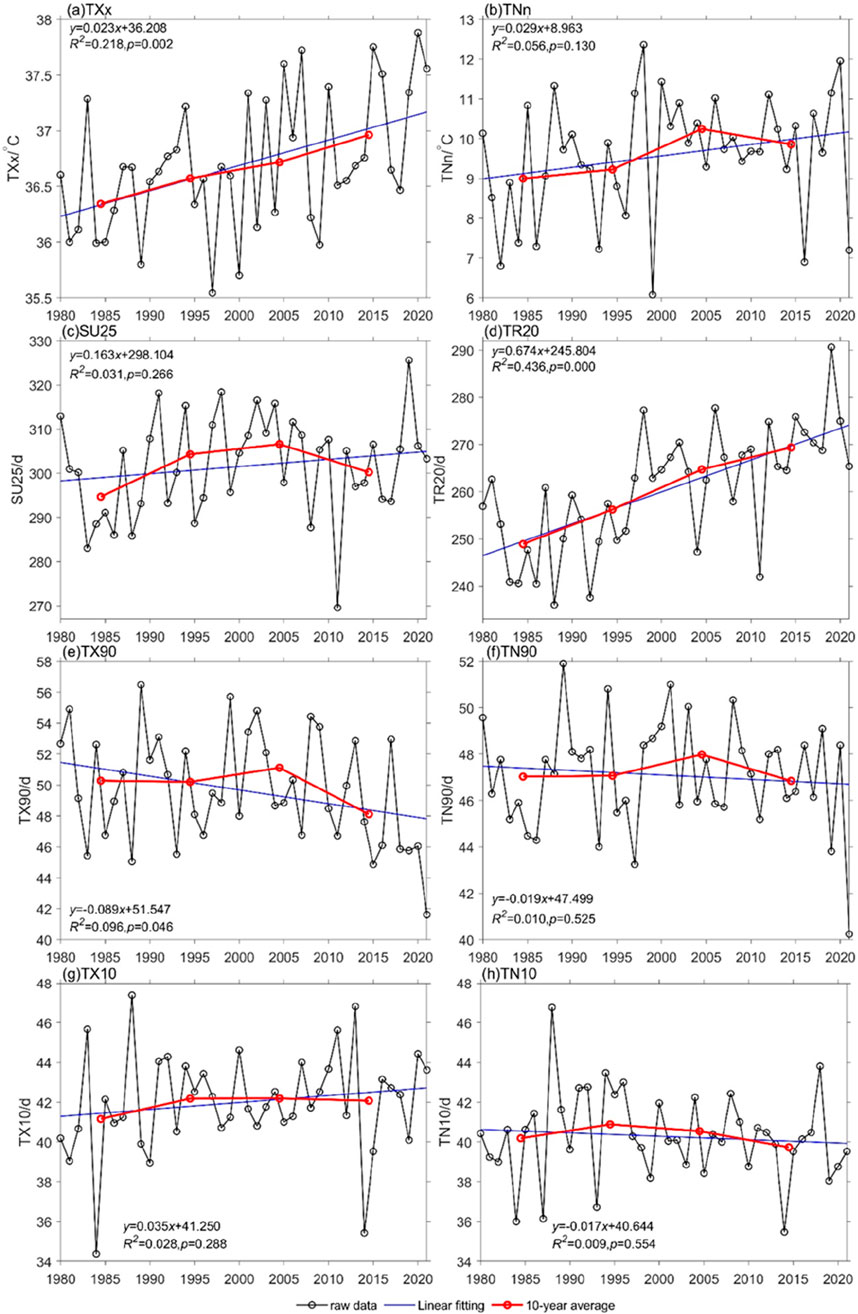
Figure 2. Temporal variation of extreme temperature indices in Hainan Province from 1980 to 2020: (A) TXx: Extreme maximum temperature (°C), (B) TNn: Extreme minimum temperature (°C), (C) SU25: Number of summer days (days), (D) TR20: Number of hot nights (days), (E) TX90: Number of warm days (days), (F) TN90: Number of warm nights (days), (G) TX10: Number of cold days (days), and (H) TN10: Number of cold nights (days).
This phenomenon is the result of the combined influence of natural and anthropogenic factors. From a natural perspective, the variation in extreme temperature events in Hainan Province is primarily influenced by factors, such as increased solar radiation, anomalous ENSO changes in the late 1990s, gradual strengthening of the subtropical high-pressure system in summer, strengthening of the southwest monsoon in winter, and changes in atmospheric composition due to greenhouse gas increases. Specifically, changes in solar radiation can affect extreme temperature events through four main pathways. The most significant pathway is direct solar radiation heating, a well-known and confirmed influencing pathway. The second is the impact of ultraviolet radiation on the heating of the ozone layer, which affects temperature. The third is the influence of high-energy particles, such as solar wind and cosmic rays on cloud processes through increasing the number of cloud condensation nuclei and affecting cloud droplet growth efficiency, thereby influencing extreme temperature events. The fourth is the more complex influence through the Earth’s magnetic field. ENSO, by affecting the strength of the East Asian monsoon and the position of the Pacific subtropical high-pressure system, further affects the monsoon intensity. As the subtropical high-pressure system gradually strengthens in summer, the frequency of extreme high-temperature events increases, while the enhancement of the southwest monsoon in winter hinders the southward movement of the Siberian High, leading to a reduced frequency of extreme low-temperature events. The substantial emission of greenhouse gases leads to an increase in atmospheric temperatures, resulting in a greater or lesser occurrence of temperature-related extreme events. On the anthropogenic side, industrial production is a major contributor to the significant emissions of greenhouse gases. In recent years, rapid urbanization has altered land use, encroaching on a significant amount of ecological land, changing surface reflectivity, and contributing to the destruction of vegetation and population growth. As a result, global warming has occurred, leading to a corresponding increase or decrease in warm and cold indicators (McGregor et al., 2005) (MA et al., 2012).
In this study, the Mann-Kendall test was employed to analyze abrupt changes, with the results presented in Figure 3. In Hainan Province, only two indices, TXx and TR20, underwent abrupt changes. The years of abrupt change for TXx were concentrated between 2004 and 2011, exhibiting an increasing trend within the oscillations. The period prior to the abrupt change was 4.43 days higher than the period following the change. For TR20, the abrupt change occurred around 2000, with the period prior to the change being 0.24°C higher than the period following the change. Among these, warm indices, such as TXx and TR20, underwent abrupt increases from few to many, while the remaining indices showed no abrupt changes.
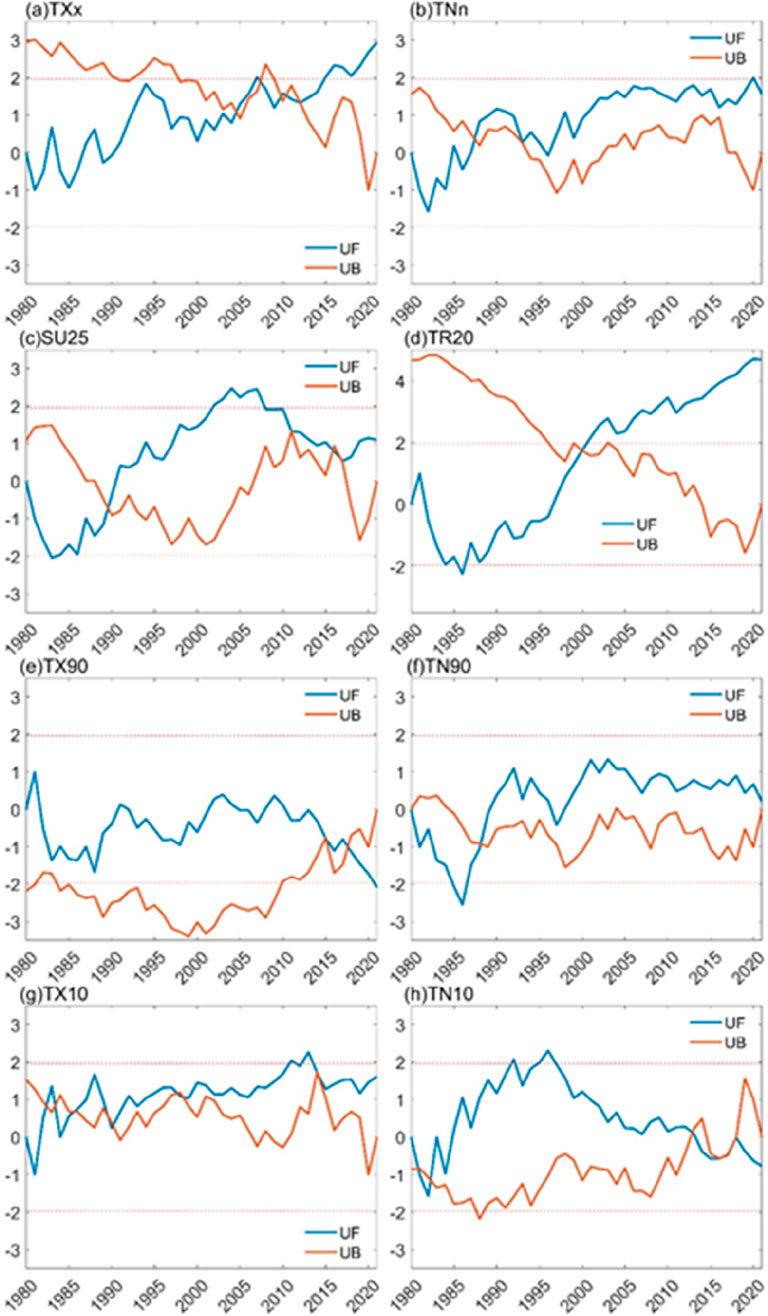
Figure 3. Temporal variation of extreme temperature indices in Hainan Province from 1980 to 2020: (A) TXx: Extreme maximum temperature (°C), (B) TNn: Extreme minimum temperature (°C), (C) SU25: Number of summer days (days), (D) TR20: Number of hot nights (days), (E) TX90: Number of warm days (days), (F) TN90: Number of warm nights (days), (G) TX10: Number of cold days (days), and (H) TN10: Number of cold nights (days).
Abrupt changes in extreme temperature indices can be influenced by various factors (Daoyi and Shaowu, 2003; Wang et al., 2016). These factors can individually affect abrupt changes in extreme temperature indices or interact with other factors, leading to abrupt changes. Generally, the main influencing factors include interdecadal changes in atmospheric circulation (Lv et al., 2016), solar activity, volcanic activity, greenhouse effects, and variations in aerosols (Bin et al., 2023). The abrupt changes in extreme temperature indices in Hainan Province may be related to their specific geographical location and the influence of sea temperature anomalies (Qian et al., 2019).
As shown in Figure 4, extreme temperature indices in Hainan Province from 1980 to 2022 exhibit an increasing trend, particularly for extreme maximum temperature (TXx) and extreme minimum temperature (TNn). The trends in these two extreme temperature indices range from −0.06°C–0.07°C/10 years and from −0.08°C to 0.07°C/10 years, respectively. For both TXx and TNn, 95.24% of the stations passed the significance test (p < 0.05). The most significant increase in TXx occurred at the Sanya station, whereas the most significant increase in TNn was observed at the Baoting station. Among the 21 stations in Hainan Province, 20 stations displayed an increasing trend in TXx. This finding suggests an increased risk of rising temperatures in this region. These findings align with studies in other regions globally, indicating that they are influenced by the overarching trend of global warming (Wang and Xu, 2012).
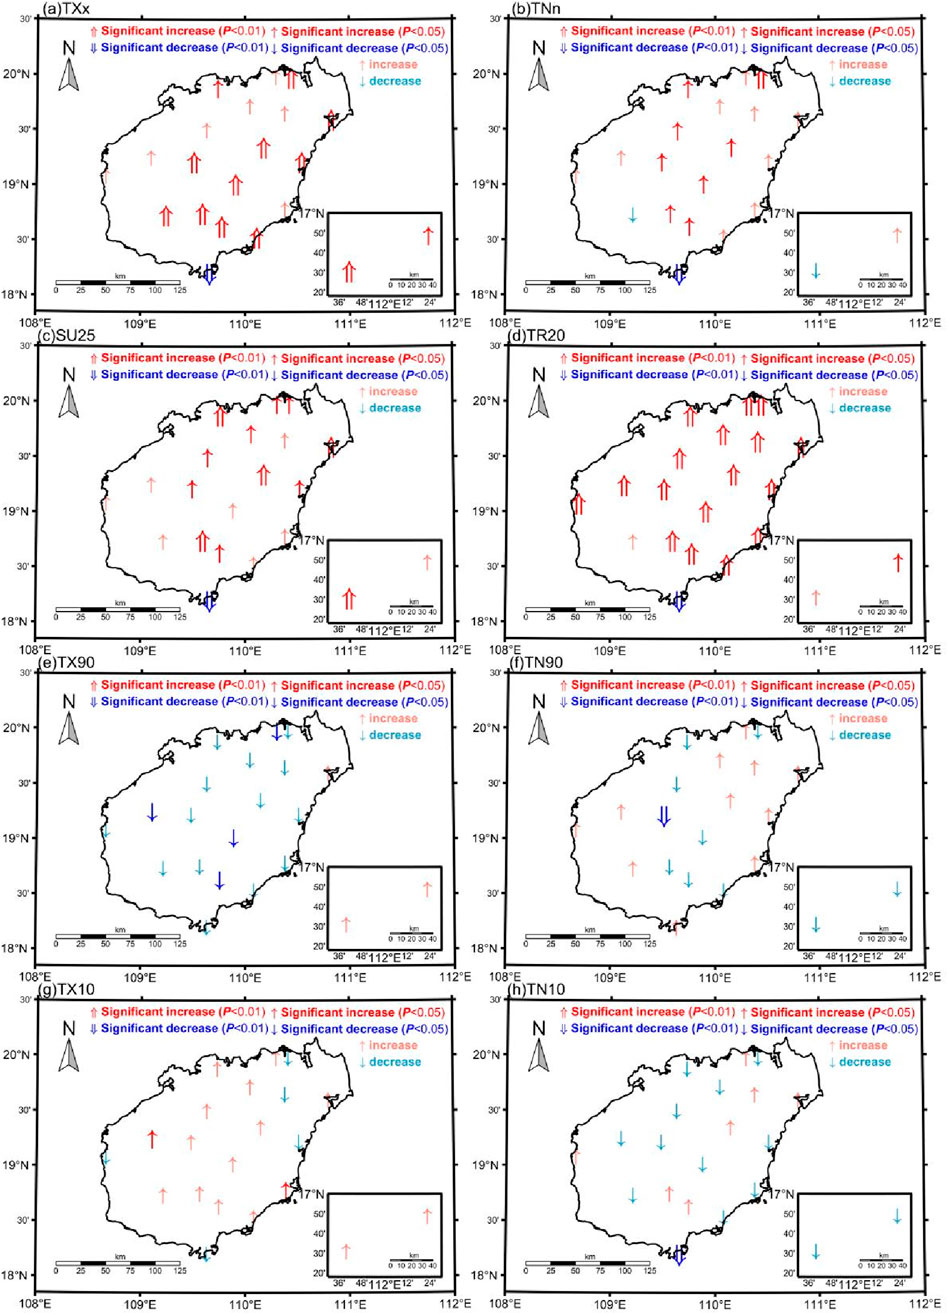
Figure 4. Spatial distribution of trends in extreme temperature indices in Hainan Province from 1980 to 2020: (A) TXx: Extreme maximum temperature (°C), (B) TNn: Extreme minimum temperature (°C), (C) SU25: Number of summer days (days), (D) TR20: Number of hot nights (days), (E) TX90: Number of warm days (days), (F) TN90: Number of warm nights (days), (G) TX10: Number of cold days (days), (H) TN10: Number of cold nights (days).
In the context of global warming, factors such as altitude, latitude, and land‒sea thermal properties play a significant role in the spatial distribution of extreme temperature indices. Studies by Wang and Xu (2012) and others have shown that on Hainan Island, TNn is positively correlated with altitude, whereas TXx is negatively correlated with variations in latitude. Our study corroborates this pattern, as the Sanya station has lower latitude and altitude compared to the Baoting station. For every 100 m increase in altitude, the temperature is observed to decrease by 0.6°C. As altitude increases, the thermodynamic conditions change, which in turn affects temperature. Latitude variations primarily influence changes in surface solar radiation, which subsequently affects surface temperature conditions and the intensity and frequency of extreme temperature events.
Except for the Sanya station, all other stations show an increasing trend on summer days (SU25) and tropical nights (TR20), with trends ranging from −3.15°C to 0.54°C/10 years and −1.30°C to 1.29°C/10 years, respectively, as shown in Figure 4. All stations passed the significance test (p < 0.05). The most significant upward trends in SU25 were observed at the Lin’gao, Tunchang, Wuzhishan, and Sanya stations (p < 0.01). For TR20, except for the Ledong, Sanya, and Xisha stations, all other stations exhibited a highly significant upward trend (p < 0.01). Both SU25 and TR20 at the Sanya station experienced a significant decline. The upward trends in absolute indices, from a macro perspective, are primarily influenced by the overarching environmental trend of global warming. However, from a micro perspective, the most significant reasons for the upward trends in SU25 in Lin’gao, Tunchang, Wuzhishan, and Sanya (p < 0.01) are the high solar radiation values in these areas (Wu et al., 2015). TR20 is negatively correlated with latitude, leading to highly significant upward trends (p < 0.01) in the Ledong, Sanya, and Xisha Islands, which have lower latitudes. The opposite temperature trends observed at the Sanya station are due to changes in the station’s location (Huang, 2006).
The spatial variability of extreme temperature events across meteorological stations in Hainan Province demonstrates notable differences, which are potentially influenced by environmental factors such as topography and land use changes. For example, high-altitude regions, such as areas near Wuzhi Mountain, are likely to experience more pronounced cooling effects due to elevation, whereas urbanized areas like Haikou may exhibit higher temperature extremes driven by the urban heat island effect. While this study primarily focuses on the spatial variability of extreme temperature indices at the station level, the roles of these environmental factors deserve further exploration. Future studies could integrate detailed topographic and land use data to better understand their contributions to extreme temperature patterns.
In Hainan Province, warm days (TX90) show a declining trend, while warm nights (TN90) exhibit a relatively stable trend. The trends for TX90 and TN90 range from −0.18 to 0.06 and −0.22 to 0.10 days/10 years, respectively. Among the stations, 85.71% of the stations showed a declining trend in TX90, while 47.62% of the stations exhibited a declining trend in TN90 (p < 0.05). The station with the most significant decrease in TX90 was Qiongzhong, while the station with the highest increase in TN90 was Haikou, and the station with the most significant decrease was Baisha. Warm days (TX90) increased at 80.95% of the meteorological stations, and warm nights (TN90) increased at 33.33% of the stations, with trends ranging from −0.04 to 0.12 and −0.15 to 0.05 days/10 years. Among these stations, 19.05% exhibited a significant decrease in TX10, and 66.67% exhibited a significant decrease in TN10 (p < 0.05). The station with the most significant increase in TX10 was Wanning, and the station with the most significant decrease in TN10 was Sanya.
Spatially, 52.38% of the stations showed lower trend rates for TX90 than TN90, and 28.57% of stations showed lower trend rates for TX10 than TN10. This finding indicates that in the last 40 years, warm nights have been increasing faster than warm days, and cold days have been decreasing faster than cold nights, indicating an asymmetry in the changes in daytime and nighttime indices. This result is consistent with research in other regions globally, suggesting that they are influenced by the overarching trend of global warming (Wang and Xu, 2012). In addition to the macro factor of global warming, on Hainan Island (Wu et al., 2015), TX90 shows a significant positive correlation with altitude, while TX10 and TN10 show a significant negative correlation with altitude. This finding can explain the spatial variation in relative indices in Hainan Province.
Using the theoretical framework of wavelet analysis, this study computed wavelet coefficients and plotted the real part contour maps using MATLAB 2018b (Figure 5). This study aimed to investigate the variation in periodic patterns in Hainan’s temperature indices through Morlet continuous complex wavelet transformation. As Figure 5 shows, extreme temperature indices exhibit a multipeak spectral pattern, with significant oscillations occurring at quasi-4-year, 8–14-year, and -16–20-year periods. Specifically, quasi-4-year oscillations show frequent changes, indicating pronounced fluctuations in extreme temperatures within approximately 4-year periods, with four to six oscillations. Both TXx and TNn exhibit similar periodic changes, mainly ranging from 4 to 15 years, indicating multiple cycles of warmth and cold (Figures 4A,B). SU25 and TR20 exhibit similar periodic changes, primarily with 4–6-year principal period oscillations (Figures 4A,B). The quasi-4-year oscillation period serves as the primary periodicity, indicating quasiperiodic alternations between warm and cold; secondarily, there is a quasi-10–30-year cycle (Figures 4C,D). TX90 and TN90 share similar periodic changes, with the most significant oscillation period being 4–5 years, which is the primary period, and it has a global scope. The secondary period is a quasi-10-year cycle, which is short-lived and localized (Figures 4E,F). TX10 and TN10 exhibit similar periodic changes, with 4–5-year oscillation periods being the most significant, serving as the primary periodicity, followed by a relatively pronounced 8–10-year oscillation period, which is the secondary period (Figures 4G,H).
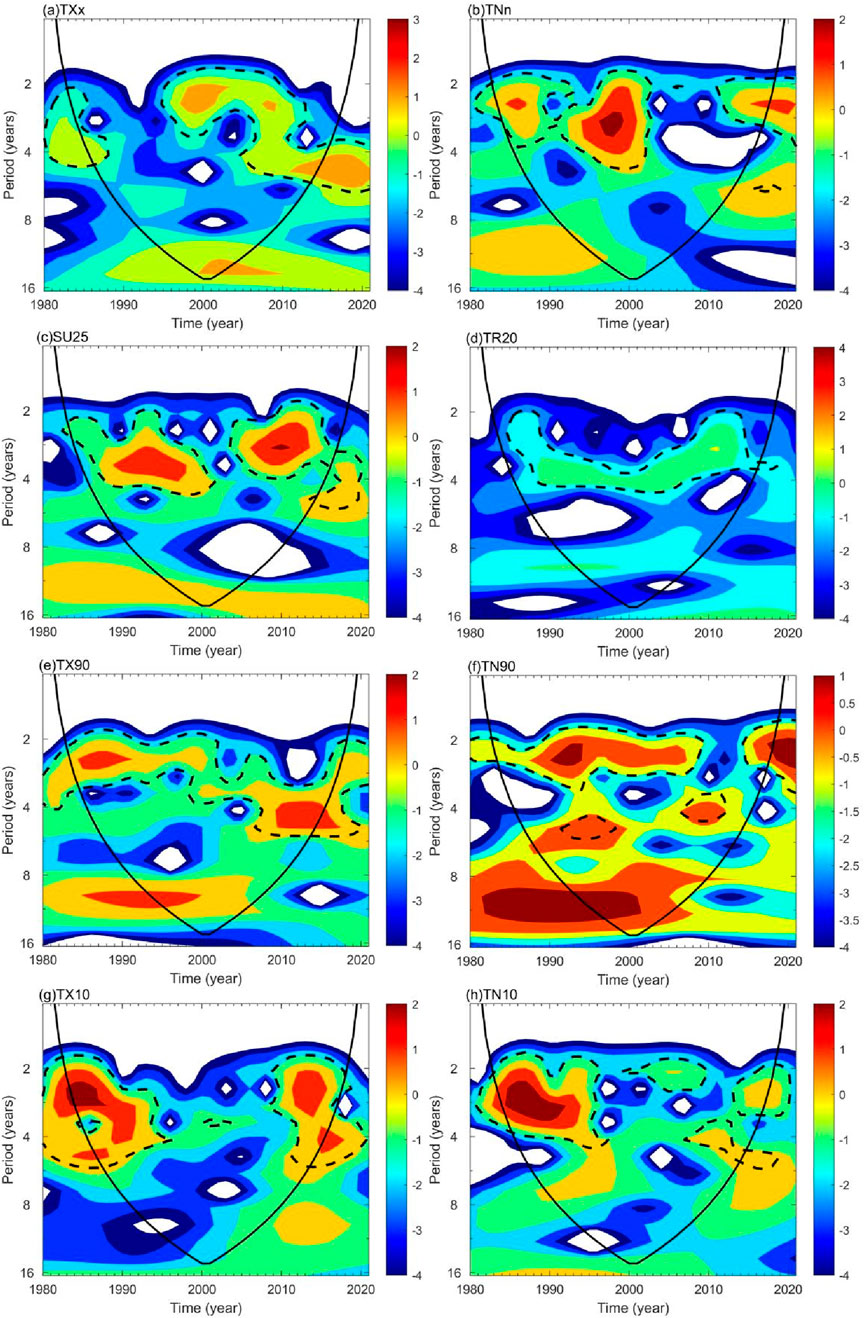
Figure 5. Wavelet analysis of extreme temperature indices in Hainan Province from 1980 to 2020: (A) TXx: Extreme maximum temperature (°C), (B) TNn: Extreme minimum temperature (°C), (C) SU25: Number of summer days (days), (D) TR20: Number of hot nights (days), (E) TX90: Number of warm days (days), (F) TN90: Number of warm nights (days), (AG) TX10: Number of cold days (days), and (H) TN10: Number of cold nights (days).
The short-term fluctuations in the extreme temperature indices around the quasi-4-year period are attributed to the variations in the monsoon patterns. Hainan Province is located in the eastern monsoon region of China, where the monsoon exhibits approximately 3-year oscillation patterns. The fluctuations in the monsoon, in turn, cause variations in extreme temperature indices. For the 8–14-year medium-term periodic oscillations and 16–20-year long-term oscillations, the primary influencing factor is the seasonal variation in sunspots, leading to changes in solar radiation.
In this study, principal component analysis (PCA) was employed to obtain the principal components of extreme temperature indices in Hainan Province from 1980 to 2022. The Kaiser‒Meyer‒Olkin (KMO) measure was calculated, yielding a value of 0.481, while Bartlett’s test of sphericity was significant. Three principal components had eigenvalues greater than 1, contributing variances of 27.096%, 23.058%, and 22.713%, respectively, resulting in a cumulative variance contribution of 72.867% (Table 2). The first principal component exhibited high loadings (greater than 0.39) for both SU25 and TR20, indicating the change characteristics of extreme warm temperature indices in Hainan Province. This characteristic is observed against the backdrop of global climate warming. Table 3 presents the results of the correlation analysis of extreme temperature indices in Hainan Province. Among all the extreme warm temperature indices, SU25 and TR20 exhibited significant positive correlations (p < 0.01).
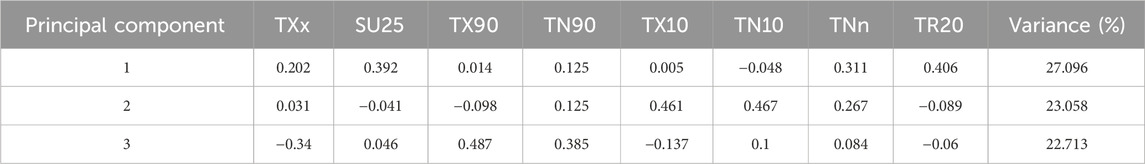
Table 2. Component score coefficient matrix.
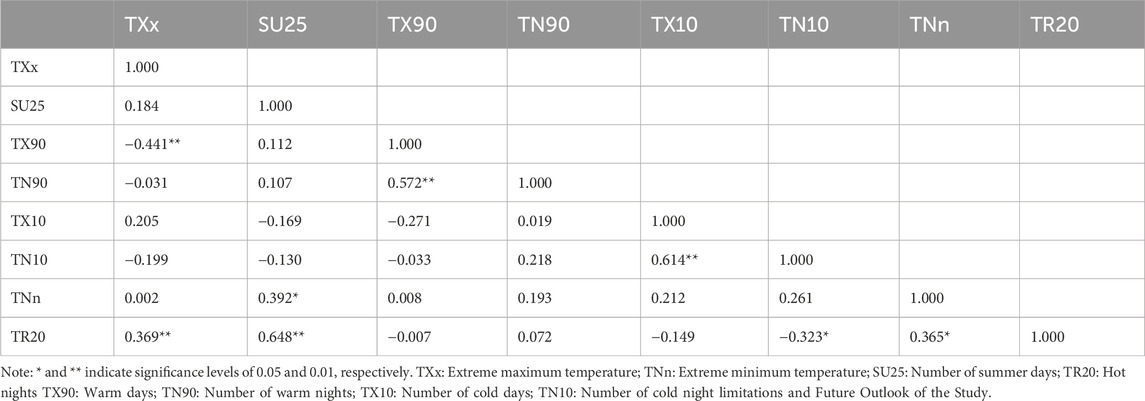
Table 3. Correlation matrix.
The second principal component exhibited relatively high loadings (above 0.2) for both TX10 and TN10, indicating the change characteristics of the relative minimum temperature indices in Hainan Province. These two indices also exhibited significant positive correlations (p < 0.01). The third principal component exhibited high loadings for TX90 and TN90, indicating the change characteristics of relative maximum temperature indices in Hainan Province, which were confirmed through a significance test (p < 0.01). Further examination of Table 3 revealed that TXx was significantly correlated with the TX90 and TR20 indices, while TNn was significantly correlated only with SU25. These data suggest that the increase in warm indices is the primary cause of the temperature rise in Hainan Province over the last 40 years, with the increase in daily maximum temperature being the main influencing factor for changes in various indices. This is consistent with the findings of previous studies (Lv et al., 2016).
The increase in daily maximum and minimum temperatures is influenced by ENSO warm events, whereas ENSO cold events have the opposite effect. The occurrence of ENSO enhances convective activity in the tropical Pacific region, further strengthening heat sources and disrupting atmospheric circulation in the Northern Hemisphere through teleconnections, thereby affecting climate change (Trenberth, 1998)- (Gong and Wang, 2003).
This study employed temperature data from 21 meteorological stations in Hainan Province to examine extreme temperature events. Although these data were adjusted for missing and erroneous values using a linear regression model, the study did not account for factors such as the limited number of stations and changes in station locations within the province. These factors may introduce some degree of error in the characterization of extreme temperature indices. In future research, it will be crucial to rectify erroneous data from stations, establish additional and denser stations, and ensure a more comprehensive and accurate understanding of the spatiotemporal characteristics of extreme temperature events in Hainan Province.
Using temperature observations from 21 meteorological stations in Hainan Province from 1980 to 2022, along with the RClimDex model and mathematical statistical methods, this study quantitatively examines the spatiotemporal variation characteristics of extreme temperature events in Hainan Province over the past 4 decades and presents the following key findings:
From 1980 to 2022, most extreme temperature indices (TXx, TNn, SU25, TR20, TX10) in Hainan Province displayed upward trends, with rates of 0.023°C/10 years, 0.029°C/10 years, 0.163 days/10 years, 0.674 days/10 years, and 0.035 days/10 years, respectively. Conversely, TX90, TN90, and TN10 displayed declining trends of −0.089°C/10 years, −0.019°C/10 years, and −0.017 days/10 years, respectively. Spatially, the majority of sites exhibited increasing trends for both warm and cold indices. Only TXx and TR20 underwent transitions from fewer to more frequent upward trends, with transition years concentrated between 2000 and 2011.
Regarding periodic changes, extreme temperature indices exhibited multipeak spectra with quasi-4-year short oscillation periods, 8–14-year medium oscillation periods, and 16–20-year long oscillation periods. Most regions in Hainan Province displayed oscillation periods of approximately 4 years. The cyclical changes in TXx and TNn were similar, primarily encompassing oscillation periods of 4–15 years, characterized by multiple cold-warm alternating oscillations. SU25 and TR20 exhibited similar cyclical changes, primarily characterized by 4–6-year primary oscillation periods, as well as quasi-4-year and quasi-10–30-year secondary periods. TX90 and TN90 displayed similar cyclical patterns, consisting of 4–5-year oscillation periods and a quasi-10-year secondary period. TX10 and TN10 displayed 4–5-year primary oscillation periods and an 8–10-year secondary period.
Changes in warm indices are the primary driver of temperature increases in Hainan Province over the last 40 years, with the increase in daily maximum temperature being the main influencing factor for changes in various indices. Over the last 40 years, the increase in warm nighttime days has surpassed that of warm daytime days in Hainan Province, while the decrease in cold daytime days has exceeded that of cold nighttime days, indicating an asymmetry in diurnal changes.
This study offers valuable insights into the trends and periodicity of extreme temperature indices in Hainan Province, emphasizing the need for a more comprehensive and precise monitoring network for future research.
The datasets presented in this study can be found in online repositories. The names of the repository/repositories and accession number(s) can be found in the article/supplementary material.
QY: Writing–original draft, Writing–review and editing. QZ: Data curation, Funding acquisition, Resources, Supervision, Writing–original draft, Writing–review and editing.
The author(s) declare that no financial support was received for the research, authorship, and/or publication of this article. This research was funded by the Natural Science Foundation of Gansu Province (Grant No. 21JR7RA698), the National Natural Science Foundation of China (Grant No. 41705067).
We sincerely thank China Meteorological Administration for the data provided for our study.
The authors declare that the research was conducted in the absence of any commercial or financial relationships that could be construed as a potential conflict of interest.
The author(s) declare that no Generative AI was used in the creation of this manuscript.
All claims expressed in this article are solely those of the authors and do not necessarily represent those of their affiliated organizations, or those of the publisher, the editors and the reviewers. Any product that may be evaluated in this article, or claim that may be made by its manufacturer, is not guaranteed or endorsed by the publisher.
Alexander, L. V., Zhang, X., Peterson, T. C., Caesar, J., Gleason, B., Klein Tank, A. M. G., et al. (2006). Global observed changes in daily climate extremes of temperature and precipitation. J. Geophys. Res- Atmos. 111 (D5). doi:10.1029/2005jd006290
Bin, X., Jiang, X. L., and Ren, X. Y. (2023). Analysis of extreme temperature events in hainan island in recent 51 years. J. Trop. Meteorol. 39, 424–432.
Brunetti, M., Buffoni, L., Mangianti, F., Maugeri, M., and Nanni, T. (2004). Temperature, precipitation and extreme events during the last century in Italy. Glob. Planet. Change 40, 141–149. doi:10.1016/s0921-8181(03)00104-8
Daoyi, G., and Shaowu, W. (2003). Influence of arctic oscillation on winter climate over China. J. Geogr. Sci. 13, 208–216. doi:10.1007/bf02837460
Du, H., Xia, J., Yan, Y., Lu, Y., and Li, J. (2022). Spatiotemporal variations of extreme precipitation in wuling mountain area (China) and their connection to potential driving factors. Sustainability 14, 8312. doi:10.3390/su14148312
Gao, F., Chen, X., Yang, W., Wang, W., Shi, L., Zhang, X., et al. (2022). Statistical characteristics, trends, and variability of rainfall in Shanxi province, China, during the period 1957–2019. Theor. Appl. Climatol. 148, 955–966. doi:10.1007/s00704-022-03924-w
Gong, D. Y., and Wang, S. W. (2003). Influence of arctic oscillation on winter climate over China. Acta Geogr. Sin. 58, 559–568.
Griffiths, G. M., Chambers, L. E., Haylock, M. R., Manton, M. J., Nicholls, N., Baek, H., et al. (2005). Change in mean temperature as a predictor of extreme temperature change in the Asia-Pacific region. Int. J. Climatol. 25, 1301–1330. doi:10.1002/joc.1194
Gruza, G., Rankova, E., Razuvaev, V., and Bulygina, O. (1999). Indicators of climate change for the Russian Federation. Clim. Change 42, 219–242. doi:10.1007/978-94-015-9265-9_14
He, Y., Yan, W., Cai, Y., Deng, F., Qu, X., and Cui, X. (2022). How does the Net primary productivity respond to the extreme climate under elevation constraints in mountainous areas of Yunnan, China? Ecol. Indic. 138, 108817. doi:10.1016/j.ecolind.2022.108817
Huang, R. H. (2006). Progresses in research on the formation mechanism and prediction theory of severe climatic disasters in China. Adv. Earth Sci. 21, 564–574.
Karl, T. R., Knight, R. W., and Easterling, D. R. (1995). Trends in US climate during the twentieth century. Consequences 1, 3–12.
Lv, D. Y., Chang, X. L., Yue, X. Y., and Huang, H. T. (2016). Comparative analysis of air temperature change trends among different ecosystems in recent decades in northeast China. J. Desert Res. 36, 12–19.
Ma, J., Luo, Y., and Liang, H. (2012). Spatial and temporal variation of total solar radiation in China in recent 50 years. J. Nat. Resour. 27, 268–280.
McGregor, G. R., Ferro, C. A. T., and Stephenson, D. B. (2005). Projected changes in extreme weather and climate events in Europe. Extreme. Weather. Events. Public. Health. Responses., 13–23. doi:10.1007/3-540-28862-7_2
Meredith, M. P., and King, J. C. (2005). Rapid climate change in the ocean west of the Antarctic Peninsula during the second half of the 20th century. Geophys. Res. Lett. 32. doi:10.1029/2005gl024042
Plummer, N., Salinger, M. J., Nicholls, N., Suppiah, R., Hennessy, K. J., Leighton, R. M., et al. (1999). Changes in climate extremes over the Australian region and New Zealand during the twentieth century. Weather. Clim. Extrem. Chang. Var. Perspect. Insur. Ind., 183–202. doi:10.1007/978-94-015-9265-9_12
Qian, J. H., Tian, K., Bai, G. H., Zou, R., Chen, H. P., and Chen, X. M. (2019). Extreme climate events in hainan during 1977-2017: spatio-temporal differences. Chin. Agr. Sci. Bull. 35, 89–94.
Qian, W., and Qin, A. (2006). Spatial-temporal characteristics of temperature variation in China. Meteorol. Atmos. Phys. 93, 1–16. doi:10.1007/s00703-005-0163-6
Ren, F., Cui, D., Gong, Z., Wang, Y., Zou, X., Li, Y., et al. (2012). An objective identification technique for regional extreme events. J. Clim. 25, 7015–7027. doi:10.1175/jcli-d-11-00489.1
Ren, G., Trewin, B., Baldi, M., Baldi, M., Fukuda, Y., et al. (2009). Changes in means and extreme events of temperature and precipitation in the Asia-Pacific Network region, 1955–2007. Int. J. Climatol. 29, 1906–1925. doi:10.1002/joc.1979
Ren, G. Y., Feng, G. L., and Yan, Z. W. (2010). Review and prospect of extreme climate change observation and research in China. Clim. Environ. Res. 15, 337–353.
Rusticucci, M. (2012). Observed and simulated variability of extreme temperature events over South America. Atmos. Res. 106, 1–17. doi:10.1016/j.atmosres.2011.11.001
Shackley, S., and Wynne, B. (1996). Representing uncertainty in global climate change science and policy: boundary-ordering devices and authority. Sci. Technol. Hum. Values 21, 275–302. doi:10.1177/016224399602100302
Trenberth, K. E. (1998). Atmospheric moisture residence times and cycling: implications for rainfall rates and climate change. Clim. Change 39, 667–694. doi:10.1023/a:1005319109110
Trenberth, K. E., Jones, P. D., and Ambenje, P. (2007). Observations. surface and atmospheric climate change.
Wang, C. H.Li, and Xu, X. G. (2012). The universality of quasi-three-year cycle of temperature change in recent 50 years in China and the possible trend of temperature change in the future. Plateau. Meteorol. 31, 126–136.
Wang, J. R.M., Liu, L., Huang, X., Liu, D. H., and Li, H. Y. (2016). Comparative analysis of temperature before and after abrupt changes in Horqin Sandy Land from 1951 to 2012. Resour. Sci. 38, 690–703.
Wang, L., Sun, L., Li, W., Chen, X., Li, Y., Zou, X., et al. (2023). State of China's climate in 2022. Atmos. Ocean. Sci. Lett. 16, 100356. doi:10.1016/j.aosl.2023.100356
Wu, C., Zhao, J. B., and Wang, G. H. (2015). Analysis of climate evolution characteristics of extreme temperature index in the Yellow River Basin. Chin. J. Agrometeorol. 36, 525–535.
Yang, P., Hou, W., and Feng, G. L. (2010). A study of the characteristics of the cluster extreme events in China. Clim. Environ. Res. 15, 365–370. (In Chinese).
Yao, X., Zhang, M., Zhang, Y., Xiao, H., and Wang, J. (2021). Research on evaluation of climate comfort in northwest China under climate change. Sustainability 13, 10111. doi:10.3390/su131810111
Zhang, X., Yang, F., and Santos, J. L. (2004). RClimDex (1.0). Manual del usuario. Clim. Res. Branch. Env. Can. Versión español.
Zhao, Y., Zhang, X., Chen, M., Gao, S., and Li, R. (2022). Regional variation of urban air quality in China and its dominant factors. J. Geogr. Sci. 32, 853–872. doi:10.1007/s11442-022-1975-8
Keywords: extreme temperature events, RClimDex model, Hainan Province, temporal and spatial variation, Mann-Kendall
Citation: Yun Q and Zhang Q (2025) Spatiotemporal variation characteristics of extreme temperature events in Hainan Province over the past four decades. Front. Environ. Sci. 13:1510445. doi: 10.3389/fenvs.2025.1510445
Received: 13 October 2024; Accepted: 28 January 2025;
Published: 25 February 2025.
Edited by:
Wen Zhou, Fudan University, ChinaReviewed by:
Guoyin Wang, Fudan University, ChinaCopyright © 2025 Yun and Zhang. This is an open-access article distributed under the terms of the Creative Commons Attribution License (CC BY). The use, distribution or reproduction in other forums is permitted, provided the original author(s) and the copyright owner(s) are credited and that the original publication in this journal is cited, in accordance with accepted academic practice. No use, distribution or reproduction is permitted which does not comply with these terms.
*Correspondence: Qiang Zhang, emhhbmdxaWFuZ0BjbWEuZ292LmNu
Disclaimer: All claims expressed in this article are solely those of the authors and do not necessarily represent those of their affiliated organizations, or those of the publisher, the editors and the reviewers. Any product that may be evaluated in this article or claim that may be made by its manufacturer is not guaranteed or endorsed by the publisher.
Research integrity at Frontiers
Learn more about the work of our research integrity team to safeguard the quality of each article we publish.