 Mingbao Chen
 Maolin Li
 Ping Wang3
94% of researchers rate our articles as excellent or good
Learn more about the work of our research integrity team to safeguard the quality of each article we publish.
Find out more
ORIGINAL RESEARCH article
Front. Environ. Sci., 19 February 2025
Sec. Social-Ecological Urban Systems
Volume 13 - 2025 | https://doi.org/10.3389/fenvs.2025.1506136
Ecosystem services (ESs) are a key component of social-ecological system (SES). Exploring the spatial processes of coastal ESs is of great significance for promoting the high-quality development of coastal zones. This study investigates the spatial patterns of ESs and their interrelationships, identifies the key driving mechanisms, and subsequently offers sustainable management strategies. The major results reveal that (1) ESs exhibit a fluctuating growth trend (k = 0.017, R2 = 0.175) from 2000 to 2022, but their synergistic effects are gradually weakening; Spatially, ESs show a pattern of higher levels in the south and lower levels in the north, with a significant north-south disparity; In the future, ESs exhibit a slight upward trend (mean Hurst = 0.516), with the spatial processes in the southern region being stronger than those in the northern region. (2) ESs are more strongly influenced by social factors and less affected by natural factors. Natural factors have a weak positive influence on ESs, while the opposite is true for social factors; Social factors exert a stronger nonlinear mechanism on ESs than natural factors. (3) The spatial processes of ESs demonstrate a pronounced aggregation pattern, which can serve as a basis for spatial partitioning. As a result, we integrate local realities and governance knowledge into spatial planning to support the sustainable development of SES.
Ecosystem services (ESs) refer to the benefits that humans directly or indirectly derive from ecosystems, which contribute to human well-being (Li D. et al., 2022). They serve as a bridge between natural and social systems, facilitating material exchanges and information flows (de Andrés et al., 2017; Martín-López et al., 2017). In recent years, against the backdrop of rapid global economic development, the conflicts between resources, population, and the environment have become increasingly pronounced (Liu et al., 2007; Wu et al., 2020). ESs are losing their original functions, with approximately 60% of ESs increasingly deteriorating (Vihervaara et al., 2010; Xia et al., 2023). ESs represent a collection of various services provided by ecosystems. They not only exhibit complex relationships but also demonstrate significant spatial non-stationarity under different social-ecological conditions (Fan et al., 2024; Jiang and Dong, 2024). The complex social-ecological dynamics make the spatial processes of ESs highly uncertain. Exploring their dynamic mechanisms not only helps to uncover the root causes of ecological issues but also provides a certain scientific basis for the formulation of spatial management strategies.
In the context of the Anthropocene and the Sustainable Development Goals, research on ESs has garnered widespread attention globally. Currently, the assessment methods for ESs are primarily divided into two categories: social assessment and natural assessment (Diaz et al., 2023; Palm et al., 2014). Social assessment primarily includes monetary valuation and perception-based assessment (Pham and Lin, 2023; Plieninger et al., 2013). Monetary valuation quantifies ESs by converting their market value or area value into monetary terms (Eger et al., 2023; Schröter et al., 2015), while perception-based assessment evaluates ESs based on respondents’ perceptions or preferences, typically through surveys or interviews (Scholte et al., 2015). Social assessment can be applied to the evaluation of various ESs, but it oversimplifies the heterogeneity of ESs and has high requirements for underlying data (Chan et al., 2012; DeLoyde and Mabee, 2023). Therefore, it is more suitable for research on ESs at smaller scales. Natural assessment primarily involves mass-based evaluation, it is grounded in ecological processes, and utilizes biophysical models to represent ESs (Chen and Costanza, 2024; Kpienbaareh et al., 2024). Natural assessment has certain advantages in revealing the spatial processes of ESs. It can objectively reflect the spatial non-stationary characteristics of ESs. However, for some ESs that are difficult to quantify, it needs to be combined with social assessment.
ESs have complex spatial processes (An et al., 2024; Schirpke et al., 2023). Although related studies have made certain progress in value assessment, supply-demand matching and collaborative relationships (Ai et al., 2024; Ren et al., 2024; Tu et al., 2023), research on dynamic mechanisms still lacks in-depth exploration. ESs are influenced by both social and natural systems. Many related studies commonly employ methods such as logistic regression (Obeng and Aguilar, 2018) and stepwise regression (Chen B. M. et al., 2022) to investigate the linear effects of social-natural factors on ESs (Li et al., 2016; Sun et al., 2019). Although some studies have begun to incorporate methods such as scenario simulation (Kabaya et al., 2019) and quantile regression (Liu Z. T. et al., 2023) to further reveal the interactive relationships between ESs and social-natural factors, the dynamic mechanisms of ESs are complex, involving not only linear but also non-linear effects. In addition to the impact effects, social-natural factors also vary in their relative importance with respect to ESs. Therefore, in order to reveal the complex processes of ESs, both the impact effects and relative importance need to be considered together.
The coastal zone serves as a bridge between terrestrial and marine systems, while coastal ESs lie at the intersection of social-ecological systems and terrestrial-marine systems (Blythe et al., 2020; Liu Y. et al., 2023). Therefore, compared to ESs in other regions, those in the coastal zone face more complex scenarios (Bax et al., 2023; Lau, 2013; Sun et al., 2017). It is well known that the coastal zone of China (CZC) is rich in resources and densely populated, making it a high-incidence area for conflicts between human activities and the ecological environment (Jin et al., 2023; Lau et al., 2019; Zhang L. et al., 2023). This makes it an ideal case for studying coastal ESs. Specifically, this study aims to: (1) uncover the evolutionary processes of ESs and their intrinsic relationships; (2) explore the dynamic mechanisms of ESs from both linear and nonlinear aspects, and determine the relative importance of social and natural factors; and (3) propose spatial governance strategies for CZC. The findings of this study can provide certain references for the high-quality development of CZC.
The coastal zone of China (CZC: 106°31′-125°42′E, 3°30′-42°08′N), covering approximately 4.8 × 10⁵ km2, is mainly situated in Eastern China (Figure 1A) and is one of the most intensely human-exploited geographic regions in the world (Cao and Wong, 2007; Du et al., 2022). The coastline of CZC exceeds 1.8 × 10⁴ km, and its climate zones transition from a temperate monsoon climate to a tropical monsoon climate as longitude decreases (Wang et al., 2023). Spatially, the topography of CZC, centered on Hangzhou, exhibits the characteristics of being high in the south and low in the north, and is divided into two major regions (Region N and Region S shown in Figure 1B). Additionally, Region N is largely flat, with its terrain primarily consisting of plains, whereas Region S is more rugged, characterized by mountainous terrain. CZC, influenced by a maritime climate, receives relatively abundant precipitation and experiences mild temperature variations, which are favorable for crop growth. CZC is characterized by a high level of development intensity and a complex land-use structure (Figure 1C). It covers less than 5 percent of China’s territory, yet is home to about one-fifth of the population and contributes approximately one-third of the GDP. Moreover, CZC exhibits spatial development imbalances, consisting of multiple geographical units, including the Bohai Rim Belt (Region N1 and Region N2), the Yangtze River Belt (Region N3), the Southeast Belt (Region S1) and the South China Sea Rim Belt (Region S2).
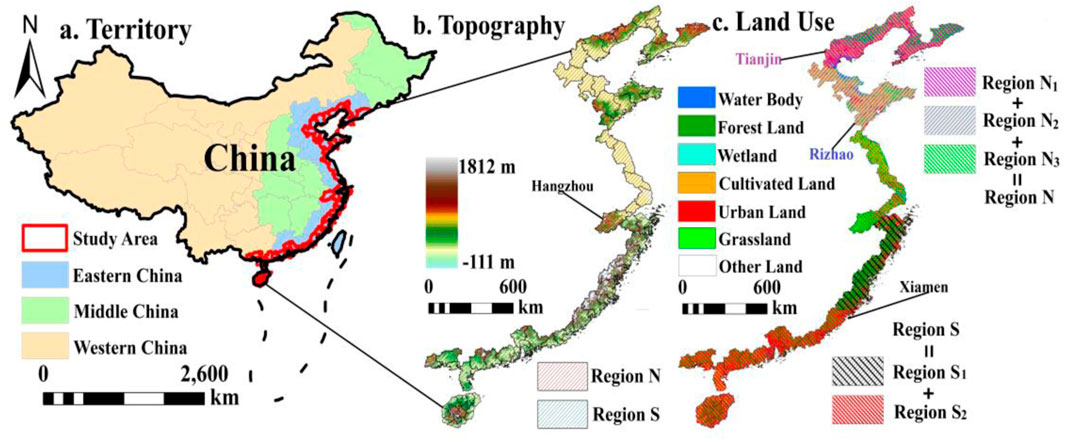
Figure 1. Location and territory map (A), topography (B) and land-use (C) of study area. Topography map has a significant north‒south terrain difference, which divides the study area into Region N and Region S (with Hangzhou as a split point). Land-use map (including seven categories) was monitored in 2022. Furthermore, Region N is subdivided into Region N1, Region N2 and Region N3 (with Tianjin and Rizhao as split points). Similarly, Region S is divided into Region S1 and Region S2 (with Xiamen as a split point).
The datasets (in 2000–2022) used for this study primarily include natural datasets, ESs, and social datasets (Table 1). The natural datasets include climate (precipitation and temperature), topography (elevation and slope), soil (sand, silt and clay), and typhoon landfall frequency. ESs consist of supply services, regulating services, support services, and cultural services (Huang et al., 2024; Niu et al., 2022; Raudsepp-Hearne et al., 2010). Additionally, supply services are expressed by net primary productivity; regulating services include carbon storage (Wang X. et al., 2022), water supply (Chen Y. et al., 2022), and soil conservation (Li J. et al., 2023), all of which are obtained through the InVEST Model; support services cover habitat quality (Li S. et al., 2023) and biodiversity (Le Provost et al., 2023); habitat quality is directly obtained through the InVEST Model; biodiversity is constructed by vegetation coverage and landscape diversity; and cultural services, related to aesthetic landscapes, are represented through entertainment and leisure (Xie et al., 2017; Zhang et al., 2010). The social datasets include population density, GDP, number of seaports, air pollution (PM2.5), proportion of urban land, land-use intensity, proportion of cropland, and land surface temperature. To eliminate unit discrepancies, we standardize the datasets from zero to one (Li S. et al., 2022). Moreover, due to limitations in data availability, the datasets exclude Sansha City and Taiwan Province.
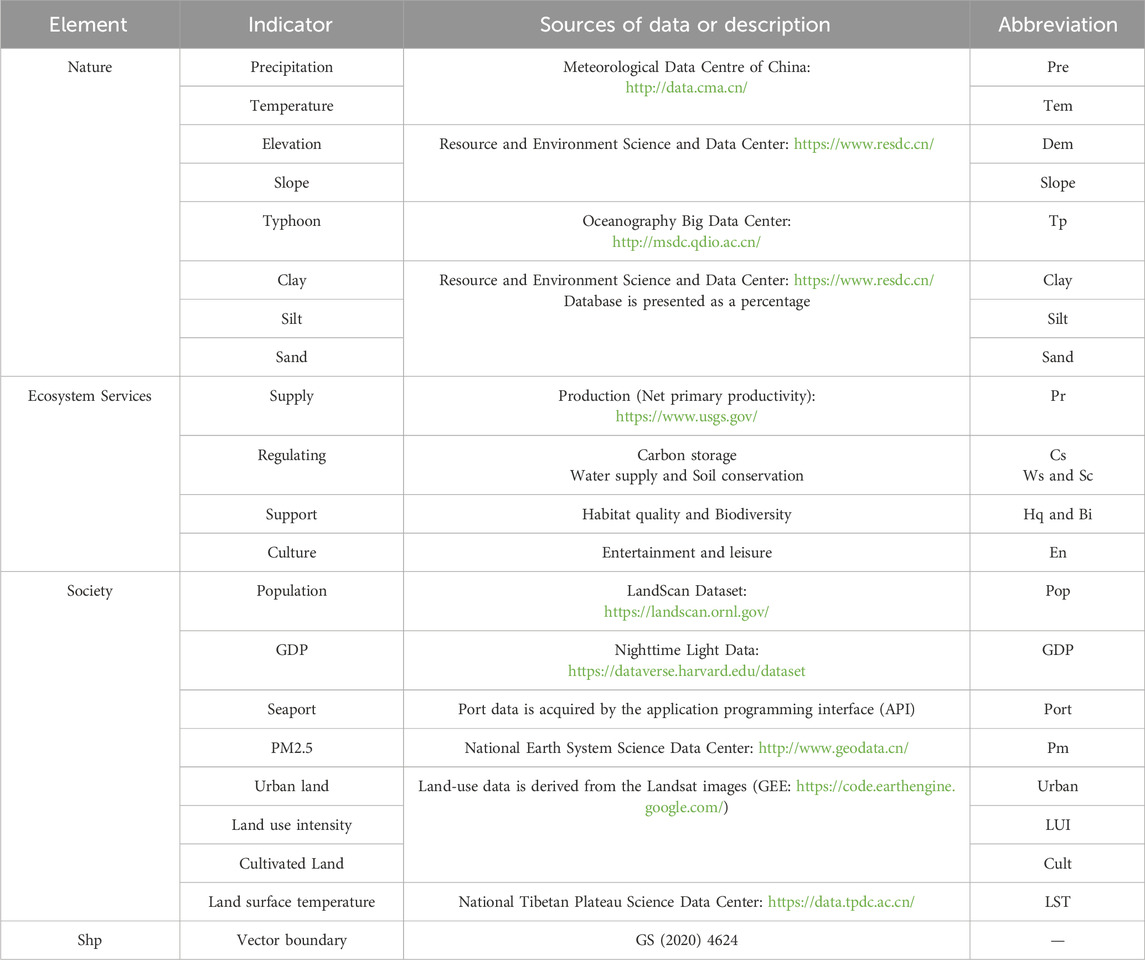
Table 1. Data sources and indicator systems.
Figure 2 depicts the framework and data processing flow of this study. In the kernel, ESs are abstracted as a bridge between social system and natural system. These systems are coupled with each other, together forming the social-ecological system of the coastal zone. The first part involves the spatiotemporal evolution of ESs including: (1) trend analysis of ESs using the Theil-Sen (Sen) and Mann-Kendall (MK) methods; (2) quantification of the spatial distribution characteristics of ESs; and (3) future trend analysis of ESs using the Hurst exponent (Hurst). The second part includes investigating the driving mechanisms of ESs from both linear and nonlinear perspectives, and determining the relative importance of social-natural factors. The third part mainly focuses on the spatial planning and governance of the coastal zone. Further details are shown in the following sections.
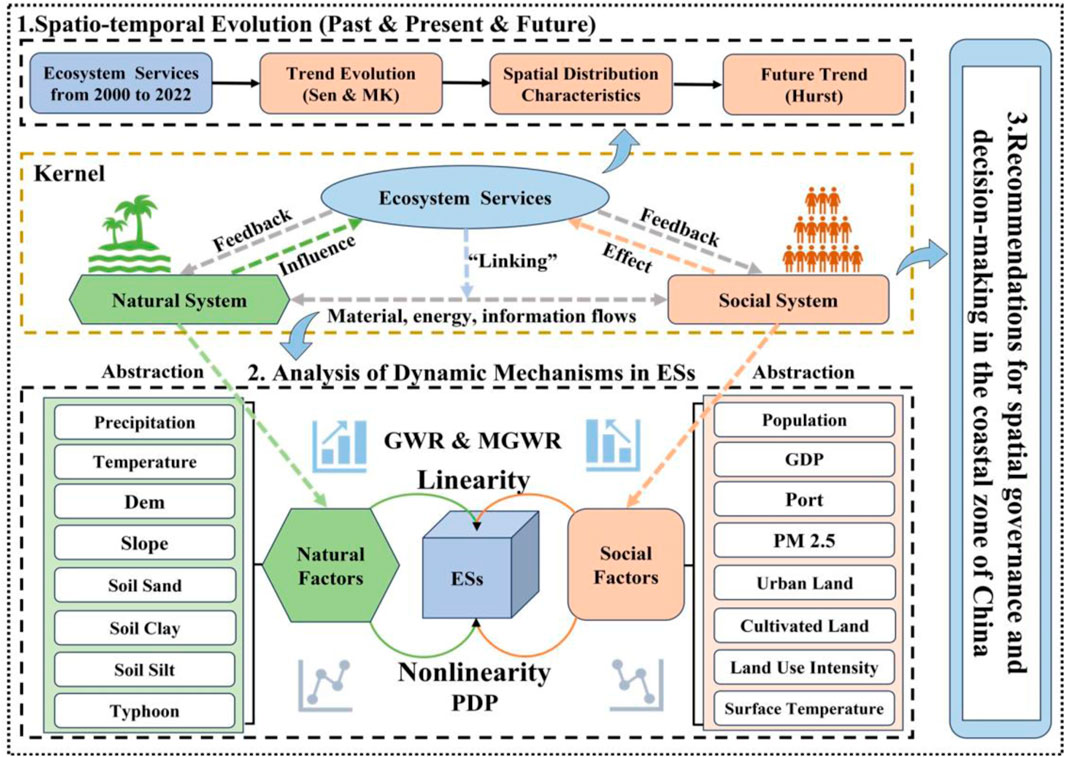
Figure 2. Study framework and data processing flow.
The spatiotemporal analysis model includes three parts: (1) Thei-Sen (Sen) is a method used for trend analysis (Feng et al., 2020), enabling the analysis and description of the trends in ESs from 2000 to 2022; (2) Mann–Kendall (MK) is a significance testing approach (Feng et al., 2020; Feng X. et al., 2023), and it can eliminate a few outliers with a good adaptability (Hensel and Frans, 2006); and (3) Hurst is a method for portraying the information dependence (Zhang and Jin, 2021), which helps determine whether the evolution of ESs follows continuous patterns through via time series. It is in Hurst that we use the rescaled range analysis method (R/S) (Jiang et al., 2017) to uncover the evolutionary features. In this study, we investigated the spatiotemporal evolution of ESs by coupling Sen, MK and Hurst. The rationale is shown in Figure 3.
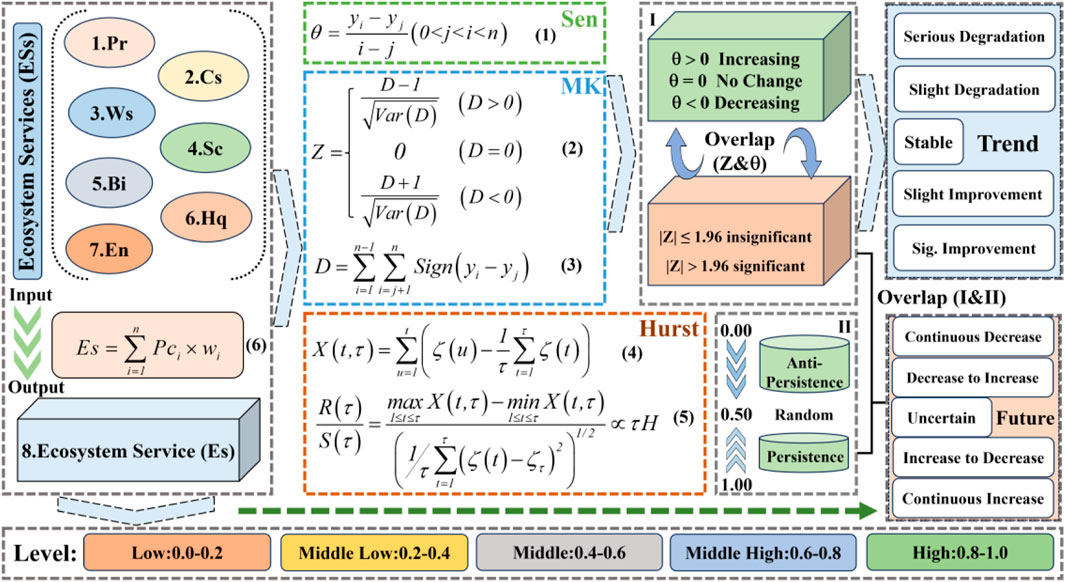
Figure 3. The principle and framework of spatiotemporal analysis model. There are seven types of ESs including Production (Pr), Carbon storage (Cs), Water supply (Ws), Soil conservation (Sc), Habitat quality (Hq), Biodiversity (Bi) and Entertainment (En). What is more, Es is a composite of ESs and reflects the comprehensive level of ESs.
Where yi and yj stand for the ESs of monitoring years i and j, respectively, and θ represents the trends in ESs. D and Z indicate the test statistics and the standard test statistics, respectively; n stands for the samples; it is yi−yj > 0 that Sign = 1, and vice versa, Sign = −1. In Hurst, X(t, τ) denotes the sequences of cumulative deviations; R(τ) and S(τ) stand for the range sequences and the standard deviation sequences, respectively; Hurst is between 0 and 1; and it is H > 0.5 that ESs have a positive continuous trend with a persistence feature and vice versa. Moreover, we use spatial principal component analysis (SPCA) to address multiple variables, replacing original variables with a composite variable (Feng L. et al., 2023; Junttila and Laine, 2017). SPCA eliminates the need for artificially determined weights and lowers the subjectivity the evaluation of ESs. In this study, Pci denotes the principal information sequences i; and wi indicates the weight of Pci. When the cumulative variance contribution is greater than 80%, it can represent most of the information.
Random forest (RF) is, based on statistical theory, a machine learning method (Breiman, 2001), which is by means of an average combination of multiple decision trees to obtain the final regression result (Marco et al., 2022). RF avoids overfitting with a good robustness. With the help of the mean decrease Gini (MDG), we can categorize the importance of indicators. Equation 1 is as follows:
where GIn is the reduction of node impurity by the factors n; Pnk denotes the percentage of features in nodes n; and K is the number of nodes. In addition, with the help of the partial dependence function for single-factor regression, we describe the effect of dominant factors by a partial dependence plot (PDP). Equation 2 is as follows:
where Xs represents the dominant influencing factor and Xc stands for all other influencing factors. Moreover, the partial function is estimated by calculating the mean value of the training set with the aid of the Monte Carlo method.
Multiscale geographically weighted regression (MGWR), with a better spatial smoothing, is an enhancement of GWR, which can generate self-adaptive bandwidths at different scales (Yu et al., 2020). In addition, the weight of MGWR is expressed by a distance function between the observation point and the regression point, which aims to evaluate the importance to which the observations have an influence on the parameter estimates (Duan et al., 2021). Equation 3 is as follows:
where yi and xij indicates the explained variable and explanatory variable, respectively; i stands for the sample size; j is on behalf of the independent variable size; (ui,vi) and εi represents the spatial location and the error term, respectively; and bwj represents the bandwidth. Moreover, we use the corrected akaike information criterion (AICc) to evaluation the superiority in models; a lower AICc indicates a better model fit (Sisman and Aydinoglu, 2022); and the same applies to the bayesian information criterion (BIC) does. In the end, the variance inflation factor (VIF) is used to check for multicollinearity, and VIF<7.5 indicates weak collinearity among the variables.
As shown in Figure 4, ESs are at the middle level (Mean = 0.538), with strong temporal features and significant interactions. Figure 4A shows that ESs exhibit a fluctuating growth trend (k = 0.017, R2 = 0.175) from 2000 to 2022, which can be broadly categorized into four periods (T1:2000–2005, T2:2005–2012, T3:2012–2016, T4:2016–2022). ESs are better coordinated in the early stages (T1, T2 and T3), undergoing an evolutionary process of decreasing, increasing, and then decreasing again. However, in the later stages (T4), they gradually tend to become disordered poor consistency. As depicted in Figures 4B, C, ESs, with the first principal component contributing 82.52%, show a strong connection (Correlation = 0.724 and R2 = 0.538) with each other. However, En has a low correlation with other ESs, contributing less than 6.82%. As a result, En plays a minimal role in the actual evaluation of ESs. In summary, ESs show slight improvement, but their internal functions are at risk of imbalance. There are both competitive and cooperative relationships within ecosystems. If the disturbances from social systems are not considered, the steady-state transition in ecosystems is generally relatively slow. However, CZC has an inherent advantage in resource enrichment, which leads to a rapid aggregation of populations. This phenomenon can intensify competition between the systems, thereby accelerating the steady-state transition. Therefore, this internal dysfunction could be the result of high-intensity human activities.
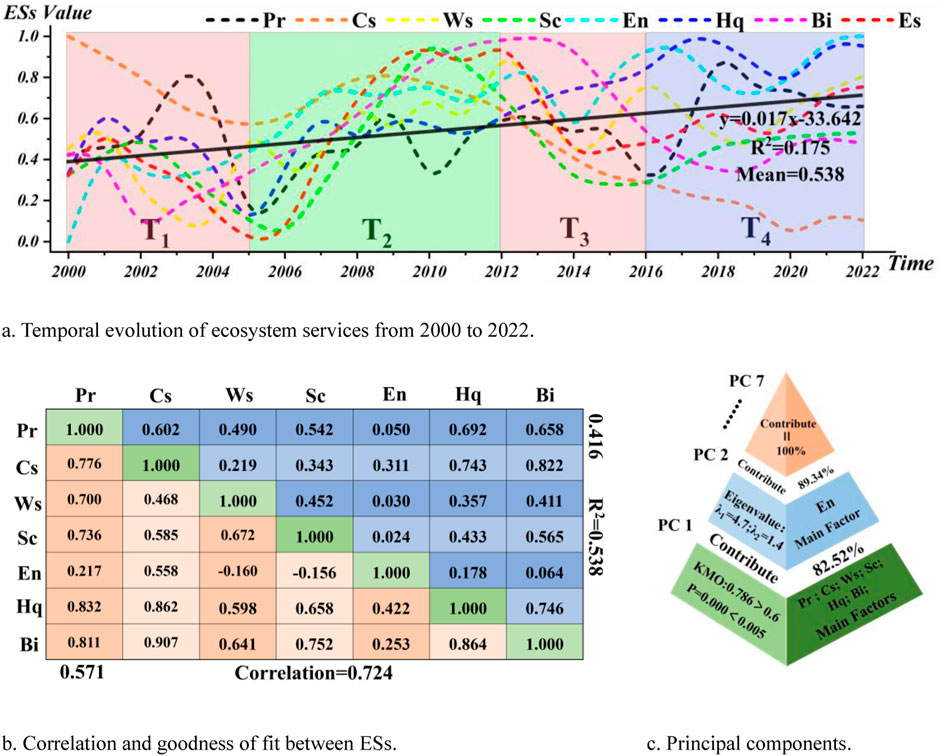
Figure 4. (A) Temporal evolution of ecosystem services from 2000 to 2022. (B) Correlation and goodness of fit between ESs. (C) Principal components. Temporal changes and interrelationships of ecosystem services. There are seven types of ESs including Production (Pr), Carbon storage (Cs), Water supply (Ws), Soil conservation (Sc), Habitat quality (Hq), Biodiversity (Bi) and Entertainment (En). What is more, Es is a composite of ESs and reflects the comprehensive level of ESs.
The spatial evolution of ESs in Figure 5 is analyzed in conjunction with Figure 1. As shown in Figure 5A, spatially, Es has a clear north‒south discrepancy, characterized by a low level in Region N (including Region N1, Region N2 and Region N3) and a high level in Region S (including Region S1 and Region S2). The low and middle-low levels of Es are primarily located in Region N, accounting for 36.5% of CZC; the high and middle-high levels of Es are mainly found in Region S, covering 42.3% of CZC; and the middle level of Es has a broken spatial distribution, occupying 21.2% of CZC. Firstly, Pr, Sc, Bi and Hq have a high similarity in their spatial distribution, with a significant north‒south difference. Specifically, the middle-low levels and below of Pr, Sc, Bi, and Hq (accounting for 40.9%, 54.9%, 35.2% and 59.2%, respectively) are positioned in Region N. Meanwhile, the middle levels and above of them (covering 59.1%, 45.1%, 64.8% and 40.8%, respectively) are found in Region S, exhibiting strong spatial heterogeneity, particularly in Region S2. The climate zone of CZC transitions from temperate to tropical from north to south, resulting in the formation of multiple ecosystems (e.g., grassland ecosystems, cropland ecosystems, and woodland ecosystems) from high latitudes to low latitudes. Consequently, this cross-scale climate could be the reason for their north-south differentiation. Secondly, except for Region N1, the spatial distributions of Cs and Ws are similar to those of Pr, Sc, Bi, and Hq. Specifically, Cs is lower in Region N2 and Region N3, but higher in other areas, while Ws (Mean = 0.771) is higher in all regions except for Region N1. On the one hand, the spatial distributions of ESs rely on large-scale natural conditions (such as topography and climate). On the one hand, their spatial distributions are also affected by local environments and human activities. Hence, it is thought that the spatial differences between them could result from a combination of microclimates and human activities. Finally, En is relatively high (Mean = 0.799), with its high level covering 67.6% of CZC, but it lacks a clear spatial aggregation feature. It is known that CZC has a high landscape aesthetic value, which leads to a higher level of En.
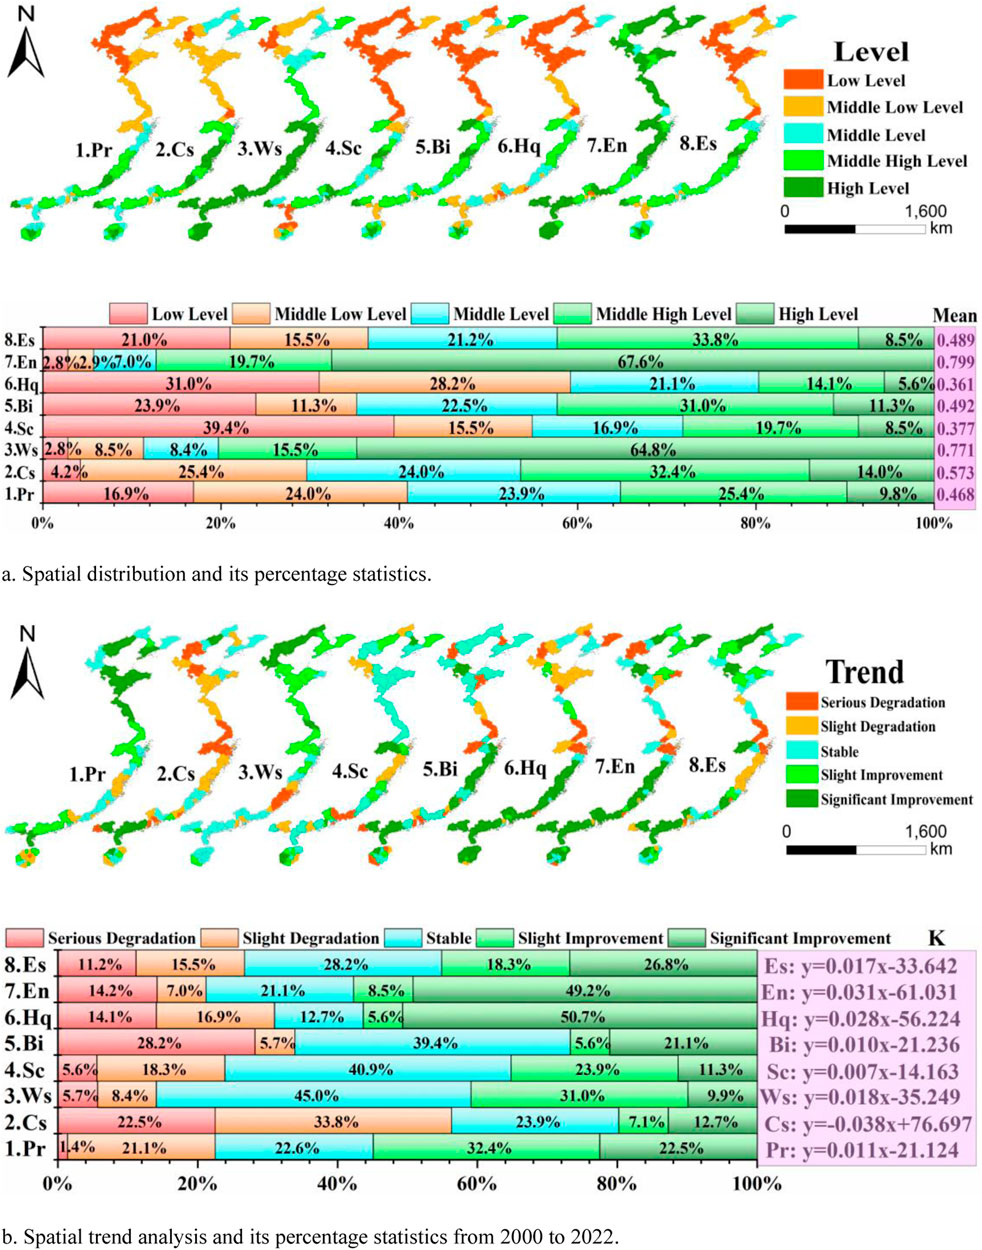
Figure 5. (A) Spatial distribution and its percentage statistics. (B) Spatial trend analysis and its percentage statistics from 2000 to 2022. Spatiotemporal variations of ecosystem services in the coastal zone of China (CZC) and their percentage statistics. Mean is the multiyear average of ESs; and K stands for the trend equations of ESs.
As shown in Figure 5B, Es shows a slight improvement (k = 0.017), accompanied by localized degradation (occupying 26.7%). Spatially, the changes in the bipolar regions (Region N1 and Region N2 and Region S2) of Es are relatively smooth, while those in the central regions (Region N3 and Region S1) are relatively drastic. Firstly, both Pr (k = 0.011) and Ws (k = 0.018) show improvement with a similar spatial distribution. The improvement areas are concentrated in Region N (accounting for 54.9% and 40.9%, respectively). However, in Region S, although the trends remain relatively stable, localized degradation occurs. Secondly, Bi (k = 0.010), Hq (k = 0.028) and En (k = 0.031) have an increasing trend with a significant north‒south divergence. The improvement areas are mainly localized in Region S (occupying 26.7%, 56.3% and 57.7%, respectively), exhibiting a consistent spatial distribution; in Region N, there is strong heterogeneity with a broken spatial distribution, and localized degradation areas are evident (accounting for 33.9%, 31% and 21.2%, respectively). Thirdly, Sc (k = 0.007) shows a relatively stable trend. Spatially, Region N of Sc is more stable than Region S. Eventually, Cs has a decreasing trend, with its degraded areas concentrated in the midland (including Region N2, Region N2 and Region S1). However, Cs maintains a steady trend in the bipolar regions. In summary, ESs have an increasing trend as a whole, with significant spatial zoning characteristics. On the one hand, the oceanic climate (hydrothermal condition) guarantees that CZC is characterized by a good natural attribute; in the face of external disturbances, ESs show a high resilience, which could be the main reason for the increase in ESs. On the other hand, CZC spans multiple climatic zones with different phenology features; these climatic zones divide CZC into several regions, forming multiple subsystems, and the interregional disparity becomes wider under both natural and social influences; therefore, this zoning phenomenon could be a result of the intensified spatial processes of ESs.
As shown in Figure 6, Es is expected to experience slight improvement in the future, with a distinct zoning pattern. Spatially, Es is at risk of degradation in localized areas (Region N1, Region N2 and Region S1), but has an improving phenomenon in Region S2 (occupying 42.3%). Firstly, Pr (mean = 0.431), Cs (mean = 0.608) and Ws (mean = 0.417) are at risk of degradation (accounting for 45.1%, 53.5% and 35.1%, respectively), especially in Region N, and they have a lower risk in Region S with strong heterogeneity. In Region N, the natural conditions are relatively poor, and the ecosystem is dominated by cropland ecosystems. Hence, the ecosystem shows a lower resilience to external disturbances, which could be the reason why they have a higher risk in Region N. However, in Region S, this circumstance is opposite. For localized areas with higher risk, this phenomenon could be the result of human activities. Secondly, Sc (mean = 0.512) and En (mean = 0.496), in Region S, have a relatively steady trend with lower risk. In Region N, the terrain is relatively flat, and the landscape is rather homogenous, which can provide certain prerequisites for Sc and En and make them change indistinctively in the short term. However, these prerequisites have an obvious gap in Region S. Hence, it is thought that these prerequisites could be reasons for the north-south risk divergence in Sc and En. Finally, Bi (Mean = 0.523) and Hq (Mean = 0.538) are expected to improve in the future (occupying 45.1% and 56.3%, respectively). Bi and Hq are susceptible to human activities and climatic conditions. With the implementation of ecological management projects in recent years, ecological conservation achievements in some areas have begun to bear fruit. However, localized areas still face some ecological risks due to the specificities of their urban development. Therefore, Bi and Hq with a lower risk could be the result of ecological preservation. Overall, the risk evaluation of ESs can provide some reference for stakeholders. It is by real-time monitoring that stakeholders have timely access to information, which plays a positive role in promoting the sustainable development of CZC.
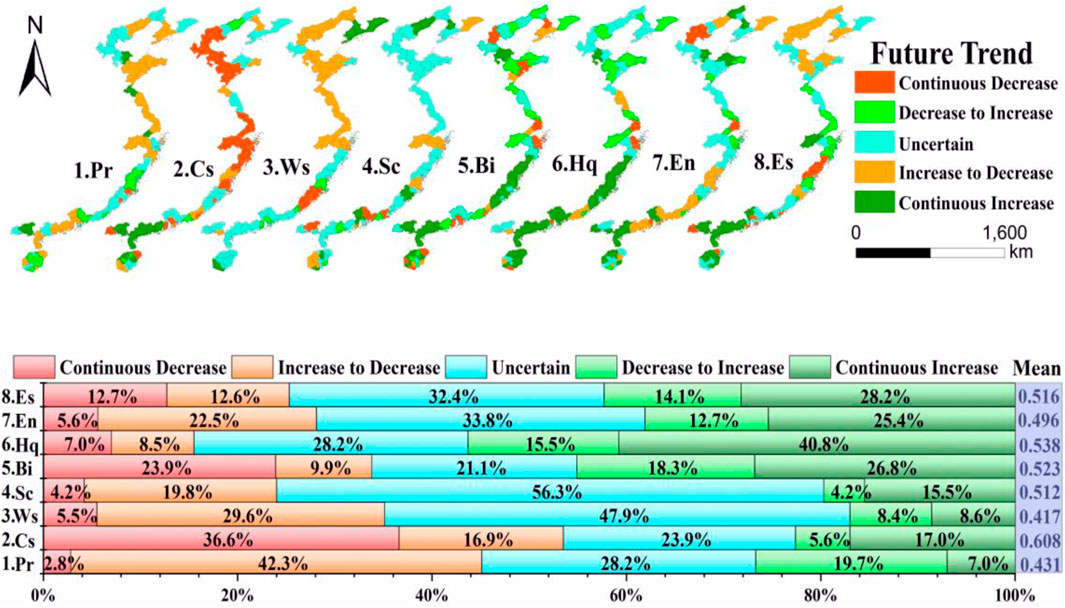
Figure 6. Spatial risk evaluation of ecosystem services in the coastal zone of China (CZC) and their percentage statistics. Mean represents the average values of Hurst in ESs.
As shown in Figure 7, the model explanation of Es is up to 0.621, and the influencing factors as a whole show a better explanatory capacity for ESs. Except for E, the explanatory values of the other ESs range from 0.421 to 0.731, indicating that ESs have a basic model explanation in both nature and society. Moreover, En demonstrates a lower explanatory capacity and contributes less. In conclusion, the ability of the model explanation generally meets the needs of this study, and Es can essentially substitute for ESs.

Figure 7. The model explanation for the dynamic mechanisms of ecosystem services.
As shown in Table 2, MGWR, with better spatial smoothing capability, slightly outperforms GWR. This study tests the colinear effect of factors by the variance inflation factor and acquires the main influencing factors (VIF<7.5) in ESs. In MGWR, both AICc and BIC are lower than in GWR, though the differences are not significant. In conclusion, MGWR makes use of fewer parameters to approach the true values with a better explanatory ability.
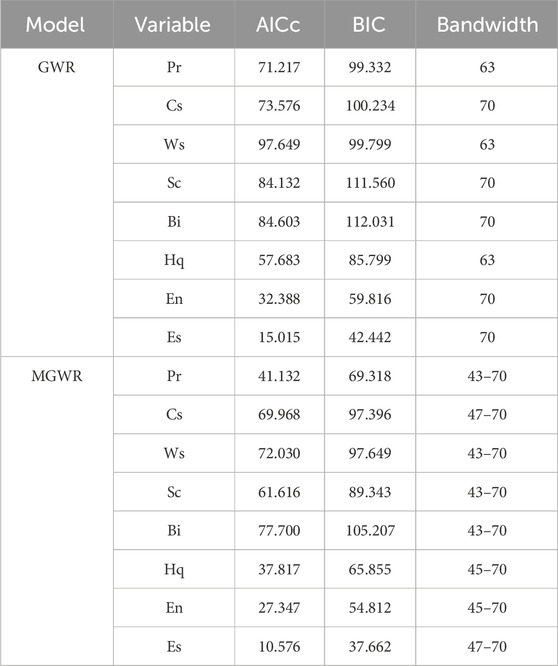
Table 2. Comparison of model superiority between MGWR and GWR.
As portrayed in Figure 8, terrain and soil have a stronger influence on ESs in terms of natural factors, while climate exerts a weaker influence. Sand (Mean = −0.143) and Tp (Mean = −0.024) have a negative impact on ESs, but Dem (Mean = 0.128), Slope (Mean = 0.135) and Tem (Mean = 0.097) show a positive impact on ESs. Dem (0.119–0.152) and slope (0.135–0.145) have a higher level in Region S (spatially occupying more than 41.4% and 36.3%, respectively) and have a lower level in Region N. However, Tem (0.010–0.156) has a lower level in Region S (accounting for 53.4%) and a higher level (0.156–0.218) in Region N. Adequate hydrothermal conditions are important for the improvement of ESs. Region N is characterized by inadequate hydrothermal conditions and lower ESs. Hence, ESs are spatially more susceptible to Tem in Region N. Complex terrain enhances the natural features of localized areas and somewhat limits high-intensity human activities, which is more conducive to the development of ESs in a favorable direction. Region S is characterized by better natural features and higher ESs. As a result, the terrain spatially shows a more positive influence on ESs in Region S. Sand (Mean = −0.143) has a negative effect on ESs, exhibiting a more significant influence (−0.150∼-0.141) in Region S (accounting for 60.4%) compared to Region N (−0.141∼-0.132, occupying 39.6%). CZC, with a high sand and gravel content, is adjacent to the sea and susceptible to the effects of soil erosion. As a result, ESs are more susceptible to the effects of Sand, especially in the geologically complex Region S. The effect of Tp on ESs shows a tendency toward 0, but it has a weak negative effect on Region S1. Frequent extreme weather is prone to impact the structure and function of ecology, which can put a damper on the improvement of ESs. Hence, spatially, Tp exerts a weak negative effect on ESs.
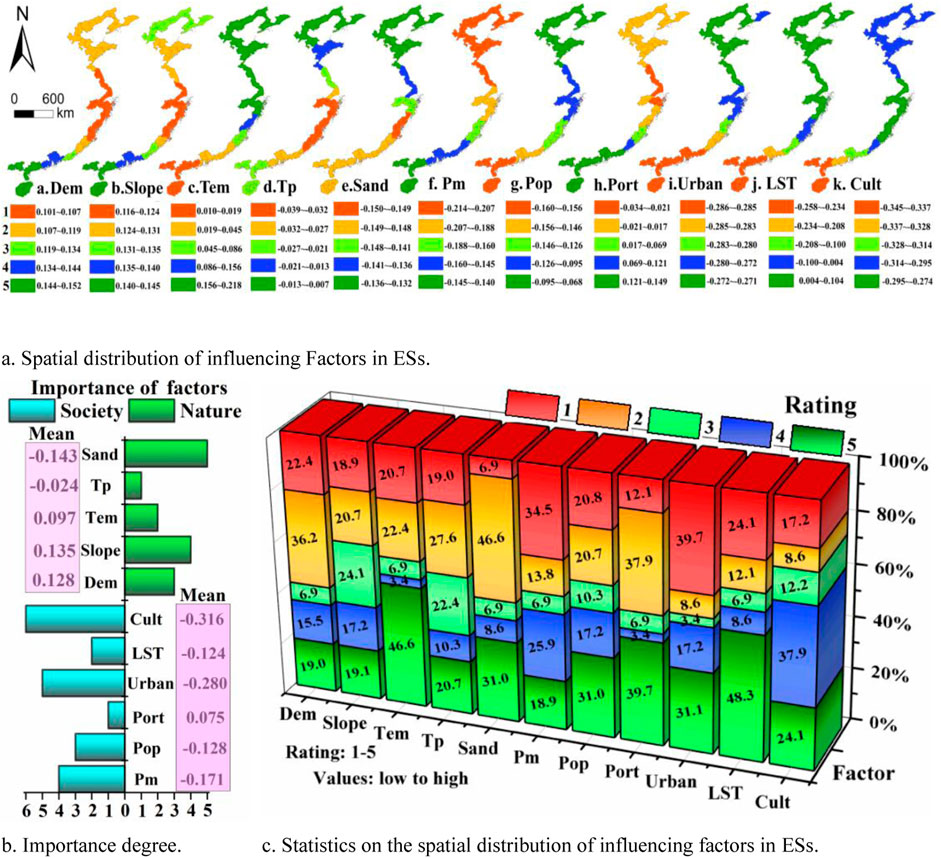
Figure 8. (A) Spatial distribution of influencing Factors in ESs. (B) Importance degree. (C) Statistics on the spatial distribution of influencing factors in ESs. Spatial distribution and statistics of influencing factors in ecosystem services. The spatial distribution of influencing factors is divided into five categories (corresponding to 1 to 5, respectively) from low value to high value; the higher the importance degree, the more important it is.
For social factors, Cult (Mean = −0.316) and Urban (Mean = −0.280) have the strongest impact on ESs, followed by Pop (Mean = −0.128) and Pm (Mean = −0.171), while LST (Mean = −0.124) and Port (Mean = 0.075) have the least impact. Social factors (excluding Port) have a negative effect on ESs. Cult and Urban show lower levels (−0.314∼-0.295 and −0.272∼--0.271) in Region N (accounting for approximately 37.9% and 31.1%, respectively), but higher levels (−0.345∼-0.314 and −0.286∼-0.280, respectively) in Region S (accounting for 38.0% and 51.7%, respectively). The agglomeration feature of Cult and Urban can reflect the stability of ecological structure. For a long time, Region N is dominated by the ecosystem of city and cropland with lower ESs, so it had a stable ecological structure. However, the opposite is true for Region S. Thus, ESs in Region S are more susceptible to perturbation. Pop and Pm exhibit opposite spatial distribution patterns. Pop has a higher level (−0.160∼-0.126) in Region S (occupying 51.8%) but a lower level (−0.126∼-0.068) in Region N (accounting for 48.2%), while the opposite is true for Pm (−0.214∼-0.188 and −0.188∼-0.140 accounting for 48.3% and 51.7%, respectively). Region N exhibits higher air pollution, and Region S has a higher population density. Therefore, spatially, ESs are vulnerable to Pm in Region N and to Pop in Region S. LST and Urban exhibit similar spatial distributions; however, LST has a slightly positive influence on ESs in Region N. Region N experiences poorer light and heat conditions compared to Region S, while LST creates favorable temperature conditions for crop growth to some extent. This could be the reason why LST has a positive effect in Region N. Moreover, Port is close to 0 and has a slight negative influence on ESs. Port can disturb the ecological environment, but due to their small size and low level, the disturbances are localized. As a result, spatially, the effect of Port on ESs is not significant.
In Figure 9, the natural factors overall have a positive influence on ESs, but the social factors generally have a negative influence on ESs. Dem, Slope and Tem have strong linear characteristics. Slope has the strongest positive impact on ESs, followed by DEM, with Tem exerting the weakest positive influence on ESs. In contrast, Tp and Sand have a strong nonlinear feature. The nonlinear characteristic of Tp gradually intensifies as the independent variable increases. When Tp is below 0.3, the nonlinear effect is not significant. However, as Tp exceeds 0.3, the nonlinear characteristic intensifies, suggesting that high-frequency typhoons have a complex impact on ESs. This effect is particularly strong at higher values of Tp. The nonlinear characteristic of Sand gradually diminishes with the growth of the independent variable. When Sand is below 0.5, its nonlinear features are prominent; however, when Sand exceeds 0.5, these features gradually fade. This phenomenon means that the impact of Sand on ESs is subject to uncertainty when Sand is lower, but sand has a significant negative impact on ESs when sand is higher. Therefore, Tp and Sand exhibit stronger spatial non-stationarity than other natural factors and possess a more complex relationship with ESs.
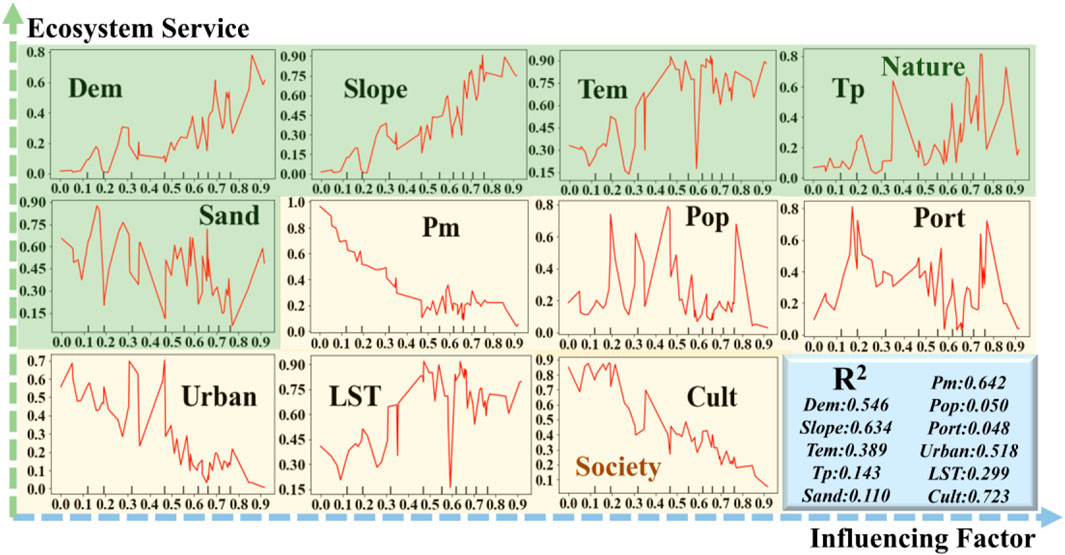
Figure 9. Partial dependence of influencing factors in ecosystem services. A higher R2 indicates a stronger linear characterization of influence factors and vice versa.
As far as social factors are concerned, Urban, Pm and Cult exhibit strong linear features and have a negative impact on ESs. Specifically, Cult has a stronger negative influence on ESs, while Urban and Pm have a weaker negative impact on ESs. In contrast, Pop, LST and Port have strong nonlinear characteristics, with Pop and Port showing more pronounced nonlinearity than LST. The nonlinear feature of Pop diminishes as the independent variable increases. When Pop is less than 0.5, its nonlinear characteristic is significant, but as Pop exceeds 0.5, this nonlinearity gradually diminishes. This suggests that lower Pop has a more uncertain impact on ESs, while higher Pop exert a clear inhibitory effect on ESs. The nonlinear feature of LST diminishes as the independent variable increases. LST positively promotes ESs when it is below 0.6 and negatively inhibits ESs when it exceeds 0.6, demonstrating that LST has a dual effect on ESs. Port has the strongest nonlinear property, with its trend showing significant segmentation. When Port ranges from 0.2 to 0.7, it exerts a significant negative influence on ESs; outside this range, it shows varying degrees of positive influence on ESs. Moreover, the relationship between Pop and ESs is relatively complex, and its non-stationarity is stronger than that of other social factors.
The spatial patterns of ESs in CZC are generally consistent with previous studies (Liu C. et al., 2023; Liu et al., 2021). In addition, over time, the synergy of ESs is gradually decreasing. This finding complements previous studies and collectively reveals the evolutionary features of ESs in CZC. The steady state of ESs in developed regions is more prone to imbalance. It is analyzed that this trade-off phenomenon results from the dual impact of human activities. On one hand, irrational resource utilization disrupts the original steady-state relationships of ESs, intensifying their internal competition (Burgos-Ayala et al., 2024; Hua et al., 2024). On the other hand, adaptive management alleviates internal contradictions of ESs, allowing some to develop in a predetermined direction (Lyu et al., 2024; Sattler et al., 2018).
The spatial processes of ESs are more strongly influenced by social factors than by natural factors. As for natural factors, terrain and climate have a significant impact on ESs, which is generally consistent with previous studies (Guo et al., 2022; Qu et al., 2024). In this study, terrain has a stronger influence on ESs than climate, which could be attributed to scale effects. At large scales, the spatial variations in marine climate are relatively small. Although there are significant climate differences in certain local areas, these differences have a weaker impact on ecosystems compared to terrain. In contrast, the terrain variations in CZC ate relatively larger, and therefore, its impact on ecosystems is more profound. In terms of social factors, human activities dominated by agriculture and urban development have a significant impact on ESs, which is consistent with previous studies (Canelas and Pereira, 2022; Zheng et al., 2022). In addition, this study supplements the complex mechanisms of ESs from a nonlinear perspective, finding that human activities do not exert a purely negative linear impact on ESs. Instead, they exhibit complex critical effects within certain ranges.
Adopting a zonal strategy can enhance overall governance efficiency. As shown in Figure 10, based on the results of the spatiotemporal patterns and dynamic mechanisms of ESs, the following recommendations are proposed: Region N should focus on the intensive use of agricultural and urban land. Specifically, Region N1 is located in the cold-temperate transition zone, with insufficient water and thermal conditions (Wang H. et al., 2022). Once its ecological structure is damaged, recovery is difficult. This region should focus on enhancing ecological resilience. On one hand, natural restoration and ecological rehabilitation should be implemented based on scientific monitoring and assessment. On the other hand, ecological protection red lines should be established to limit unreasonable human development activities. RegionN2 and Region N3 are rich in arable land resources, but they face different circumstances. Agricultural development largely depends on water and soil conditions. Region N3 has better water and soil conditions than Region N2, but it suffers from significant fragmentation of arable land (Ma et al., 2024). Region N2 should focus on the development of a resource governance system. On one hand, establish a water resource management system to improve agricultural infrastructure. On the other hand, strengthen soil protection and restoration, and implement conservation tillage. Region N3 should focus on the intensive land management, which can be achieved through multi-stakeholder decision-making to improve the ecological compensation mechanism, thereby reducing the encroachment on arable land resources.

Figure 10. Spatial governance and planning in the coastal zone of China (CZC).
Region S should focus on coordinating the relationship between ecology and urban areas to promote green development. Both Region S1 and Region S2 are primarily characterized by urban and forest ecosystems. Forest ecosystems play a crucial role in carbon storage, water conservation, and are highly valuable in maintaining biodiversity and habitat quality. Region S1 experiences high human activities and frequent typhoons, which have a certain impact on its ecosystem. It should not only focus on alleviating the conflict between urban development and ecological protection, but also accelerate the improvement of urban emergency management to enhance the social-ecological resilience. The spatial development in Region S2 is imbalanced, with certain areas experiencing high human activity intensity, leading to a mismatch in resource distribution. It should focus on balancing the spatial utilization structure of ecology, production, and living areas, while strengthening inter-departmental coordination and integrated management to promote the optimization of spatial layout.
This study could provide some reference for spatial governance in coastal zones, but it also has some limitations that can be further explored in future research. The specifics are as follows: (1) In addition to terrestrial ESs, the coastal zones also include some marine ESs. This study has not yet incorporated marine ESs. There are two main reasons. Firstly, the sea does not have clear zoning like cities. Although some coastal cities have their own marine planning areas, the criteria for their divisions vary to some extent (Ngoile et al., 1995; Theodora and Spanogianni, 2022), which creates some difficulties in defining the scope of marine ESs. Secondly, there is a systemic separation between land and sea, and a significant difference in magnitude between terrestrial and marine ESs (Lazzari et al., 2019; Sun et al., 2023; Zhang S. et al., 2023). In future work, we will attempt to utilize interdisciplinary knowledge to incorporate marine ESs into the comprehensive evaluation system of coastal zones. (2) In this study, ESs are considered as links between society and ecology. However, some perspectives suggest that ESs can not only function as links but also as nodes or attributes (Felipe-Lucia et al., 2022). Although these viewpoints are currently conceptual frameworks, we will make attempts to explore this area in future research. (3) This study has not considered the impact of cross-scale material transfer on ESs. The main reasons are as follows: firstly, data availability is limited, and secondly, the direction of material transport is difficult to determine. This is also one of the areas we will focus on in the future.
This study, based on the framework of social-ecological system, uses the coastal zone of China as a case study to investigate the spatiotemporal patterns and dynamic mechanisms of its ecosystem services (ESs). The results indicate that (1) ESs have improved to some extent; while although their synergistic effects are greater than the trade-offs, the overall synergy is gradually weakening. Spatially, the spatial distribution of ESs shows a significant north-south discrepancy, with lower levels in the north and higher levels in the south. The spatial processes in ESs in the central region are relatively drastic, with some degradation, while ESs in other regions remain relatively stable. ESs in the north are expected to remain relatively stable, while in the south, ESs are anticipated to improve to some extent, with local regions areas facing the risk of degradation. (2) ESs are more influenced by social factors than by natural factors. Terrain and soil have a greater influence on ESs, whereas climate has a lesser impact. Social factors exhibit stronger nonlinear mechanisms than natural factors. Human activities, dominated by agriculture and urban development, alter and shape the spatial processes of ESs. The surface thermal environment has a dual impact on ESs, and the negative linear impact of population density and air pollution on ESs is stronger than that of ports. (3) The governance of China’s coastal zone can adopt a zonal management strategy. In the north, land intensification should be promoted, with a focus on the management of arable land, to alleviate conflicts between agricultural and urban land use. In the south, forest protection should be strengthened to balance the relationship between forest and urban land use, with the aim of promoting coordinated development.
The datasets presented in this study can be found in online repositories. The names of the repository/repositories and accession number(s) can be found in the article/supplementary material.
MC: Conceptualization, Data curation, Formal Analysis, Funding acquisition, Investigation, Methodology, Project administration, Resources, Software, Supervision, Validation, Visualization, Writing–original draft, Writing–review and editing. ML: Data curation, Formal Analysis, Methodology, Resources, Software, Validation, Visualization, Writing–original draft, Writing–review and editing. PW: Funding acquisition, Project administration, Supervision, Writing–review and editing.
The author(s) declare that financial support was received for the research, authorship, and/or publication of this article. This research was funded by the National Natural Science Foundation of China-Macao Science and Technology Development Fund (NSFC-FDCT) Joint Project, No. 4211101006|0011/2021/AFJ, Southern Marine Science and Engineering Guangdong Laboratory (Zhuhai) 2020 Project, No. SML2020SP002. Also, this work was funded by the Team fund support of SML.
We would thank the editors and the reviewers for valuable feedback on this paper very much.
The authors declare that the research was conducted in the absence of any commercial or financial relationships that could be construed as a potential conflict of interest.
The author(s) declare that no Generative AI was used in the creation of this manuscript.
All claims expressed in this article are solely those of the authors and do not necessarily represent those of their affiliated organizations, or those of the publisher, the editors and the reviewers. Any product that may be evaluated in this article, or claim that may be made by its manufacturer, is not guaranteed or endorsed by the publisher.
Ai, M., Chen, X., and Yu, Q. (2024). Spatial correlation analysis between human disturbance intensity (HDI) and ecosystem services value (ESV) in the Chengdu-Chongqing urban agglomeration. Ecol. Indic. 158, 111555. doi:10.1016/j.ecolind.2024.111555
An, Q., Yuan, X., Zhang, X., Yang, Y., Chen, J., and An, J. (2024). Spatio-temporal interaction and constraint effects between ecosystem services and human activity intensity in Shaanxi Province,China. Ecol. Indic. 160, 111937. doi:10.1016/j.ecolind.2024.111937
Bax, V., van de Lageweg, W. I., Terpstra, T., Buijs, J.-M., de Reus, K., de Groot, F., et al. (2023). The impact of coastal realignment on the availability of ecosystem services: gains, losses and trade-offs from a local community perspective. J. Environ. Manag. 345, 118675. doi:10.1016/j.jenvman.2023.118675
Blythe, J., Armitage, D., Alonso, G., Campbell, D., Esteves Dias, A. C., Epstein, G., et al. (2020). Frontiers in coastal well-being and ecosystem services research: a systematic review. Ocean. Coast. Manag. 185, 105028. doi:10.1016/j.ocecoaman.2019.105028
Burgos-Ayala, A., Jiménez-Aceituno, A., Meacham, M., Rozas-Vasquez, D., García, M. M., Rocha, J., et al. (2024). Mapping ecosystem services in Colombia: analysis of synergies, trade-offs and bundles in environmental management. Ecosyst. Serv. 66, 101608. doi:10.1016/j.ecoser.2024.101608
Canelas, J. V., and Pereira, H. M. (2022). Impacts of land-use intensity on ecosystems stability. Ecol. Model. 472, 110093. doi:10.1016/j.ecolmodel.2022.110093
Cao, W., and Wong, M. H. (2007). Current status of coastal zone issues and management in China: a review. Environ. Int. 33, 985–992. doi:10.1016/j.envint.2007.04.009
Chan, K. M. A., Satterfield, T., and Goldstein, J. (2012). Rethinking ecosystem services to better address and navigate cultural values. Ecol. Econ. 74, 8–18. doi:10.1016/j.ecolecon.2011.11.011
Chen, B. M., Jing, X., Liu, S. S., Jiang, J., and Wang, Y. G. (2022a). Intermediate human activities maximize dryland ecosystem services in the long-term land-use change: evidence from the Sangong River watershed, northwest China. J. Environ. Manag. 319, 115708. doi:10.1016/j.jenvman.2022.115708
Chen, H. J., and Costanza, R. (2024). Valuation and management of desert ecosystems and their services. Ecosyst. Serv. 66, 101607. doi:10.1016/j.ecoser.2024.101607
Chen, Y., Zhai, Y., and Gao, J. (2022b). Spatial patterns in ecosystem services supply and demand in the Jing-Jin-Ji region, China. J. Clean. Prod. 361, 132177. doi:10.1016/j.jclepro.2022.132177
de Andrés, M., Barragán, J. M., and García Sanabria, J. (2017). Relationships between coastal urbanization and ecosystems in Spain. Cities 68, 8–17. doi:10.1016/j.cities.2017.05.004
DeLoyde, C. N. M., and Mabee, W. E. (2023). Ecosystem service values as an ecological indicator for land management decisions: a case study in southern Ontario, Canada. Ecol. Indic. 151, 110344. doi:10.1016/j.ecolind.2023.110344
Diaz, A., Morán-Ordoñez, A., Hodder, K., and Calvo, L. (2023). Editorial: conserving cultural ecosystems: the biodiversity and ecosystem service provision of semi-natural anthropogenic ecosystems versus natural ecosystems. Front. Ecol. Evol. 11, 1326480. doi:10.3389/fevo.2023.1326480
Du, P., Hou, X., and Xu, H. (2022). Dynamic expansion of urban land in China’s coastal zone since 2000. Remote Sens. 14, 916. doi:10.3390/rs14040916
Duan, J., Tian, G., Yang, L., and Zhou, T. (2021). Addressing the macroeconomic and hedonic determinants of housing prices in Beijing Metropolitan Area, China. Habitat Int. 113, 102374. doi:10.1016/j.habitatint.2021.102374
Eger, A. M., Marzinelli, E. M., Beas-Luna, R., Blain, C. O., Blamey, L. K., Byrnes, J. E. K., et al. (2023). The value of ecosystem services in global marine kelp forests. Nat. Commun. 14, 1894. doi:10.1038/s41467-023-37385-0
Fan, S., Yan, M., Yu, L., Chen, B., and Zhang, L. (2024). Integrating ecosystem service supply–demand and ecological risk assessment for urban planning: a case study in Beijing, China. Ecol. Indic. 161, 111950. doi:10.1016/j.ecolind.2024.111950
Felipe-Lucia, M. R., Guerrero, A. M., Alexander, S. M., Ashander, J., Baggio, J. A., Barnes, M. L., et al. (2022). Conceptualizing ecosystem services using social-ecological networks. Trends Ecol. Evol. 37, 211–222. doi:10.1016/j.tree.2021.11.012
Feng, D., Yang, C., Fu, M., Wang, J., Zhang, M., Sun, Y., et al. (2020). Do anthropogenic factors affect the improvement of vegetation cover in resource-based region? J. Clean. Prod. 271, 122705. doi:10.1016/j.jclepro.2020.122705
Feng, L., Hu, P., Chen, M.-m., and Li, B.-L. (2023a). Quantifying cumulative changes in water quality caused by small floodgates in Taihu Lake Basin — a case in Wuxi. Sci. Total. Environ. 900, 165608. doi:10.1016/j.scitotenv.2023.165608
Feng, X., Tian, J., Wang, Y., Wu, J., Liu, J., Ya, Q., et al. (2023b). Spatio-temporal variation and climatic driving factors of vegetation coverage in the yellow river basin from 2001 to 2020 based on kNDVI. Forests 14, 620. doi:10.3390/f14030620
Guo, S. S., Wu, C. Y., Wang, Y. H., Qiu, G. Q., Zhu, D., Niu, Q., et al. (2022). Threshold effect of ecosystem services in response to climate change, human activity and landscape pattern in the upper and middle Yellow River of China. Ecol. Indic. 136, 108603. doi:10.1016/j.ecolind.2022.108603
Hensel, D. R., and Frans, L. M. (2006). Regional Kendall test for trend. Environ. Sci. Technol. 40, 4066–4073. doi:10.1021/es051650b
Hua, Y. X., Yan, D., and Liu, X. J. (2024). Assessing synergies and trade-offs between ecosystem services in highly urbanized area under different scenarios of future land use change. Environ. Sustain. Indic. 22, 100350. doi:10.1016/j.indic.2024.100350
Huang, P., Zhao, X. Q., Pu, J. W., Gu, Z. X., Ran, Y. J., Xu, Y. F., et al. (2024). Defining the land use area threshold and optimizing its structure to improve supply-demand balance state of ecosystem services. J. Geogr. Sci. 34, 891–920. doi:10.1007/s11442-024-2232-0
Jiang, L., Bao, A., Guo, H., and Ndayisaba, F. (2017). Vegetation dynamics and responses to climate change and human activities in Central Asia. Sci. Total. Environ. 599-600, 967–980. doi:10.1016/j.scitotenv.2017.05.012
Jiang, X., and Dong, C. (2024). Fine evaluation of ecological service functions in alpine and deep valley regions: a case study of the southeast Tibetan Plateau. Ecol. Indic. 163, 112047. doi:10.1016/j.ecolind.2024.112047
Jin, X., Luan, W., Yang, J., Yue, W., Wan, S., Yang, D., et al. (2023). From the coast to the interior: global economic evolution patterns and mechanisms. Humanit. Soc. Sci. Commun. 10, 723. doi:10.1057/s41599-023-02234-4
Junttila, V., and Laine, M. (2017). Bayesian principal component regression model with spatial effects for forest inventory variables under small field sample size. Remote. Sens. Environ. 192, 45–57. doi:10.1016/j.rse.2017.01.035
Kabaya, K., Hashimoto, S., Fukuyo, N., Uetake, T., and Takeuchi, K. (2019). Investigating future ecosystem services through participatory scenario building and spatial ecological-economic modelling. Sustain. Sci. 14, 77–88. doi:10.1007/s11625-018-0590-1
Kpienbaareh, D., Kerr, R. B., Nyantakyi-Frimpong, H., Iverson, A., Luginaah, I., Lupafya, E., et al. (2024). Ecosystem service demand and supply dynamics under different farming systems: a participatory GIS assessment in Malawi. Appl. Geogr. 171, 103372. doi:10.1016/j.apgeog.2024.103372
Lau, J. D., Hicks, C. C., Gurney, G. G., and Cinner, J. E. (2019). What matters to whom and why? Understanding the importance of coastal ecosystem services in developing coastal communities. Ecosyst. Serv. 35, 219–230. doi:10.1016/j.ecoser.2018.12.012
Lau, W. W. Y. (2013). Beyond carbon: conceptualizing payments for ecosystem services in blue forests on carbon and other marine and coastal ecosystem services. Ocean. Coast. Manag. 83, 5–14. doi:10.1016/j.ocecoaman.2012.03.011
Lazzari, N., Becerro, M. A., Sanabria-Fernandez, J. A., and Martín-López, B. (2019). Spatial characterization of coastal marine social-ecological systems: insights for integrated management. Environ. Sci. Policy 92, 56–65. doi:10.1016/j.envsci.2018.11.003
Le Provost, G., Schenk, N. V., Penone, C., Thiele, J., Westphal, C., Allan, E., et al. (2023). The supply of multiple ecosystem services requires biodiversity across spatial scales. Nat. Ecol. Evol. 7, 236–249. doi:10.1038/s41559-022-01918-5
Li, D., Cao, W., Dou, Y., Wu, S., Liu, J., and Li, S. (2022a). Non-linear effects of natural and anthropogenic drivers on ecosystem services: integrating thresholds into conservation planning. J. Environ. Manag. 321, 116047. doi:10.1016/j.jenvman.2022.116047
Li, G., Fang, C., and Wang, S. (2016). Exploring spatiotemporal changes in ecosystem-service values and hotspots in China. Sci. Total. Environ. 545-546, 609–620. doi:10.1016/j.scitotenv.2015.12.067
Li, J., Dong, S., Li, Y., Wang, Y., and Li, Z. (2023a). Terrestrial transect study on pattern and driving mechanism of ecosystem services in the China–Mongolia–Russia Economic Corridor. Sci. Total. Environ. 884, 163880. doi:10.1016/j.scitotenv.2023.163880
Li, S., Yu, D., and Li, X. (2023b). Exploring the impacts of ecosystem services on human well-being in Qinghai Province under the framework of the sustainable development goals. J. Environ. Manag. 345, 118880. doi:10.1016/j.jenvman.2023.118880
Li, S., Zhao, Y., Xiao, W., Yellishetty, M., and Yang, D. (2022b). Identifying ecosystem service bundles and the spatiotemporal characteristics of trade-offs and synergies in coal mining areas with a high groundwater table. Sci. Total. Environ. 807, 151036. doi:10.1016/j.scitotenv.2021.151036
Liu, C., Liu, D. H., Li, P., Li, X. X., Liu, Z. H., and Zhao, Y. N. (2023a). Assessment of occupation of natural habitat by urban expansion and its impact on crucial ecosystem services in China's coastal zone. Ecol. Indic. 154, 110682. doi:10.1016/j.ecolind.2023.110682
Liu, C., Yang, M. H., Hou, Y. T., and Xue, X. Z. (2021). Ecosystem service multifunctionality assessment and coupling coordination analysis with land use and land cover change in China's coastal zones. Sci. Total. Environ. 797, 149033. doi:10.1016/j.scitotenv.2021.149033
Liu, J. G., Dietz, T., Carpenter, S. R., Alberti, M., Folke, C., Moran, E., et al. (2007). Complexity of coupled human and natural systems. Science 317, 1513–1516. doi:10.1126/science.1144004
Liu, Y., Li, J., Sun, C., Wang, X., Tian, P., Chen, L., et al. (2023b). Thirty-year changes of the coastlines, wetlands, and ecosystem services in the Asia major deltas. J. Environ. Manag. 326, 116675. doi:10.1016/j.jenvman.2022.116675
Liu, Z. T., Wang, S. J., and Fang, C. L. (2023c). Spatiotemporal evolution and influencing mechanism of ecosystem service value in the Guangdong-Hong Kong-Macao Greater Bay Area. J. Geogr. Sci. 33, 1226–1244. doi:10.1007/s11442-023-2127-5
Lyu, F. N., Tang, J. Q., Olhnuud, A., Hao, F., and Gong, C. (2024). The impact of large-scale ecological restoration projects on trade-offs/synergies and clusters of ecosystem services. J. Environ. Manag. 365, 121591. doi:10.1016/j.jenvman.2024.121591
Ma, S., Deng, G. Y., Wang, L. J., Hu, H. B., Fang, X. H., and Jiang, J. (2024). Telecoupling between urban expansion and forest ecosystem service loss through cultivated land displacement: a case study of Zhejiang Province, China. J. Environ. Manag. 357, 120695. doi:10.1016/j.jenvman.2024.120695
Marco, Z., Elena, A., Anna, S., Silvia, T., and Andrea, C. (2022). Spatio-temporal cross-validation to predict pluvial flood events in the Metropolitan City of Venice. J. Hydrol. 612, 128150. doi:10.1016/j.jhydrol.2022.128150
Martín-López, B., Palomo, I., García-Llorente, M., Iniesta-Arandia, I., Castro, A. J., García Del Amo, D., et al. (2017). Delineating boundaries of social-ecological systems for landscape planning: a comprehensive spatial approach. Land Use Policy 66, 90–104. doi:10.1016/j.landusepol.2017.04.040
Ngoile, M. N., Linden, O., and Coughanowr, C. A. (1995). Coastal zone management in Eastern Africa including the island states: a review of issues and initiatives. Ambio 24, 448–457. doi:10.1016/S0964-5691(98)80009-4
Niu, L. N., Shao, Q. Q., Ning, J., and Huang, H. B. (2022). Ecological changes and the tradeoff and synergy of ecosystem services in western China. J. Geogr. Sci. 32, 1059–1075. doi:10.1007/s11442-022-1985-6
Obeng, E. A., and Aguilar, F. X. (2018). Value orientation and payment for ecosystem services: perceived detrimental consequences lead to willingness-to-pay for ecosystem services. J. Environ. Manag. 206, 458–471. doi:10.1016/j.jenvman.2017.10.059
Palm, C., Blanco-Canqui, H., DeClerck, F., Gatere, L., and Grace, P. (2014). Conservation agriculture and ecosystem services: an overview. Agric. Ecosyst. Environ. 187, 87–105. doi:10.1016/j.agee.2013.10.010
Pham, K. T., and Lin, T. H. (2023). Effects of urbanisation on ecosystem service values: a case study of Nha Trang, Vietnam. Land Use Policy 128, 106599. doi:10.1016/j.landusepol.2023.106599
Plieninger, T., Dijks, S., Oteros-Rozas, E., and Bieling, C. (2013). Assessing, mapping, and quantifying cultural ecosystem services at community level. Land Use Policy 33, 118–129. doi:10.1016/j.landusepol.2012.12.013
Qu, S. D., Jiang, Y., Gao, J. B., Cao, Q., Wang, L. C., Zhang, Y. B., et al. (2024). Spatial-temporal evolution and driving factors of ecosystem services trade-offs and synergies in karst areas from a geospatial perspective. Land Degrad. Dev. 35, 3448–3460. doi:10.1002/ldr.5145
Raudsepp-Hearne, C., Peterson, G. D., and Bennett, E. M. (2010). Ecosystem service bundles for analyzing tradeoffs in diverse landscapes. Proc. Natl. Acad. Sci. U.S.A. 107, 5242–5247. doi:10.1073/pnas.0907284107
Ren, Y., Zhang, L., Wei, X., Song, Y., Wu, S., Wang, H., et al. (2024). Evaluating and simulating the impact of afforestation policy on land use and ecosystem services trade-offs in Linyi, China. Ecol. Indic. 160, 111898. doi:10.1016/j.ecolind.2024.111898
Sattler, C., Loft, L., Mann, C., and Meyer, C. (2018). Methods in ecosystem services governance analysis: an introduction. Ecosyst. Serv. 34, 155–168. doi:10.1016/j.ecoser.2018.11.007
Schirpke, U., Tasser, E., Borsky, S., Braun, M., Eitzinger, J., Gaube, V., et al. (2023). Past and future impacts of land-use changes on ecosystem services in Austria. J. Environ. Manag. 345, 118728. doi:10.1016/j.jenvman.2023.118728
Scholte, S. S. K., van Teeffelen, A. J. A., and Verburg, P. H. (2015). Integrating socio-cultural perspectives into ecosystem service valuation: a review of concepts and methods. Ecol. Econ. 114, 67–78. doi:10.1016/j.ecolecon.2015.03.007
Schröter, M., Remme, R. P., Sumarga, E., Barton, D. N., and Hein, L. (2015). Lessons learned for spatial modelling of ecosystem services in support of ecosystem accounting. Ecosyst. Serv. 13, 64–69. doi:10.1016/j.ecoser.2014.07.003
Sisman, S., and Aydinoglu, A. C. (2022). A modelling approach with geographically weighted regression methods for determining geographic variation and influencing factors in housing price: a case in Istanbul. Land Use Policy 119, 106183. doi:10.1016/j.landusepol.2022.106183
Sun, K., Deng, W., Jia, J., and Gao, Y. (2023). Spatiotemporal patterns and drivers of phytoplankton primary productivity in China's lakes and reservoirs at a national scale. Glob. Planet Change 228, 104215. doi:10.1016/j.gloplacha.2023.104215
Sun, R., Li, F., and Chen, L. (2019). A demand index for recreational ecosystem services associated with urban parks in Beijing, China. J. Environ. Manag. 251, 109612. doi:10.1016/j.jenvman.2019.109612
Sun, X., Li, Y., Zhu, X., Cao, K., and Feng, L. (2017). Integrative assessment and management implications on ecosystem services loss of coastal wetlands due to reclamation. J. Clean. Prod. 163, S101–S112. doi:10.1016/j.jclepro.2015.10.048
Theodora, Y., and Spanogianni, E. (2022). Assessing coastal urban sprawl in the Athens’ southern waterfront for reaching sustainability and resilience objectives. Ocean. Coast. Manag. 222, 106090. doi:10.1016/j.ocecoaman.2022.106090
Tu, D., Cai, Y., and Liu, M. (2023). Coupling coordination analysis and spatiotemporal heterogeneity between ecosystem services and new-type urbanization: a case study of the Yangtze River Economic Belt in China. Ecol. Indic. 154, 110535. doi:10.1016/j.ecolind.2023.110535
Vihervaara, P., Rönkä, M., and Walls, M. (2010). Trends in ecosystem service research: early steps and current drivers. Ambio 39, 314–324. doi:10.1007/s13280-010-0048-x
Wang, F., Li, X., Tang, X., Sun, X., Zhang, J., Yang, D., et al. (2023). The seas around China in a warming climate. Nat. Rev. Earth Environ. 4, 535–551. doi:10.1038/s43017-023-00453-6
Wang, H., Wang, W. J., Liu, Z., Wang, L., Zhang, W., Zou, Y., et al. (2022a). Combined effects of multi-land use decisions and climate change on water-related ecosystem services in Northeast China. J. Environ. Manag. 315, 115131. doi:10.1016/j.jenvman.2022.115131
Wang, X., Peng, J., Luo, Y., Qiu, S., Dong, J., Zhang, Z., et al. (2022b). Exploring social-ecological impacts on trade-offs and synergies among ecosystem services. Ecol. Econ. 197, 107438. doi:10.1016/j.ecolecon.2022.107438
Wu, X. T., Wei, Y. P., Fu, B. J., Wang, S., Zhao, Y., and Moran, E. F. (2020). Evolution and effects of the social-ecological system over a millennium in China's Loess Plateau. Sci. Adv. 6, eabc0276. doi:10.1126/sciadv.abc0276
Xia, H., Yuan, S., and Prishchepov, A. V. (2023). Spatial-temporal heterogeneity of ecosystem service interactions and their social-ecological drivers: implications for spatial planning and management. Resour. Conserv. Recycl. 189, 106767. doi:10.1016/j.resconrec.2022.106767
Xie, G., Zhang, C., Zhen, L., and Zhang, L. (2017). Dynamic changes in the value of China’s ecosystem services. Ecosyst. Serv. 26, 146–154. doi:10.1016/j.ecoser.2017.06.010
Yu, H. C., Fotheringham, A. S., Li, Z. Q., Oshan, T., Kang, W., and Wolf, L. J. (2020). Inference in multiscale geographically weighted regression. Geogr. Anal. 52, 87–106. doi:10.1111/gean.12189
Zhang, B., Li, W., and Xie, G. (2010). Ecosystem services research in China: progress and perspective. Ecol. Econ. 69, 1389–1395. doi:10.1016/j.ecolecon.2010.03.009
Zhang, L., Li, G., Ding, D., Qiao, L., Wang, J., Li, M., et al. (2023a). Coastline eco-efficiency and sustainable development of Bohai Rim cities. Ocean. Coast. Manag. 243, 106769. doi:10.1016/j.ocecoaman.2023.106769
Zhang, S., Hao, X. M., Zhao, Z. Y., Zhang, J. J., Fan, X., and Li, X. W. (2023b). Natural vegetation succession under climate change and the combined effects on net primary productivity. Earth's Future 11. doi:10.1029/2023ef003903
Zhang, X., and Jin, X. (2021). Vegetation dynamics and responses to climate change and anthropogenic activities in the Three-River Headwaters Region, China. Ecol. Indic. 131, 108223. doi:10.1016/j.ecolind.2021.108223
Keywords: social-ecological system, spatiotemporal evolution, ecosystem services, spatial heterogeneity, coastal zone
Citation: Chen M, Li M and Wang P (2025) Spatiotemporal patterns and dynamic mechanisms of ecosystem services in the coastal zone of China. Front. Environ. Sci. 13:1506136. doi: 10.3389/fenvs.2025.1506136
Received: 07 October 2024; Accepted: 27 January 2025;
Published: 19 February 2025.
Edited by:
Pedzisai Kowe, Midlands State University, ZimbabweReviewed by:
Chante Jian Ding, University of Malaya, MalaysiaCopyright © 2025 Chen, Li and Wang. This is an open-access article distributed under the terms of the Creative Commons Attribution License (CC BY). The use, distribution or reproduction in other forums is permitted, provided the original author(s) and the copyright owner(s) are credited and that the original publication in this journal is cited, in accordance with accepted academic practice. No use, distribution or reproduction is permitted which does not comply with these terms.
*Correspondence: Mingbao Chen, bWJjaGVuMjAxNkBob3RtYWlsLmNvbQ==
Disclaimer: All claims expressed in this article are solely those of the authors and do not necessarily represent those of their affiliated organizations, or those of the publisher, the editors and the reviewers. Any product that may be evaluated in this article or claim that may be made by its manufacturer is not guaranteed or endorsed by the publisher.
Research integrity at Frontiers
Learn more about the work of our research integrity team to safeguard the quality of each article we publish.