 Lingxia Feng1,2
 Junjie Jiang
- 1College of Mathematics and Computer Science, Zhejiang A&F University, Hangzhou, Zhejiang, China
- 2Zhejiang Provincial Key Laboratory of Forestry Intelligent Monitoring and Information Technology Research, Zhejiang A&F University, Hangzhou, Zhejiang, China
- 3College of Chemistry and Materials Engineering, Zhejiang A&F University, Hangzhou, Zhejiang, China
Introduction: Soil gas permeability is critical to the study of soil pore structure, soil gas transport, and crop growth.
Methods: In this paper, a pressure decay method is proposed to calculate soil gas permeability based on the law of conservation of mass, which is measured and compared with the steady-state method in a variety of soils, including compacted soils and soils with different moisture contents. The applicability of the two methods and the effects of compaction and water content on soil gas permeability were explored.
Results: The experimental results show that in low-permeability soils, there is a bias in the measured values of the steady-state method. In contrast, the results calculated based on the pressure decay method are more accurate. Increasing the water content of the soil or compacting the soil results in a 20%–88% or 63%–93% decrease in soil gas permeability, respectively, with the degree of decrease correlating with the viscosity of the medium.
Discussion: The findings show that calculating soil gas permeability based on the pressure decay method helps compensate for the inaccuracy of the steady-state method in measuring results in low-permeability soils. This leads to a better evaluation of soil aeration conditions, which, in turn, serves environmental, agricultural, and ecological research.
1 Introduction
Soil gas permeability is an important parameter for studying the transport of soil gas. It can be used to quantify the number of connected pores, characterize the pore structure of soils (Liu et al., 2020), and to assess the spatial variability of soil permeability (Huang et al., 2016; Schjønning and Koppelgaard, 2017). Soil gas permeability has been widely used in geotechnical and petroleum engineering, and is also an important parameter in environmental and agricultural research. For example, the accurate measurement of permeability is a prerequisite for the application of soil vapor extraction for the remediation of contaminated soils (Poulsen and Moldrup, 2007). Measurement accuracy is also an important indicator for evaluating soil aeration conditions and crop production, and a necessary prerequisite for understanding and quantifying liquid- and gas phase transport processes in the permeable zone. Soil gas phase is the primary source of plant oxygen and the soil liquid phase (or soil solution) provides plant water and nutrients. Accordingly, soil gas permeability is a key component in controlling the soil-plant-atmosphere continuum by affecting soil gas storage and transport of atmospheric oxygen to the respiratory plant root system (Chamindu et al., 2015). In soils that are less permeable to gases, plant oxygen, water, and nutrient requirements are not always adequately transmitted. If any of these requirements reach limiting conditions, there can be significant impacts on plant life and crop productivity (Chamindu et al., 2012; Feng et al., 2024a; Jiang et al., 2024). Effective gas exchange between the plant root zone and the atmosphere is required to ensure adequate replenishment of depleted O2 and rapid removal of excess CO2 from the plant inter-root zone, which is essential for sustaining the activities of the plant root and soil microbial ecosystems. In the absence of gas- and liquid-induced movement, gas and nutrient exchange between the plant root system and surrounding environment may be limited. In addition, soil respiration rates are affected by soil gas permeability, which consists mainly of O2 uptake by plant roots and microorganisms and varies from a few g m−2 per day to tens of g m−2 per day over large areas of soil, depending on the permeability of the soil gases, including fallow, pasture, forests, un-irrigated and irrigated, cropland, and orchards (Ben-Noah and Friedman, 2018; Feng et al., 2024b). Therefore, the magnitude of the soil gas permeability is very important for plant and crop growth. The accurate measurement of soil gas permeability is a key technique for evaluating soil aeration conditions and crop production. In addition, soil gas permeability has important applications in environmental radon studies, especially in soil gas radon measurements, which are critical for assessing radon gas migration and distribution (Lara et al., 2015; Ryzhakova et al., 2024).
However, soil gas permeability can be affected by many factors that include sampling or test scale, pore type, size and distribution, associated pore pressures, and even temperature. These factors can make the accurate measurement of permeability challenging. Currently, media permeability measurement methods comprise steady state and unsteady state methods (Jannot and Lasseux, 2012; Sander et al., 2017; Stoltz et al., 2010) The steady state method is usually calculated using Darcy’s law, which directly measures the gas flow rates at the inlet and outlet during a continuous gas supply using a flowmeter. The method usually introduces a Reynolds number to differentiate between laminar and turbulent flow, which determines whether the laminar flow assumption is satisfied for constant-flow tests (Booker et al., 1994; Bouazza and Vangpaisal, 2003). This is because, in porous media, Darcy’s law applies to fluids with laminar motion at low Reynolds numbers (Peng et al., 2016). However, there are several problems associated with the steady state method. First, the experimental measurement time is long for low-permeability media (Liu et al., 2015; Yang et al., 2019). Accordingly, it is currently mostly used in media with high permeability, such as sand with large particle size and glass beads (Hamamoto et al., 2009; Matsumoto et al., 2021; Pourbakhtiar et al., 2017). Second, it is difficult to develop flow sensors with very high accuracy, resulting in poor measurement accuracy (Malkovsky et al., 2009; Sander et al., 2017; Yang et al., 2019). The unsteady state method, which typically involves placing a sample in a test device and injecting fluid at both the upstream and downstream ends to achieve the desired equilibrium pressure, measures the change in average pore pressure over time and is commonly used to determine low-permeability media in highly inhomogeneous, microporous, and unconventional reservoir rocks (Chalmers et al., 2012; Li et al., 2004; Ma, 2015; Sander et al., 2017; Zhai and Rahardjo, 2013). The Literature provides an overview of the intervals over which shale permeability can be measured using two experimental methods. Calculations are performed using the steady state method for soil gas permeability >1 millidarcy (mD), and the unsteady state method is typically used for media with <1 mD (Sander et al., 2017; Zhai et al., 2021). For shallow soils in the field, most simple and easy-to-use steady state methods are currently used (Matsumoto et al., 2021; Pourbakhtiar et al., 2017; Zhai et al., 2019). However, shallow soil geometry, volumetric water content, and tillage practices alter soil gas permeability. Ball and Robertson (1994) demonstrated that reducing the air content from 40% to 10% by compressing the medium reduced permeability by three orders of magnitude. Nakajima et al. (2016) found that the permeability of soil decreased sharply with increasing volumetric water content. Changes in these physical parameters of the soil will likely lead to bias in steady state method measurements. Yang et al. (2019) suggested using the unsteady state methods instead of the steady state method to measure the permeability of low-permeability soils.
This paper describes the design of a measurement method based on the law of conservation of mass that is compatible with low-permeability soils—the pressure decay method (unsteady state methods). The traditional steady state method is also introduced, and the measurement results of the pressure decay method are compared with those of the steady state method to investigate the advantages of the pressure decay method. Measurements were made using steady state and pressure decay methods in soils with different volumetric moisture contents and compaction.
2 Materials and methods
2.1 Material characteristics
This study was performed from April to July 2023 in the laboratory of Zhejiang Agriculture and Forestry University at a constant room temperature of 25°C ± 1°C. The gas permeabilities of six different media were calculated and analysed using the steady state and pressure decay methods. The six experimental media (Figure 1) were obtained from Hangzhou, Zhejiang Province, China. Their basic physical parameters are listed in Table 1. The effective porosity of the dry medium was equal to the total porosity.
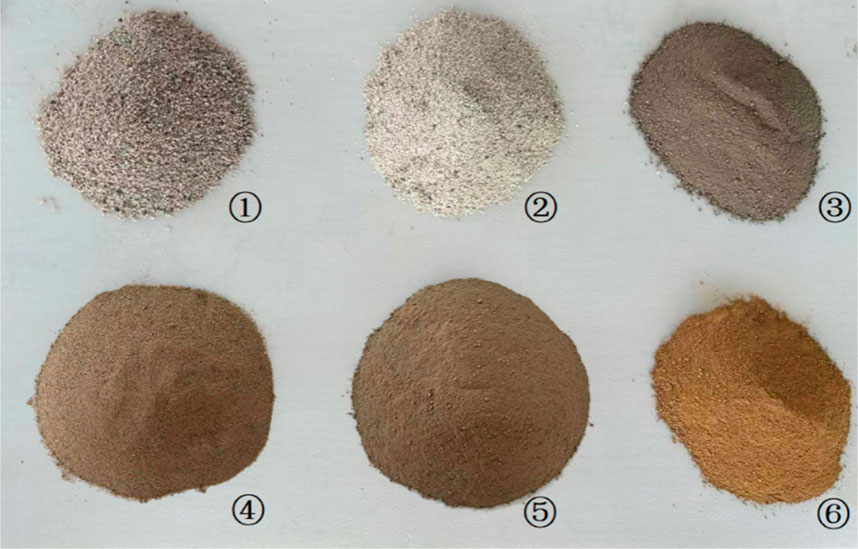
Figure 1. Six particle sizes used as porous media within the soil column chamber. 1-6 represent Coarse quartz sand, fine quartz sand, sandy loam, fine sand, loam, and clay, respectively.
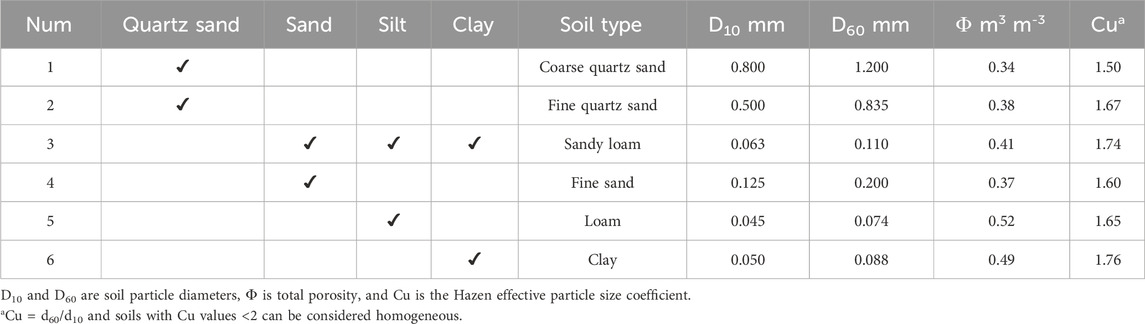
Table 1. Composition and physical properties of soil media used in this study.
2.2 Experimental setup and operation methods
The experimental apparatus used by Pourbakhtiar et al. (2017) and Maier et al. (2012) was improved, as shown in Figure 2. The device consisted of a 65 cm high stainless-steel cylinder with an inner diameter of 20 cm, with the gas chamber portion of the device at a height of 15 cm on the lower bottom surface and the soil column chamber at a height of 50 cm above the gas chamber. The upper and lower portions were separated by a perforated metal plate. Soil column chambers were used to hold samples of porous media at the desired depth, with the top open to the outside air. Soil temperature and humidity sensors (CSF 15, Beijing Star Sensor Technology Co., Ltd.) with humidity and temperature accuracy of 3% and 0.1°C, respectively, were installed at depths of 10 and 20 cm in the soil column to measure the moisture and temperature changes in the soil. The bottom gas chamber was fitted with an air conduit port at a height of 14 cm to connect to the high-pressure port of the differential pressure sensor (C268, Setra Systems, Inc.), with an accuracy of ±0.25%. The low-pressure port was connected to the air-conducting tube port on the surface of the soil column chamber to measure the pressure difference between the interior and exterior of the chamber. The inlet port at the bottom 1 cm can be connected to the equipment for the steady-state method (port 1 in Figure 2) or the equipment for the pressure decay method (port 2 in Figure 2), depending on the experimental needs. Among them, the steady state method mainly consists of an air pump, flow meter (MF4003-02-O6, Nanjing Shunlaida Measurement and Control Equipment Co., Ltd.) with an accuracy of 1.5%, and a precision valve for controlling the gas flow into the gas chamber. The specific experimental procedure is detailed elsewhere can be obtained from the studies of (Matsumoto et al., 2021; Pourbakhtiar et al., 2017).
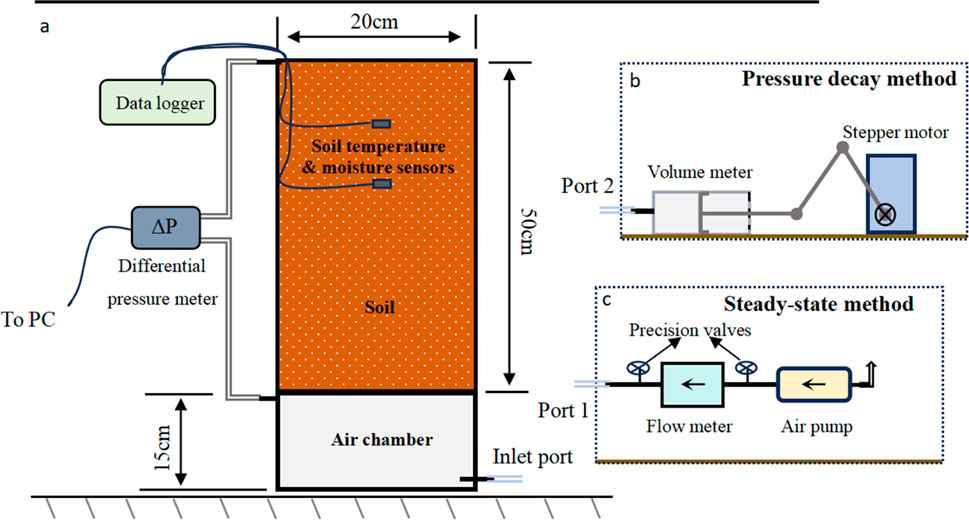
Figure 2. Schematic diagram of the device. (A) shows the overall setup, including the soil column, air chamber, sensors, and measurement devices. (B) illustrates the pressure decay method, showing the volume meter and stepper motor system. (C) depicts the steady-state method, including the precision valves, flow meter, and air pump. Port 1 and Port 2 are connected to the inlet port, respectively.
The pressure decay method consists of a volumetric gauge with a scale and stepper motor to quantitatively control the number of gas volumes entering the gas chamber. The process includes the following steps:
1) The soil column is filled with dry porous media in 5 cm increments to ensure uniformity of the media.
2) The soil column is left for 5–7 min. During this period, air evenly diffuses within the column to ensure that no pressure builds up inside the column.
3) A stepper motor drives the piston of the volumetric gauge to inject the gas into the gas chamber. The amplitude of the motor is adjusted to inject a desired volume of air. The gas inside the device can only escape through the sample.
4) Real-time recording of the pressure difference between the inside and outside of the gas chamber is performed using a differential pressure sensor with a sampling frequency of 5 Hz.
An approximate analytical solution describing the pressure-time relationship in the gas chamber was derived by recording and analyzing the data on the pressure in the gas chamber as a function of time. The medium gas permeability was calculated by performing a linear least-squares fit to the recorded pressure-time test data. After completing the gas permeability measurement of the dry medium, the medium was wetted and the gas permeability in the medium was calculated using the steady-state and pressure decay methods. The specific steps began with the sprinkling of water on the upper surface of the soil column. The experiment was performed with the humidity sensor indication at 20 cm as the reference value, with the aim of simulating soil moisture changes during water-saving irrigation. After water was added, the gas permeability of the soil column medium was measured for 5 min using the steady-state and pressure decay methods. After completion of the water addition experiment, the soil columns were refilled to investigate soil gas permeability after compaction of the medium to ensure the stability of the two measurement methods. Three soils were chosen. First, we filled the soil column with dry soil in 5 cm increments to ensure a uniform medium. This was followed by compaction using the same pressure column, which ensured that the pressures were the same to probe the gas permeability of the compacted soil. After filling the soil columns, the gas permeability of the soil in the columns was measured for 5 min using the steady-state and pressure decay methods.
2.3 Calculation principle of the steady-state method
The steady-state method for measuring the permeability of media gases is primarily based on a constant pressure gradient and gas flow rate. Gas transportation in the media is mainly caused by total pressure or concentration gradients, which depend on the pore structure of the material, such as pore size, connectivity, and curvature (Booker et al., 1994; Vangpaisal and Bouazza, 2004). In unsaturated porous media, where the total pressure gradient in the pores is usually the main driving force (Bouazza and Vangpaisal, 2003), one-dimensional isothermal gas flow through the medium can be described by Darcy’s gas law (Muskat and Wyckoff, 1937; Stonestrom and Rubin, 1989). The gas permeability of the medium can then be calculated from Darcy’s law, using the following equation:
where A (m2) is the cross-sectional area of the medium in the gas chamber, Q (L min−1) is the gas flow rate, η (Pa s−1) is the aerodynamic viscosity, h (m) is the height of the soil column, ΔP (Pa) is the difference in pressure through the medium pores caused by the difference in pressure between the air pressure PC in the bottom chamber and the air pressure Ph on the surface of the soil column, and ka (m2) is the permeability of the medium.
2.4 Calculation principle of pressure decay method
Under isothermal conditions, when gravitational effects are neglected, one-dimensional gas flow (convective flow) is regarded as an ideal gas (Li et al., 2004). According to the ideal gas law PV = nRT, the gas equation of state can be further derived as the following equation in a system with a constant volume and air temperature:
where V (m3) is the constant volume of the gas chamber, T(K) is the constant air temperature, R is the gas constant, n' (mol) is the change in the amount of gas in the volume, and t(s) is the time. P'C(Pa) is the amount of change in pressure within the chamber, the magnitude of which is equal to the difference between the value of pressure within the bottom chamber (PC) and the original value of pressure at rest within the chamber (Por). Introducing the molar volume of air, Vm (m3 mol−1), and density of air, ρ (g cm-3), into Equation 2 gives:
Equation 3 further reduces to:
where mloss (g) represents the mass of air lost within the chamber.
According to Darcy’s law, Equation 1 can be obtained as:
where Vleaky (m3) is the volume of the gas leakage through the medium. By introducing the air density ρ, mleaky can be used to represent the mass of gas leaking through the medium, and Equation 5 can be expressed as:
When the gravitational effect and vertical variation of temperature are neglected, according to the law of conservation of mass, dmleaky = dmloss. by associating Equations 4, 6, the following equations for isothermal, one-dimensional, and vertical airflows in the experimental setup can be obtained:
If it is defined that the pressure inside the air chamber reaches its maximum value at t = 0, then at this point
where τ is the time constant:
The gas permeability of the medium can be easily calculated by recording the gas chamber pressure difference over time through the sensor and performing a least-squares fit to the recorded pressure-time data, according to Equations 8, 9, respectively.
2.5 Data analysis
The coefficient of determination (R2), standard deviation (SD), and coefficient of variation (CV) were used to compare the stability of the two methods for calculating gas permeability and to evaluate the performance of the models. In this study, to better judge the effect of different gas flow rates on the steady-state method, we introduced the average increment of differential pressure with increasing flow rate and normalized the values to eliminate the order of magnitude variability using the following equation:
where
We calculated ln (RR) as the effect value to analyse the effect of media water content, compaction, and soil type on soil gas permeability using R Studio’s metafor software package (Doherty et al., 2021; Viechtbauer, 2010) with the following equation:
where Y is the average gas permeability for the treated (A) and untreated (B) groups. Using this method, a value of zero indicates no effect, a positive value indicates an increase in the gas permeability of the medium after treatment, a negative value indicates a decrease in the distance travelled in the treatment, and a negative value indicates a decrease in the gas permeability of the medium after treatment. The exponent ln (RR) can be interpreted as the percentage difference between the two experimental groups. The differences in the experiments (P < 0.05) were considered significant. where the sampling variance is calculated using the following formula:
where N represents the sample size for Treatment A and Treatment B.
3 Results
3.1 Disadvantages of the steady-state method
The steady state method based on Darcy’s law to describe the air infiltration process in soil and to establish a linear relationship between the gas flow rate and pressure gradient. Gas is passed into the bottom gas chamber through an air pump, which relies on a precision valve to regulate a constant gas flow that creates a pressure difference between the inside and outside of the soil column, forcing the air to flow only through the soil sample. Figure 3A shows the relationship between the differential pressure values and increasing gas flow rate in the six dry soils with different porosities. The differential pressure values positively correlated with the gas flow rate. In addition, it can be seen from Figure 3A that at the same flow rate, different types of soil displayed varying differential pressure values in the order of coarse quartz sand < fine quartz sand < sandy loam < fine sand < clay < loam, with clay growing more rapidly than sandy loam. However, with increasing gas flow rate, all the soils displayed a near-linear increase in differential pressure, with an R2 value exceeding 0.95 by linear fitting. However, in combination with the normalized mean incremental values of differential pressure (Figure 1B), the mean incremental increase in differential pressure with increasing gas flow rate was insignificant for both coarse and fine quartz sand, and the value of the increment was highest at a gas flow rate of 0.1 L min−1. In sandy loam, fine sand, clay, and loam all appeared to show a significant incremental trend in the average increment in differential pressure as the flow rate increased. This suggests that in these types of soils, where the average increment in differential pressure exhibits an incremental increase, a build-up of gas passing into the chamber occurs as the flow rate increases, resulting in a high air pressure within the chamber. This phenomenon leads to errors in soil gas permeability measurements, especially in measurements with high gas flow rates.
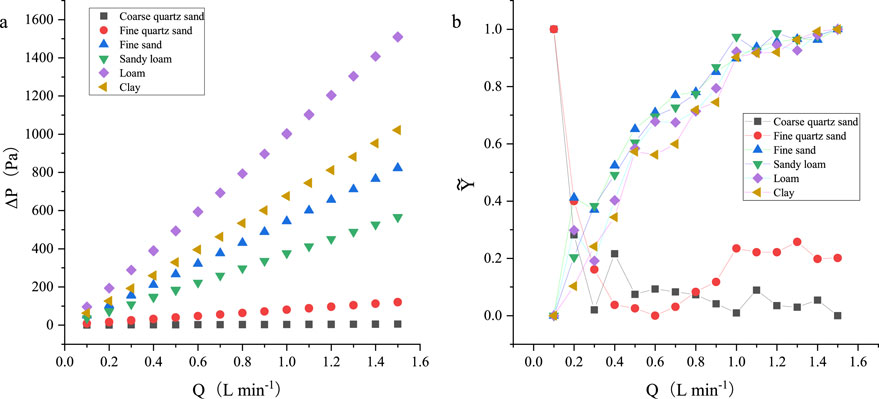
Figure 3. (A) Line graph of the variation of differential pressure with flow rate for six different media measured by the steady-state method. (B) Normalized mean incremental values of differential pressure calculated for the six porous media based on Equation 10.
To further analyze the results of the calculation of gas permeability (ka), we substituted the data collected in real time by the differential pressure sensor and flowmeter into Equation 1 to calculate the gas permeability of the medium. The results are shown in Figure 4. The data show the ka values of the six dry soils at different flow rates using the steady state method, where the dots represent the mean values and the line segments represent the error values. For the two quartz sands, the calculated gas permeability increased with increasing flow rate, with the values gradually levelling off in the later stages. In contrast, for the other four soils, the values continued to decrease. Analysed by Equation 1, this phenomenon is consistent with the results depicted by the average increment in the differential pressure in Figure 3B. This is because in both quartz sands, owing to the small gas flow rate, the air does not completely fill the pores of the medium and facilitates the build-up of gas within the gas chamber, resulting in an increase in the differential pressure value. This produces small calculated gas permeability values of the two quartz sands at low flow rates, whereas large flow rates allow the air to fill the pores of the medium and reach a steady-state of flow more quickly. However, in soils with low gas permeability, soil pores do not have better connectivity. As the gas flow increases, the gas accumulates in the soil and cannot flow from the soil column to the atmosphere in a timely manner. This leads to a pressure difference between the inside and outside of the soil column becoming increasingly larger, resulting in a low value of the calculated soil gas permeability.
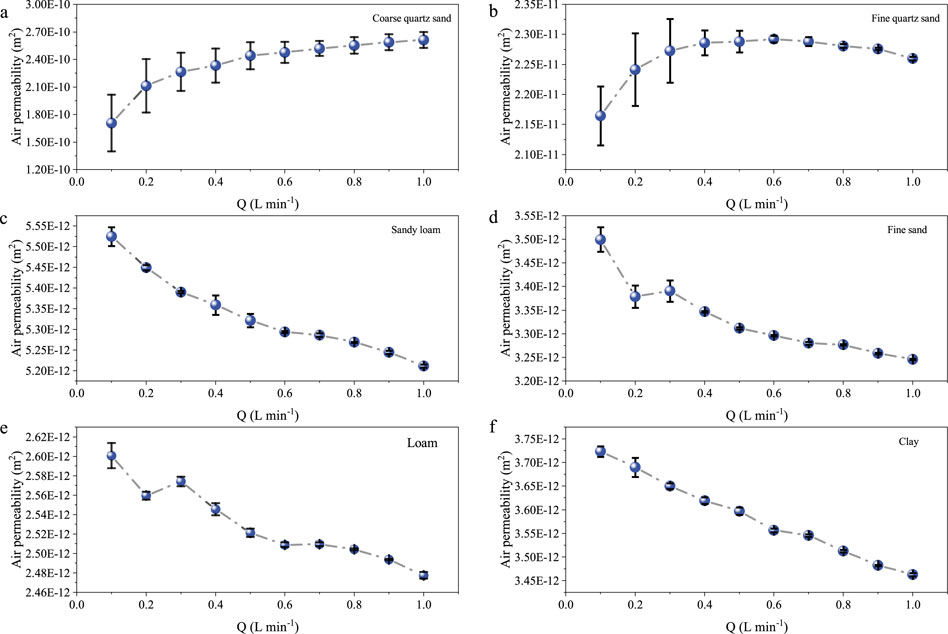
Figure 4. Steady-state method for measuring gas permeability with flow rate for six different soils. (A) represents coarse quartz sand, (B) fine quartz sand, (C) sandy loam, (D) fine sand, (E) loam, and (F) clay. The circles represent the average of multiple measurements at different flow rates.
3.2 Pressure decay method
The unsteady state method (pressure decay method) was also used to investigate the relationship between the pressure difference within the soil column and time, and to calculate the gas permeability of the medium. During the experiment, 100, 50, and 30 mL of gas were injected into the five soil columns. Because the bottom of the device was sealed, the gas could only flow into the atmosphere through the soil columns according to the pressure gradient, until the internal and external air pressures were equal. During this process, we observed a trend in the pressure difference within the soil column with time, as shown in Figure 5. The pressure-time decayed in a nonlinear manner, and the trend of pressure decay overlapped for each soil after the injection of different volumes of gas. These findings show that for the same medium, the trend of pressure-time decay does not correlate with the volume injected by this method. For, the convenience of the later experimental manipulation, we uniformly used 100 mL of gas injection volume for the study. In addition, the rate of decay depended on the permeability of different soils, with the rate of decay being increasingly lower as the permeability was lower.
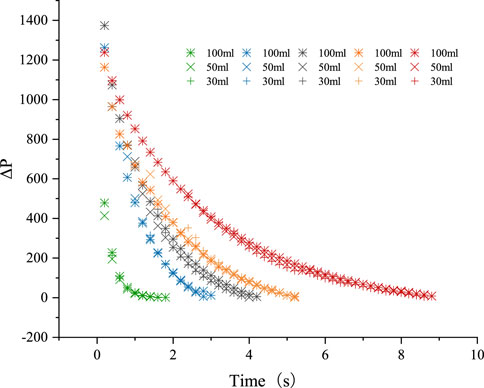
Figure 5. Decaying change of gas pressure with time for five porous media injected with 100, 50, or 30 mL of gas. Different shapes represent different amounts of injected gas: “green” represents fine quartz sand, “blue” represents sandy loam, “black” represents fine sand, “orange” represents loam, and “red” represents clay. If coarse sand pressure decay is too fast, less data are collected; this information is not plotted.
To further verify whether the theory of the pressure decay method is valid, the study log-transformed the data in Figure 5 according to Equation 8 to eliminate the numerical variability caused by different magnitudes and fit them using the least squares method. The results are shown in Figure 6. The pressure functions ln [(PC- Ph)/(PC (0)-Patm)] for the five soils were linear with respect to time, with R2 values >0.97 for each of the five soils fitted to a theoretical straight line. The fit between the transformed observations and the theoretical predictions was satisfactory. This allowed the principle of the pressure decay method to be validated in practical measurements, showing that this method is feasible for measuring soil gas permeability.
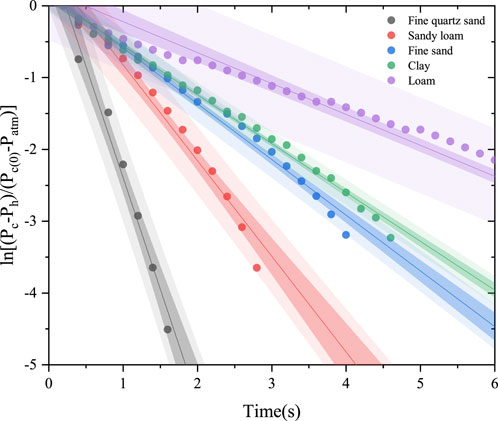
Figure 6. Linear analysis predictions for measured data of ln [(PC- Ph)/(PC (0)-Patm)] versus time for five soil samples. The circles represent the measured data and the shaded area represents the 95% confidence interval.
3.3 Comparison of steady-state and pressure decay methods
The unsteady state method (pressure decay method) designed in this study showed the same small difference in mean values compared to the steady-state method calculations. However, the variance showed a large difference. This also indicates that the fluctuations in the data calculated by the steady-state method are more significant (Table 2). For further clarity in presenting the results, Figure 7 compares the five soil permeability values calculated using the steady state method (Equation 1), and the pressure decay method (Equation 8). The distribution of the anomalies, as well as the maximum or minimum values in Figure 7 indicate that the values calculated by the pressure decay method are more stable than those calculated by the steady state method. Comparing the stability of the two methods by calculating the coefficient of variation revealed that the CVs for the five soil gas permeabilities calculated using the steady state method ranged from 0.015 to 0.03, whereas the CVs calculated using the pressure decay method ranged from 0.005 to 0.017. These findings also indicate that the values of the soil gas permeability calculated using the steady state method were more discrete than those calculated using the pressure decay method. The size of the boxes and the distribution of the mean values in Figure 7 indicate that the values measured by the steady state method became progressively more discrete as the permeability of the soil gas decreased, and the calculated results were progressively smaller than those of the pressure decay method. These findings indicate that there is a small measurement value for the steady state method in a medium with low-permeability. This phenomenon is consistent with the results in Figure 4. In addition, fine quartz sand had the largest difference in gas permeability calculated by the two methods, except for Figure 7A, which shows the difference between the two methods. Fine sand and sandy loam had similar mean values calculated using the two methods, whereas loam and clay had larger differences between the mean values calculated using the two methods. The main reason for these findings is that because of the lack of cohesion between sandy soil particles the soil is loosely packed with a large porosity, whereas clay is tightly structured and the soil porosity is relatively small. This leads to the steady-state method in low-permeability soils because of the gas build-up during measurements, in turn leading to a large pressure difference in the gas chamber. As a consequence, the flowmeter readings become unstable. In addition, in low-permeability soils, owing to the highly time-consuming and thermally sensitive steady state method of gas flow rate, it took longer to reach a steady-state. However, pressure decay experiments are less susceptible to this inaccuracy because the calculations of this method only require the acquisition of the pressure-time response relationship, which is measured over a shorter period of time. In addition, the pressure decay method uses a differential pressure transducer, which is usually more accurate than a flow meter and is more reflective of the airflow process, accurately depicting the reality of the air seepage process.

Table 2. Comparison of the steady-state method with pressure decay method.
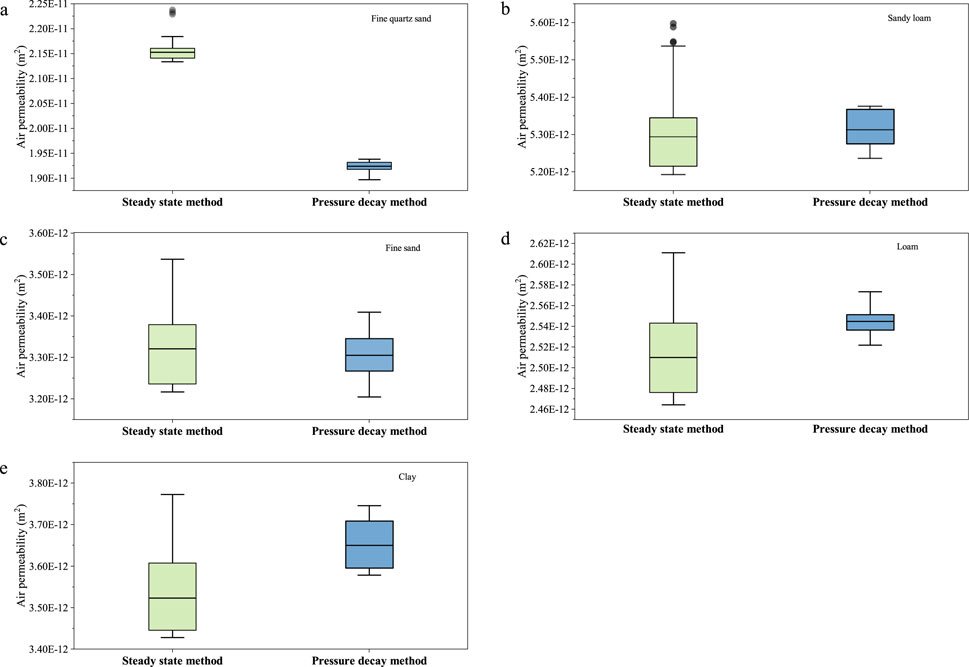
Figure 7. Comparison of soil gas permeability calculated by steady-state method and pressure decay method for the studied six soils. (A) represents fine quartz sand, (B) sandy loam, (C) fine sand, (D) loam, and (E) clay.
3.4 Effect of volumetric soil moisture content on gas permeability
To investigate the effect of soil volumetric water content on gas permeability, an experiment was performed by adding water to the five media mentioned above, resulting in a decrease in effective soil porosity ranging from 11.2% to 25.3%. The steady-state and pressure decay methods were independently used to calculate the soil gas permeability. The results are shown in Figure 8. Panel a shows that the effect values for several soils were <0, ranging from −0.29 to −2.17. According to Equations 11, 12, the addition of water to dry soils reduces soil gas permeability in all cases, but the decreasing trend varies from soil-to-soil. For both sands, the water addition treatment produced significantly less effect on soil gas permeability than did the loam and clay treatments, where the addition of water produced a 25%–56% (effect sizes of −0.287 to −0.815) effect on soil gas permeability. For several soils, the addition of water instead resulted in a 31%–88% decrease in gas permeability (effects of −0.367 to −2.175). We proximally introduced explanatory variables for the model and found that volumetric water content significantly affected soil gas permeability (Qm = 120, p < 0.001), which decreased significantly with increasing volumetric soil water content (Figure 8B). For soils with cohesion, the effect of soil moisture on air permeability was more significant. This is because clay has smaller particles and lower porosity, and water is readily adsorbed and retained by the clay surface. Sandy soils, in contrast, have large particles and high porosity, so water is more easily lost through soil crevices. Comparison of the effect values calculated by the steady-state method and the pressure decay method revealed extremely close values (−0.860 and −0.848, respectively). However, analysis of the individual effect values revealed that the 95% confidence intervals for the steady state method were larger than the values for the pressure decay method. These findings suggest that the gas permeability results calculated by the pressure decay method are likewise more stable than those of the steady state method in moist soils. In addition, the changes with the loss of soil water content were not the same for different soils. In clayey soils, the soil became firmer as shrinkage occurred with loss of water content. However, many cracks appeared in sandy and loamy soils, which may have led to different changes in the gas permeability.
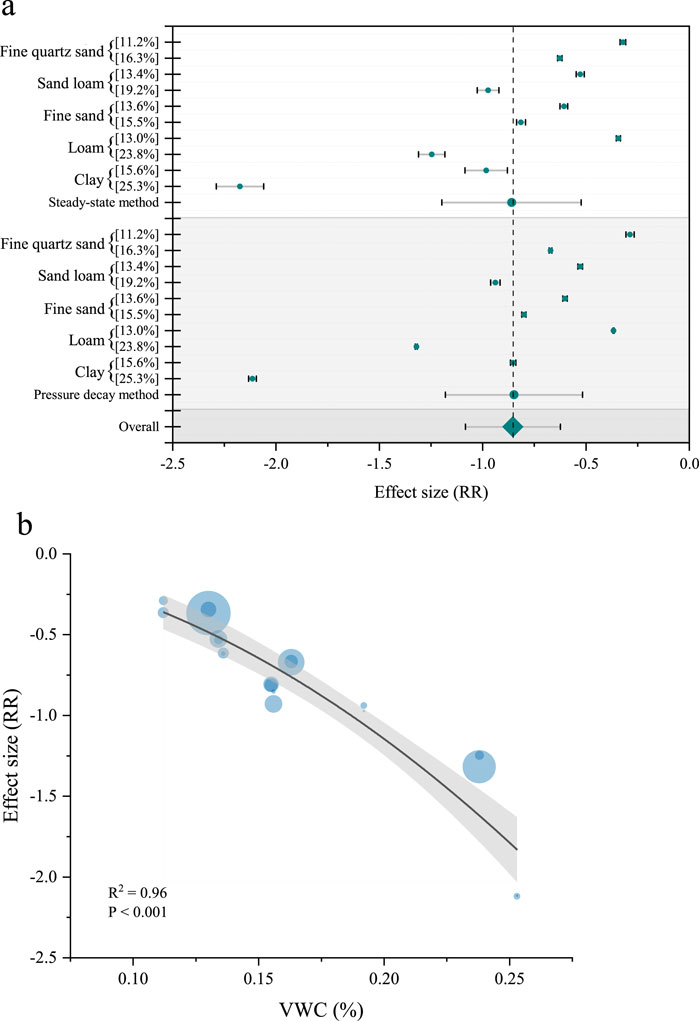
Figure 8. Changes in air permeability of soils with different moisture contents measured by steady-state method and pressure decay method. (A) All data points, p < 0.001. RR denotes the response ratio, the grey dashed line represents the total effect size, and Gray is the 95% CI. (B) Variation of air permeability with soil moisture content. RR denotes the response ratio, the black solid line is the predicted regression line for the effect size, and the grey area is the 95% CI.
3.5 Effect of soil compaction on gas permeability
The effects of soil compaction on soil gas permeability were assessed. Three dry soils were chosen for the same compaction operation. Loam showed the greatest reduction in effective pore space (21%), with reductions of 17.5% for clay and 13% for sandy loam soils. The steady state and pressure decay methods were used to calculate the gas permeability of the compacted treated soil (Figure 9). The effect size for the three soils were also <0, with values ranging from −0.995 to −3.182, indicating that compaction treatments result in reduced soil gas permeability. The sandy loam decreased by 63%, with decreases of 86% for loam and 93% for clay soils. These findings indicate that a decrease of 0.2 in soil porosity will decrease the soil gas permeability by an order of magnitude. Comparison of the effect values of the soil under the two different treatments revealed that the effect of the compaction treatment was generally greater than that of the water addition treatment, after the effective porosity was reduced by the same amount. In addition, comparing the two different methods of calculating soil gas permeability revealed that the gas permeability results calculated by the pressure decay method were more stable than those calculated by the steady state method in compacted soils.
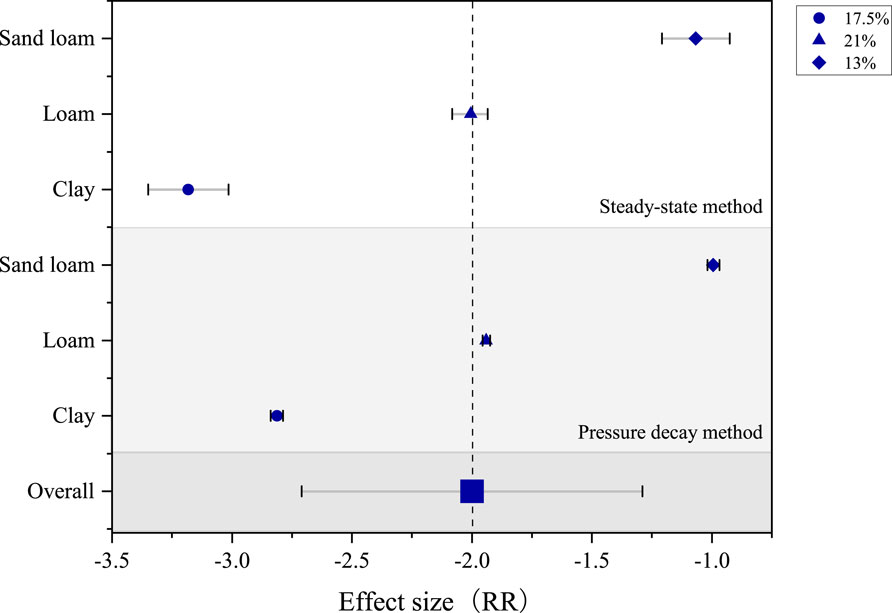
Figure 9. Changes in air permeability of compacted soil measured by steady-state and pressure decay methods. All data points, p < 0.001. RR denotes the response ratio, the grey dashed line represents the total effect size, and grey is the 95% CI.
4 Discussion
4.1 Steady and unsteady (pressure decay) state methods of calculation
The steady state and unsteady state methods are the two main methods for calculating soil gas permeability. In the present study, for the steady state method, the calculated soil gas permeability values were low. This is because soil pores do not have good connectivity in low- or ultralow-permeability soils. As the gas flow increases, gas accumulates in the soil and cannot flow from the soil column to the atmosphere over time. This led to a constantly increasing pressure difference between the inside and outside of the soil column, which caused a large deviation in the measurement. If a small gas flow rate is used and because there are no more accurate flow meters available (Yang et al., 2019), the gas flow fluctuations will be larger, making the measurements unstable. In addition, when using the steady state method, there may be an artificially created illusion of accurate results, which was evident in Figures 3, 4. If the calculation is performed at a certain flow rate, the results may become more stable. However, there is the real risk that the measurements will be small, a phenomenon that is more likely to occur in soils with low-permeability. Determination of the flow rate becomes a major difficulty when measuring the permeability of soil gases by the steady state method, especially for media with gas permeability <10−11 m2. The pressure decay method is less susceptible to this inaccuracy. Because the pressure decay method only requires the acquisition of the pressure-time response relationship, the measurement time is shorter, and this method is more reflective of the airflow process, accurately depicting the reality of the air seepage process. However, in media with high permeability (ka >10−10 m2), the pressure decay method may not be applicable. The main reason for this method is that gas transport in porous media is driven by a pressure gradient. For large porosity soils with good pore connectivity, the gas is transported quickly and for a short period of time, which results in the differential pressure meter not being able to accurately capture the differential pressure value (Figures 5, 6). However, for field soils, the soil gas permeability is usually <10−10 m2, and is even smaller in wet or compacted soils. Therefore, the permeability of field soils was measured using the pressure decay method, which is useful for improving soil gas permeability measurements and for better evaluation of soils.
4.2 Effect of volumetric water content on soil gas permeability
Changes in soil water content affect permeability by altering the connectivity of the aerated pores (Wang et al., 2009). Water is always preferentially present in the smaller pores, whereas air preferentially occupies the larger pores (Wang et al., 2008). In soil pores, an increase in water content inevitably leads to a decrease in the air content. At low moisture content conditions, the corresponding gas phase connectivity is high, and the increase in moisture does not unduly impede airflow. With increasing water content, the water phase is partially connected, and the effective ventilation channels or air holes for air flow will be sealed, resulting in increased difficulty of air flow, the blocking effect becomes more obvious, and the permeability decreases rapidly (Jucá and Maciel, 2006). In addition, water saturated soils generally shrink during drying, resulting in decreased porosity or pore volume (Benavente and Pla, 2018). The soil becomes less permeable. However, wetting the soil to a depth of 20 cm resulted in shrinkage in clay soils, while other soils developed fissures after drying and losing water at the surface. These findings indicate that changes in water content change the permeability of the soil. This is because soil aggregates are destroyed upon exposure to water, forming microaggregates. During subsequent drying of the soil, with the reduction in water content, the pore structure shrinks, leading to a reduction in soil volume and smaller pore spaces available for air, resulting in a lower permeability coefficient (He et al., 2017).
4.3 Effect of compaction on soil gas permeability
The connectivity of the pore network is a key parameter of the soil and is important for plant growth, as well as water and gas transport. Soil saturated hydraulic conductivity (Luo et al., 2010; Sandin et al., 2017), permeability (Paradelo et al., 2016), and greenhouse gas release (Rabot et al., 2015) are affected by soil connectivity. However, soil compaction alters the soil pore structure and connectivity, and the degree of deformation varies from soil-to-soil with different textures, mainly caused by the destruction of coarser pores and an increase in finer pores (Bruand and Cousin, 1995; Cui et al., 2010; Huang et al., 2021; Pagliai et al., 2000; Richard et al., 2001). Fine textured soils, such as loam and clay, are more sensitive to compaction and show greater reductions in pore ratios than sandy loams (Horn et al., 1995; Zhai and Horn, 2018). Similar findings were observed by de Lima et al. (2020), who concluded that soil sensitivity to compaction increases with the initial substrate potential and clay content. Fine textured soils are also associated with a higher susceptibility to swelling and further reduction of pore width and pore continuity, which affects clayey soils more intensely owing to their higher colloid contents, more sensitive structure, and further internal deformation processes. This significantly affects the gas permeability of the soil. For the same type of soil, permeability increases with increasing pore volume, and increases in the pore number and pore diameter play an important role in the change in pore volume, which affects the permeability coefficient. However, compaction had a greater effect on soil permeability when comparing the results of water content, where porosity decreased by the same amount.
5 Conclusion
In this study, an analytical solution of the pressure decay method is presented to calculate the permeability using the experimental data of the pressure-time response. The refined pressure decay method has the advantages of simplicity, rapidity, and stability of the pressure decay method compared to the steady state method. This is because in low- and ultra-low-permeability soils, soil pores do not have better connectivity, making the steady state method measurement time longer and not applicable to low- and ultra-low-permeability soils. The pressure decay method, is more stable than the steady state method of measurement and better reflects the process of airflow changes, accurately depicting the actual situation of the air infiltration process. In modern agriculture, tillage is one of the most prominent practices for changing soil structure. The reduction of soil pores and deterioration of pore function caused by the use of heavy agricultural machinery lead to compaction of cultivated land, destruction of coarser pores in the soil, and an increase in finer pores. In addition, changes in the soil water content during natural rainfall or agricultural irrigation events cause changes in the aerated porosity of the soil. All of these effects result in a sharp decrease in soil gas permeability, thereby biasing the steady state method in measuring soil gas permeability. Overall, the soil permeability varied as a function of the pore volume. The porosity and connectivity of soil pore sizes play an important role in the variation in pore volume, thus affecting the soil permeability coefficient. Pore continuity indicators can reflect the decrease in pore curvature and surface area with increasing macroscopic porosity, which leads to changes in the soil permeability. Thus, in low-permeability soils, the unsteady state method is preferred because of poor pore continuity. In this experiment, the pressure attenuation method was well suited for low-permeability soils and remained well suited for water-bearing soils as well as compacted soils.
Data availability statement
The original contributions presented in the study are included in the article/supplementary material, further inquiries can be directed to the corresponding author.
Author contributions
LF: Conceptualization, Data curation, Writing–original draft. JH: Conceptualization, Funding acquisition, Supervision, Validation, Writing–review and editing. JJ: Software, Writing–original draft.
Funding
The author(s) declare that financial support was received for the research, authorship, and/or publication of this article. This study was supported by the National Natural Science Foundation of China (grant number: 32371668 and 31971493).
Acknowledgments
We also thank the editor and reviewers for their contribution to the peer review of our work.
Conflict of interest
The authors declare that the research was conducted in the absence of any commercial or financial relationships that could be construed as a potential conflict of interest.
Publisher’s note
All claims expressed in this article are solely those of the authors and do not necessarily represent those of their affiliated organizations, or those of the publisher, the editors and the reviewers. Any product that may be evaluated in this article, or claim that may be made by its manufacturer, is not guaranteed or endorsed by the publisher.
References
Ball, B. C., and Robertson, E. A. G. (1994). Effects of uniaxial compaction on aeration and structure of ploughed or direct drilled soils. Soil Tillage Res. 31, 135–148. doi:10.1016/0167-1987(94)90076-0
Benavente, D., and Pla, C. (2018). Effect of pore structure and moisture content on gas diffusion and permeability in porous building stones. Mater. Struct. 51, 21. doi:10.1617/s11527-018-1153-8
Ben-Noah, I., and Friedman, S. P. (2018) Review and evaluation of root respiration and of natural and agricultural processes of soil aeration, 17.170119
Booker, J. R., Quigley, R. M., and Rowe, R. K., (1994). Clayey barrier systems for waste disposal facilities.
Bouazza, A., and Vangpaisal, T. (2003). An apparatus to measure gas permeability of geosynthetic clay liners. Geotext. Geomembr. 21, 85–101. doi:10.1016/s0266-1144(02)00058-4
Bruand, A., and Cousin, I. (1995) Variation of textural porosity of a clay-loam soil during compaction, 46, 377–385.
Chalmers, G. R. L., Ross, D. J. K., and Bustin, R. M. (2012). Geological controls on matrix permeability of devonian gas shales in the Horn river and liard basins, northeastern British columbia, Canada. Int. J. Coal Geol. 103, 120–131. doi:10.1016/j.coal.2012.05.006
Chamindu, D., de Jonge, L. W., Kawamoto, K., Komatsu, T., and Moldrup, P. (2015) The water-induced linear reduction gas diffusivity model extended to three pore regions, 14. vzj2015.2004.0051.
Chamindu, D., Moldrup, P., Jensen, M. P., Jones, S. B., de Jonge, L. W., Schjønning, P., et al. (2012). Diffusion aspects of designing porous growth media for earth and space. Soil Sci. Soc. Am. J. 76, 1564–1578. doi:10.2136/sssaj2011.0438
Cui, K., Défossez, P., Cui, Y. J., and Richard, G. (2010) Soil compaction by wheeling: changes in soil suction caused by compression, 61, 599–608.
de Lima, R., Keller, T., Giarola, N., Tormena, C., Silva, A., and Rolim, M. (2020). Measurements and simulations of compaction effects on the least limiting water range of a no-till Oxisol. Soil Res. 58, 62. doi:10.1071/sr19074
Doherty, T. S., Hays, G. C., and Driscoll, D. A. (2021). Human disturbance causes widespread disruption of animal movement. Nat. Ecol. and Evol. 5, 513–519. doi:10.1038/s41559-020-01380-1
Feng, L., Jiang, J., and Hu, J. (2024a). Underestimation of global soil CO2 flux measurements caused by near-surface winds. Front. For. Glob. Change 7, 1459948. doi:10.3389/ffgc.2024.1459948
Feng, L., Jiang, J., Hu, J., Zhu, C., Wu, Z., Li, G., et al. (2024b). Global spatial projections of forest soil respiration and associated uncertainties. Forests, 15, 1982. doi:10.3390/f15111982
Hamamoto, S., Moldrup, P., Kawamoto, K., Komatsu, T., and Rolston, D. E. (2009). Unified measurement system for the gas dispersion coefficient, air permeability, and gas diffusion coefficient in variably saturated soil. Soil 73, 1921–1930. doi:10.2136/sssaj2009.0012
He, Y., Cui, Y.-J., Ye, W.-M., and Conil, N. (2017). Effects of wetting-drying cycles on the air permeability of compacted Téguline clay. Eng. Geol. 228, 173–179. doi:10.1016/j.enggeo.2017.08.015
Horn, R., Domżżał, H., Słowińska-Jurkiewicz, A., and van Ouwerkerk, C. (1995). Soil compaction processes and their effects on the structure of arable soils and the environment. Soil Tillage Res. 35, 23–36. doi:10.1016/0167-1987(95)00479-c
Huang, M., Zettl, J. D., Lee Barbour, S., and Pratt, D. (2016). Characterizing the spatial variability of the hydraulic conductivity of reclamation soils using air permeability. Geoderma 262, 285–293. doi:10.1016/j.geoderma.2015.08.014
Huang, X., Horn, R., and Ren, T. (2021). Deformation and pore water pressure change during static and cyclic loading with subsequent shearing on soils with different textures and matric potentials. Soil Tillage Res. 209, 104909. doi:10.1016/j.still.2020.104909
Jannot, Y., and Lasseux, D. (2012). A new quasi-steady method to measure gas permeability of weakly permeable porous media. Rev. Sci. Instrum. 83, 015113. doi:10.1063/1.3677846
Jiang, J., Feng, L., Hu, J., Liu, H., Zhu, C., Chen, B., et al. (2024). Global soil respiration predictions with associated uncertainties from different spatio-temporal data subsets. Ecol. Inf. 82, 102777. doi:10.1016/j.ecoinf.2024.102777
Jucá, J. F. T., and Maciel, F. J., (2006). Gas permeability of a compacted soil used in a landfill cover layer, 1535–1546. doi:10.1061/40802(189)128
Lara, E., Rocha, Z., Palmieri, H. E. L., Santos, T. O., Rios, F. J., and Oliveira, A. H. (2015). Radon concentration in soil gas and its correlations with pedologies, permeabilities and 226Ra content in the soil of the Metropolitan Region of Belo Horizonte – RMBH, Brazil. Radiat. Phys. Chem. 116, 317–320. doi:10.1016/j.radphyschem.2015.02.017
Li, H., Jiao, J. J., and Luk, M. (2004). A falling-pressure method for measuring air permeability of asphalt in laboratory. J. Hydrol. 286, 69–77. doi:10.1016/j.jhydrol.2003.09.013
Liu, J.-F., Ni, H.-Y., Cao, X.-L., Ma, L.-K., Guo, J.-N., and Chen, X. (2020). Laboratory investigation on gas permeability of compacted GMZ bentonite under a coupled hydraulic-mechanical effect. Eng. Geol. 276, 105761. doi:10.1016/j.enggeo.2020.105761
Liu, J.-f., Skoczylas, F., and Talandier, J. J. C. G. J. (2015). Gas permeability of a compacted bentonite–sand mixture: coupled effects of water content, dry density, and confining pressure. Can. Geotech. J. 52, 1159–1167. doi:10.1139/cgj-2014-0371
Luo, L., Lin, H., and Schmidt, J. (2010) Quantitative relationships between soil macropore characteristics and preferential flow and transport, 74, 1929–1937.
Ma, J. (2015). Review of permeability evolution model for fractured porous media. J. Rock Mech. Geotech. Eng. 7, 351–357. doi:10.1016/j.jrmge.2014.12.003
Maier, M., Schack-Kirchner, H., Aubinet, M., Goffin, S., Longdoz, B., and Parent, F. (2012) Turbulence effect on gas transport in three contrasting forest soils, 76, 1518–1528.
Malkovsky, V. I., Zharikov, A. V., and Shmonov, V. M. (2009). New methods for measuring the permeability of rock samples for a single-phase fluid. Izvestiya, Phys. Solid Earth 45, 89–100. doi:10.1134/s1069351309020013
Matsumoto, Y., Yoshida, S., Sekiya, H., and Nishida, K. (2021). Gas transport enhancement under windy condition in poorly tilled seedbed of clayey rotational paddy field. Soil Sci. Plant Nutr. 68, 189–201. doi:10.1080/00380768.2021.2015236
Nakajima, T., Saito, H., Tojo, S., and Hu, Q. J. V. Z. J. (2016) Effects of confining pressure on unsteady-state air permeability measurement method in an aggregated andisol, 15.
Pagliai, M., Pellegrini, S., Vignozzi, N., Rousseva, S. S., and Grasselli, O. (2000). The quantification of the effect of subsoil compaction on soil porosity and related physical properties under conventional to reduced management practices.
Paradelo, M., Katuwal, S., Moldrup, P., Norgaard, T., Herath, L., and de Jonge, L. W. (2016) X-Ray CT-derived soil characteristics explain varying air, water, and solute transport properties across a loamy field, 15, 0104.
Peng, E., Sun, W. B., Zhang, D. W., Liu, S. Y., and Zhu, X. D. (2016). Air permeability of unsaturated fine sandy soil. Yantu Lixue/Rock Soil Mech. 37, 1301–1306 and 1316. doi:10.16285/j.rsm.2016.05.011
Poulsen, T. G., and Moldrup, P. (2007). Air permeability of compost as related to bulk density and volumetric air content. Waste Manag. and Res. 25, 343–351. doi:10.1177/0734242x07077819
Pourbakhtiar, A., Poulsen, T. G., Wilkinson, S., and Bridge, J. W. (2017) Effect of wind turbulence on gas transport in porous media: experimental method and preliminary results, 68, 48–56.
Rabot, E., Lacoste, M., Hénault, C., and Cousin, I. (2015). Using x-ray computed tomography to describe the dynamics of nitrous oxide emissions during soil drying. Vadose Zone J., 14 (8), vzj2014.2012.0177. doi:10.2136/vzj2014.12.0177
Richard, G., Cousin, I., Sillon, J. F., Bruand, A., and Guérif, J. (2001) Effect of compaction on the porosity of a silty soil: influence on unsaturated hydraulic properties, 52, 49–58.
Ryzhakova, N. K., Stavitskaya, K. O., and Plastun, S. A. (2024). Influence of rock type and geophysical properties on radon flux density. Radiat. Environ. Biophys. 63, 271–281. doi:10.1007/s00411-024-01067-2
Sander, R., Pan, Z., and Connell, L. D. (2017). Laboratory measurement of low permeability unconventional gas reservoir rocks: a review of experimental methods. J. Nat. Gas. Sci. Eng. 37, 248–279. doi:10.1016/j.jngse.2016.11.041
Sandin, M., Koestel, J., Jarvis, N., and Larsbo, M. (2017). Post-tillage evolution of structural pore space and saturated and near-saturated hydraulic conductivity in a clay loam soil. Soil Tillage Res. 165, 161–168. doi:10.1016/j.still.2016.08.004
Schjønning, P., and Koppelgaard, M. (2017) The forchheimer approach for soil air permeability measurement, 81, 1045–1053.
Stoltz, G., Gourc, J.-P., and Oxarango, L. (2010). Liquid and gas permeabilities of unsaturated municipal solid waste under compression. J. Contam. Hydrol. 118, 27–42. doi:10.1016/j.jconhyd.2010.07.008
Stonestrom, D. A., and Rubin, J. (1989) Air permeability and trapped-air content in two soils, 25, 1959–1969.
Vangpaisal, T., and Bouazza, A. (2004). Gas permeability of partially hydrated geosynthetic clay liners. J. Geotechnical Geoenvironmental Eng. 130, 93–102. doi:10.1061/(asce)1090-0241(2004)130:1(93)
Viechtbauer, W. (2010). Conducting meta-analyses in R with the metafor package. J. Stat. Softw. 36, 1–48. doi:10.18637/jss.v036.i03
Wang, W., Wang, Q., and Fan, J. (2008) Relationship between air permeability, water conductivity and water content for undisturbed and disturbed soils, 24, 25–29.
Wang, W., Wang, Q., and Li, S. (2009). Character of soil air permeability and its relationship with water conductivity in Changwu, loess region of China. Nongye Gongcheng Xuebao/Transactions Chin. Soc. Agric. Eng. 25, 120–127. doi:10.3321/j.issn:1002-6819.2008.08.006
Yang, D., Wei, W., Chen, W., Tan, X., and Wang, L. (2019). Revisiting the methods for gas permeability measurement in tight porous medium. J. Rock Mech. Geotech. Eng. 11, 263–276. doi:10.1016/j.jrmge.2018.08.012
Zhai, Q., and Rahardjo, H. (2013). Quantification of uncertainties in soil–water characteristic curve associated with fitting parameters. Eng. Geol. 163, 144–152. doi:10.1016/j.enggeo.2013.05.014
Zhai, Q., Rahardjo, H., and Satyanaga, A. (2019). Estimation of air permeability function from soil-water characteristic curve. Can. Geotech. J. 56, 505–513. doi:10.1139/cgj-2017-0579
Zhai, Q., Ye, W., Rahardjo, H., Satyanaga, A., Dai, G., and Zhao, X. (2021). Theoretical method for the estimation of vapour conductivity for unsaturated soil. Eng. Geol. 295, 106447. doi:10.1016/j.enggeo.2021.106447
Keywords: soil gas permeability measurement, pressure decay method, steady-state method, gas flow, numerical solution
Citation: Feng L, Hu J and Jiang J (2025) Uncertainty in soil gas permeability measurements. Front. Environ. Sci. 13:1474764. doi: 10.3389/fenvs.2025.1474764
Received: 02 August 2024; Accepted: 06 January 2025;
Published: 23 January 2025.
Edited by:
Rui Yang, Chinese Academy of Agricultural Sciences, ChinaReviewed by:
Qian Zhai, Southeast University, ChinaKatalin Törökné Szabó, HUN-REN Centre for Energy Research, Hungary
Copyright © 2025 Feng, Hu and Jiang. This is an open-access article distributed under the terms of the Creative Commons Attribution License (CC BY). The use, distribution or reproduction in other forums is permitted, provided the original author(s) and the copyright owner(s) are credited and that the original publication in this journal is cited, in accordance with accepted academic practice. No use, distribution or reproduction is permitted which does not comply with these terms.
*Correspondence: Junguo Hu, aHVqdW5ndW9AemFmdS5lZHUuY24=