 Yefang Jiang
 Mohammad Amir Azimi2
 Fan-Rui Meng
 Kang Liang
94% of researchers rate our articles as excellent or good
Learn more about the work of our research integrity team to safeguard the quality of each article we publish.
Find out more
ORIGINAL RESEARCH article
Front. Environ. Sci. , 27 March 2025
Sec. Freshwater Science
Volume 13 - 2025 | https://doi.org/10.3389/fenvs.2025.1471213
This article is part of the Research Topic Nitrate from Field to Stream: Characterization and Mitigation View all 13 articles
Excessive nitrogen (N) input into the environment is a major contributor to the global contamination of drinking water sources and the eutrophication of aquatic ecosystems. This study investigated the impact of land use on nitrate loading in the Dunk River Watershed in Prince Edward Island, Canada, using the Soil and Water Assessment Tool (SWAT) by focusing on the role of red clover in potato rotation systems. Nitrogen uptake and accumulation of the main crops were refined using local measurements. The SWAT model estimated an annual average nitrate loading of 316 Mg N (or 22 kg N/ha) in the watershed. Although the potato–cereal–red clover (PBC) rotation land only accounted for 56% of the watershed, it contributed 90% of total nitrate loading, emphasizing the need to improve N-use efficiency. Annual nitrate loading varied with a coefficient of 24.8% but showed no significant long-term trend. Fluctuations were correlated with stream discharge and potato production area, as higher levels of both increased nitrate loading. Groundwater delivered approximately 98% of total nitrate loading. Red clover was estimated to accumulate 201 kg N/ha annually, comparable to the total N demand of potatoes in the region, contributing significant N to the crop rotation system. Substituting soybean for red clover in the PBC rotation resulted in a significant 16.7% reduction in nitrate loading. This reduction was driven by decreases in nitrate loading in potato (169.7–141.4 Mg N/yr.), cereal (77.3–70.5 Mg N/yr.), and red clover lands (36.8–0 Mg N/yr.), despite an increase in soybean land (5.9–26.5 Mg N/yr.). These findings highlight the importance of adequately accounting for N credits from red clover or substituting it with a crop that recycles less N, such as soybean, to enhance the sustainability of potato production. These findings also underscore the importance of properly modeling leguminous forages on nitrate loading estimations.
Nitrogen (N) is an important nutrient for crop growth and is utilized extensively worldwide to meet increasing food demand driven by population growth. However, excessive application and inefficient use of N fertilizer and/or leguminous green manure for crop production can result in significant nitrate leaching, leading to groundwater contamination (Meisinger and Delgado, 2002; Jiang et al., 2011). The discharge of nitrate-laden groundwater into receiving surface waters contributes to eutrophication worldwide (Hua et al., 2018; Vörösmarty et al., 2010; De Notaris et al., 2018; Peralta and Stockle, 2002; Prunty and Greenland, 1997; Torstensson et al., 2006; Zebarth et al., 2009). For example, the estuaries of Prince Edward Island (PEI), Canada, part of the Gulf of St. Lawrence, have experienced eutrophication due to excessive nitrate loading, with several dozen anoxic events documented from 2016 to 2021 by the PEI Government (PEI government). Continuous freshwater quality monitoring in PEI has revealed a noticeable upward trend in nitrate levels (Jiang et al., 2015). This correlates with significant transformations in agricultural land use during the early to mid-1990s, with potato farmland expanding from 11,982 ha in 1951 to 43,770 ha in 1996 (Bugden et al., 2014; Grizard et al., 2020). Intensive potato production has been linked to elevated nitrate loadings in groundwater and down-gradient estuaries on the island (Benson et al., 2006; Savard et al., 2007; Zebarth et al., 2015; Jiang et al., 2015).
Forage legumes, such as red clover and alfalfa, are commonly planted as rotation crops to improve soil organic matter, break pest cycles, control weeds, and provide N for subsequent cash crops (Vos et al., 2012; Myrbeck, 2014; Jahanzad et al., 2017; Kelling et al., 2019). However, failing to account for their N contributions can increase the risk of nitrate leaching (Neeteson, 1989; Wyngaarden et al., 2015; Koropeckyj-Cox et al., 2021). In PEI, potatoes are typically grown in rotation with cereals underseeded with red clover, which is plowed down in the fall of the third year (Jiang et al., 2015). Depending on biomass growth, red clover can fix substantial N, ranging from 121 to 266 kg N/ha (Jiang et al., 2019; 2022). This N supply can fully meet potato N demands (Jiang et al., 2019; Liang et al., 2019). Fertilizing potatoes without properly considering this N source led to overfertilization, increasing nitrate leaching risks while reducing tuber yields (Jiang et al., 2022; Whittaker et al., 2023). Similarly, Yang et al. (2024) found that red clover accumulated up to 240 kg N/ha, supplying sufficient N to subsequent corn crops, which achieved yields comparable to fertilized corn in Ontario, Canada.
Although field experiments have consistently demonstrated that the substantial N contribution of red clover in crop production systems was an important source of nitrate leaching to groundwater, few studies have explored the contribution of red clover on nitrate loading to down-gradient water courses worldwide. Water quality in down-gradient water bodies is the product of a large spatial and temporal scale integration of land use in the watershed and the associated physical, chemical, and biological interactions occurring therein (Jorgensen, 2002; Bowen et al., 2007). As a result, reducing N loadings requires integrated land use management. The nitrate loading derived from one red clover crop field may not be able to create a serious off-site water quality problem. Still, the accumulated contribution of nitrate loadings from multiple red clover fields could be substantial and problematic. Understanding the integrated effect of red clover fields on nitrate loading across a broader agricultural landscape is important for developing effective watershed management strategies. However, conducting full-scale experiments to quantify red clover’s influence on nitrate loading across watersheds is impractical due to the challenges of large-scale land management and potential long time lags between land use adjustments and water quality improvements (Jiang and Somers, 2009; Bouraoui and Grizzetti, 2014). The semi-distributed Soil and Water Assessment Tool (SWAT) simulates hydrological and water quality variables and crop growth at a watershed scale (Arnold and Fohrer, 2005; Arnold et al., 1998; Gassman et al., 2007), and can be used to evaluate the effects of land use on nitrate and other pollutant loadings (Akhavan et al., 2010; Cerro et al., 2014; Haas et al., 2017; Lee et al., 2017; Liang et al., 2020). SWAT requires intensive land use, crop growth, weather, field management, and topography data inputs. The uncertainties associated with model parameters and input data with SWAT can be translated into the predictions, compromising the quality of modeling results (Das et al., 2024; Tang et al., 2021). Using field measurements to constrain model parameters can reduce uncertainties (Salam et al., 2024). The objectives of this study were to: 1) develop a SWAT model in a representative agricultural watershed in PEI and 2) assess nitrate loadings in the watershed by focusing on the role of red clover in potato rotation systems.
The study was conducted in the Dunk River Watershed in PEI (Figure 1). The watershed has a total drainage area of 214 km2. However, this research focused on the area above the tidal point in the watershed, which covers an area of 143 km2. The area below the tidal point was excluded because there was no relevant stream flow or water quality data below this point. The topography is characterized by rolling hills, with slopes ranging from 2% to 10%, reaching a maximum elevation of 138 m above mean sea level in the eastern region. Geologically similar to other parts of the island, the watershed is entirely underlain by a sandstone formation consisting of a sequence of Permo-Carboniferous terrestrial red beds with a thickness of 1,200–1,600 m (van de Poll, 1989). The bedrock is covered by a layer of sandy glacial deposits ranging from 1 to 10 m in thickness. The uppermost portion (∼150 m) of the formations constitutes an unconfined fractured aquifer, which serves as the primary source of drinking water for residents and contributes to over 60% of the annual stream flow (Jiang and Somers, 2009). The water table exhibits relatively rapid responses to precipitation and snowmelt events, with observations indicating a 5-day lag between an increase in groundwater level and precipitation events under similar geological conditions (Liao et al., 2005; Paradis et al., 2006). The climate of the region is characterized as humid, with cool to moderate temperatures. Precipitation varies from 810 mm in 2006 to 1,463 mm in 2002. The 20-year climate average (2002–2020) stands at 1,265 mm, with an average annual snowfall of 300 mm.
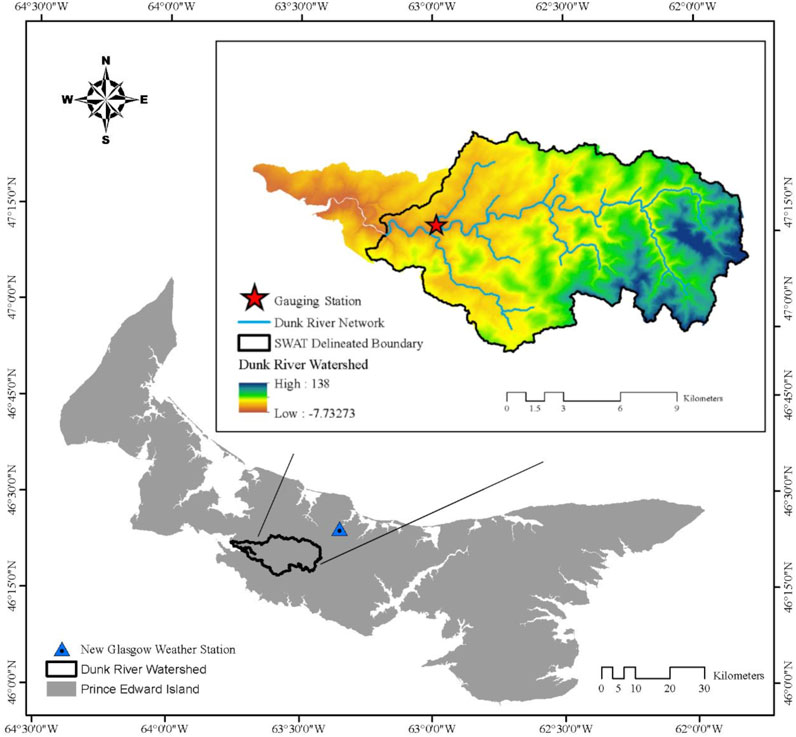
Figure 1. Location of the Dunk River Watershed.
The Alberry and Charlottetown (Orthic Humo-Ferric Podzol) series soils dominate the watershed, comprising 72% and 14% of its area, respectively. The Charlottetown soil series is moderately well-drained with a moderately coarse texture, while the Alberry soil series is well-drained with a coarse texture. These soils originated from local glacial till deposits. More detailed information on soil types is available at http://sis.agr.gc.ca/cansis/soils/pe/soils.html. The watershed exemplifies a typical intensively farmed watershed in PEI, with agricultural land covering the majority of the total land area. The majority of the agricultural land is dedicated to potato cultivation, often rotated with cereals and forages (Jiang et al., 2015).
The watershed is designated as one of four index basins in PEI due to its importance for environmental monitoring. Consequently, both Environment and Climate Change Canada (ECCC) and the Province share responsibility for monitoring activities in the area. ECCC has continuously monitored stream water levels and associated discharge since the 1960s. The gauging station, located approximately 3 km above the tidal point (Figure 1), covers a drainage area of about 112 km2 upstream. Since the 1980s, the Province has been monitoring stream water quality, typically collecting 6–9 samples annually at the gauging station for water quality analysis, with 5–9 samples taken during the growing season (GS = May–Oct.) and 0–2 samples during the non-growing season (NGS = Nov.–Apr.). Agriculture and Agri-Food Canada (AAFC) has conducted crop cover inventories in PEI since 2011, providing valuable land use data for the watershed (Agriculture and Agri-Food Canada, 2010). With access to stream flow, water quality, and land use data since 2011, SWAT modeling was set to span the period from 2011 to 2020. Throughout the study period, a total of 75 water quality samples were collected, with 65 samples obtained during the GS and 12 during the NGS. The minimum daily nitrate concentration and loading were recorded at 2.4 mg N/L and 214 kg N/day, respectively, reaching a peak of 5.9 mg N/L and 1,310 kg N/day during the GS. During the NGS, the minimum nitrate concentration and loading were 3.1 mg N/L and 288 kg N/day, respectively, while the maximum nitrate concentration and loading were 5 mg N/L and 2043 kg N/day. The watershed has documented surface and groundwater nitrate enrichment issues (Bugden et al., 2014; Jiang et al., 2015; Grizard et al., 2020). Nitrate loading estimated using an integrated model was 23 kg N/ha in the watershed (Jiang et al., 2015), and a 30% reduction in nitrate loading is required to meet the estuarine N target set by the Province (Bugden et al., 2014).
The SWAT model requires various inputs, including weather, soil, land use, crop information, agricultural practices, and topography. For weather data, the weather records from the New Glasgow station (46.41°, 63.35°), located 13 km northeast of the watershed, were used. Soil data were obtained from the National Soil Database of Canada (NSDB), and annual land use data were obtained from the AAFC’s 2011–2020 Annual Crop Inventory maps (Agriculture and Agri-Food Canada, 2010). Single-year land use datasets have been widely employed in SWAT modeling (El-Khoury et al., 2015; Sith et al., 2019; Yang et al., 2016). The reliability of model predictions is influenced by how well the model’s land usage aligns with temporal changes in land use (Pai and Saraswat, 2011). Previous studies have shown that single-year land use datasets, though widely used, compromised modeling accuracy while incorporating dynamic land use data improved predictions (Wang et al., 2018; Qi et al., 2015). The SWAT model spanned the 2011–2020 period. Because the dominance of agricultural and forested terrain, and nitrate loading from onsite septic systems was estimated to be as low as 2.4% of total nitrate loading in a previous study (Jiang et al., 2015), the impact of septic systems on nitrate loading was not explicitly simulated. Tile drains were not commonly adopted in PEI due to the well-drained sandy soils, and thus, were not simulated either.
The model divides a watershed into subbasins, which were then subdivided into hydrologic response units (HRUs) with homogeneous land use, soil, and slope characteristics (Ullrich and Volk, 2009). Hydrological and chemical parameters at the subbasin level are obtained by aggregating or calculating area-averaged values of the HRUs, serving as the primary calculation unit in SWAT. The main channel and watershed outputs are determined by implementing channel processes on the inputs to the channels. The fractured bedrock aquifer was conceptualized as a shallow unconfined layer and a deep confined layer and parameterized using the data in Jiang and Somers (2009). Model setup was performed using the ArcSWAT 2012 interface in ArcGIS 10.5.1. The watershed was divided into 29 subbasins by SWAT and further separated into 707 HRUs based on the homogeneity of land use, soil, and slope classes, using thresholds of 5%, 10%, and 15%, respectively.
In PEI red clover is commonly planted in rotation with potatoes as a green manure crop (Prince Edward Island Agricultural Insurance Corporation, 2022; Jiang et al., 2024). Red clover can accumulate a substantial amount of N through biological fixation and uptake (Liang et al., 2019; Jiang et al., 2022). Because red clover was widely planted as a rotation crop, accurately modeling N fixation, uptake, and transformation of red clover can have significant implications for overall N cycling within the watershed. While the annual crop inventory of land use has records of the most important crops, it did not explicitly map out the red clover crop coverage. Red clover is grouped along with other forages and pastures under the broad category of ‘pasture’. Directly importing this land use data into SWAT precludes assessing the contribution of red clover to nitrate loading and misrepresents N cycling in the watershed. To address this issue, the temporal cropping sequence of the local industry standard potato–cereal–forage rotation was used to separate the red clover that was planted in rotation with potato from the broad pasture category. Red clover, when followed by potato, was reclassified as “red clover planted in rotation with potato”. In some cases, the forages in the potato rotation were a mix of perennial grasses like timothies or ryes in addition to red clover. These forages were treated as “red clover” in SWAT modeling for simplification.
As the default plant N uptake parameters in SWAT may generate unrealistic plant N accumulations in the main crops (i.e., potato, barley, and red clover), measurements of crop biomass and N accumulation made in a field experiment conducted in the AAFC Harrington Research Farms (46.341°N and 63.3°W) from 2014 to 2017 were used to redefine the model parameters that control plant biomass and N uptake during model calibration. The experiment included the local industry standard potato–barley–red clover rotation (referred to as PBC rotation) and alternative potato–soybean–barley rotation (referred to as PSB rotation) as the main factor and four commonly planted potato cultivars (i.e., Russet Burbank, Shepody, Kennebec, and Gold Rush) in PEI as the second factor. The experiment details and results can be found in Liang et al. (2019) and Azimi et al. (2022). The parameters controlling plant biomass and N uptake including radiation-use efficiency or biomass-energy ratio (BIO_E), normal fraction of N in yield (CNYLD), normal fraction of N in plant biomass at emergence, 50% maturity, and maturity (PLTNFR_1, PLTNFR_2, PLTNFR_3) were adjusted to allow the crop N accumulation and biomass match the field measurements.
Daily stream discharge and nitrate loadings were calibrated with the measured data using the SUFI-2 algorithm within the SWAT Calibration and Uncertainty Procedure (SWAT-CUP 2019; Abbaspour, 2015). The model was stabilized using a 3-year warm-up period (2008–2010), followed by calibration from 2011 to 2017, and subsequent validation from 2017 to 2020. To prioritize sensitive parameters, a Global Sensitivity Analysis approach was employed to analyze streamflow and N data (Abbaspour et al., 2004). The Global Sensitivity Analysis technique was utilized to assess the impact of individual parameter changes on the objective function (Nash-Sutcliffe efficiency) while keeping other parameters constant (Equation 1).
This method involves the use of regression coefficients (α and βi), a calibration parameter (bi), and the number of parameters considered (m). The advantage of this method is its speed and relative sensitivity evaluation, as opposed to absolute sensitivity. The two statistical measures were used in SWAT-CUP to assess sensitivity are the t-stat index, which indicates the extent of parameter sensitivity (larger absolute values signify greater sensitivity), and the p-value, which determines the most sensitive parameters with p < 0.05 (Abbaspour et al., 2004; Brighenti et al., 2019).
The Nash-Sutcliffe efficiency (NS), percent bias (PBIAS), and coefficient of determination R2 were employed to assess the goodness-of-fit of the SWAT model prediction for streamflow and nitrate N loading (Moriasi et al., 2007). The numeric scale of NS spans from -∞ to 1, with 1 signifying a perfect correspondence between simulation and observation. The PBIAS measures the average tendency of the model-predicted data to be higher or lower than their measured values. A low-magnitude PBIAS suggests superior simulation, with zero being the optimal value. Positive PBIAS values suggest model underestimation, while negative values imply model overestimation (Gupta et al., 1999). R2 is a statistical measure representing the proportion of the variance in the dependent variable that is predictable from the independent variables. It is a value between 0 and 1, with a value of 1 indicating a perfect fit between the observed and predicted values (Neter et al., 1996).
R2 and NS (Nash-Sutcliffe) stand out as two frequently employed statistical metrics for assessing the performance of hydrological models in simulating streamflow. However, these metrics are sensitive to extreme values, particularly peak flows resulting from runoff events, which could lead to an inaccurate assessment of model performance during low-flow periods (Krause et al., 2005; Pushpalatha et al., 2012). Consequently, their application in calibration may be biased towards high-flow periods, whereas this study primarily focuses on low-flow periods. A common method to alleviate the impact of runoff events on model calibration is the logarithmic transformation of streamflow values. Gupta et al. (1998) suggested that logarithmic transformation accentuates low flows and attenuates high flows, thereby enhancing sensitivity to changes in low-flow conditions. Therefore, log-transformed streamflow was employed in the calibration process.
The validated SWAT model was employed to calculate the average annual nitrate loading rates for various land uses from 2011 to 2020. These loading rates were further partitioned into components representing surface water (SW), lateral flow (LF), and groundwater (GW) pathways within both the GS and NGS. Additionally, the model was utilized to compute the seasonal and yearly total nitrate loadings for each land use type over the same period (2011–2020). These comprehensive data sets were then used to characterize and assess the impact of different land uses on nitrate loading in the watershed.
Local field studies indicated that the majority of N from plowed-down red clover is released during the subsequent potato season, increasing the risk of excessive nitrate leaching and reduced potato tuber yield (Jiang et al., 2019; Azimi et al., 2022; Jiang et al., 2022). However, it remains uncertain whether the SWAT can accurately model this cross-year effect of red clover N cycling and the subsurface fate and transport of nitrate from the soil to the Dunk River. To address this question, the validated SWAT model was employed to forecast changes in nitrate loading when soybean replaced red clover in the PBC rotation. As soybean recycles significantly less N into the soil compared to red clover, this substitution effectively represents a reduction in red clover-derived N input. If the simulation demonstrates decreased nitrate loading during the potato and cereal phases, it would suggest that SWAT can capture the cross-year effect and subsurface processes; if not, it may indicate limitations in the model’s capabilities. Furthermore, Liang et al. (2019) found that substituting soybean for red clover in potato rotations enhanced N use efficiency by up to 1.6 times and increased potato tuber yield by 13.4%. This finding suggests that soybean is a more environmentally and economically sustainable rotation crop. The simulation will illustrate the potential for nitrate loading reduction by adopting soybean as a rotation crop in the watershed, offering valuable insights into nitrate mitigation management strategies.
From 2011 to 2020, agricultural land covered an average of 116 km2 annually, representing 81.5% of the watershed area, with minor yearly variations (Figure 2). Each year, potato land occupied 16.7%–34.3% (average = 25.3%) of the watershed area. Potatoes were typically cultivated in a 3-year rotation with cereals and red clover. Cereals were mainly planted in rotation with potatoes, constituting 18.3% of the watershed area annually. The most common cereal was barley, with lesser amounts of rye and winter wheat. On average, 13.3% of the watershed was planted with red clover in rotation with potatoes each year. Red clover coverage peaked at 22.2% in 2014 and declined to a minimum of 16.6% in 2013. Due to the reclassification algorithm, which separated red clover from the perennial land use (pasture) category, the average proportion of “pasture” decreased from 35.3% to 22%. The annual average of potato rotation production land, which is approximately the total of potato, cereal, and red clover lands accounted for 57% of the area in the watershed. Potato rotation land area stayed relatively stable over time but the areas of potato, cereal, and red clover varied to some extent from year to year. Corn and soybeans were also planted in the watershed but occupied very small areas (Figure 2). General agricultural land refers to land where the annual crop cover inventory could not identify the agricultural products and covered relatively small areas (i.e., 0.1%). Buckwheat and brown mustard were planted in rotation with potatoes in the watershed to control the wireworm population (Jiang et al., 2022), but they were not identified in the crop inventory. These crops were likely grouped into other crop cover classes as they could not be accurately identified from satellite images. However, these crops typically require low N input, so the misclassifications are expected to have a minimal impact on overall nitrate loading estimations.
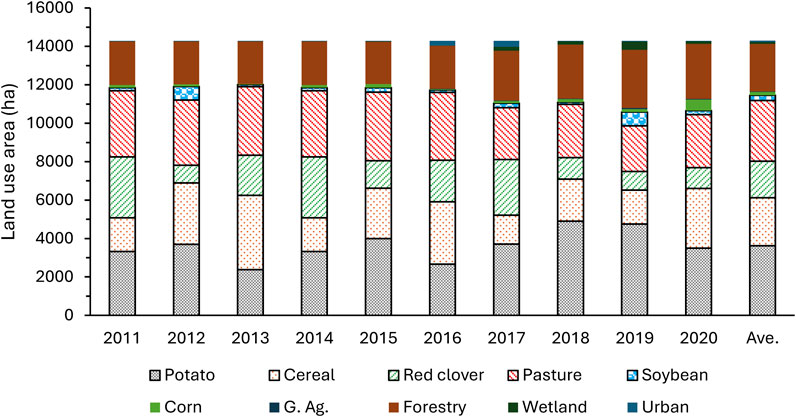
Figure 2. Land use in the Dunk River Watershed from 2011 to 2020, based on annual national crop cover inventory and land use reclassification analysis.
Using the default plant N uptake parameters (Table 1), the estimated plant N accumulations were 221 kg N/ha for potato, 110 kg N/ha for cereal (mainly barley), 829 kg N/ha for red clover, 44.8 kg N/ha for pasture, and 339 kg N/ha for soybean. While the default value for potato closely matched the expected N content, significant discrepancies were observed for red clover, soybean, and barley compared to reference plant N uptake values. Based on reference values (Azimi et al., 2022; Liang et al., 2019), the N accumulation estimates for cereal, red clover, pasture, and soybean were adjusted to 87.2, 201, 40, and 230 kg N/ha, respectively, while the value for potato remained unchanged. The default parameter for red clover resulted in a substantial overestimation of N accumulation, approximately 400% higher than the expected value. Similarly, the simulated N accumulation for soybeans exceeded the reference value (224 kg N/ha) by 51%. For barley, the model overpredicted N accumulation by 26% relative to the reference value of 87.5 kg N/ha. Note that N accumulation in the main crops varied by field and year due to differences in weather, management practices, and pressures from diseases, pests, and weeds. However, expected values were used in the model for simplification.
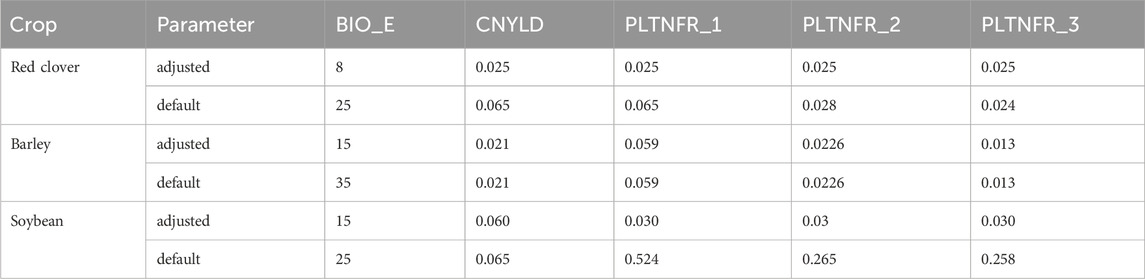
Table 1. Plant parameters for the main crops planted in rotation with potatoes.
The default parameters yielded an annual plant N accumulation of 3,070 Mg N/yr. in the watershed. After adjusting the parameters, the annual plant N accumulation in the watershed decreased by 46%, to 1,642 Mg N/yr. The use of the default model parameters substantially overestimated plant N accumulation by 87%. This overestimation can translate into an unrealistic overabundance of N input into the system along with crop residues recycled back into the soil, leading to unrealistic N leaching and loading estimates from plant residues. Various compensatory factors for excessive N input (e.g., excessive denitrification, decreasing automated fertilization operation, and ignoring legume N fixation) may cancel out the overestimation effect, creating a “good” model fit. However, these compensatory effects would inevitably lead to a misrepresentation of N cycling in the watershed, which could increase the risk of developing unreliable management strategies for reducing nitrate loading. This highlights the often-overlooked importance of constraining plant N uptake parameters using local field measurements.
Observed and simulated stream discharge and nitrate loading are shown in Figures 3, 4. The indicators of model performance are summarized in Table 2. During the calibration period, the model-predicted streamflow performance measured by NS, PBIAS, and R2 values was 0.6%, 17.4%, and 0.65, respectively. Similar results were observed during the validation period, with NS, PBIAS, and R2 values of 0.59%, 11%, and 0.61. For baseflow, the model showed a lower NS value of 0.43 during calibration, but PBIAS and R2 values were 8.6% and 0.6, respectively, indicating relatively accurate baseflow estimation. Baseflow estimation performance improved during the validation period, with NS, PBIAS, and R2 of 0.62%, −5.6%, and 0.68, respectively, which is comparable to the accuracy of surface flow estimation. Over the calibration period, the model accurately predicted nitrate loadings with NS, PBIAS, and R2 of 0.71%, 6.5%, and 0.7, respectively. Similar measures were obtained during the validation period, with NS, PBIAS, and R2 being 0.67%, −5.5%, and 0.68, respectively. Moriasi et al. (2007) suggested that a model is considered to have satisfactory performance if the monthly R2 value is greater than 0.50, and the PBIAS is within the range of ±25%. However, when a model is calibrated using daily time steps, its performance may be lower than that of a monthly time step model (White and Chaubey, 2005). Wang et al. (2016) proposed that a model calibrated at a daily time step should have R2 and NS values higher than 0.30 to be considered acceptable.
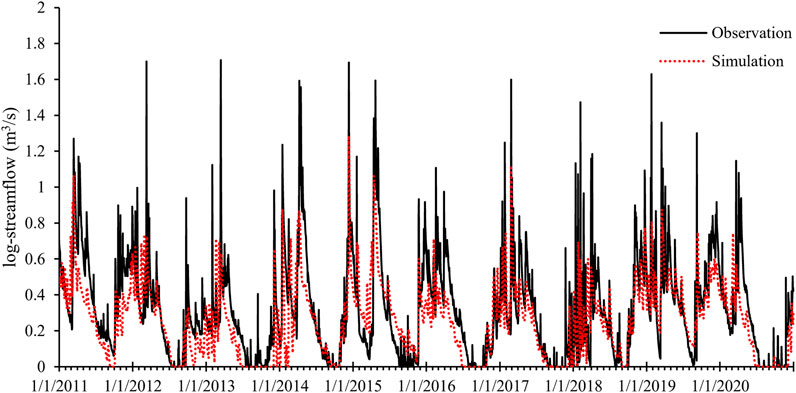
Figure 3. Comparison of observed and simulated daily streamflow in the Dunk River.
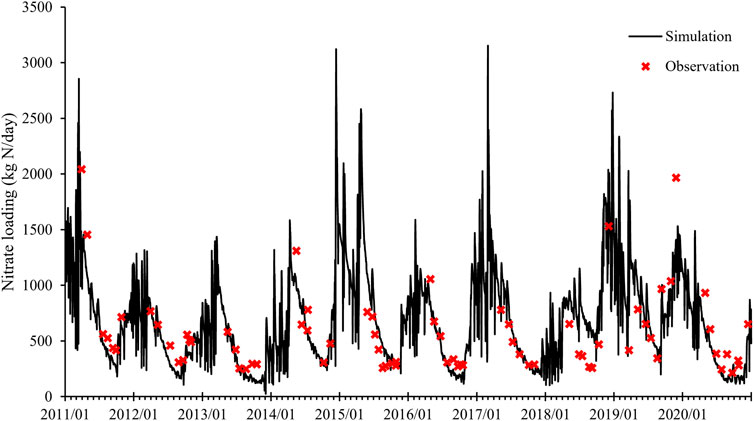
Figure 4. Comparison of observed and simulated daily nitrate loadings in the Dunk River.
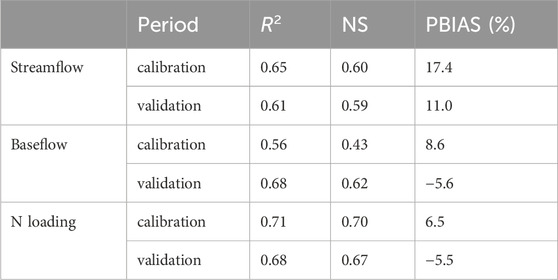
Table 2. Goodness-of-fit of SWAT modeling.
The lower NS value for predicted baseflow during calibration can be attributed to its smaller weight assigned in the objective function during model calibration compared to streamflow and total nitrate loading. However, small PBIAS values for baseflow estimation indicated that the model did not overestimate or underestimate streamflow during dry periods when baseflow was the sole nutrient delivery path. The inclusion of baseflow in model calibration also prevented the model from compensating for any nitrate load underestimations through overestimating nitrate supply. Similar changes in PBIAS from the calibration to the validation period for both baseflow and nitrate loading may reflect the correlation between baseflow and nitrate load during dry periods. Overall, the SWAT model successfully predicted daily streamflow, nitrate loading, and baseflow based on the criteria outlined by Moriasi et al. (2007). The measurements of nitrate concentration during the NGS were limited, and increasing sampling points in the NGS could potentially enhance SWAT calibration.
On an annual basis, average nitrate loading rates from potato, cereal, red clover, pasture, soybean, corn, and general agricultural lands were calculated to be 46.8, 30.7, 19.3, 3.4, 20.9, 32.2, and 21.4 kg N/ha, respectively (Table 3). Generally, agricultural lands had higher nitrate loading rates than forested land or wetlands. Urban land also had a high nitrate loading rate likely as a result of onsite sewage disposal. The variation in nitrate loading among different land uses underscores the importance of incorporating diverse land uses and preserving natural lands to maintain the ecological sustainability of agricultural watersheds. The GS nitrate loading rates of potato, cereal, and red clover lands were predicted to be 15.5, 15.9, and 6.4 kg N/ha, respectively, compared to 31.3, 14.8, and 12.9 kg N/ha during the NGS. The NGS nitrate loading rates of potato and red clover lands were 102% and 101% higher than the GS values (Table 3). The NGS nitrate loading rate from each land use was generally higher than the GS nitrate loading rate.

Table 3. Land use-based nitrate loading rates in the Dunk River Watershed (averages of 2011–2020).
Total nitrate loading into the Dunk River above the tidal point, which was defined as the sum of the nitrate loading from each HRU, was 316 Mg N/yr., equivalent to a global nitrate loading rate of 22 kg N/ha (Figures 5, 6). This rate is similar to the rate of 23 kg N/ha calculated using an integrated nitrate loading model (Jiang et al., 2015). The limitation of the integrated model is that it could not predict temporospatial variations of nitrate loading across the watershed as SWAT does. As the dominant crop, covering 25.3% of the watershed, potato land contributed 169.7 Mg N/yr. of nitrate loading, accounting for 53.7% of the total nitrate loading (Figure 5). The other major crops, including cereals, red clover, pasture, and soybean, contributed 77.3, 36.8, 10.6, and 5.9 Mg N/yr., respectively. Cereal land ranked as the second-highest contributor, accounting for 24.5%, followed by red clover land, contributing 11.6% of total nitrate loading. Other land uses collectively generated only 4.9% (i.e., 15.7 Mg N/yr.) nitrate loading. Nitrate loading from the onsite septic systems was estimated to be 8.1 Mg N/yr. (0.57 kg N/ha) in the watershed (Jiang et al., 2015). The nitrate loading from other land uses was assumed to include the nitrate loading from the septic systems. Although the PBC rotation land only occupied 56% of the watershed area, it contributed about 90% of the nitrate loading (Figure 5). The results emphasize the importance of improving N use efficiency of potato rotation production for mitigating nitrate loading in the Dunk River Watershed.
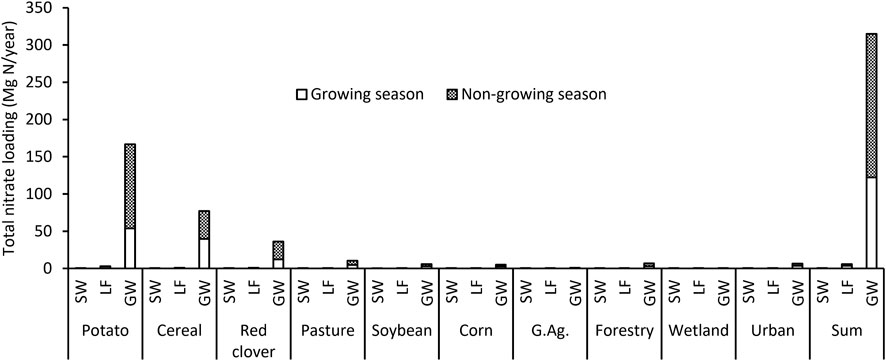
Figure 5. Average nitrate loadings from 2011 to 2020 in the Dunk River Watershed. (SW, LF, and GW represent surface water, lateral flow, and groundwater paths, respectively).
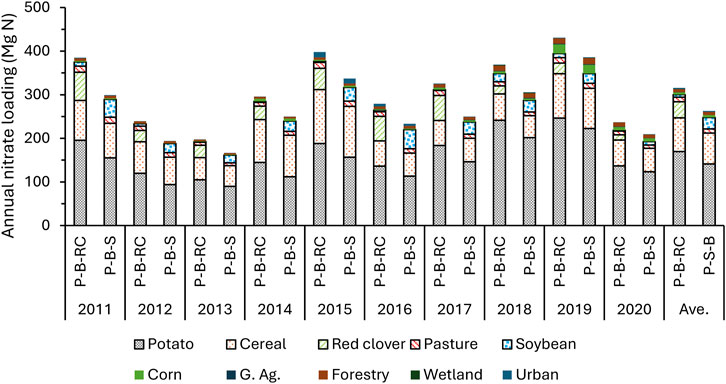
Figure 6. Comparison of annual nitrate loadings under different crop rotation scenarios in the Dunk River Watershed (PBC refers to potato production following the potato–barley–red clover rotation; PBS refers to potato production following the potato–barley–soybean rotation).
These results agree with the findings of Jiang et al. (2015), who estimated that 75%–98% of nitrate loading in receiving estuaries originated from potato-rotated lands in intensively farmed watersheds in PEI. This included potato land, the red clover, and cereal lands, which were in rotation with potatoes. These results also align with the widely accepted notion that agricultural land is the primary contributor to nitrate pollution in PEI’s agricultural watersheds (Grizard et al., 2020; Jiang and Somers, 2009; Jiang et al., 2015; Liang et al., 2019). The fact that agricultural land has the most profound impact on water quality is consistent with Kersebaum et al. (2003) who indicated that agriculture is estimated to be responsible for 55% of non-point source pollution in the European Union. These findings support earlier studies by Haidary et al. (2013), revealing a significant negative correlation between water pollution and forest land coverage. Baker (1992) highlighted that undisturbed forests have a relatively minor impact on water quality compared to other land uses.
Surface runoff (SW), lateral flow (LF), and groundwater discharge (GW) paths delivered 0.03%, 1.8%, and 98.2% of the total nitrate loading, respectively, in the Dunk River Watershed (Figure 5), indicating that groundwater is the primary flow path of nitrate loading delivery. The results can be attributed to several factors. Firstly, nitrate loading is proportional to streamflow, and over 66% of annual streamflow and 100% of GS streamflow in PEI is derived from groundwater discharge (Figures 3, 4; Jiang et al., 2015). Secondly, fertilizer is commonly banded in the soil in PEI, reducing the risk of fertilizer being washed away by surface runoff (Jiang et al., 2015). When fertilizer is broadcast, it is normally applied when soils are not saturated. In this case, there is sufficient infiltrating water to carry the bulk of the nitrate to a depth where it is not vulnerable to surface runoff before the soils are saturated and runoff occurs, resulting in low nitrate levels in surface runoff (Baker, 2001). Thirdly, nitrate losses from manure runoff were negligible because manure applications were limited (Jiang et al., 2015). The finding about surface runoff contributing to low nitrate loadings aligns with field observations from former studies in PEI (Dunn et al., 2011; Jiang et al., 2015; Pavlovskii et al., 2023). Additionally, local field experiments have consistently demonstrated that nitrate leaching is the primary pathway of N losses from potato production systems (Jiang et al., 2019; 2022). Groundwater is the primary flow path of nitrate loading to surface water worldwide (Bachman et al., 1998; Schilling and Zhang, 2004; Steiness et al., 2021; Wherry et al., 2021).
Nitrate loadings in the main crops (potatoes, cereals, and red clovers) exhibited seasonal variations throughout the study period (Figure 7). The GS and NGS variation coefficients for nitrate loadings in these three primary croplands were 0.46, 0.41, and 0.5 for GS, and 0.26, 0.29, and 0.61 for NGS, respectively. However, neither GS nor NGS nitrate loadings demonstrated a significant long-term trend (p > 0.2). On average, nitrate loadings fluctuated seasonally, with 39% of the annual nitrate loading occurring during the GS and 61% during the NGS (Figure 5). Because the magnitude of nitrate loading is primarily governed by streamflow rate, NGS nitrate loading being higher than GS nitrate loading can be explained by NGS streamflow rate being higher than GS streamflow rate (Figure 3). On an annual basis, nitrate loadings varied from the highest of 431 Mg N in 2019 to the lowest of 197 Mg N in 2013 at a variation coefficient of 24.8%. The seasonal and yearly fluctuations were mainly driven by stream discharge and potato production area variations, with nitrate loading increasing with higher stream discharge and potato production area (Figures 2–4). The annual potato production area explained 51% of the variation in nitrate loading (p = 0.02). The significant impact of annual land use changes underscores the necessity of accounting for temporal variations in land use when modeling nitrate loading dynamics. The relative rapid response of nitrate loading to land use change implies that most nitrate loadings were delivered via shallow groundwater in the fractured bedrock aquifer, which has a relatively short residence time (Jiang and Somers, 2009). The yearly nitrate loadings from 2011 to 2020 as shown in Figure 6 did not demonstrate a significant long-term temporal trend (p = 0.6). The absence of a long-term trend was attributed to the lack of systematic changes in key influential factors, such as land use and hydrology (Figures 2, 3), throughout the study period.
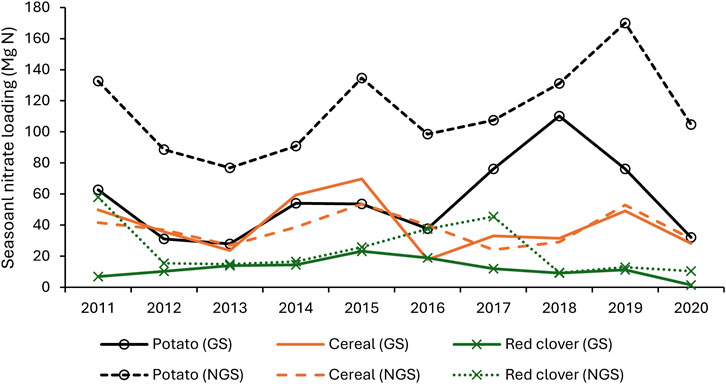
Figure 7. Seasonal nitrate loadings from the main crops in the Dunk River Watershed. (GS and NGS stand for growing season and non-growing season, respectively)
Substituting red clover with soybean in the PBC rotation across the watershed significantly reduced nitrate loading by 16.8% in the Dunk River Watershed from 316 Mg N/yr. (i.e., 22 kg N/ha) to 263 Mg N/yr. (i.e., 18.4 kg N/ha) (paired t-test p < 0.0001) (Figure 6). This reduction alone contributed to over 50% of the total estuarine N loading reduction target of 30% set by the Province (Bugden et al., 2014). This reduction in nitrate loading was caused by nitrate loading reduction from the potato, cereal, and red clover lands from 169.7, 77.3, and 36.8 Mg N/yr. to 141.4, 70.5, and 0 Mg N/yr., respectively, increase in nitrate loading from the soybean land from 5.9 to 26.5 kg N/yr., and minor changes in nitrate loading from the other land uses. Because cereal, red clover, and soybean were planted in rotation with potatoes, the cereal, red clover, and soybean residues were recycled into the soil. The recycled crop residues were mineralized and then released nitrate, which could be transported to groundwater, used by the following crops, or denitrified. These subsurface processes can have annual effects on nitrate loading, contributing to nitrate loading changes not only in red clover and soybean lands but also in the potato and cereal lands. After SWAT calibration and validation, the red clover and soybean had annual N fixation rates of 134.5 kg N/ha and 193.2 kg N/ha, and similar plant N uptake of 229 kg N/ha and 201 kg N/ha, respectively. However, most of the soybean’s N is harvested and removed from the field as soybean grains, while the red clover is commonly plowed down as green manure, being left in the soil. The lower level of N in the recycled soybean residues created less nitrate loading on a field and watershed scale. Although SWAT adopted simplified groundwater mass transport equations instead of classic advection-dispersion equations (Arnold and Fohrer, 2005), the simulations of changes in nitrate loading from replacing red clover with soybean respected the complicated pathways and subsurface processes to some extent.
Potato growers in PEI commonly followed the provincial government’s recommendation of applying 185 kg N/ha to processing potatoes, with deductions of 17 kg N/ha for N credits from plowed-down red clover (where applicable) and an additional 17 kg N/ha for N credits from soil organic matter (PEI government, 2014; Jiang et al., 2024). However, several local studies (Jiang et al., 2019; 2022; Liang et al., 2019; Azimi et al., 2022; Whittaker et al., 2023) observed that N accumulation in red clover ranged from 121 to 266 kg N/ha. Because most of this N is expected to be released in the following potato-growing season (Wyngaarden et al., 2015; Masunga et al., 2016), adhering to the provincial recommendation of 17 kg N/ha would often result in excessive N application, significantly increasing the risk excessive of nitrate leaching and subsequent nitrate loading. The simulated changes in nitrate loading were compatible with these field observations. These findings highlight the need to adjust N inputs for potatoes by adequately accounting for N contributions from red clover, which is crucial for mitigating nitrate loading in the Dunk River Watershed.
The SWAT model estimated an average annual nitrate loading of 316 Mg N from 2011 to 2020 in the Dunk River Watershed, corresponding to a loading rate of 22 kg N/ha. The PBC rotation, covering 56% of the watershed, contributed 90% of the total nitrate loading. Seasonal variations in nitrate loading were evident, with 39% occurring during the growing season and 61% during the non-growing season. Annual nitrate loading fluctuated between 197 Mg N in 2013 and 431 Mg N in 2019, with a coefficient of variation of 24.8%, but did not demonstrate a significant long-term temporal trend. These annual fluctuations correlated with stream discharge and potato production area, as higher values of both led to increased nitrate loading. Groundwater discharge accounted for approximately 98% of nitrate loading, highlighting the critical role of groundwater in delivering nitrate to the river.
Red clover was estimated to accumulate 201 kg N/ha annually, comparable to the total N demand of potatoes in the region, contributing significantly to the PBC rotation. Substituting red clover in the PBC rotation with soybean across the watershed significantly reduced nitrate loading by 16.7% while introducing soybean as a cash crop to increase farm profitability. This reduction in nitrate loading was mainly affected by decreases in potato (169.7–141.4 Mg N/yr.), cereal (77.3–70.5 Mg N/yr.), and red clover lands (36.8–0 Mg N/yr.), while nitrate loading in soybean land increased from 5.9 to 26.5 kg N/yr. These findings emphasize the importance of adequately accounting for N credits from red clover in the production system or substituting it with a crop that recycles less N into the production system for sustainable potato production in the watershed. These findings also underscore the importance of properly modeling leguminous forages on nitrate loading estimations.
Publicly available datasets were analyzed in this study. This data can be found here: The sources are listed in the reference.
YJ: Conceptualization, Formal Analysis, Funding acquisition, Investigation, Methodology, Project administration, Resources, Supervision, Validation, Visualization, Writing–original draft, Writing–review and editing. MA: Formal Analysis, Investigation, Methodology, Validation, Visualization, Writing–original draft, Writing–review and editing. F-rM: Conceptualization, Formal Analysis, Investigation, Methodology, Project administration, Supervision, Validation, Visualization, Writing–original draft, Writing–review and editing, Resources. KL: Formal Analysis, Investigation, Methodology, Validation, Visualization, Writing–review and editing.
The author(s) declare that financial support was received for the research and/or publication of this article. This study was funded by the Agriculture and Agri-Food Canada Living Laboratories Initiative.
We would like to express our appreciation to Andrea McKenna, Executive Director at the East Prince Agri-Environment Association for her invaluable support throughout this project. The manuscript was improved thanks to comments from the two reviewers.
The authors declare that the research was conducted in the absence of any commercial or financial relationships that could be construed as a potential conflict of interest.
The author(s) declared that they were an editorial board member of Frontiers, at the time of submission. This had no impact on the peer review process and the final decision.
All claims expressed in this article are solely those of the authors and do not necessarily represent those of their affiliated organizations, or those of the publisher, the editors and the reviewers. Any product that may be evaluated in this article, or claim that may be made by its manufacturer, is not guaranteed or endorsed by the publisher.
Abbaspour, K. C. (2015). “SWAT-CUP: SWAT calibration and uncertainty programs—a user manual,” Eawag Dübend. 16–70.
Abbaspour, K. C., Johnson, C., and Van Genuchten, M. T. (2004). Estimating uncertain flow and transport parameters using a sequential uncertainty fitting procedure. Vadose Zone J. 3, 1340–1352. doi:10.2136/vzj2004.1340
Agriculture and Agri-Food Canada (AAFC) (2010). Available online at: https://open.canada.ca/data/en/dataset/ba2645d5-4458-414d-b196-6303ac06c1c9.
Akhavan, S., Abedi-Koupai, J., Mousavi, S.-F., Afyuni, M., Eslamian, S.-S., and Abbaspour, K. C. (2010). Application of SWAT model to investigate nitrate leaching in Hamadan–Bahar Watershed, Iran, Agric. Ecosyst. Environ. 139, 675–688. doi:10.1016/j.agee.2010.10.015
Arnold, J. G., and Fohrer, N. (2005). SWAT2000: current capabilities and research opportunities in applied watershed modelling. Hydrol. Process. 19, 563–572. doi:10.1002/hyp.5611
Arnold, J. G., Srinivasan, R., Muttiah, R. S., and Williams, J. R. (1998). Large area hydrologic modeling and assessment part I: model development 1. JAWRA J. Am. Water Resour. Assoc. 34, 73–89. doi:10.1111/j.1752-1688.1998.tb05961.x
Azimi, M. A., Jiang, Y., Meng, F.-R., and Liang, K. (2022). Yield responses of four common potato cultivars to an industry standard and alternative rotation in Atlantic Canada. Am. J. Potato Res. 99, 206–216. doi:10.1007/s12230-022-09873-4
Bachman, L. J., Lindsey, B. D., Brakebill, J. W., and Powars, D. S. (1998). Ground-water discharge and base-flow nitrate loads of nontidal streams, and their relation to a hydrogeomorphic classification of the chesapeake bay watershed, middle atlantic coast. Reston, Virginia: U.S. Geological Survey Water-Resources Investigations Report, 98–4059.
Baker, J. L. (2001). Limitations of improved nitrogen management to reduce nitrate leaching and increase use efficiency. Sci. World J. 1, 10–16. doi:10.1100/tsw.2001.457
Baker, L. A. (1992). Introduction to nonpoint source pollution in the United States and prospects for wetland use. Ecol. Eng. 1, 1–26. doi:10.1016/0925-8574(92)90023-u
Benson, V. S., VanLeeuwen, J. A., Sanchez, J., Dohoo, I. R., and Somers, G. H. (2006). Spatial analysis of land use impact on ground water nitrate concentrations. J. Environ. Qual. 35, 421–432. doi:10.2134/jeq2005.0115
Bouraoui, F., and Grizzetti, B. (2014). Modelling mitigation options to reduce diffuse nitrogen water pollution from agriculture. Sci. Total Environ. 468-469, 1267–1277. doi:10.1016/j.scitotenv.2013.07.066
Bowen, J. L., Kroeger, K. D., Tomasky, G., Pabich, W. J., Cole, M. L., Carmichael, R. H., et al. (2007). A review of land-sea coupling by groundwater discharge of nitrogen to New England estuaries: mechanisms and effects. Appl. Geochem. 22, 175–191. doi:10.1016/j.apgeochem.2006.09.002
Brighenti, T. M., Bonumá, N. B., Grison, F., de Almeida Mota, A., Kobiyama, M., and Chaffe, P. L. B. (2019). Two calibration methods for modeling streamflow and suspended sediment with the swat model. Ecol. Eng. 127, 103–113. doi:10.1016/j.ecoleng.2018.11.007
Bugden, G., Jiang, Y., van den Heuvel, M. R., Vandermeulen, H., MacQuarrie, K. T. B., Crane, C., et al. (2014). Nitrogen loading criteria for estuaries in Prince edward island. Canada: Canadian Technical Report of Fisheries and Aquatic Sciences 3066, Department of Fishery and Ocean.
Cerro, I., Antigüedad, I., Srinavasan, R., Sauvage, S., Volk, M., and Sanchez-Perez, J. M. (2014). Simulating land management options to reduce nitrate pollution in an agricultural watershed dominated by an alluvial aquifer. J. Environ. Qual. 43, 67–74. doi:10.2134/jeq2011.0393
Das, S. K., Ahsan, A., Khan, M. H. R. B., Yilmaz, A. G., Ahmed, S., Imteaz, M., et al. (2024). Calibration, validation and uncertainty analysis of a SWAT water quality model. Appl. Water Sci. 14, 86. doi:10.1007/s13201-024-02138-x
De Notaris, C., Rasmussen, J., Sørensen, P., and Olesen, J. E. (2018). Nitrogen leaching: a crop rotation perspective on the effect of N surplus, field management and use of catch crops. Agric. Ecosyst. Environ. 255, 1–11. doi:10.1016/j.agee.2017.12.009
Dunn, A., Julien, G., Ernst, W., Cook, A., Doe, K., and Jackman, P. (2011). Evaluation of buffer zone effectiveness in mitigating the risks associated with agricultural runoff in Prince Edward Island. Sci. Total Environ. 409, 868–882. doi:10.1016/j.scitotenv.2010.11.011
El-Khoury, A., Seidou, O., Lapen, D., Que, Z., Mohammadian, M., Sunohara, M., et al. (2015). Combined impacts of future climate and land use changes on discharge, nitrogen and phosphorus loads for a Canadian river basin. Environ. Manag. 151, 76–86. doi:10.1016/j.jenvman.2014.12.012
Gassman, P. W., Reyes, M. R., Green, C. H., and Arnold, J. G. (2007). The soil and water assessment tool: historical development, applications, and future research directions. J. ASABE, Trans. ASABE 50, 1211–1250. doi:10.13031/2013.23637
Grizard, P., MacQuarrie, K. T., and Jiang, Y. (2020). Land-use based modeling approach for determining freshwater nitrate loadings from small agricultural watersheds. Water Qual. Res. J. 55, 278–294. doi:10.13031/2013.23637
Gupta, H. V., Sorooshian, S., and Yapo, P. O. (1998). Toward improved calibration of hydrologic models: multiple and noncommensurable measures of information. Water Resour. Res. 34, 751–763. doi:10.1029/97wr03495
Gupta, H. V., Sorooshian, S., and Yapo, P. O. (1999). Status of automatic calibration for hydrologic models: Comparison with multilevel expert calibration. J. Hydrol. Eng. 4, 135–143. doi:10.1061/(asce)1084-0699(1999)4:2(135)
Haas, M. B., Guse, B., and Fohrer, N. (2017). Assessing the impacts of Best Management Practices on nitrate pollution in an agricultural dominated lowland catchment considering environmental protection versus economic development, J. Environ. Manag., 196, 347–64.
Haidary, A., Amiri, B. J., Adamowski, J., et al. (2013). Assessing the Impacts of Four Land Use Types on the Water Quality of Wetlands in Japan. Manage. 27, 2217–2229. doi:10.1007/s11269-013-0284-5
Hua, B., Yang, J., Liu, F., Zhu, G., Deng, B., and Mao, J. (2018). Characterization of dissolved organic matter/nitrogen by fluorescence excitation-emission matrix spectroscopy and X-ray photoelectron spectroscopy for watershed management. Chemosphere 201, 708–715. doi:10.1016/j.chemosphere.2018.03.043
Jahanzad, E., Barker, A. V., Hashemi, M., Sadeghpour, A., and Eaton, T. (2017). Forage radish and winter pea cover crops outperformed rye in a potato cropping system. Agron. J. 109, 646–653. doi:10.2134/agronj2016.06.0342
Jiang, Y., Zebarth, B. J., Somers, G. H., MacLeod, J. A., and Savard, M. M. (2012). Nitrate leaching from potato production in Eastern Canada. In: He, Z., Larkin, R. P., Honeycutt, C. W. (Editors). Springer, NY: Sustainable Potato Production: Global Case Studies,. pp. 233–250.
Jiang, Y., Nishimura, P., van den Heuvel, M. R., MacQuarrie, K. T., Crane, C. S., Xing, Z., et al. (2015). Modeling land-based nitrogen loads from groundwater-dominated agricultural watersheds to estuaries to inform nutrient reduction planning. J. Hydrol. 529, 213–230. doi:10.1016/j.jhydrol.2015.07.033
Jiang, Y., Nyiraneza, J., Khakbazan, M., Geng, X., and Murray, B. J. (2019). Nitrate leaching and potato yield under varying plow timing and nitrogen rate. Agrosystems Geosci. Environ. 2, 1–14. doi:10.2134/age2019.05.0032
Jiang, Y., Nyiraneza, J., Noronha, C., Mills, A., Murnaghan, D., Kostic, A., et al. (2022). Nitrate leaching and potato tuber yield response to different crop rotations. Field Crops Res. 288, 108700. doi:10.1016/j.fcr.2022.108700
Jiang, Y., and Somers, G. (2009). Modeling effects of nitrate from non-point sources on groundwater quality in an agricultural watershed in Prince Edward Island, Canada. Hydrogeol. J. 17, 707–724. doi:10.1007/s10040-008-0390-2
Jiang, Y., Stetson, T., Philips, J., and Kostic, A. (2024). Reducing yearly variation in potato tuber yield using supplemental irrigation. Potato Res. 67, 1625–1651. doi:10.1007/s11540-024-09711-6
Jorgensen, E. E. (2002). Advances in restoration science, number 2: opportunities in nitrogen management research: improving applications for proven technologies and identifying new tools for managing nitrogen flux and input in ecosystems. Washington, DC: United States Environmental Protection Agency. (EPA) Issue Paper, EPA/600/S-02/003. 4p.
Kelling, K. A., Andraski, T. W., and Speth, P. E. (2019). Field evaluation of potato N needs following forage legumes. Am. J. Potato Res. 96, 62–68. doi:10.1007/s12230-018-9689-2
Kersebaum, K. C., Steidl, J., Bauer, O., and Piorr, H.-P. (2003). Modelling scenarios to assess the effects of different agricultural management and land use options to reduce diffuse nitrogen pollution into the river Elbe, Physics and Chemistry of the Earth, Parts A/B/C. 28, 12–13.
Koropeckyj-Cox, L., Christianson, R. D., and Yuan, Y. (2021). Effectiveness of conservation crop rotation for water pollutant reduction from agricultural areas. Trans. ASABE 64, 691–704. doi:10.13031/trans.14017
Krause, P., Boyle, D. P., and Bäse, F. (2005). Comparison of different efficiency criteria for hydrological model assessment. Adv. Geosci. 5, 89–97. doi:10.5194/adgeo-5-89-2005
Lee, S., Sadeghi, A. M., Yeo, I.-Y., McCarty, G. W., and Hively, W. D. (2017). Assessing the impacts of future climate conditions on the effectiveness of winter cover crops in reducing nitrate loads into the Chesapeake Bay watersheds using the SWAT model. Trans. ASAE. 60, 1939–1955. doi:10.13031/trans.12390
Liang, K., Jiang, Y., Nyiraneza, J., Fuller, K., Murnaghan, D., and Meng, F.-R. (2019). Nitrogen dynamics and leaching potential under conventional and alternative potato rotations in Atlantic Canada. Field Crops Res. 242, 107603. doi:10.1016/j.fcr.2019.107603
Liang, K., Jiang, Y., Qi, J., Fuller, K., Nyiraneza, J., and Meng, F.-R. (2020). Characterizing the impacts of land use on nitrate load and water yield in an agricultural watershed in Atlantic Canada. Sci. Total Environ. 729, 138793. doi:10.1016/j.scitotenv.2020.138793
Liao, S. L., Savard, M., Somers, G., Paradis, D., and Jiang, Y. (2005). Preliminary results from water-isotope characterization of groundwater, surface water, and precipitation in the Wilmot River watershed, Prince Edward Island. (Natural Resources Canada, Geological Survey of Canada).
Masunga, R. H., Uzokwe, U. N., Mlay, P. D., Odeh, I., Singh, A., Buchan, D., and De Neve, S. (2016). Nitrogen mineralization dynamics of different valuable organic amendments commonly used in agriculture, Appl. Soil Ecol., 101, 185–193.
Meisinger, J. J., and Delgado, J. A. (2002). Principles for managing nitrogen leaching. J. Soil Water Conserv, 57, 485–498.
Moriasi, D. N., Arnold, J. G., Van Liew, M. W., Bingner, R. L., Harmel, R. D., and Veith, T. L. (2007). Model evaluation guidelines for systematic quantification of accuracy in watershed simulations. Trans. ASAE 50, 885–900. doi:10.13031/2013.23637
Myrbeck, Å. (2014). Soil tillage influences on soil mineral nitrogen and nitrate leaching in Swedish arable soils. Ultuna, Uppsala, Sweden: Doctoral Thesis Swedish University of Agricultural Sciences. Available online at: https://pub.epsilon.slu.se/11461/1/myrbeck_a_140828.pdf.
Neeteson, J. J. (1989). “Effects of legumes on soil mineral nitrogen and response of potatoes to nitrogen fertilizer,” in Effects of crop rotation on potato production in the temperate zones. Editors J. Vos, C. D. Van Loon, and G. J. Bollen (Dordrecht, Netherlands: Kluwer Academic Publishers). doi:10.1007/978-94-009-2474-1_8
Neter, J., Kutner, M. H., Nachtsheim, C. J., and Wasserman, W. (1996). Applied linear statistical models.
Pai, N., and Saraswat, D. (2011). SWAT2009_LUC: a tool to activate the land use change module in SWAT 2009. Trans. ASAE 54, 1649–1658. doi:10.13031/2013.39854
Paradis, D., Ballard, J., Savard, M., Lefebvre, R., Jiang, Y., Somers, G., et al. (2006). “Impact of agricultural activities on nitrates in ground and surface water in the Wilmot Watershed, PEI, Canada,” in 59th Canadian geotechnical conference and the 7th joint CGS/IAH-CNC conference (Vancouver), 1–4.
Pavlovskii, I., Jiang, Y., Danielescu, S., and L. Kurylyk, B. L. (2023). Influence of precipitation event magnitude on baseflow and coastal nitrate export for Prince Edward Island, Canada. Hydrol. Process. 37. doi:10.1002/hyp.14892
Peralta, J. M. A., and Stockle, C. O. (2002). Dynamics of nitrate leaching under irrigated potato rotation in Washington State: a long-term simulation study. Agric. Ecosyst. Environ. 88, 23–34. doi:10.1016/s0167-8809(01)00157-8
Prince Edward Island Agricultural Insurance corporation (PEIAIC) (2022). 2022 spring AgriInsurance agreement at. Available online at: https://www.princeedwardisland.ca/sites/default/files/publications/af_agriinsurance_cropsagreement.pdf (Accessed June 13, 2022).
Prince Edward Island Government. (2014). Potato fertilization. PEI analytical Laboratories. Available online at: https://www.gov.pe.ca/photos/original/af_fact_potfer.pdf. Accessed 12 July 2018.
Prunty, L., and Greenland, R. (1997). Nitrate leaching using two potato-corn N-fertilizer plans on sandy soil. Agric. Ecosyst. Environ. 65, 1–13. doi:10.1016/s0167-8809(97)00043-1
Pushpalatha, R., Perrin, C., Le Moine, N., and Andréassian, V. (2012). A review of efficiency criteria suitable for evaluating low-flow simulations. J. Hydrol. 420, 171–182. doi:10.1016/j.jhydrol.2011.11.055
Qi, J., Li, S., Li, Q., Xing, Z., Bourque, P., and Meng, F.-R. (2015). Modifying the soil temperature module in SWAT for application in atlantic Canada ---Module development, validation and impacts on watershed modelling. doi:10.13140/RG.2.2.31949.49124
Salam, A. A., Bailey, R. T., White, J. T., Arnold, J. G., White, M. J., Čerkasova, N., et al. (2024). A framework for parameter estimation, sensitivity analysis, and uncertainty analysis for holistic hydrologic modeling using SWAT+. Hydrol. Earth Syst. Sci., 28, 21–48. doi:10.5194/hess-28-21-2024
Savard, M. M., Paradis, D., Somers, G., Liao, S., and van Bochove, E. (2007). Winter nitrification contributes to excess NO3− in groundwater of an agricultural region: a dual-isotope study. Water Resour. Res. 43, W06422. doi:10.1029/2006wr005469
Schilling, K., and Zhang, Y.-K. (2004). Baseflow contribution to nitrate-nitrogen export from a large, agricultural watershed, USA. J. Hydrol. 295, 305–316. doi:10.1016/j.jhydrol.2004.03.010
Sith, R., Watanabe, A., Nakamura, T., Yamamoto, T., and Nadaoka, K. (2019). Assessment of water quality and evaluation of best management practices in a small agricultural watershed adjacent to Coral Reef area in Japan. Agric. Water Manag. 213, 659–673. doi:10.1016/j.agwat.2018.11.014
Steiness, M., Jessen, S., van’t Veen, S. G. M., Kofod, T., Hojberg, A. L., and Engesgaard, P. (2021). Nitrogen-loads to streams: importance of bypass flow and nitrate removal processes. J. Geophys. Res. Biogeosci. 126, e2020JG006111. doi:10.1029/2020JG006111
Tang, X., Zhang, J., Wang, G., Jin, J., Liu, C., Liu, Y., et al. (2021). Uncertainty analysis of SWAT modeling in the Lancang River Basin using four different algorithms. Water 13, 341. doi:10.3390/w13030341
Torstensson, G., Aronsson, H., and Bergström, L. (2006). Nutrient use efficiencies and leaching of organic and conventional cropping systems in Sweden. J. Agron. 98, 603–615. doi:10.2134/agronj2005.0224
Ullrich, A., and Volk, M. (2009). Application of the Soil and Water Assessment Tool (SWAT) to predict the impact of alternative management practices on water quality and quantity. Agric. Water Manag. 96, 1207–1217. doi:10.1016/j.agwat.2009.03.010
van de Poll, H. W. (1989). Lithostratigraphy of the Prince edward island redbeds. Atl. Geol. 25, 23–35. doi:10.4138/1668
Vörösmarty, C. J., McIntyre, P. B., Gessner, M. O., Dudgeon, D., Prusevich, A., Green, P., et al. (2010). Global threats to human water security and river biodiversity. Nature 467, 555–561. doi:10.1038/nature09440
Vos, J., Van Loon, C., and Bollen, G. (2012). “Effects of crop rotation on potato production in the temperate zones,” in Proceedings of the international conference on effects of crop rotation on potato production in the temperate zones, held august 14–19, 1988. Wageningen, Netherlands: Springer Science and Business Media.
Wang, C., Jiang, R., Boithias, L., Sauvage, S., Sánchez-Pérez, J.-M., Mao, X., et al. (2016). Assessing potassium environmental losses from a dairy farming watershed with the modified SWAT model. Agric. Water Manag. 175, 91–104. doi:10.1016/j.agwat.2016.02.007
Wang, Q., Liu, R., Men, C., Guo, L., and Miao, Y. (2018). Effects of dynamic land use inputs on improvement of SWAT model performance and uncertainty analysis of outputs. J. Hydrol. 563, 874–886. doi:10.1016/j.jhydrol.2018.06.063
Wherry, S. A., Tesoriero, A. J., and Terziotti, S. (2021). Factors affecting nitrate concentrations in stream base flow. Environ. Sci. Technol. 55, 902–911. doi:10.1021/acs.est.0c02495
White, K. L., and Chaubey, I. (2005). Sensitivity analysis, calibration, and validations for a multisite and multivariable SWAT model 1. JAWRA J. Am. Water Resour. Assoc. 41, 1077–1089. doi:10.1111/j.1752-1688.2005.tb03786.x
Whittaker, J., Nyiraneza, J., Zebarth, B. J., Jiang, Y., and Burton, D. L. (2023). The effects of forage grasses and legumes on subsequent potato yield, nitrogen cycling, and soil properties. Field Crops Res. 290, 108747. doi:10.1016/j.fcr.2022.108747
Wyngaarden, S. L., Gaudin, A. C. M., Deen, W., and Martin, R. C. (2015). Expanding red clover (Trifolium pratense) usage in the corn–soy–wheat rotation. Sustainability 7, 15487–15509. doi:10.3390/su71115487
Yang, X., Liu, Q., Fu, G., He, Y., Luo, X., and Zheng, Z. (2016). Spatiotemporal patterns and source attribution of nitrogen load in a river basin with complex pollution sources. Water Res. 94, 187–199. doi:10.1016/j.watres.2016.02.040
Yang, X. M., Drury, C. F., Dan Reynolds, W. D., and Reeb, M. D. (2024). Legume cover crop as a primary nitrogen source in an organic crop rotation in Ontario, Canada: impacts on corn, soybean and winter wheat yields. Agric. 14, 19–31. doi:10.1007/s13165-023-00452-3
Zebarth, B., Drury, C., Tremblay, N., and Cambouris, A. (2009). Opportunities for improved fertilizer nitrogen management in production of arable crops in eastern Canada: a review. Can. J. Soil Sci. 89, 113–132. doi:10.4141/cjss07102
Keywords: potatoes, crop rotation, nitrogen credits, SWAT, nitrate leaching, groundwater
Citation: Jiang Y, Azimi MA, Meng F-R and Liang K (2025) The contribution of red clover to nitrate loading in an agricultural watershed. Front. Environ. Sci. 13:1471213. doi: 10.3389/fenvs.2025.1471213
Received: 26 July 2024; Accepted: 10 March 2025;
Published: 27 March 2025.
Edited by:
Hongbin Yin, Chinese Academy of Sciences (CAS), ChinaReviewed by:
Bisrat Ayalew Yifru, University of California, Davis, United StatesCopyright © 2025 Jiang, Azimi, Meng and Liang. This is an open-access article distributed under the terms of the Creative Commons Attribution License (CC BY). The use, distribution or reproduction in other forums is permitted, provided the original author(s) and the copyright owner(s) are credited and that the original publication in this journal is cited, in accordance with accepted academic practice. No use, distribution or reproduction is permitted which does not comply with these terms.
*Correspondence: Yefang Jiang, WWVmYW5nLmppYW5nQGFnci5nYy5jYQ==
Disclaimer: All claims expressed in this article are solely those of the authors and do not necessarily represent those of their affiliated organizations, or those of the publisher, the editors and the reviewers. Any product that may be evaluated in this article or claim that may be made by its manufacturer is not guaranteed or endorsed by the publisher.
Research integrity at Frontiers
Learn more about the work of our research integrity team to safeguard the quality of each article we publish.