 Boris van Zanten1
 Luke McKinnon Brander1,2,3*
 Juan-Pablo Castaneda4
 Diego Herrera1David Kaczan1,5
 Benjamin M. Brown6Ian Andrew Smith1,7
 Brenden Jongman1
- 1World Bank, Washington, DC, United States
- 2Institute for Environmental Studies, Vrije Universiteit Amsterdam, Amsterdam, Netherlands
- 3Institute for Earth System Sciences, Leibniz University Hannover, Hannover, Germany
- 4Research Institute of Natural Sciences and Technology, Universidad Rafael Landivar, Guatemala City, Guatemala
- 5School of Business, University of South Australia, Adelaide, SA, Australia
- 6Research Institute for Environment and Livelihoods, Charles Darwin University, Darwin, NT, Australia
- 7Boston University, Boston, MA, United States
Economic development in Indonesia has resulted in reduced poverty but has also been accompanied by significant pressure on natural capital, including its mangrove forests. In recognition of the role of mangroves in providing coastal protection and the delivery of other ecosystem services, the Government of Indonesia has engaged in several policy actions, among others the use of nature based solutions and has set a target to restore or enhance the protection of 600,000 ha of mangroves by 2025. The objective of the analysis presented in this paper is to inform the design and development of a national-scale mangrove conservation and restoration policy for Indonesia through a spatially explicit cost-benefit analysis. The analytical framework involves the integration of maps, data and models to estimate the costs and benefits of mangrove restoration at a high spatial resolution. On the benefit side, we make use of meta-analytic value transfer methods to value changes in fisheries, raw materials, coastal protection, carbon sequestration and avoided emissions, and mangrove tourism. On the cost side, we assess the opportunity and implementation costs using country specific data. Through a spatial overlay of cost and benefit estimates, cost-benefit indicators are calculated per district for investing in additional mangrove restoration and conservation. Using a discount rate of 5.5% and a 30-year project lifetime, the benefit-cost ratios of mangrove conservation and restoration are found to be >1 in most districts indicating positive social returns on investment. We find that mangrove conservation generally has higher benefit-cost ratios than restoration due to both the higher cost of restoration implementation and the additional time that it takes for restored mangroves to deliver ecosystem services. The spatially explicit framework to estimate district-level costs and benefits reveals tradeoffs with agriculture and aquaculture and enables the evaluation of investment scenarios and the spatial prioritisation of investments in mangrove conservation and restoration across Indonesia. Strategic allocation of conservation and restoration investments across districts can potentially significantly increase the economic viability of this nature-based solution.
1 Introduction
Development in Indonesia during the past Century has resulted in reduced poverty, largely driven by a natural capital-intensive productive structure (Dutu, 2015). For instance, Indonesia’s ocean resources, including coastal and marine ecosystems, contribute over USD280 billion annually to economic activity, or the equivalent to more than a quarter of the country’s GDP (World Bank, 2021). Indonesia’s mangroves,1 which represent an estimated 25 percent of the world’s mangroves, are recognised as a particularly important natural capital asset, providing a range of economically valuable ecosystem services, including support to commercial and subsistence fisheries, protection from storm and flood damage, sequestration and storage of carbon, and cultural uses including recreation and tourism (Barbier et al., 2011; Husain et al., 2020).
Current trends in mangrove degradation, however, are likely to threaten their economic and ecological value, including the livelihoods of Indonesia’s coastal communities who are dependent on them. Mangroves have experienced substantial loss in area due to land conversion, mainly caused by clearing for aquaculture, oil palm, and urban expansion (Richards and Friess, 2016). In Java, Sulawesi and parts of Kalimantan, mangrove conversion is mostly driven by fisheries and aquaculture. In the Western part of Indonesia, covering Sumatra and parts of Kalimantan, mangroves are largely converted into oil palm and pulp wood plantations. Estimates of loss rates vary from 6,200 to 52,000 hectares per year, with variation due to the time period of measurement and classification technique used (Goldberg et al., 2020; Murdiyarso et al., 2015). In addition, 1.8 million of the country’s 3.5 million hectares of mangrove are in a degraded condition (MMAF and MoEF, 2019).
The objective of the analysis described in this paper is to inform investment planning in mangrove restoration and sustainable mangrove management in Indonesia through valuing the potential net benefits of mangrove conservation and restoration. The analysis estimates and compares the costs and benefits of mangrove restoration and conservation using a nation-wide cost-benefit analysis (CBA). The analysis is spatially explicit, meaning that costs and benefits vary depending on spatially variable determining factors. This approach is relatively novel in the assessment of nature based solutions (Wainaina et al., 2020; Chelli et al., 2025) and enables the identification of locations that would yield the highest net returns on investments in mangrove conservation and restoration. The results of this assessment are intended to help the Government, private sector, and other stakeholders across Indonesia better understand the costs and benefits of mangrove management decisions and to understand development tradeoffs in areas where oil palm and aquaculture are highly profitable.
The structure of the paper is as follows. Section 2 describes the methods and data used in the analysis, including the overall methodological framework, quantification of benefits, estimation of costs, spatial cost-benefit analysis, and identifies limitations. Section 3 presents the results in the form of maps of benefits, costs, and benefit-cost ratios. Section 4 discusses the policy implications of the results. Section 5 provides conclusions and identifies avenues for future research.
2 Methods and data
2.1 Methodological framework
The overall methodological framework is a national-level spatial cost-benefit analysis to measure the net benefits of potential investments in mangrove restoration and conservation, represented in Figure 1. This approach integrates methods, data and insights from multiple disciplines including environmental economics, mangrove ecology, and spatial sciences.
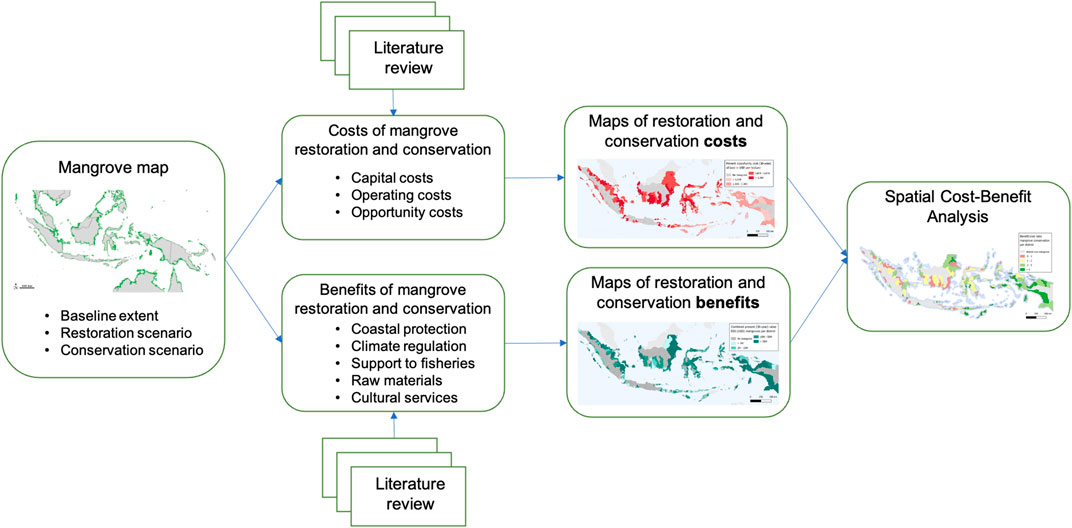
Figure 1. Methodological framework for spatial cost-benefit analysis of mangrove restoration and conservation.
Cost-benefit analysis (CBA), also called benefit-cost analysis (BCA), was initially developed as a technique for evaluating investments in the private sector and then adopted in the field of public decision making as a tool to evaluate the economic feasibility of individual projects, programs or even economic policies (Hanley and Spash, 1993). In applications conducted from a societal perspective, CBA provides an indication of how much a prospective investment contributes to social welfare by calculating the extent to which the benefits of the project exceed the costs (OECD, 2018).
A CBA involves the assessment of the costs and benefits of a policy action relative to a baseline scenario without the policy intervention. In this analysis, the CBA estimates the average costs and benefits of an additional hectare of mangrove restoration or conservation for each district with mangrove cover in Indonesia. The benefits of conservation are valued relative to a baseline assuming that unprotected mangrove areas would be lost over the next 30-years.
The spatial distribution of costs and benefits is incorporated into the CBA in order to identify locations with high net returns on restoration and conservation investments. A Geographic Information System (GIS) is used to process spatial variation in costs and benefits and compute benefit to cost ratios. This spatial approach to CBA has been developed over the past 20 years (Bateman et al., 2003) but has not been widely applied in the assessment of nature based solutions (NbS) (Wainaina et al., 2020; Chelli et al., 2025). We note that spatial CBA has been applied in ex post evaluations, for example, of flood risk mitigation projects (Stewart-Sinclair et al., 2021), but the application described in this paper to conduct an ex-ante evaluation of ecosystem restoration and conservation is relatively novel (Chausson et al., 2020; Tal-Maon et al., 2024).
2.2 Benefit assessment
The benefits of mangrove restoration and conservation are estimated as the resulting enhancement in the value of ecosystem services. Mangroves provide a number valuable ecosystem services that contribute to human wellbeing including provisioning (e.g., timber, fuel wood, and input to fisheries), regulating (e.g., flood, storm and erosion control; prevention of salt water intrusion; climate regulation), and cultural services (e.g., recreation, tourism, aesthetic enjoyment, and existence and bequest values for biodiversity) (Spaninks and Beukering, 1997; UNEP, 2006; TEEB, 2010). In this assessment, we did not attempt to value all mangrove ecosystem services but focused on those considered economically important and tractable to measure in monetary units. The selected ecosystem services are coastal protection, climate regulation, support to fisheries, provision of raw materials, and nature-based tourism. The valuation methods and data sources used to value each key ecosystem service are summarised in Table 1 and described in detail in the Supplementary Information.
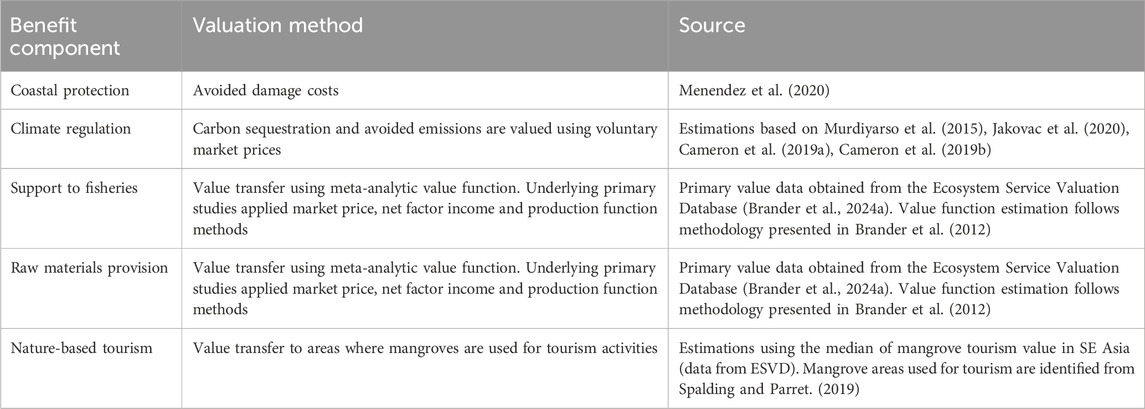
Table 1. Methods and data used for estimating benefits of mangrove restoration and conservation.
The selected methodologies generally involve some form of value transfer. Value transfer is the procedure of estimating the value of an ecosystem (or goods and services from an ecosystem) by applying an existing valuation estimate for a similar ecosystem (Navrud and Ready, 2007). This procedure is also known as benefit transfer but since the values being transferred may also be estimates of costs or damages, the term value transfer is arguably more appropriate (Brouwer, 2000). The use of value transfer to provide information for decision making has several advantages over conducting primary research to estimate ecosystem values. From a practical point of view, it is generally less expensive and time consuming than conducting primary research. Value transfer can also be applied on a scale that would be unfeasible for primary research in terms of valuing large numbers of sites across multiple countries. Value transfer also has the methodological attraction of providing consistency in the estimation of values across policy sites (Rosenberger and Stanley, 2006).
The value transfers conducted for the estimation of conservation and restoration benefits incorporate spatially variable determinants of ecosystem service values to reflect differences in both supply and demand across locations. For example, the meta-analytic value function for fisheries and raw materials includes spatially defined variables for mangrove abundance,2 protected status, distance to nearest city, and degree of fragmentation. These characteristics vary by location and result in differences in the estimated benefits of restoration and conservation.
Average benefits per hectare were estimated for each district by dividing the total annual value of the ecosystem service in the district by the total mangrove extent in the district. For climate regulation, fisheries, raw material provision, and nature-based tourism, the mangrove extent data was extracted from Indonesia’s national land cover map (Ministry of Environment and Forestry, 2017), while for the coastal protection value a global mangrove extent dataset was used to estimate per hectare values (Menéndez et al., 2020).
2.3 Cost assessment
The cost components included in the analysis are the costs of mangrove restoration and conservation, and the opportunity cost of land. The estimation of restoration and conservation costs cover implementation, capital and operating costs, complemented by the opportunity cost. Methods and data sources for the estimations are described in Table 2.
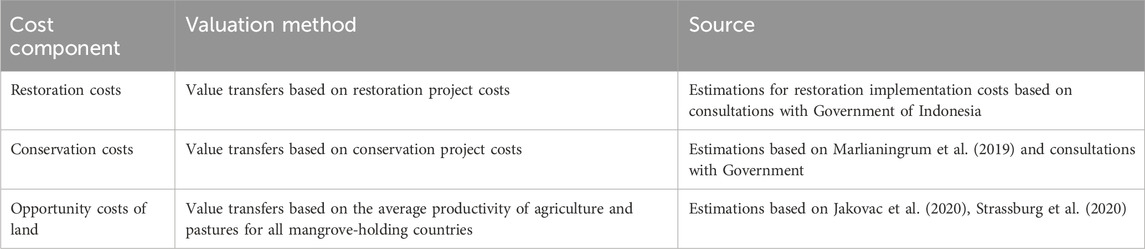
Table 2. Methods and data used for estimating benefits of mangrove restoration and conservation.
The costs of active mangrove restoration vary greatly depending on the techniques applied. In Southeast Asia, mangrove restoration strategies involve planting seeds and seedlings, transplanting, or the construction of artificial habitats such as detached breakwaters. Capital expenditures include costs of planning, purchasing, land acquisition, materials and equipment (such as pumps, vehicles, computers, fencing) and financing. Operating costs encompass maintenance, monitoring, and equipment repair and replacement (Bayraktarov et al., 2016).
Mangrove conservation projects involve the protection and sustainable use and management of mangrove forests. Mangrove protection activities may include formal and informal education programs, sale of carbon credits to fund and incentivise protection, monitoring of forest condition, fundraising activities, mapping and marking of agreed protected areas, and perimeter patrols and policing of illegal mangrove harvesting. The costs of mangrove protection projects can be classified into establishment and operational costs. In general, the time profile of costs for conservation projects is high in the initial establishment phase and then declines to cover stable monitoring and enforcement activities (Flint et al., 2018).
The opportunity costs of mangrove restoration and conservation are the values of foregone alternative land uses. Globally, the main land uses on former mangrove areas are agriculture and aquaculture (Jakovac et al., 2020). In Southeast Asia, during the period between 2000 and 2012, 38 percent of converted mangrove areas were designated to rice and oil palm agriculture, while 30 percent supported aquaculture (Richards and Friess, 2016). Given the importance of agriculture as a driver of mangrove conversion and the unavailability of data on aquaculture productivity for most mangrove-holding countries, opportunity costs were estimated based on the average productivity of agriculture and pastures for all mangrove-holding countries. The foregone value of agricultural land is estimated based on the net present value of 31 commodities over a 40-year time horizon using a 5 percent discount rate. The 31 commodities were chosen based on the data availability for their current and potential productivity (Jakovac et al., 2020). The net present value of each commodity was used to convert the value of produced quantity per unit area to a production value per unit area in a spatially explicit model with a 5 km spatial resolution (Jakovac et al., 2020).
2.4 Spatial cost-benefit analysis
The present value of costs and benefits of mangrove restoration and conservation are computed over a 30-year period to represent a relevant planning horizon for investments in coastal infrastructure. Present values are computed using a discount rate of 5.5%, with a sensitivity analysis using 0% and 10%. The time horizon and discount rates were selected based on discussions with the Government of Indonesia. Benefit-cost ratios are computed on a per hectare basis at the district level to enable direct comparison across districts in terms of marginal returns on restoration and conservation investments. A Benefit-cost ratio higher than one indicates a positive social return on investment. In other words, we look at the costs and benefits of restoring or conserving an additional hectare in each district, and thereby guide spatial prioritisation of restoration and conservation efforts across districts. Note that restoration and conservation activities would never take place at the same location, since restoration involves replanting mangroves where they have been lost and conservation involves preserving intact mangroves.
2.5 Limitations
The analysis presented in this paper is characterised by a number of uncertainties and limitations that should be recognised in the interpretation of results and use of this information to inform decision making. We propose that the results are informative for the policy dialogue on, and spatial targeting of, mangrove restoration and conservation in Indonesia but would need to be refined further for use in the design of specific interventions at the local level. Here we outline the main limitations and uncertainties for transparency and to guide future research directions.
• Uncertainty over baseline rates and location of mangrove degradation and loss. In the present analysis, we do not explicitly model variation in rates of mangrove loss or where losses will occur. We apply the simplifying assumption that conservation interventions are located where losses would occur, and thereby deliver the full benefits of conservation.
• Effectiveness of restoration and conservation efforts. We make the strong assumption that all interventions are effective, i.e., that all restoration projects successfully result in gained mangrove area and that all conservation projects successfully avoid mangrove loss. In practice, however, not all interventions are successful (Bayraktarov et al., 2016) and our analysis does not reflect this uncertainty.
• The analysis is likely to be incomplete in terms of its coverage of the full range of costs and benefits. On the cost side, we are unable to quantify and value all opportunity costs, which could include foregone urban or commercial development at some locations. On the benefit side, we are unable to include the value that people place on the preservation of nature and biodiversity, which can be substantial (Brander et al., 2024b).
• The estimation of values for each ecosystem service does not account for changes in relevant determinants of value over time. This includes changes in determining factors that are exogenous to the conservation/restoration scenario (e.g., income) and those that are endogenous (e.g., mangrove abundance, fragmentation). In the present analysis, we have taken a relatively conservative approach by not modelling these dynamics in mangrove ES values. On balance, we expect that including these dynamic effects would tend to increase the benefits of mangrove conservation and restoration. Future analyses could attempt to explore this.
• The scale of the analysis is national and necessarily involves generalisations. The results provide indicative information at the district level. For the design of specific interventions and projects, however, careful work is required to consider the circumstances of each proposed intervention, and the social, economic and environmental conditions prevailing in each case.
• The analysis provides only limited information on the distribution of costs and benefits across stakeholder groups. To some extent the impacted group is implicit in the cost or benefit component (e.g., the fisheries benefit accrues to fishing communities; the opportunity cost is incurred by farmers and aquaculture operators).
3 Results
3.1 Benefits
The estimated values of ecosystem services provided by restored or conserved mangroves are represented in Figures 2–4 for coastal protection, fisheries, and tourism benefits respectively. The estimated values for raw materials extracted from mangroves (timber, fuelwood, non-timber forest products) are reported in Supplementary Table S3 at the Province level. The estimated values are spatially variable and tend to be higher in areas that are less fragmented and without protected status. For Indonesia as a whole, the mean value of provisioning services per hectare of mangrove is estimated to be 347 USD/ha/year. We note that mangrove related fisheries accounts for almost 64% of provisioning service value, with the remaining 36% derived from raw materials. The estimated values of climate regulation (i.e., carbon sequestration and storage) for restored and conserved mangroves are not spatially variable in our analysis and are estimated to be 1,355 USD/ha present value for conservation, valuing avoided emissions, and 5,775 USD/ha present value for restoration valuing removal. This value is calculated using a conservative carbon price of 5 USD/tCO2e, an estimate to approximate the value of a tCO2e traded on the voluntary carbon market. Further information on the biophysical estimations of carbon removal and avoided emissions are provided in the Supplementary Information.
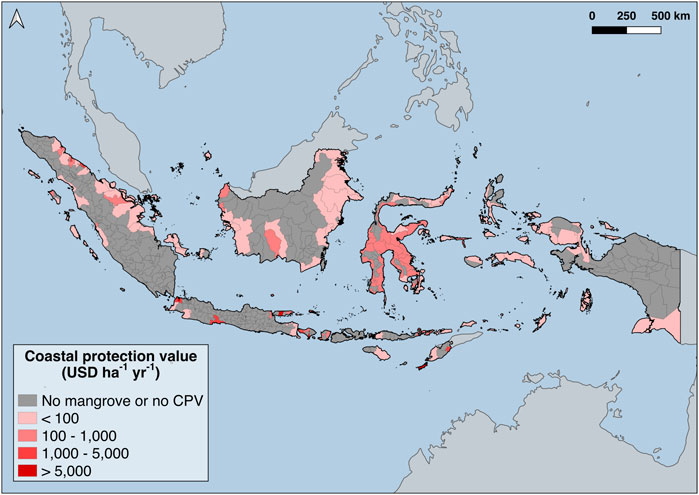
Figure 2. Spatial variation in mangrove coastal protection values (CPV) per district (USD/ha/year; 2020 prices). Source: derived from Menéndez et al. (2020).
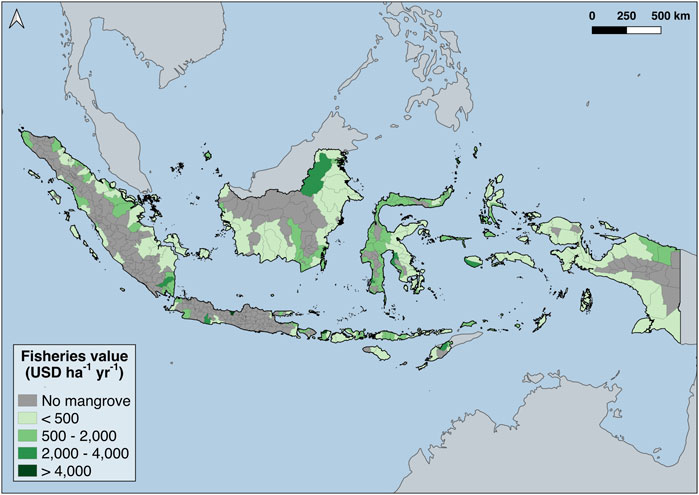
Figure 3. Spatial variation in mangrove fisheries values per district (USD/ha/year; 2020 prices).
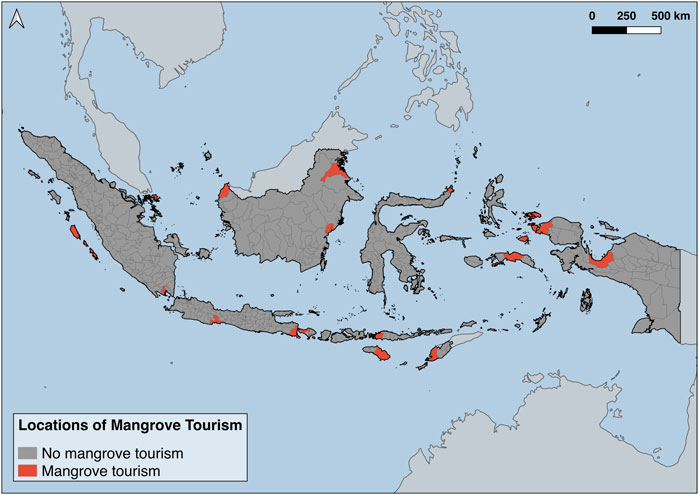
Figure 4. Districts with mangrove tourism. Source: derived from Spalding and Parrett. (2019).
Figure 2 shows the spatial variation in the value of coastal protection provided by mangroves. High annual per hectare values are estimated for mangroves located in more developed and populated areas, such as in Java, Bali and Lombok. In these areas, there are more properties exposed to coastal flooding, and hence, there is a higher coastal protection value of mangroves. In many of these high value areas, annual mangrove coastal protection benefits are estimated to exceed 10,000 USD per hectare per year.
Figure 3 represents the spatial variation in the value of mangrove input to fisheries. Fishery values per unit area are estimated to be higher in locations where there is a relatively low abundance of mangroves in the neighborhood (i.e., fewer substitute sites) and proximity to population centres. High values are found around Java, Sulawesi, and Southern Sumatra among other areas.
Figure 5 represents the spatial distribution of combined benefits across mangrove ecosystem services. The combined present value of mangrove benefits over a 30-year period ranges from under 2 million USD to over 50 million USD per district. This value represents the combined per hectare conservation value of coastal flood protection, avoided greenhouse gas emissions, tourism, fisheries, and materials multiplied by the mangrove extent per district. High values (>50 million USD) are found in districts with large mangrove extents on Papua, Kalimantan, and Sumatra. Likely due to high per hectare values, several districts in Sulawesi, Bali, Lombok, and Java are also in the top bracket even though they are home to a smaller mangrove extent.
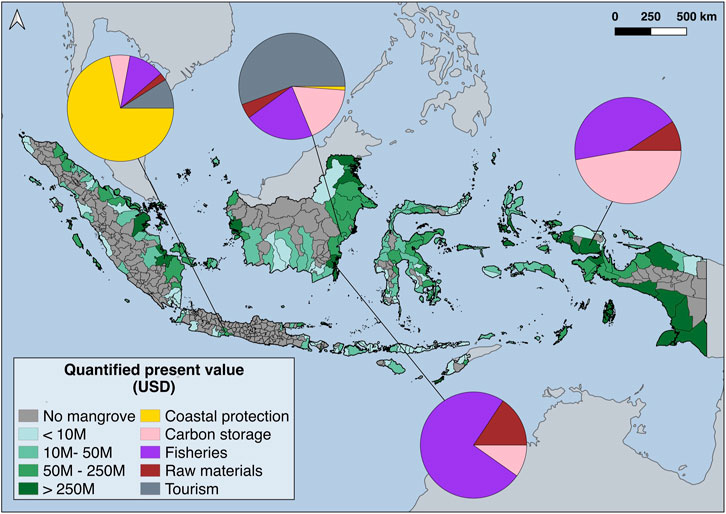
Figure 5. Present value of mangrove benefits per district (million (M) USD; 2020 prices) and constituent ecosystem services. The value of mangrove benefits is obtained by multiplying the per hectare value estimates for each district by the mangrove cover in hectares. The map shows the sum of the five benefits considered.
To highlight the spatial variation in the importance of different ecosystem services, Figure 5 includes pie charts for four selected districts; with fisheries, coastal protection, carbon storage and tourism each dominating the present value benefits depending on the characteristics of each location.
3.2 Costs
The estimated implementation costs of mangrove restoration are not spatially modelled and are obtained from the Government of Indonesia. The total cost for 1 ha of mangrove restoration (planting 10,000 seeds) is about USD 3,550 including procurement of mangrove seeds, planting facilities and infrastructure, and mangrove planting work (Ministry of Marine Affairs and Fisheries). In addition, USD 330 per hectare is included to account for additional investments in a mangrove center of excellence, community training, semi-permeable dams, and mangrove tourism infrastructure. The combined restoration cost per hectare of USD 3,863 is close to the median global cost estimates (Bayraktarov et al., 2016).
The estimated conservation costs are derived from information on mangrove management costs at Tangerang Regency, Batan Province, Java (Marlianingrum et al., 2019). The annual conservation cost is relatively low at 7.87 USD/ha/year but in line with assessed conservation costs in SE Asia (Brander et al., 2023).
High opportunity costs of land, with a net present value of over USD 6,000 per hectare, are found in Southern Kalimantan, Eastern Sumatra and parts of Java and Sulawesi (Figure 6). In these areas that have seen significant mangrove deforestation over the past decades, mangroves are under pressure due to the high profitability of oil palm plantations, aquaculture, and agriculture.
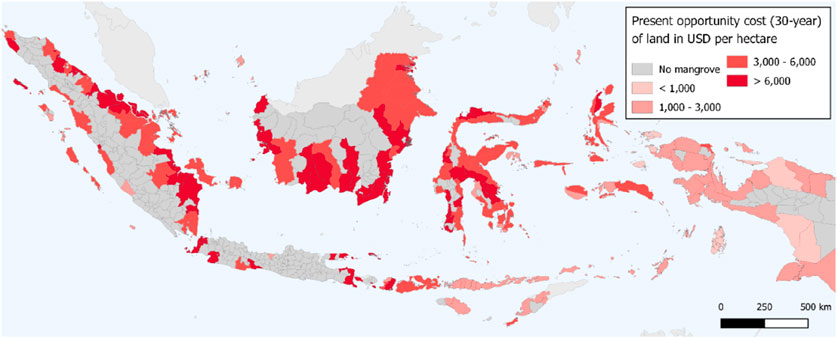
Figure 6. Spatial variation in opportunity costs of mangrove restoration and conservation per district (USD; 2020 prices; present value over 30 years using 5% discount rate). Source: derived from Strassburg et al. (2020), Jakovac et al. (2020).
3.3 Spatial cost-benefit analysis
Figure 7 represents the benefit-cost ratios of (a) mangrove conservation and (b) mangrove restoration at the district level. In general, we observe that conservation delivers a higher return on investment than restoration.

Figure 7. Spatial distribution of benefit-cost ratios for mangrove conservation and restoration. (A) Mangrove conservation. (B) Mangrove restoration.
The benefit-cost ratio of a hectare of mangrove restoration is >1 in most districts indicating a positive net present value of investing in restoring mangroves. In areas such as Eastern Sumatra and large parts of Kalimantan there are clear land use tradeoffs. In those areas, where land opportunity costs are comparatively high and benefits such as coastal flood protection, fisheries and tourism are lower, the benefit-cost ratio of mangrove restoration is <1 indicating a negative net present value. In districts with low opportunity costs and high site-specific benefits, such as NTT and Western Papua, benefit-cost ratios of above 2 and in some districts above 5 are found.
4 Policy implications
The key policy implication drawn from the results presented in this paper is that an efficient achievement of the Government of Indonesia’s goal to restore or enhance the protection of 600,000 ha of mangroves or more generally, manage mangroves sustainably, involves a spatially targeted mix of restoration and conservation investments. The spatial cost-benefit analysis helps to determine the appropriate areas where activities will have higher net returns in terms of socio-economic welfare.
As an engagement tool with investors and policymakers, the information developed in this framework can be used to explore alternative NbS investment scenarios described in terms of the split between restoration and conservation activities and their geographic distribution. For example, looking at the costs and benefits of mangrove restoration, Table 3 shows a cost-benefit analysis based on per hectare values aggregated to province level. In this scenario, the column ‘Ha restoration’ describes how many hectares would be restored per province in a hypothetical scenario, and the dataset allows estimation of the combined present value benefits, costs, and net present value (NPV). In this scenario analysis, opportunity costs are estimated considering the land use of restorable areas by making a distinction between agriculture/plantation, aquaculture, and degraded mangrove. Similar scenario analyses can be conducted to estimate the spatial variation of the net benefits of conservation.
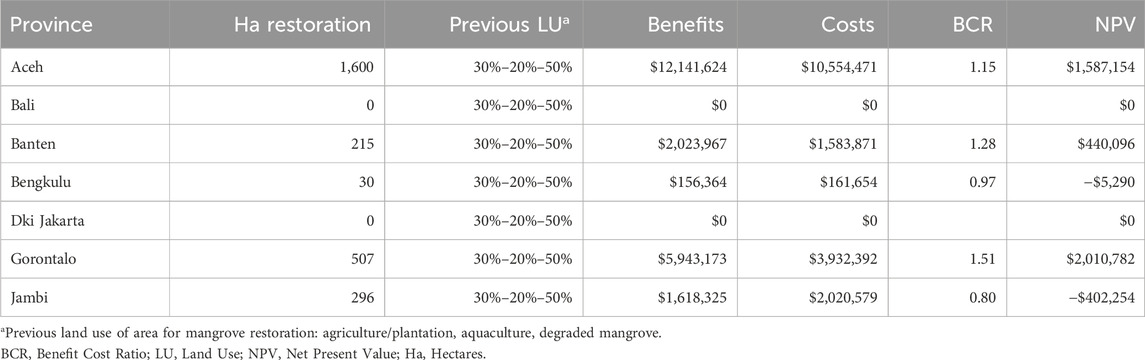
Table 3. Example of mangrove restoration scenario analysis based on per hectare cost and benefit estimations aggregated to province level.
This scenario approach was used for the appraisal of the Government's Mangroves for Coastal Resilience Project, financed by the World Bank, which is implementing 75,000 ha of mangrove restoration across Indonesia.
5 Conclusion
The results of the spatial cost-benefit analysis presented in this paper show that investments in mangrove restoration and conservation in Indonesia generate positive returns across the majority of districts. In some cases, the returns are very high and estimated benefits exceed costs by more than a factor 5. In general, we observe that conservation delivers a higher return on investment than restoration due to the higher costs of restoration and the time required for restored mangroves to deliver ecosystem service benefits. These modelled results at the national scale are broadly in line with the findings of case studies that have examined the costs and benefits of mangrove NbS for specific locations (e.g., Susilo et al., 2017; Lahjie et al., 2019; Marlianingrum et al., 2019; Cameron et al., 2019b).
In relatively few locations, the results indicate that the benefits of mangrove restoration and conservation may not outweigh the costs, particularly where the opportunity costs are very high such as in Eastern Sumatra and Eastern Kalimantan. We caution that this does not imply support for mangrove conversion at such locations and that the results of our analysis should only be used to explore potential spatial prioritisation of mangrove restoration and conservation (i.e., to identify where returns are potentially and relatively highest). The next steps in developing NbS interventions would require in-depth assessment at target locations to define and assess alternative activities at the site level using local data and inputs from local stakeholders. There are likely to be many important context specific considerations that need to be taken into account in NbS design and implementation that cannot be sufficiently well measured or modelled in a national scale analysis (Nesshöver et al., 2017). As such, the spatial CBA described in this paper is intended to be used, and has been used by the Government of Indonesia, to make a first prioritisation of where to explore potential NbS interventions.
The assessment of the benefits of mangrove restoration and conservation for the analysis presented in this paper focuses on five key ecosystem services as a pragmatic approximation of total economic value. The selected ecosystem services were chosen through consultation with stakeholders and align well with the global literature on mangrove ecosystem services (Brander et al., 2012; Mukherjee et al., 2014; Himes-Cornell et al., 2018; Getzner and Islam, 2020) but others are potentially important in some contexts and may include contributions to the identity, traditions and informal economies of local communities that are not easily measured in monetary terms. Related to this is the need to consider the distribution of benefits and costs across different stakeholder groups, especially when dealing with questions of development. For example, the beneficiaries of large-scale palm oil plantations are different from subsistence agriculture and artisanal fishing. The net impacts of restoration and conservation interventions on different groups will have a substantial bearing on their social desirability.
The kind of rapid integrated and spatially explicit cost-benefit analysis presented in this paper has potential for replication to be used as a starting point for public and private investments in mangroves, and NbS more broadly. It provides an understanding of economic viability considering the most important benefits and costs; and the spatially explicit assessment can inform financing and implementation strategies. For instance, in areas where mangroves are important for coastal protection and adaptation, they may be protected as part of coastal planning and integrated with gray coastal protection infrastructure. In other areas, large scale protection or restoration offers carbon financing opportunities through generation of credits for avoided emissions. A framework as presented in this paper can help spatially differentiate these financing strategies and, moreover, identify opportunities for blending finance using different mechanisms, including eco-tourism revenues, natural asset insurance, sustainability-linked bonds, carbon credits and markets, and other payment for ecosystem services schemes (Rode et al., 2019; Brears, 2022).
We envisage substantial scope for further development and application of this approach. The increasing availability of earth observation data at scale (Gomes et al., 2020), improvements in global processed-based ecosystem services models (e.g., Menéndez et al., 2020; Gaido-Lasserre et al., 2024) and the increasing accuracy of meta-analytic regression to predict the value of ecosystem services (Johnston et al., 2021) will increase capabilities for rapid and spatially explicit cost-benefit analysis of mangrove investment and NbS more broadly. At the same time, the demand for bankable investments in nature is likely to increase further due to multilateral environmental agreements, better regulated carbon markets, increasing biodiversity finance, impact investors and other voluntary commitments from the private sector. To meet this demand methodological approaches that consolidate and leverage the increasing data availability and technology, as presented in this paper, can facilitate the identification of economically and financially viable investments in nature.
Data availability statement
The original contributions presented in the study are included in the article/Supplementary Material, further inquiries can be directed to the corresponding author.
Author contributions
BvZ: Conceptualization, Formal Analysis, Methodology, Project administration, Writing–original draft, Writing–review and editing. LB: Conceptualization, Formal Analysis, Methodology, Writing–original draft, Writing–review and editing. J-PC: Conceptualization, Project administration, Writing–review and editing. DH: Conceptualization, Writing–review and editing. DK: Conceptualization, Writing–review and editing. BB: Conceptualization, Data curation, Writing–review and editing. IS: Visualization, Writing–review and editing. BJ: Conceptualization, Writing–review and editing.
Funding
The author(s) declare that financial support was received for the research, authorship, and/or publication of this article. The research was funded by The Global Program on Sustainability, the Global Program on Nature-based Solutions for Climate Resilience and the Global Facility for Disaster Reduction and Recovery at the World Bank.
Acknowledgments
We are grateful for the support from Ann Jeannette Glauber, Raffaello Cervigni, Hasna Nikmah and Andre Rodrigues de Aquino, for strategic and technical guidance to the overall project, which included several intermediate outputs that fed into this paper. This work would not have been possible without the valuable assistance provided by the World Resources Institute Indonesia (Yayasan Institute Sumber Daya Dunia), including Willy Daeli, Indah Andesta, Aryo S. Sujiwo, Komariah Ervita, Khesyia A. Makhas, and Armyanda Tussadiah. We would like to thank Prof. Michael Beck, Dr. Catalina Jakovac, Dr. Pelayo Menendez, Dr. Mark Spalding and Dr. Bernardo Strassburg for sharing datasets that are the foundation of the analysis.
Conflict of interest
The authors declare that the research was conducted in the absence of any commercial or financial relationships that could be construed as a potential conflict of interest.
The reviewer KG-O declared a past collaboration with the author LB to the handling editor.
Publisher’s note
All claims expressed in this article are solely those of the authors and do not necessarily represent those of their affiliated organizations, or those of the publisher, the editors and the reviewers. Any product that may be evaluated in this article, or claim that may be made by its manufacturer, is not guaranteed or endorsed by the publisher.
Supplementary material
The Supplementary Material for this article can be found online at: https://www.frontiersin.org/articles/10.3389/fenvs.2025.1459034/full#supplementary-material
Footnotes
1The term mangrove is loosely used to describe a wide variety of trees and shrubs (around 80 species), that share characteristics of being adapted to conditions of high salinity, low oxygen and changing water levels (Saenger et al., 1983). The mangrove biome dominates tropical and sub-tropical coastlines between latitudes 32°N and 38°S and covers approximately 22 million hectares. Around 28% of global mangroves are located in Southeast Asia with Indonesia alone accounting for 25%.
2Mangrove abundance is measured as the area extent of mangrove (in hectares) within a 10 km buffer of the valued mangrove site. This variable is used to capture substitution or complementary effects among mangroves areas on the value of ES that they provide.
References
Barbier, E. B., Hacker, S. D., Kennedy, C., Koch, E. W., Stier, A. C., and Silliman, B. R. (2011). The value of estuarine and coastal ecosystem services. Ecol. Monogr. 81 (2), 169–193. doi:10.1890/10-1510.1
Bateman, I. J., Lovett, A. A., and Brainard, J. S. (2003). Applied environmental economics: a GIS approach to cost-benefit analysis. Cambridge: Cambridge University Press.
Bayraktarov, E., Saunders, M. I., Abdullah, S., Mills, M., Beher, J., Possingham, H. P., et al. (2016). The cost and feasibility of marine coastal restoration. Ecol. Appl. 26 (4), 1055–1074. doi:10.1890/15-1077
Brander, L. M., Wagtendonk, A. J., Hussain, S. S., McVittie, A., Verburg, P. H., de Groot, R. S., et al. (2012). Ecosystem service values for mangroves in Southeast Asia: a meta-analysis and value transfer application. Ecosyst. Serv. 1 (1), 62–69. doi:10.1016/j.ecoser.2012.06.003
Brander, L., and Yeo, B. H. (2021). Summary reports. Economic value of ecosystem services of the taman negara national park, royal belum state park and endau-rompin national park. Kuala Lumpur, Malaysia: Department of Wildlife and National Parks.
Brander, L. M., de Groot, R., Schägner, J. P., Guisado-Goñi, V., van’t Hoff, V., Solomonides, S., et al. (2024a). Economic values for ecosystem services: a global synthesis and way forward. Ecosyst. Serv. 66, 101606. doi:10.1016/j.ecoser.2024.101606
Brander, L., Eppink, F., Hof, C. M., Bishop, J., Riskas, K., Goñi, V. G., et al. (2024b). Turtle Economic Value: the non-use value of marine turtles in the Asia-Pacific region. Ecol. Econ. 219, 108148. doi:10.1016/j.ecolecon.2024.108148
Brears, R. C. (2022). “Financing nature-based solutions,” in Financing nature-based solutions: exploring public, private, and blended finance models and case studies (Cham: Springer International Publishing), 29–50.
Brouwer, R. (2000). Environmental value transfer: state of the art and future prospects. Ecol. Econ. 32 (1), 137–152. doi:10.1016/s0921-8009(99)00070-1
Cameron, C., Hutley, L. B., Friess, D. A., and Brown, B. (2019a). High greenhouse gas emissions mitigation benefits from mangrove rehabilitation in Sulawesi, Indonesia. Ecosyst. Serv. 40, 101035. doi:10.1016/j.ecoser.2019.101035
Cameron, C., Hutley, L. B., Friess, D. A., and Brown, B. (2019b). Community structure dynamics and carbon stock change of rehabilitated mangrove forests in Sulawesi, Indonesia. Ecol. Appl. 29 (1), e01810. doi:10.1002/eap.1810
Chausson, A., Turner, B., Seddon, D., Chabaneix, N., Girardin, C. A., Kapos, V., et al. (2020). Mapping the effectiveness of nature-based solutions for climate change adaptation. Glob. Change Biol. 26 (11), 6134–6155. doi:10.1111/gcb.15310
Chelli, A., Brander, L., and Geneletti, D. (2025). Cost-Benefit analysis of urban nature-based solutions: a systematic review of approaches and scales with a focus on benefit valuation. Ecosyst. Serv. 71, 101684. doi:10.1016/j.ecoser.2024.101684
Dutu, R. (2015). Making the most of natural resources in Indonesia. Paris, France: OECD. doi:10.1787/5js0cqqk42ls-en
Flint, R., Herr, D., Vorhies, F., and Smith, J. R. (2018). Increasing success and effectiveness of mangrove conservation investments: a guide for project developers, donors and investors. Deutschland: Umweltstiftung WWF. Available at: https://portals.iucn.org/library/node/48357.
Gaido-Lasserre, C., Nederhoff, K., Storlazzi, C. D., Reguero, B. G., and Beck, M. W. (2024). Improved efficient physics-based computational modeling of regional wave-driven coastal flooding for reef-lined coastlines. Ocean. Model. 189, 102358. doi:10.1016/j.ocemod.2024.102358
Goldberg, L., Lagomasino, D., Thomas, N., and Fatoyinbo, T. (2020). Global declines in human-driven mangrove loss. Glob. Change. Biol. 26, 5844–5855. doi:10.1111/gcb.15275
Getzner, M., and Islam, M. S. (2020). Ecosystem services of mangrove forests: results of a meta-analysis of economic values. Int. J. Environ. Res. Public Health 17 (16), 5830. doi:10.3390/ijerph17165830
Gomes, V. C., Queiroz, G. R., and Ferreira, K. R. (2020). An overview of platforms for big earth observation data management and analysis. Remote Sens. 12 (8), 1253. doi:10.3390/rs12081253
Hanley, N., and Spash, C. L. (1993). Cost-benefit analysis and the environment. Cheltenham: Edward Elgar.
Himes-Cornell, A., Grose, S. O., and Pendleton, L. (2018). Mangrove ecosystem service values and methodological approaches to valuation: where do we stand? Front. Mar. Sci. 5, 376. doi:10.3389/fmars.2018.00376
Husain, P., Al Idrus, A., and Ihsan, M. S. (2020). The ecosystem services of mangroves for sustainable coastal area and marine fauna in Lombok, Indonesia: a review. J. Inov. Pendidik. Dan. Sains 1 (1), 1–7. doi:10.51673/jips.v1i1.223
Jakovac, C. C., Latawiec, A. E., Lacerda, E., Leite Lucas, I., Korys, K. A., Iribarrem, A., et al. (2020). Costs and carbon benefits of mangrove conservation and restoration: a global analysis. Ecol. Econ. 176, 106758. doi:10.1016/j.ecolecon.2020.106758
Johnston, R. J., Boyle, K. J., Loureiro, M. L., Navrud, S., and Rolfe, J. (2021). Guidance to enhance the validity and credibility of environmental benefit transfers. Environ. Resour. Econ. 79 (3), 575–624. doi:10.1007/s10640-021-00574-w
Lahjie, A. M., Nouval, B., Lahjie, A. A., Ruslim, Y., and Kristiningrum, R. (2019). Economic valuation from direct use of mangrove forest restoration in Balikpapan Bay, East Kalimantan, Indonesia, F1000Res. 8, 9. doi:10.12688/f1000research.17012.2
Marlianingrum, P. R., Kusumastanto, T., Adrianto, L., and Fahrudin, A. (2019). Economic analysis of management option for sustainable mangrove ecosystem in Tangerang District, Banten Province, Indonesia. IOP Conf. Ser. Earth Environ. Sci. 241 (1), 012026. doi:10.1088/1755-1315/241/1/012026
Menéndez, P., Losada, I. J., Torres-Ortega, S., Narayan, S., and Beck, M. W. (2020). The global flood protection benefits of mangroves. Sci. Rep. 10 (1), 4404–4411. doi:10.1038/s41598-020-61136-6
Ministry of Environment and Forestry (2017). Indonesia coastal ecosystem accounts prepared by the department of Forestry planning and environmental management of the ministry of environment and Forestry (MoEF).
MMAF and MoEF (2019). Mangrove extent and condition statistics based on 2015 data. Jakarta, Republic of Indonesia: Ministry of Marine Affairs and Fisheries and Ministry of Environment and Forestry.
Mukherjee, N., Sutherland, W. J., Dicks, L., Huge, J., Koedam, N., and Dahdouh-Guebas, F. (2014). Ecosystem service valuations of mangrove ecosystems to inform decision making and future valuation exercises. PloS one 9 (9), e107706. doi:10.1371/journal.pone.0107706
Murdiyarso, D., Purbopuspito, J., Kauffman, J. B., Warren, M. W., Sasmito, S. D., Donato, D. C., et al. (2015). The potential of Indonesian mangrove forests for global climate change mitigation. Nat. Clim. Change 5 (12), 1089–1092. doi:10.1038/nclimate2734
S. Navrud, and R. C. Ready (2007). Environmental value transfer: issues and methods (Dordrecht: Springer), 1084.
Nesshöver, C., Assmuth, T., Irvine, K. N., Rusch, G. M., Waylen, K. A., Delbaere, B., et al. (2017). The science, policy and practice of nature-based solutions: an interdisciplinary perspective. Sci. Total Environ. 579, 1215–1227. doi:10.1016/j.scitotenv.2016.11.106
OECD (2018). Cost-benefit analysis and the environment: further developments and policy use. Paris, France: Organisation for Economic Co-operation and Development. Available at: https://www.oecd.org/publications/cost-benefit-analysis-and-the-environment-9789264085169-en.htm.
Richards, D. R., and Friess, D. A. (2016). Rates and drivers of mangrove deforestation in Southeast Asia, 2000-2012. Proc. Natl. Acad. Sci. U. S. A. 113 (2), 344–349. doi:10.1073/pnas.1510272113
Rode, J., Pinzon, A., Stabile, M. C., Pirker, J., Bauch, S., Iribarrem, A., et al. (2019). Why ‘blended finance’could help transitions to sustainable landscapes: lessons from the Unlocking Forest Finance project. Ecosyst. Serv. 37, 100917. doi:10.1016/j.ecoser.2019.100917
Rosenberger, R. S., and Stanley, T. D. (2006). Measurement, generalization, and publication: sources of error in benefit transfers and their management. Ecol. Econ. 60 (2), 372–378. doi:10.1016/j.ecolecon.2006.03.018
P. Saenger, E. J. Hegerl, and J. D. Davie (Editors) (1983). Global status of mangrove ecosystems. Glaend, Switzerland: International Union for Conservation of Nature and Natural Resources.
Spalding, M., and Parrett, C. (2019). Global patterns in mangrove recreation and tourism. Mar. Policy 110, 103540. doi:10.1016/j.marpol.2019.103540
Spaninks, F., and Beukering, P. V., (1997). Economic valuation of mangrove ecosystems: potential and limitations. CREED Working Paper 14.
Stewart-Sinclair, P. J., Klein, C. J., Bateman, I. J., and Lovelock, C. E. (2021). Spatial cost–benefit analysis of blue restoration and factors driving net benefits globally. Conserv. Biol. 35 (6), 1850–1860. doi:10.1111/cobi.13742
Strassburg, B. B. N., Iribarrem, A., Beyer, H. L., Cordeiro, C. L., Crouzeilles, R., Jakovac, C. C., et al. (2020). Global priority areas for ecosystem restoration. Nature 586 (7831), 724–729. doi:10.1038/s41586-020-2784-9
Susilo, H., Takahashi, Y., and Yabe, M. (2017). Evidence for mangrove restoration in the Mahakam Delta, Indonesia, based on households’ willingness to pay. J. Agric. Sci. 9 (3), 30–41. doi:10.5539/jas.v9n3p30
Tal-Maon, M., Portman, M. E., Broitman, D., and Housh, M. (2024). Identifying the optimal type and locations of natural water retention measures using spatial modeling and cost-benefit analysis. J. Environ. Manag. 368, 122229. doi:10.1016/j.jenvman.2024.122229
TEEB (2010). The economics of ecosystems and biodiversity: ecological and economic foundations. Editor P. Kumar (London and Washington: Earthscan).
UNEP (2006). Marine and coastal ecosystems and human well-being: a synthesis report based on the findings of the millennium ecosystem assessment. Nairobi: United Nations Environment Programme.
Wainaina, P., Minang, P. A., Gituku, E., and Duguma, L. (2020). Cost-benefit analysis of landscape restoration: a stocktake. Land 9 (11), 465. doi:10.3390/land9110465
Keywords: mangroves, nature based solutions, cost-benefit analysis, restoration, conservation
Citation: van Zanten B, Brander LM, Castaneda J-P, Herrera D, Kaczan D, Brown BM, Smith IA and Jongman B (2025) Integrated spatial cost-benefit analysis of large-scale mangrove conservation and restoration in Indonesia. Front. Environ. Sci. 13:1459034. doi: 10.3389/fenvs.2025.1459034
Received: 03 July 2024; Accepted: 21 January 2025;
Published: 25 February 2025.
Edited by:
Nalini Rao, Electric Power Research Institute (EPRI), United StatesReviewed by:
Susan Harrell Yee, United States Environmental Protection Agency, United StatesKeila Guillen-Oñate, Plymouth Marine Laboratory, United Kingdom
Copyright © 2025 van Zanten, Brander, Castaneda, Herrera, Kaczan, Brown, Smith and Jongman. This is an open-access article distributed under the terms of the Creative Commons Attribution License (CC BY). The use, distribution or reproduction in other forums is permitted, provided the original author(s) and the copyright owner(s) are credited and that the original publication in this journal is cited, in accordance with accepted academic practice. No use, distribution or reproduction is permitted which does not comply with these terms.
*Correspondence: Luke McKinnon Brander, YnJhbmRlckBwaHlnZW8udW5pLWhhbm5vdmVyLmRl