 Markus Schaffert
 Cemre Sahinkaya
 Christian Wolff
94% of researchers rate our articles as excellent or good
Learn more about the work of our research integrity team to safeguard the quality of each article we publish.
Find out more
ORIGINAL RESEARCH article
Front. Environ. Sci., 05 March 2025
Sec. Interdisciplinary Climate Studies
Volume 13 - 2025 | https://doi.org/10.3389/fenvs.2025.1456772
This article is part of the Research TopicNature-based solutions for climate change adaptationView all 11 articles
Urban sprawl poses a significant challenge in the context of climate change. In Germany, while the tools for reducing land consumption are known, they are seldom employed due to a lack of local awareness. Building local support for land preservation is therefore a major challenge, impacting both public administrations responsible for designating new development areas and the general public. This paper proposes an approach to visualize the long-term development of urban sprawl at the local level, using historical geospatial data, including aerial imagery and maps predating satellite remote sensing. The aim is to create clear and easily understandable visualizations that demonstrate the dynamic expansion of built-up areas in municipalities over time. To this end, the paper identifies relevant data sources, processing steps, and presentation formats that can be applied in various contexts. The feasibility of this approach is illustrated by using three rural municipalities, showing how the visualizations can be concretely applied. The resulting visual representations are intended to be used in transformation workshops to stimulate discussion and raise awareness. Particular attention is given to the specific concerns of rural communities, with the goal of fostering greater citizen involvement and encouraging action to address urban sprawl.
Humans have consumed more land in just 40 years between 1975 and 2014 than in the entire history of mankind (Pesaresi et al., 2016). Germany, along with the Netherlands and Belgium, is considered one of the highest sprawled countries in Europe (Behnisch et al., 2022). The expansion of urban land use, marked by the spread of impervious surfaces, significantly reduces the capacity of ecosystems to deliver a range of essential services (Kabisch et al., 2017). These include the impaired capability of previously unsealed soils to absorb carbon dioxide (Privitera et al., 2018) and the intensification of the urban heat island effect (Chapman et al., 2017; Tan et al., 2010). Another negative impact of urban sprawl on climate includes increased energy consumption due to the construction of buildings and infrastructure. Moreover, the encroachment of urban areas onto agricultural land affects local food supply chains, necessitating longer transportation routes and thus escalating carbon emissions (Bart, 2010). Additional greenhouse gas emissions are also caused by longer commuting times and the dependence of suburban residents on cars (Trubka et al., 2010; Floater et al., 2014). Furthermore, land consumption is a major cause of species diversity loss (Simkin et al., 2022) and disrupts the connectivity of critical ecological areas (McDonald et al., 2018).
Given these adverse effects, Germany has committed to reducing urban sprawl to a maximum of 30 hectare of soil sealing per day by 2030. Furthermore, the current federal government has introduced the additional target of establishing a circular economy for land use by 2050 (Eichhorn et al., 2024a), aiming at zero net land take in line with European regulations (Gardi, 2015; cf. Lacoere and Leinfelder, 2023). This focus on sustainable land use is not limited to Germany or Europe; in most countries of the Global North, strategies to regulate urban growth are increasingly being implemented (Nuissl and Siedentop, 2021). The instruments required to achieve these objectives in the German context are sufficiently described. These encompass both incentive-based and coercive measures, spanning legal and technical realms (e.g., Schmidt and Petry, 2005; Preuß, 2016; Hamacher, 2020; Jehling et al., 2020; Bovet, 2021; Ehrhardt et al., 2022; Goede, 2022; Pehlke, 2023; Eichhorn et al., 2024b). Examples of this include promoting urban development by making greater use of available building land (Ehrhardt et al., 2023), empty and underutilized existing buildings (cf. Schaffert, 2011; Neufeld, 2015) as well as setting quotas, such as through the implementation of a certificate trading system (Adrian et al., 2018). Despite the solid state of research, progress in reducing land consumption is lagging behind. The 30-hectare target was introduced already in 2002 in the German Sustainability Strategy and was set for the year 2020 (cf. Scholz et al., 2016). As it became apparent in the years leading up to this date that the target could not be met, it was postponed until 2030 (Goede, 2022). Currently, more than 50 hectare of land per day are earmarked in Germany for residential and transport areas (Umweltbundesamt, 2024), which makes the ambitious goal of a circular economy without net land consumption in 2050 appear all the more difficult.
In the German planning system, municipalities develop their land-use plans in line with the requirements and objectives of the higher planning levels. However, they have the constitutional right to decide on land use in their territory, which is why they are ultimately responsible for implementation (Turowski, 2002). Local land use reality clearly shows that achieving the targets set by the federal government to reduce urban land consumption is not yet a priority for municipalities (cf. Fina, 2021). Germany has over 10,000 independent municipalities, and the institutional fragmentation of local authorities is considered a key factor in contributing to urban sprawl (Ulfarsson and Carruthers, 2006). The individual expansive land-use policies of these municipalities exemplify what Odum (1982) refers to as the “tyranny of small decisions,” where numerous seemingly minor land-use decisions can collectively lead to significant cumulative impacts. For this reason, greater involvement of local authorities and cooperation with communities in saving land is called for (cf. Ivanov, 2022). Generating local acceptance for the implementation of land preservation measures is seen as a major challenge (Nuissl and Siedentop, 2021). The lack of such acceptance reflects a low level of awareness of the problem, which pervades society. For a long time, land in Germany has not been adequately recognized as a scarce resource (Thoenes et al., 2004). This contributes to a widespread societal acceptance of the excessive consumption of new land for settlement and transportation purposes (Voß and Schröder, 2020).
A major factor contributing to urban land consumption, particularly in rural areas, is single-family zoning (Eichhorn et al., 2024a). The 1950s economic boom led to rising incomes, while state incentives like homeownership support and commuter allowances, along with auto-driven suburban sprawl, enabled many young families to build their own homes for the first time in German history (Zakrzewski et al., 2014; Lorbek, 2018; Siedentop et al., 2022). Urban sprawl was further driven by factors such as the desire for a “detached house with a garden” (Burchell et al., 2005; cf. Moser et al., 2002) and the declining land prices outside urban cores (Krause, 2014). For this purpose, land on the periphery of existing settlement areas was newly developed. This marked the beginning of a period of extensive settlement expansion that continues to this day. Nearly every third residential building in the old Länder is a detached or semi-detached house constructed between 1949 and 1978 (Simon-Philipp and Korbel, 2017). Despite the increasing incorporation of infill development strategies alongside greenfield expansion, many local authorities still view outward growth as indispensable (cf. Ferber and Preuß, 2009; Siedentop and Meinel, 2020; Fina, 2021). Häußermann and Siebel (1987) discussed the “growth paradigm” in German urban planning already over 30 years ago. The concept of growth is deeply rooted in the mindset of local planning actors and decision-makers in Germany (Großmann, 2007; Lamker, 2024) and beyond (EEA - European Environmental Agency, 2006; Fernandez and Hartt, 2022; Durrant et al., 2023). Spatial planning is inherently influenced by ideology (Gunder, 2010), and debates about growth management are often politically charged and potentially biased (Siedentop et al., 2022). Consequently, there might be significant resistance to reducing urban sprawl among planners (Mete, 2022). This necessitates critical reflection on planning practices to move away from growth-oriented approaches (Xue, 2022; cf. Kaika et al., 2023). At the same time, alternative governance strategies, such as urban growth management (Siedentop et al., 2022), are gaining traction for their potential to mitigate urban sprawl. These approaches emphasize coordinated actions by state and local actors to guide sustainable development. However, given the deeply rooted growth-oriented mindset, a fundamental shift in perspective is essential before local authorities can be expected to implement effective measures to reduce land consumption. The entrenched growth mindset requires proactive efforts to raise awareness, which may need to be initiated and initially driven by external actors such as the scientific community or upper political levels. For this process to succeed, it is essential to develop techniques and tools that enable local authorities and the local public to recognize the full extent of urban sprawl within their jurisdiction and the many associated problems (cf. Ruiz-Alejos and Prats, 2022). This is particularly urgent in rural areas, where the development of new residential zones is often disconnected from real demographic needs (Klemme, 2010; Ferber and Preuß, 2009; Behnisch et al., 2021; Eichhorn, 2023) and tends to take a back seat to personal, political and planning interests when competing with other objectives (Ritzinger, 2018). The impact of single-family zoning on rural land consumption underscores the importance of greater involvement of residents. Within a democratic framework, the local population possesses the capacity to sway the decisions undertaken by local authorities. Many citizens or their forebears have benefited from building land designations by constructing their own family homes on available plots. The desire to live in a single-family home remains widespread in rural areas even today (Schröder et al., 2011; Bergmann, 2018). Just as planners and decision-makers responsible for land take, also local citizens therefore must learn not to take further land consumption for granted.
This article addresses the implementation deficit of land-preservation measures at the municipal level. The proposed methodology aims to enhance local acceptance of land-saving initiatives. It is designed to make urban sprawl comprehensible in its full temporal and spatial extent for local actors – planners, decision-makers, homeowners, and the local public – thereby establishing conditions that challenge the growth paradigm and promote more sustainable governance strategies. For this purpose, geospatial data and information, including historical maps and aerial photographs, are utilized. These provide insights into long-term changes in local land cover, extending back to the 1950s and earlier. In this way, they fill gaps left open by official monitoring, which in Germany commenced at a later time (cf. Blechschmidt and Meinel, 2022). The article identifies necessary data sets and explains how they must be processed for effective and comprehensible visualizations of local land consumption. Three rural municipalities in Germany are used to illustrate urban sprawl, its ongoing expansion, and variations in visual representation. Rather than serving as a comparative case study, these areas demonstrate the methodology and its feasibility. Additionally, the importance of creating visualizations that are flexible enough to accommodate varying technical abilities is emphasized.
The introduction is followed by a section explaining the methodology. Subsequently, exemplary visualizations of urban sprawl in the study sites are presented. The opportunities these visualizations offer as catalysts for discussion are identified, and the path to discussion is opened up by providing critical questions. Attention is also given to examining the feasibility and prerequisites of the visualizations in terms of data origin and processing capabilities. This section is succeeded by a discussion of the challenges and limitations of the proposed methodology, including the need for future research.
Defining urban sprawl remains challenging due to the lack of a consistently accepted definition (Chettry, 2023; Banai and DePriest, 2014). One relatively common definition describes urban sprawl as a land-consuming urban development, which can manifest as low-density, dispersed development, or a combination of both (Couch et al., 2008; Colsaet et al., 2018). Related concepts and terms include land take, land consumption, or urban expansion (see Marquard et al., 2020; Rosni and Noor, 2016; Evers et al., 2024). In this article, we align with the German term Siedlungsflächeninanspruchnahme (UBA - Umweltbundesamt, 2009; Winkler, 2018) which refers to the transformation of agricultural or natural open spaces into settlement and transportation areas, and use “urban sprawl” as the English translation of this process.
The methodology was designed for implementation in two general steps: Geospatial analyses and visualization constitute the first step of a comprehensive mixed-methods approach, envisioning transformational workshops as the second step (Figure 1). These workshops are meant to provide a platform to present and discuss the visualizations depicting long-term sprawl with local participants. Since both steps are embedded within a joint overall framework, we provide bridges to the second step by formulating questions that complement the technical proposal of the first step. However, this paper focuses on step one marked as Geovisualization in Figure 1.
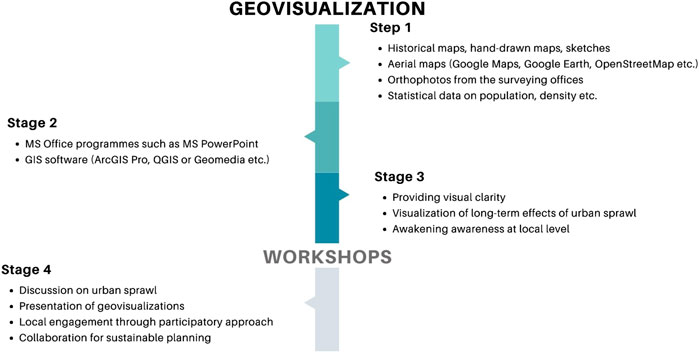
Figure 1. The methodological approach within two general steps: geovisualization and workshops.
The research intends to leverage geospatial data analyses and visualizations to raise awareness and engagement among municipal stakeholders and residents regarding long-term sprawl dynamics at the local level. Geospatial data and information have proven instrumental in various domains, showcasing their efficacy in enhancing knowledge transfer. From landscape planning (Wissen, 2009) to evaluating land consumption (Perlik et al., 2008) and its urban developmental implications (Shao et al., 2021), its utility extends to raising awareness (Aguilar et al., 2022) and fostering stakeholder engagement for sustainable development (Akbar et al., 2020). Moreover, its potential has been underscored in transformation studies (Buxton et al., 2022; Kindsvater and Schaffert, 2022), highlighting its versatility and significance for charting sustainable pathways across diverse research areas.
Drawing inspiration from wind energy planning, the approach presented in this paper is motivated by the engagement and debate that wind turbines trigger among citizens due to their visible impact on the landscape. While planning wind turbines prompts immediate reactions in communities and the local public, urban sprawl unfolds gradually over generations, often with dormant public awareness (see Schiefenhövel, 2022). By visualizing historical land cover dynamics, including time-lapse representations, the full extent of urban sprawl is intended to be made comprehensible from a local perspective.
Urban sprawl in Germany significantly intensified after the Second World War, a period characterized by the absence of systematic recording of the phenomenon. The Federal Statistical Office established its land use survey in 1980, using data from the cadasters of West Germany’s federal states (cf. Deggau, 2006; Blechschmidt and Meinel, 2022; Fina et al., 2023). Today, national systems like the IÖR-Monitor and European monitoring systems such as LUCAS, Corine Land Cover, and the Urban Atlas complement the official land use survey. They leverage several data sources, including remote sensing data or terrestrially recorded topographic data. Nevertheless, these systems were established in the 1990s or later (Blechschmidt and Meinel, 2023). In order to gain insights into urban sprawl that include periods before the establishment of these monitoring systems, it is essential to close this early data gap and turn available data into clear and appealing information (cf. Dosch and Beckmann, 2003; cf. Siedentop, 2006).
In response to the burgeoning open data movement in German federal states, the presented research seizes the opportunity by primarily utilizing open data sources. Moreover, analyses and visualizations that cater to a wide audience, from those with basic skills to those more proficient in advanced software, are offered. Therefore, a range of techniques and data sets will be presented that enable effective visualization of long-term urban sprawl at the local level.
As investigation sites serve the village of Otterberg in the federal state (“Länder”) of Rhineland-Palatinate, the country town of Fürth in Hesse, and the city of Tischenreuth in Bavaria (Figure 2). Otterberg is located in the country district of Kaiserslautern and has about 5,400 residents. Fürth is a municipality in the Bergstrasse district with just under 10,800 inhabitants. Tirschenreuth is the county town of the district of Tirschenreuth with approximately 8,600 citizens. According to the Thünen Institute’s classification of rural areas in Germany, the district of Kaiserslautern is considered to be “rather rural with a less favourable socio-economic situation.” In contrast, the Bergstrasse district is classified as ‘more rural with a good socio-economic situation’ and the district of Tirschenreuth is “very rural with a less good socio-economic situation” (Thünen-Landatlas, 2024).
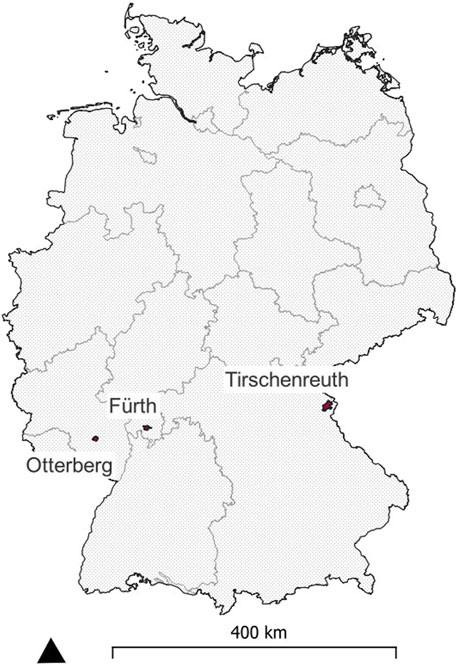
Figure 2. The location of the investigation sites in Germany and its federal states.
These three municipalities serve as typical examples of growth-oriented spatial planning, which has relied for decades on the designation of new construction areas. This characteristic is shared not only with neighboring municipalities but also broadly with rural areas across the entirety of the former West German states. While pronounced urban expansion accompanied by extensive sealing of former mainly agricultural land has occurred in the investigation sites since the Second World War, there has been no significant population growth in the past 25 years or more (Table 1). In rural Germany, single-family homes were largely built and are still occupied by members of highly populous generations. However, subsequent generations of potential buyers increasingly belong to smaller birth cohorts, leading to a growing quantitative mismatch between supply and demand (Zakrzewski et al., 2014; cf. Forsyth and Molinsky, 2021). This imbalance is intensified by the tendency of owner-occupiers in Germany to remain in their homes for long periods (cf. Schaffert et al., 2024), effectively “locking up” a considerable share of single-family homes from the market (Zakrzewski et al., 2014). At the same time, demand for family-friendly housing is often met through new construction, perpetuating a growth-oriented mindset and long-established practices (cf. Eichhorn et al., 2024b). Without a justificatory basis in the form of demographic growth, a departure from the practice of ongoing single-family zoning is both warranted and necessary to avoid “shrinkage sprawl,” characterized by declining population densities and growing vacancy rates (Siedentop and Fina, 2010; Pallagst et al., 2021).
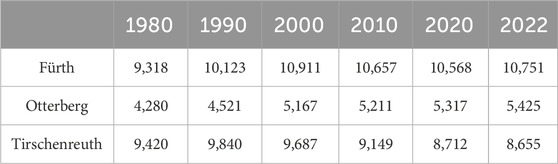
Table 1. Development of the total population in Fürth, Otterberg, and Tirschenreuth since 1980 (data source: Statistisches Bundesamt, 2024).
The population number of all municipalities in Germany is recorded by the Federal Statistical Office since the 1950s and is freely available in tabular form and annual slices (Statistisches Bundesamt, 2024). However, due to the lack of a sufficiently long-term information basis for urban sprawl, imbalances between population development and urban sprawl are still little discussed and often unknown in practice. Against this backdrop, the connectivity of the following visualizations depicting local sprawl to demographic statistics and their application in transformation workshops is also considered. The data and analyses used for these visualizations are adaptable and can be implemented in any municipality in Germany. The article aims to demonstrate how suitable visualizations of urban sprawl can be generated from raw data to be used in workshops, and what data or software is necessary for this purpose. It is not designed as a comparative study of the mentioned localities based on statistical methods, nor does it address the implementation of the workshops.
Viewing settlements from a bird’s-eye perspective offers observers a different, often complementary, and thus more holistic view of local realities (Akbar et al., 2020). By using aerial images, both historical and current ones, the often substantial land consumption since the 1950s can be vividly illustrated (cf. Fyfield, 2003; Dorrian and Pousin, 2013). In the case of Fürth, a current aerial image helps to reveal that the area of today’s town is mostly less than 70 years old. To communicate this information straightforwardly, older residents and knowledge holders were asked to map the boundary between the development before and after the Second World War (Figure 3).
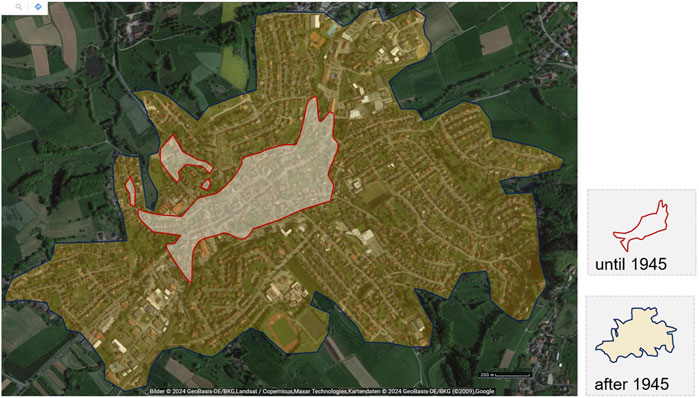
Figure 3. Development of Fürth before and after the Second World War (own representation based on Google Maps and local knowledge). The picture shows the main town of the municipality of Fürth, which consists of several districts. These show comparable urban sprawl patterns.
The technical requirements for this type of visualization retrieval are minimal. The aerial image comes from Google Maps; corresponding products are also available from other commercial sources or the surveying offices of the federal states. Since this type of visualization seeks to give the workshop audience a first impression of the trend of extensive land consumption on site, no great demands need to be placed on the spatial accuracy of the data products. Therefore, aerial photographs were used instead of rectified orthophotos. However, most state surveying offices make both aerial photographs and orthophotos openly available.
The visualization in Figure 3 was created with basic office software and should be feasible for a large number of people with basic software skills. Another recording strategy could involve letting individuals draw the boundaries on analog maps. This could be particularly useful for older citizens who may be more comfortable with analog media. However, if several analog works are to be digitized later on and linked via the common spatial reference, the use of GIS software is recommended for reasons of accuracy, precision and efficiency, which in turn brings with it additional handling requirements.
In local transformation workshops, a moderator could present images such as the one shown in Figure 3 and enhance it with information illustrating that many rural towns in Germany can look back on a long history in which excessive land consumption, as can be observed today, did not take place. In the case of Fürth, which is over 1,000 years old (LAGIS - Landesgeschichtliches Informationssystem Hessen, 2024), the compact area of the organically grown scattered village (German: Haufendorf) was sufficient for centuries. After the Second World War, however, the spatial expansion - initially accompanied by population growth due to war refugees and suburbanization - exploded visibly. In just a few decades, the traditional settlement pattern was completely overturned, and this - in view of the consequences of urban sprawl - in a way whose sustainability appears questionable from today’s perspective.
The visualization of urban land cover additionally opens the door to link land consumption with demographic realities. In contrast to urban sprawl, population growth in Fürth has stagnated since the 1990s, making it one of many examples of the substantial decoupling of these two trends in rural Germany (cf. Figure 4).
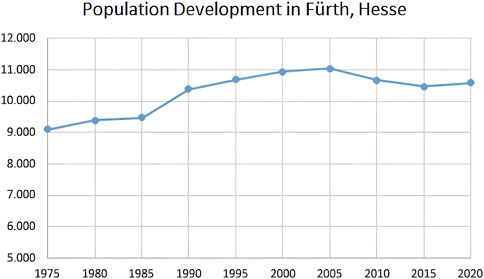
Figure 4. Population growth in Fürth (own representation based on Statistisches Bundesamt, 2024).
Images can evoke stronger emotions than mere appeals from researchers or politicians (cf. Hochschild et al., 2020; Barberá-Tomás et al., 2019). These emotions can be harnessed to engage locals by creating an environment that encourages questions about future settlement development, such as: Why have we been expanding in area if our population has not been growing for decades? Why have we acted this way when excessive land consumption is now seen as unsustainable? How should we proceed on-site in the future when zero net land take becomes the political goal from 2050 onwards?
By addressing these questions in workshops, the audience becomes familiar with the land conservation goals. Our experience shows that residents, especially those who are not politically active, are often unaware of them or perceive these goals as the fluctuating interests of political parties. Therefore, it is crucial to move beyond day-to-day politics and adopt a more scientific approach to communication. This is particularly important in a time of widespread frustration with mainstream politics, where strong sustainability claims are sometimes attributed to certain parties (cf. Jarzebski and Jarzebski, 2020; Weymouth et al., 2020). By asking about the reasons for unsustainable land use in the past rather than directly addressing the present, political conflicts can be avoided, as experiences from scenario workshops suggest (Ogilvy, 2002; Lindgren and Bandhold, 2003; cf. Ravetz et al., 2021).
Supplementing a current aerial photograph with participatively generated information is easy to produce but limited in scope. It shows binary differences in construction before and after the Second World War without offering a more detailed temporal resolution. One improvement is to link the urban sprawl data more directly in time with the official population statistics (cf. Koprowska et al., 2020). As the Federal Statistical Office publishes the population data annually, it is possible to form temporal aggregates, e.g., for every 10 or 15 ears. This offers a viable compromise between gaining detailed knowledge and the effort involved in vectorizing land cover information from historical geospatial data.
In the town of Otterberg, we consolidated 15-years time slices into a thematic map (Figure 5), utilizing historical topographic maps (TK 25), aerial imagery, and land surveys from the 19th century. All of these data sources can typically be obtained from the surveying authorities of the respective Länder. Afterwards the raw data was georeferenced by using the open software QGIS Desktop, and then vectorized at relevant time intervals. Basic proficiency in GIS software is necessary for this task. GIS software like ArcGIS Pro, QGIS, or Geomedia are widely used today even in rural municipalities, often for property management or calculating local taxes. The compilation of such information graphics by rural communities seems realistic in this respect, provided there is the political will to do so. While this approach increases the necessary skills and time investment, it provides another significant advantage: In GIS or presentation software, the timestamps of historical settlement areas can be sequentially presented, visually illustrating the onion-like growth of many German villages in an animation. Such animations are an effective way to visualize complex developments over time and demonstrate their impacts (Lewis et al., 2021; Fritsch, 2021).
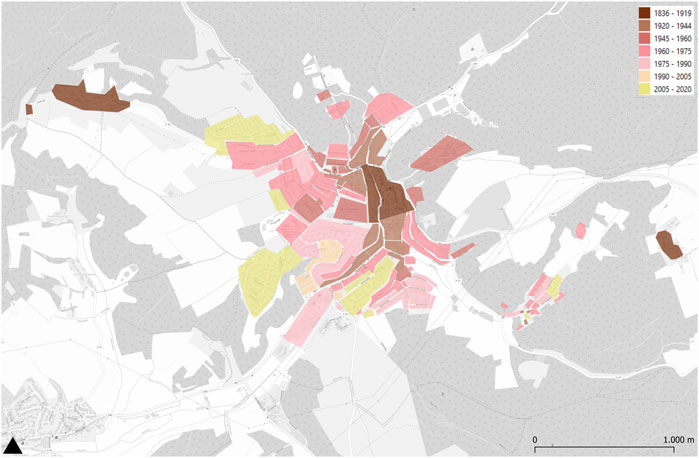
Figure 5. Urban sprawl in Otterberg in time slices (own illustration based on historical maps and aerial images). The data was provided by the State Office for Surveying and Geobasis Information of Rhineland-Palatinate. The background map is from OpenStreetMap (openstreetmap.org/copyright).
By using aerial images, one cannot only visualize the increase in impervious surfaces but also highlight significant differences in building density, road structure, and other metrics between the newer zones and the old town within the same municipality. The historic center, embedded in the surrounding landscape, forms a core of the community’s local identity (cf. Çerçi, 2012). Regional building styles and historical building materials together with other distinctive regional features play a central role (see Merino-Saum et al., 2020). Further visual material, like photos, can be used to substantiate this observation.
Over time, the historic center of Otterberg (Figure 6) has become predominantly surrounded by single-family house areas. These newer areas differ significantly from the historic core but are structurally similar to residential areas in other towns. This opens up scope for further questions and discussions that can be considered in a workshop, for instance: Do you agree that the post-war areas in your hometown look in some aspects similar to respective zones in other towns of the region and beyond? Which aspects are this and are they relevant to you? What do you think about the idea that increasing urban sprawl is leading your hometown to lose its identity and become interchangeable?
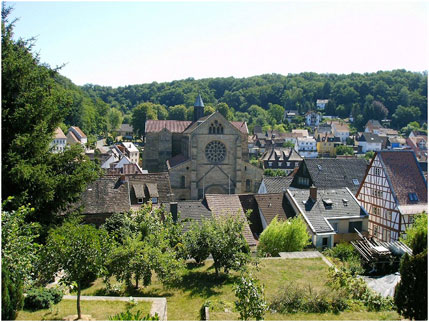
Figure 6. Otterberg mit Abteikirche (by Carsten Stemm from Kaiserslautern, Germany - CC BY-SA 2.0, https://commons.wikimedia.org/w/index.php?curid=3825957)
The utilization of vector-based geospatial datasets also allows for additional dimensions of visualizations, enabling a more specific response to the needs of target groups. The map on the left in Figure 7 differentiates the urban areas in the city of Tirschenreuth by color and assigns them numbers, with the number 8 representing the old town. In the figure-ground diagram on the right, black and white colors were applied to vividly represent the road network and the similarities or differences between the urban districts. Data from the volunteer-run project OpenStreetMap (OSM) was utilized for these analyses (cf. Schlesinger, 2015). The quality of OSM may vary across different investigation sites, eventually being lower in rural areas (Johnson et al., 2016) and for less central data themes (Brückner et al., 2021). For streets and buildings, however, aspects of data quality parameters such as spatial, temporal, and thematic accuracy have been relatively high for years in the German context (cf. Neis et al., 2011; Mocnik et al., 2018). In the case of Tirschenreuth, a quality check with official vector data sets and a comparison with aerial images showed that the use of OSM suits our purpose (Anankeu, 2021). For more extensive requirements, additional Volunteered Geographic Information (cf. Mocnik et al., 2019) as well as cadastral data from state surveying offices like ALKIS (Amtliches Liegenschaftskataster Informationssystem) or official topographic data from ATKIS (Amtliches Topographisch-Kartographisches Informationssystem), which are uniformly modeled across Germany’s federal states, can alternatively be applied. These authoritative datasets are openly available in most federal states (Bill et al., 2022; Happ et al., 2022).
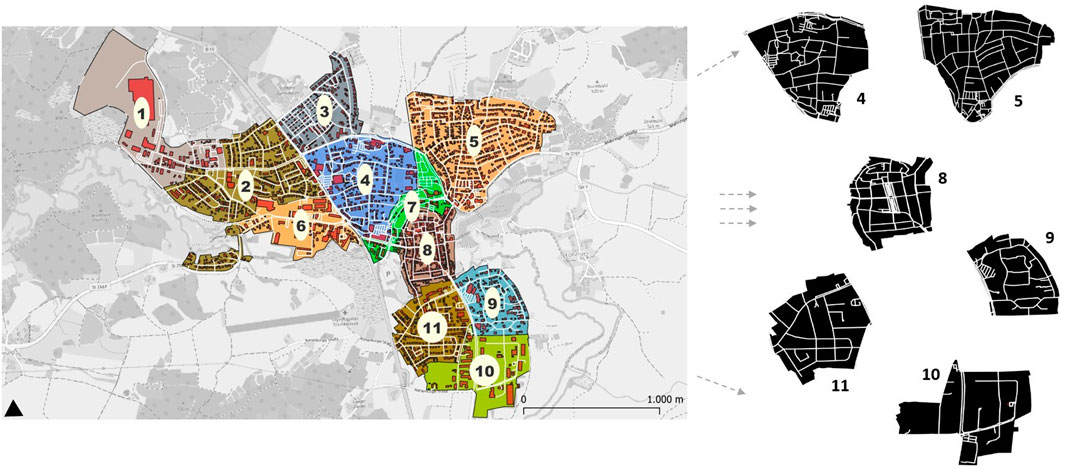
Figure 7. Figure-ground diagram of the city of Tirschenreuth (own representation based on Anankeu, 2021). The town has eleven neighborhoods, which differ from each other in their layout and structure. The left-hand side shows a representation of all neighborhoods, the right-hand side shows a simplified selection in black and white to enhance visual clarity.
Urban characteristics can also be determined by calculation. Urban metrics refer to quantitative measures used to analyze and understand various aspects of urban morphology (Jaeger et al., 2010; Lowry and Lowry, 2014). They for instance include the size or ratio between the perimeter and area of a patch, which refers to a single land cover type in a specific area, e.g., a plot of land in an urban environment. Other metrics include the spatial arrangement of buildings or assess the ease with which people can move through the city (cf. Bartzokas-Tsiompras et al., 2023; Dyer et al., 2024). So far, however, urban metrics have rarely been used in a rural context (Kaminski et al., 2021). In the case of Tirschenreuth, we calculated both basic and advanced metrics that reflect the differences between its urban areas. Building density, for instance, is a basic example that indicates the percentage of total area occupied by buildings within an urban area, such as a development zone. It can be attributed to various geometric properties of buildings, such as the living area, the total floor space, or the building footprint (cf. Peponis et al., 2007; van Nes, 2019). Eventually, the following formula was applied, utilizing OSM data:
The visual differences between the historic center and the newer areas are reflected here, further enhancing the visual impression. The densities range from low 5.8 (Zone 3) to 21.6 in Zone 8 (old town), with an average density in the city of Tirschenreuth of 15.67 (Anankeu, 2021).
Urban metrics can be presented together with the urban morphology maps in workshops, to deepen the visual impression. Combining visual representation with statistical quantification through metrics can also provide a basis for comparisons with other towns for scientific evaluations or policy briefs. However, it should not be overlooked that creating figure-ground (black-and-white) diagrams in GIS software is relatively easy to implement, while urban metrics require advanced software knowledge and, in some cases, programming skills (see Boeing, 2020). Rural communities probably need additional support for such quantifications, as they are unlikely to be able to manage this with their limited resources (Schaffert and Höcht, 2018).
Questions related to quantification can build on those previously asked. In a workshop, it should also be noted that urban metrics often lack clarity on their own. Therefore, a knowledgeable moderator should provide additional context.
The visualizations and processing steps presented vary in their reliability and must always be considered in their respective local context. Urban metrics, as demonstrated in the example of Tirschenreuth, provide statistically accurate information, but only if a suitable data basis is used (cf. Frazier and Kedron, 2017). Such quantitative information is at one end of a spectrum that ranges from quick, low-cost, and less complex approaches to analyses and visualizations that can only be conducted by GIS experts (see e.g., Meinel et al., 2000). At the other end are simple methods, such as aerial images supplemented by local knowledge, as exemplified in Fürth. Both approaches and the intermediate stages have their place, as they address different target groups, skill levels, and problem depths in the practice of land preservation. The time for achieving the political goals of reducing land consumption is ticking away. Therefore, it should be considered to go public with simple analyses at an early stage, provided that the results are justifiable and the challenges and potential weaknesses are communicated transparently (Kindsvater and Schaffert, 2022). Additionally, local actors should be empowered to generate this information independently, without relying on scientific partners. This underscores the importance of simple and straightforward analyses.
It makes sense to embed the visualizations in workshops in order to demonstrate land use changes to the target groups and initiate discussions. A knowledgeable moderator can make the weaknesses of straightforward analyses transparent. However, it becomes problematic when such visualizations are distributed without explanation or metadata, e.g., in the local press, which can be the case in practice-oriented or transdisciplinary research projects, reaching audiences with limited cartographic literacy (cf. Svatoňová, 2017; Schaffert et al., 2021). Even minor weaknesses in the method that cannot be contextualized and explained by a moderator provide a target for opposing interest groups to exploit, allowing them to question the entire approach and seriously challenge the idea of reducing urban sprawl on site (cf. Siedentop et al., 2022).
The citizen-generated map of Fürth (Figure 3) exemplifies these challenges. It is the result of participatory mappings based on a recent aerial image, but without formal validation, such as cross-referencing with additional historical aerial images. The urban areas delineated for the period before 1945 are likely to have inaccuracies in their geometric shapes. Nevertheless, they illustrate the considerable urban sprawl after the Second World War and thus fulfil their purpose, even if they remain vulnerable to criticism due to these shortcomings. Similarly, the time slices of Otterberg (Figure 5) encounter related issues. They were derived from historical data using a more precise method, which enhances their reliability. However, quality problems are still evident, albeit to a lesser extent. Here, the urban areas were digitally vectorized on the basis of aerial photographs and maps from different periods and iteratively compared with the original data. Nonetheless, the manual delineation method contributed to inaccuracies in the polygonal shapes. Additionally, the lack of consensus on semantics made settlement expansion areas imprecisely classified, with no clear distinction made within residential areas between built-up and non-built-up spaces (e.g., gardens). Against this background, a data quality-oriented approach that addresses semantic consistency and geometric accuracy based on official datasets and application schemas could be more appropriate (cf. Butenuth et al., 2007; cf. Heipke and Rottensteiner, 2020). This would significantly increase the chances of harmonization with existing monitoring systems. Furthermore, developing an automated method for systematically vectorizing data from historical aerial images and maps would enable a well-documented, long-term record of urban sprawl without the delays typically associated with such labor-intensive approaches (cf. Schlegel, 2023). However, while the future direction for improving the method is clear and requires further research, current challenges should not prevent the early public dissemination of simple visualizations that efficiently communicate essential insights (Kindsvater and Schaffert, 2022). Learning sustainability is a process that does not happen overnight. According to Hicks (2002), it should involve “three awakenings - of the mind, the heart, and the soul.” Simple analyses speak to the heart and help arouse emotions, providing an impetus to consider change and new pathways toward a more sustainable future.
The visualization of long-term urban sprawl aims to engage the emotions of workshop participants. However, the proposed visualizations have not yet been tailored to the various interest groups that can influence land protection in the local context. It therefore seems advisable to develop customised visualizations for local politicians, representatives of the city administration, planners, homeowners, etc. The homeowner’s view, for example, should include their own house and neighborhood, ideally represented in 3D (Schaffert and Sahinkaya, 2024).
Urban planners are unlikely to be fully satisfied with the information graphics presented so far. For instance, the demographic data previously used is only available for an entire municipality, not for individual neighborhoods. This spatially high-resolution level, however, is of particular interest as it reveals developments within built-up areas. In contrast to aggregated data, municipal population registers provide detailed insights at the neighborhood level, even down to specific addresses. However, they also pose challenges in data management and privacy protection (Schaffert et al., 2021). Consequently, the requirements for anonymization are stricter when presenting information to the public than to officials from municipalities responsible for managing the dataset. This raises the following research question: How can we develop and implement customized visualizations of urban sprawl that effectively engage various local stakeholders while overcoming challenges related to data privacy and spatial granularity?
In addition, urban expansion should be linked to further complementary topics at a granular, localized level (cf. Siedentop and Fina, 2010). To enable realistic assessments of housing demand, for example, information on per capita living space, vacancy rates or household figures over time is required. These aspects can be calculated from the aforementioned municipal population register. The necessary processing steps can be automated, which reduces the work involved (Schaffert et al., 2024). However, these automated steps may require on-site quality assurance measures, such as site visits or plausibility checks based on census data. Due to the challenges in managing this raw dataset for municipal planning (see Schaffert and Höcht, 2018), there is still limited empirical evidence of a correlation between urban sprawl and rising vacancy rates in rural Germany (cf. König, 2016). Nevertheless, this approach could provide critical insights into whether future development areas are truly necessary or whether local housing demand could be met by the adaptive reuse of underutilized existing buildings. Establishing such a correlation would provide a valuable new argument for land-saving initiatives in local debates. Additionally, future research should account for the diverse characteristics of spatial settings, including both rural and urban areas, and incorporate different countries when examining the nexus between urban sprawl and demographic transition (cf. Egidi et al., 2020; Smiraglia et al., 2021).
Powerful spatial metaphors and compelling narratives are essential supplements to conventional planning tools and techniques that aim to contribute to a sustainable transformation (Davoudi et al., 2018; Honeck, 2018). The local discourses on urban sprawl, however, are likely to be influenced by established growth narratives. To delve deeper into this assumption, we conducted 10 interviews with residents of post-war era detached houses in Fürth. Initially, local participants assumed that Fürth’s population was growing and had grown in the past. However, when confronted with official population statistics, they expressed profound surprise. Additionally, showing them the aerial image in Figure 3 led some to draw clear conclusions, such as “I’ve always felt that constant new construction is madness, primarily due to environmental destruction. I was not even aware that our population was not growing; it only makes things worse.” Conversely, preliminary discussions with individuals from municipalities in East Germany suggest expectations of population decline. These differences highlight spatial variations in expectations, which might be associated with overarching narratives.
Located in the suburban-rural continuum between the Rhine-Neckar and Rhine-Main metropolitan regions, narratives emphasizing Bergstrasse district’s pivotal role as a hinge between these two conurbations (cf. Lindstaedt, 2006) are well-established in Fürth. However, while some municipalities in this area benefit from proximity and better connections to the metropolitan regions, this advantage does not extend to those that are farther away (cf. Pro Bahn, 2012). To date, comparative studies with other municipalities in this or other regions are lacking. Further research could explore the channels (e.g., newspapers and municipal websites) through which local land-use information is communicated, thus revealing a possible link between narratives, local people’s expectations and their attitudes towards urban sprawl.
Causal relationships between urban sprawl and various drivers have been identified in Germany and abroad, including population growth, rising incomes, transport infrastructure expansion, and increased automobile usage (Zakrzewski et al., 2014; Berndgen-Kaiser et al., 2020). Political and institutional influences are also significant, suggesting that urban sprawl is not solely market-driven but shaped by public policies (Siedentop et al., 2022; Behnisch et al., 2024). Weak planning, land consumption subsidies, and support for car-centric infrastructure, alongside inadequate pricing mechanisms, further exacerbate sprawl (Colsaet et al., 2018; Nuissl and Siedentop, 2021). Similarly, the impact of urban sprawl is also manifold and extends beyond the ecological drawbacks outlined in the introduction. In our study areas, limited access to shopping facilities challenges aging in place for residents of single-family home areas built in the second half of the 20th century (social sustainability; Schaffert et al., 2023). Additionally, peripheral land take increases fixed costs for technical infrastructure (e.g., water, sewage), which is typically centralized in Germany’s municipalities, burdening citizens with higher expenses in scenarios of stagnant or declining population numbers (economic sustainability; Schiller and Siedentop, 2005; cf. Höcht, 2016). This diversity of causes and impacts underscores the importance of a comprehensive, judicious governance approach (cf. Hartt, 2018).
Against this background, Siedentop et al. (2022) highlight key aspects of urban growth management (UGM) that public authorities must address to curb urban sprawl. A central aspect is the development of persuasive narratives for sustainable and livable urban spaces, which are essential for garnering public and political support (Siedentop et al., 2022). Our proposed methodology contributes to this claim by providing local representations of urban sprawl, integrated into narratives that challenge the traditional growth paradigm and present viable alternatives at the local level. Another key objective of UGM is aligning land preservation goals with positive outcomes. By focusing on mitigating urban sprawl (quantitative growth) in workshops, we can shift attention to qualitative growth through inner development, such as repurposing vacant properties or revitalizing brownfields, highlighting its positive sustainable side effects. Finally, UGM requires multi-level governance, cross-sectoral policy coordination and a regionally coordinated mix of land management instruments. Our approach targets local initiatives that are transferable and can ideally be implemented across multiple municipalities within a region. However, this requires coordinated efforts between municipalities. Therefore, the method should be embedded within a regionally coordinated strategy and incorporate regional planning experts (Wahrhusen, 2021).
Urban sprawl is a significant challenge in the context of climate change, and the timeframe for achieving political goals to reduce land consumption is gradually narrowing. The reality of local land use clearly shows that the goals set by the federal government to reduce urban land consumption are not yet a priority for municipalities in Germany. Although a variety of tools for preserving land are well-known, these are rarely used at the local level. Therefore, a shift in perspective must occur first before local authorities can be expected to take effective measures to preserve land. Additionally, it is crucial to involve the local public more directly and raise awareness about land consumption.
This paper aims to make people more aware of the extent of long-term urban sprawl through engaging visualizations, and to encourage them to question and reflect at a local level. The proposed methodology involves the use of historical geospatial data, such as aerial photographs and pre-satellite maps. By identifying relevant data, processing steps, and adaptable presentation formats, emotional reactions are to be evoked and discussions stimulated. The visualizations are designed as an integral part of transformation workshops, where depictions of land consumption will be linked with demographic information and discussed in the context of their impacts. The feasibility of the method and the significance of this connection were demonstrated in three rural municipalities with a noticeable disparity between a population that has been growing at best minimally for decades and considerable urban sprawl. The outlined approach contributes to implementing the first step of a “spatial degrowth agenda for planning in the face of climate emergency” by anchoring current degrowth debates in their historical-geographical context on site (Kaika et al., 2023). Further research to refine the methodology should focus on balancing the quality of results with the time required for advanced visualization techniques, identifying local connectivity through the visualization of urban sprawl, and questioning growth narratives through comparative case studies. Such future studies should ideally be applicable at different levels and scales - (inter)national, regional and local. Furthermore, the method should be made compatible with recent monitoring systems. While existing systems are designed for national or European applications, the proposed approach also enables local-level implementation. Since the method is based on process steps that can be realized in municipalities and open geospatial data, which is increasingly being made publicly available in countries like Germany, it can be scaled up and applied more efficiently in the future.
However, it is important to recognize that the next critical step in implementation is not the further development of geospatial data processing, but rather the establishment of open local workshops for all citizens. These workshops aim not only to raise awareness of the issue and the historical-geographical extent of local urban sprawl but, more importantly, to facilitate the collaborative development of local land use strategies. In a democratic societal structure, such workshops involve public authorities and local community groups working together to determine the future direction of urban development. Therefore, they should receive much greater attention in strategies for reducing urban sprawl and achieving respective land preservation targets in Germany. The hope is that, through this approach, the growth paradigm of public authorities can be transformed into more sustainable forms of settlement development.
The data analyzed in this study is subject to the following licenses/restrictions: The geospatial data used originates from various sources, inlcuding public administrations of the federal states, whose geospatial data are not freely accessible. Additionally, costs may arise for scanning and referencing historical maps, which are available openly and for free, but the associated services are not necessarily. OpenStreetMap data have also been used under the ODBL license, along with municipal development plans. Please note that while we can name specific data, other data sources may be utilized that are not explicitly mentioned here. The usage regulations of the data providers must be observed, and we are unable to make these specific datasets available. Requests to access these datasets should be directed directly to the data providers responsible.
MS: Writing–original draft, Writing–review and editing. CS: Writing–original draft, Writing–review and editing. CW: Writing–review and editing.
The author(s) declare that financial support was received for the research, authorship, and/or publication of this article. This article was written as part of the project RAFVINIERT. The project RAFVINIERT - Spatial intelligence for the integrated care of senior citizens in rural neighborhoods is funded by the Carl-Zeiss-Stiftung in the programme “Transfer - Intelligent solutions for an ageing society.”
The authors declare that the research was conducted in the absence of any commercial or financial relationships that could be construed as a potential conflict of interest.
The author(s) declare that Generative AI was used in the creation of this manuscript.
All claims expressed in this article are solely those of the authors and do not necessarily represent those of their affiliated organizations, or those of the publisher, the editors and the reviewers. Any product that may be evaluated in this article, or claim that may be made by its manufacturer, is not guaranteed or endorsed by the publisher.
Adrian, L., Bock, S., Bunzel, A., Preuß, T., and Rakel, M. (2018). Instrumente zur Reduzierung der Flächeninanspruchnahme Aktionsplan Flächensparen. Dessau-Roßlau= UBA-Texte 38, 2018.
Aguilar, M. Á. P., Conway, B., de Lázaro Torres, M. L., de Miguel González, R., Donert, K., Linder-Fally, M., et al. (2022). A Teaching Model to Raise Awareness of Sustainability Using Geoinformation: Un modelo docente para sensibilizar sobre la sostenibilidad empleando la geoinformación. Espac. Tiempo Forma. Ser. VI, Geogr. (15), 23–42. doi:10.5944/etfvi.15.2022.33687
Akbar, A., Flacke, J., Martinez, J., Aguilar, R., and van Maarseveen, M. F. (2020). Knowing my village from the sky: a collaborative spatial learning framework to integrate spatial knowledge of stakeholders in achieving sustainable development goals. ISPRS Int. J. Geo-Information 9 (9), 515. doi:10.3390/ijgi9090515
Anankeu, M. (2021). Stadtformen und Ausstattungsdichten. Charakt. im Landkr. Tirschenreuthnter Berücksichtigung Qual. offener Geodaten, Bachelorhesis, Hochsch. Mainz.
Banai, R., and DePriest, T. (2014). Urban sprawl: definitions, data, methods of measurement, and environmental consequences. J. Sustain. Educ. 7 (2), 1–15.
Barberá-Tomás, D., Castelló, I., De Bakker, F. G., and Zietsma, C. (2019). Energizing through visuals: how social entrepreneurs use emotion-symbolic work for social change. Acad. Manag. J. 62 (6), 1789–1817. doi:10.5465/amj.2017.1488
Bart, I. L. (2010). Urban sprawl and climate change: a statistical exploration of cause and effect, with policy options for the EU. Land use policy 27 (2), 283–292. doi:10.1016/j.landusepol.2009.03.003
Bartzokas-Tsiompras, A., Bakogiannis, E., and Nikitas, A. (2023). Global microscale walkability ratings and rankings: a novel composite indicator for 59 European city centres. J. Transp. Geogr. 111, 103645. doi:10.1016/j.jtrangeo.2023.103645
Behnisch, M., Jehling, M., and Krüger, T. (2024). Editorial to the Special Issue “Limiting urban sprawl: relations between spatial trends, drivers, and planning policies”. Land Use Policy, 107168. doi:10.1016/j.landusepol.2024.107168
Behnisch, M., Krüger, T., and Jaeger, J. (2022). Rapid rise in urban sprawl: global hotspots and trends since 1990. PLOS Sustain. Transformation 1 (11), e0000034. doi:10.1371/journal.pstr.0000034
Behnisch, M., Krüger, T., and Jaeger, J. A. (2021). Trends der Zersiedelung in den deutschen Planungsregionen seit 1990. Dresdner Flächennutzungssymposium 79, 113–126.
Bergmann, P. (2018). Einfamilienhäuser und städtebauliche Qualität [Doctoral dissertation, Nürtingen-Geislingen].
Berndgen-Kaiser, A., Köhler, T., Lorbek, M., and Wiechert, M. (2020). Land-management strategies and the detached housing stock in shrinking municipalities: evidence from Germany. Raumforschung und Raumordnung/Spatial Res. Plan. 78 (2), 119–134. doi:10.2478/rara-2019-0049
Bill, R. (2022). Offene Geodaten in Raum-und Umweltwissenschaften-Stand und Potenziale. Dresdner Flächennutzungssymposium 80, 185–192. doi:10.26084/14dfns-p019
Bill, R., Blankenbach, J., Breunig, M., Haunert, J. H., Heipke, C., Herle, S., et al. (2022). Geospatial information research: state of the art, case studies and future perspectives. Remote Sens. Geoinformation Sci. 90 (4), 349–389. doi:10.1007/s41064-022-00217-9
Blechschmidt, J., and Meinel, G. (2022). “Vergleichende Untersuchung zur Erhebung der »Tatsächlichen Nutzung« in ALKIS und der daraus abgeleiteten Zeitreihe zur Flächenneuinanspruchnahme,” in ZfV-Zeitschrift für Geodäsie, Geoinformation und Landmanagement. zfv 4/2022)
Blechschmidt, J., and Meinel, G. (2023). Monitoring der Flächenneuinanspruchnahme–Vergleich von nationalen und europäischen Berichtssystemen. ZfV-Zeitschrift für Geodäsie, Geoinformation Landmanagement. doi:10.12902/zfv-0437-2023
Boeing, G. (2020). “Exploring urban form through OpenStreetMap data: a visual introduction,” in Urban experience and design (New York: Routledge), 167–184.
Bovet, J. (2021). “Kommunaler Ressourcenschutz–Auf der Zielgerade beim Flächensparen?,” in Rechtliche Herausforderungen und Ansätze für eine umweltgerechte und nachhaltige Stadtentwicklung (Leipzig: Nomos Verlagsgeselschaft mbH), 145–168.
Brückner, J., Schott, M., Zipf, A., and Lautenbach, S. (2021). Assessing shop completeness in OpenStreetMap for two federal states in Germany. AGILE GIScience Ser. 2, 1–7. doi:10.5194/agile-giss-2-20-2021
Bundesregierung (2017). Deutsche Nachhaltigkeitsstrategie, 1. Oktober 2016 kabinettbeschluss vom 11, 158–162. Available at: http://www.bmub.bund.de/fileadmin/Daten_BMU/Download_PDF/Klimaschutz/klimaschutzplan_2050_bf.pdf.
Burchell, R. W., Downs, A., McCann, B., and Mukherji, S. (2005). Sprawl costs: economic impacts of unchecked development. Washington.
Butenuth, M., Gösseln, G. V., Tiedge, M., Heipke, C., Lipeck, U., and Sester, M. (2007). Integration of heterogeneous geospatial data in a federated database. ISPRS J. Photogrammetry Remote Sens. 62 (5), 328–346. doi:10.1016/j.isprsjprs.2007.04.003
Buxton, C., Louwsma, M., Müller, H., and Schaffert, M. (2022). “Geospatial data in the 2020s: transformative power and pathways to sustainability,” in International federation of surveyors (FIG). Copenhagen.
Çerçi, S. (2012). The role of historic environments in creating place identity on urban settlements. Available at: https://dergipark.org.tr/tr/download/article-file/207850.
Chapman, S., Watson, J. E., Salazar, A., Thatcher, M., and McAlpine, C. A. (2017). The impact of urbanization and climate change on urban temperatures: a systematic review. Landsc. Ecol. 32, 1921–1935. doi:10.1007/s10980-017-0561-4
Chettry, V. (2023). A critical review of urban sprawl studies. J. Geovisualization Spatial Analysis 7 (2), 28. doi:10.1007/s41651-023-00158-w
Colsaet, A., Laurans, Y., and Levrel, H. (2018). What drives land take and urban land expansion? A systematic review. Land Use Policy 79, 339–349. doi:10.1016/j.landusepol.2018.08.017
C. Couch, G. Petschel-Held, and L. Leontidou (2008). Urban sprawl in Europe: landscape, land-use change and policy (John Wiley and Sons).
Davoudi, S., Crawford, J., Raynor, R., Reid, B., Sykes, O., and Shaw, D. (2018). Policy and practice spatial imaginaries: tyrannies or transformations? Town Plan. Rev. 89 (2), 97–124. doi:10.3828/tpr.2018.7
Deggau, M. (2006). Nutzung der Bodenfläche – Flächenerhebung 2004 nach Art der Tatsächlichen Nutzung. Wirtsch. Stat., 212–220.
M. Dorrian, and F. Pousin (2013). Seeing from above: the aerial view in visual culture (New York: Bloomsbury Publishing).
Dosch, F., and Beckmann, G. (2003). Stand und Perspektiven der Siedlungsflächenentwicklung. BBR. Baul. Immob. 16, 71–102.
Durrant, D., Lamker, C., and Rydin, Y. (2023). The potential of post-growth planning: Re-tooling the planning profession for moving beyond growth. Plan. Theory and Pract. 24 (2), 287–295. doi:10.1080/14649357.2023.2198876
Dyer, G. M., Khomenko, S., Adlakha, D., Anenberg, S., Behnisch, M., Boeing, G., et al. (2024). Exploring the nexus of urban form, transport, environment and health in large-scale urban studies: a state-of-the-art scoping review. Environ. Res. 257, 119324. doi:10.1016/j.envres.2024.119324
EEA - European Environmental Agency (EEA) (2006). Urban sprawl in Europe. The ignored challenge (Luxembourg: EEA Report), 10/2006.Copenhagen
Egidi, G., Cividino, S., Vinci, S., Sateriano, A., and Salvia, R. (2020). Towards local forms of sprawl: a brief reflection on mediterranean urbanization. Sustainability 12 (2), 582. doi:10.3390/su12020582
Ehrhardt, D., Behnisch, M., Jehling, M., and Michaeli, M. (2023). Mapping soft densification: a geospatial approach for identifying residential infill potentials. Build. and Cities 4 (1). doi:10.5334/bc.295
Ehrhardt, D., Eichhorn, S., Behnisch, M., Jehling, M., Münter, A., Schünemann, C., et al. (2022). Stadtregionen im Spannungsfeld zwischen Wohnungsfrage und Flächensparen. Trends, Strategien und Lösungsansätze in Kernstädten und ihrem Umland. Raumforschung und Raumordnung/Spatial Res. Plan. 80 (5), 522–541. doi:10.14512/rur.216
Eichhorn, S. (2023). Infilling in Germany. Estimating the extent of infilling in German municipalities between 1979 and 2011. Landsc. Urban Plan. 240, 104895. doi:10.1016/j.landurbplan.2023.104895
Eichhorn, S., Adam, B., Schürholt, K., Jansen, H., Kötter, T., Terfrüchte, T., et al. (2024a). No net land take policy in practice: applications and potentials of planning instruments in municipalities. Results of an online survey in North Rhine-Westphalia. Raumforschung und Raumordnung| Spatial Res. Plan. 82 (1), 68–84. doi:10.14512/rur.1722
Eichhorn, S., Ehrhardt, D., Münter, A., Behnisch, M., and Jehling, M. (2024b). Understanding land take by low-density residential areas: an institutionalist perspective on local planning authorities, developers and households. Land Use Policy 143, 107198. doi:10.1016/j.landusepol.2024.107198
Evers, D., Katurić, I., and van der Wouden, R. (2024). “Understanding urbanization,” in Urbanization in Europe: past developments and pathways to a sustainable future (Cham: Springer International Publishing), 1–14.
Ferber, U., and Preuß, T. (2009). Flächenkreislaufwirtschaft—Neue Impulse für die Innenentwicklung. FuB-Flachenmanagement Bodenordn. 71 (6), 241.
Fernandez, B., and Hartt, M. (2022). Growing shrinking cities. Reg. Stud. 56 (8), 1308–1319. doi:10.1080/00343404.2021.1975032
Fina, S. (2021). Nachhaltigkeitslücke Landschaftszersiedelung. Berichte Geogr. Landeskd. 94 (4), 278–299. doi:10.25162/BGL-2021-0014
Fina, S., Hamacher, H., Rönsch, J., and Scholz, B. (2023). Land use monitoring and land take in international comparison, report 126/2023. Dessau.
Floater, G., Rode, P., Robert, A., Kennedy, C., Hoornweg, D., Slavcheva, R., et al. (2014). Cities and the New Climate Economy: the transformative role of global urban growth. London School of Economics and Political Science. LSE Library.
Forsyth, A., and Molinsky, J. (2021). What is aging in place? Confusions and contradictions. Hous. policy debate 31 (2), 181–196. doi:10.1080/10511482.2020.1793795
Frazier, A. E., and Kedron, P. (2017). Landscape metrics: past progress and future directions. Curr. Landsc. Ecol. Rep. 2, 63–72. doi:10.1007/s40823-017-0026-0
Fritsch, L. (2021). “GIS-basierte Quantifizierung und Visualisierung der Siedlungsflächenerweiterung von Gemeinden anhand von Bebauungsplangeltungsbereichen,” in Potentiale und Grenzen. Mainz: Hochschule Mainz.
Fyfield, P. H. (2003). Transportation and land use patterns: monitoring urban change using aerial photography. Portland, Oregon, 1925–1945.
Goede, P. (2022). Ausgleichssysteme im nachhaltigen Flächenmanagement. Potenziale und Herausforderungen am Beispiel der Region Rendsburg. Raumforschung und Raumordnung| Spatial Res. Plan. 80 (6), 626–639. doi:10.14512/rur.158
Großmann, K. (2007). “Am Ende des Wachstumsparadigmas? Zum Wandel von Deutungsmustern in der Stadtentwicklung,” in Der fall chemnitz. Bielefeld: transcript Verlag.
Gunder, M. (2010). Planning as the ideology of (neoliberal) space. Plan. theory 9 (4), 298–314. doi:10.1177/1473095210368878
Hamacher, H. (2020). Flächenverbrauch im Recht: 30-Hektar-Ziel und Flächenzertifikatehandel. Nat. Recht 42 (6), 388–394. doi:10.1007/s10357-020-3694-1
Happ, M., Wielgosch, J., and Dieke, A. K. (2022). Open Data bei Katasterdaten: status quo, gute Beispiele und Herausforderungen.
Hartt, M. (2018). Shifting perceptions in shrinking cities: the influence of governance, time and geography on local (In) action. Int. Plan. Stud. 25, 150–165. doi:10.1080/13563475.2018.1540296
Heipke, C., and Rottensteiner, F. (2020). Deep learning for geometric and semantic tasks in photogrammetry and remote sensing. Geo-spatial Inf. Sci. 23 (1), 10–19. doi:10.1080/10095020.2020.1718003
Hicks, D. (2002). Lessons for the future: the missing dimension in education, futures and education series. London: Routledge.
Hochschild, V., Braun, A., Sommer, C., Warth, G., and Omran, A. (2020). “Visualizing landscapes by geospatial techniques,” in Modern approaches to the visualization of landscapes, 47–78.
Höcht, V. (2016). Strategisches Demographie-Management für kleine Kommunen in schrumpfenden Regionen-ein interdisziplinärer Ansatz als Beitrag für eine Demographie orientierte Stadtentwicklungsplanung [Doctoral dissertation, Darmstadt].
Honeck, T. (2018). A touch of post-truth: the roles of narratives in urban policy mobilities. Geogr. Helvetica 73 (2), 133–145. doi:10.5194/gh-73-133-2018
Ivanov, B. K. (2022). Shrinking smart: identifying policy and planning alternatives for addressing urban shrinkage and population decline through cross-national comparative research on approaches from Spain. Ger. Neth. Dr. Diss. Kaiserslautern.
Jaeger, J. A., Bertiller, R., Schwick, C., and Kienast, F. (2010). Suitability criteria for measures of urban sprawl. Ecol. Indic. 10 (2), 397–406. doi:10.1016/j.ecolind.2009.07.007
Jarzebski, S., and Jarzebski, S. (2020). “Illustration: Politische Narrative des Bundestagswahlkampfes 2013,” in Erzählte politik. Wiesbaden: Politische Narrative im Bundestagswahlkampf, 139–215.
Jehling, M., Schorcht, M., and Hartmann, T. (2020). Densification in suburban Germany: approaching policy and space through concepts of justice. TPR Town Plan. Rev. 91 (3), 217–237. doi:10.3828/tpr.2020.13
Johnson, I. L., Lin, Y., Li, T. J. J., Hall, A., Halfaker, A., Schöning, J., et al. (2016). “Not at home on the range: peer production and the urban/rural divide,” in Proceedings of the 2016 CHI conference on human factors in computing systems, 13–25.
Kabisch, N., Korn, H., Stadler, J., and Bonn, A. (2017). Nature-based solutions to climate change adaptation in urban areas: linkages between science, policy and practice. Springer Nat. doi:10.1007/978-3-319-56091-5
Kaika, M., Varvarousis, A., Demaria, F., and March, H. (2023). Urbanizing degrowth: five steps towards a Radical Spatial Degrowth Agenda for planning in the face of climate emergency. Urban Stud. 60 (7), 1191–1211. doi:10.1177/00420980231162234
Kaminski, A., Bauer, D. M., Bell, K. P., Loftin, C. S., and Nelson, E. J. (2021). Using landscape metrics to characterize towns along an urban-rural gradient. Landsc. Ecol. 36 (10), 2937–2956. doi:10.1007/s10980-021-01287-7
Kindsvater, M., and Schaffert, M. (2022). Mapping tranquil landscapes with social media data. A case study in the context of sustainable transformation, FIG Peer. Rev. J., 1–19.
Klemme, M. (2010). Wunsch und Wirklichkeiten in demographisch schrumpfenden Räumen: Handlungslogiken öffentlicher Akteure in der kommunalen Siedlungsflächenentwicklung. FuB-Flachenmanagement Bodenordn. 72 (2), 62.
König, A. (2016). Demografie kompakt 2016: Bürger planen Zukunft im demografischen Wandel. BoD–Books on Demand.
Koprowska, K., Łaszkiewicz, E., and Kronenberg, J. (2020). Is urban sprawl linked to green space availability? Ecol. Indic. 108, 105723. doi:10.1016/j.ecolind.2019.105723
Krause, S. (2014). “Entwicklungsperspektiven von alternden Einfamilienhausquartieren,” in Quartiersforschung. Editor O. Schnur, 377–390.
Lacoere, P., and Leinfelder, H. (2023). No net land take for Flanders. Towards a roadmap for the implementation of Europe’s land target. Raumforschung und Raumordnung| Spatial Res. Plan. 81 (6), 620–635. doi:10.14512/rur.1696
LAGIS - Landesgeschichtliches Informationssystem Hessen (2024). Fürth, Landkreis Bergstrasse. Available at: https://www.lagis-hessen.de/.
Lamker, C. W. (2024). Raumplanung und das Ende von Wachstum und Fläche: Wachstumsbias und Postwachstumskritik. Raumplanung 226 (2), 34–40.
Lewis, J. L., Casello, J. M., and Groulx, M. (2012). Effective environmental visualization for urban planning and design: interdisciplinary reflections on a rapidly evolving technology. J. Urban Technol. 19 (3), 85–106. doi:10.1080/10630732.2012.673057
Lindgren, M., and Bandhold, H. (2003). Scenario Planning–The link between future and strategy. London: Palgrave.
Lindstaedt, T. (2006). Regionsmarketing und die Bedeutung regionsbezogener Identität. Dr. Diss. Tech. Univ. Darmstadt.
Lorbek, M. (2018). Idealizations of the Kleinhaus: on the typology of the small single-family house in Germany, 1920s–1960s. Archit. Hist. 6 (1), 13. doi:10.5334/ah.243
Lowry, J. H., and Lowry, M. B. (2014). Comparing spatial metrics that quantify urban form. Comput. Environ. Urban Syst. 44, 59–67. doi:10.1016/j.compenvurbsys.2013.11.005
Marquard, E., Bartke, S., Gifreu i Font, J., Humer, A., Jonkman, A., Jürgenson, E., et al. (2020). Land consumption and land take: enhancing conceptual clarity for evaluating spatial governance in the EU context. Sustainability 12 (19), 8269. doi:10.3390/su12198269
McDonald, R. I., Güneralp, B., Huang, C. W., Seto, K. C., and You, M. (2018). Conservation priorities to protect vertebrate endemics from global urban expansion. Biol. Conserv. 224, 290–299. doi:10.1016/j.biocon.2018.06.010
Meinel, G., Gössel, J., Heber, B., Hennersdorf, J., and Siedentop, S. (2000). Analyse und Visualisierung von Verstädterungsprozessen mit Hilfe von Geoinformationssystemen am Beispiel der Flächenentwicklung Dresdens. Umwelt-Informatik aktuell 26, 226–239.
Merino-Saum, A., Halla, P., Superti, V., Boesch, A., and Binder, C. R. (2020). Indicators for urban sustainability: key lessons from a systematic analysis of 67 measurement initiatives. Ecol. Indic. 119, 106879. doi:10.1016/j.ecolind.2020.106879
Mete, S. (2022). Towards degrowth housing development? Lessons from a scenario-based gaming session in the Oslo region. Local Environ. 27 (4), 517–536. doi:10.1080/13549839.2021.1964456
Mocnik, F. B., Ludwig, C., Grinberger, A. Y., Jacobs, C., Klonner, C., and Raifer, M. (2019). Shared data sources in the geographical domain—a classification schema and corresponding visualization techniques. ISPRS Int. J. Geo-Information 8 (5), 242. doi:10.3390/ijgi8050242
Mocnik, F. B., Mobasheri, A., Griesbaum, L., Eckle, M., Jacobs, C., and Klonner, C. (2018). A grounding-based ontology of data quality measures. J. Spatial Inf. Sci. 2018 (16), 1–25. doi:10.5311/josis.2018.16.360
Moser, W., Reicher, D., Rosegger, R., de Frantz, M., and Havel, M. (2002). Was ist so schön am Eigenheim. Ein Lebensstilkonzept des Wohnens. Endbericht. Hrsg. Bundesminist. für Verk. Innov. Technol. (BMVIT).
Neis, P., Zielstra, D., and Zipf, A. (2011). The street network evolution of crowdsourced maps: OpenStreetMap in Germany 2007–2011. Future Internet 4 (1), 1–21. doi:10.3390/fi4010001
Neufeld (2015). Leerstandmanagement im Ländlichen Raum. GIS-gestützte Anpassungsmaßnahmen im Demographischen Wandel. Mittl. Fränkischen Geogr. Ges. 60, 91–100.
Nuissl, H., and Siedentop, S. (2021). “Urbanisation and land use change,” in Sustainable land management in a European context: a co-design approach, 75–99.
Odum, W. E. (1982). Environmental degradation and the tyranny of small decisions. BioScience 32 (9), 728–729. doi:10.2307/1308718
Ogilvy, J. A. (2002). Creating better futures: scenario planning as a tool for a better tomorrow. Oxford University Press.
Pallagst, K., Fleschurz, R., Nothof, S., and Uemura, T. (2021). Shrinking cities: implications for planning cultures? Urban Stud. 58 (1), 164–181. doi:10.1177/0042098019885549
Pehlke, D. (2023). Raumordnerische Steuerungstypen der wohnbaulichen Siedlungsentwicklung in Deutschland. Eine bundesweite Analyse der eingesetzten Planungsinstrumente in allen deutschen Planungsregionen. Raumforschung und Raumordnung| Spatial Res. Plan. 81 (3), 271–288. doi:10.14512/rur.111
Peponis, J., Allen, D., French, S., Scoppa, M., and Brown, J. (2007). “Street connectivity and urban density,” in 6th international space syntax symposium (Istanbul: Citeseer), 1–12.
Perlik, M., Wissen, U., Schuler, M., Hofschreuder, J., Jarne, A., Keiner, M., et al. (2008). Szenarien für die nachhaltige Siedlungs-und Infrastrukturentwicklung in der Schweiz (2005-2030): Wissenschaftlicher Abschlussbericht. Zürich: ETH Zurich.
Pesaresi, M., Melchiorri, M., Siragusa, A., and Kemper, T. (2016). Atlas of the human planet 2016. Mapping human presence on earth with the global human settlement layer. EUR 28116. Luxembourg (Luxembourg): Publications Office of the European Union. 2016. JRC103150.
Preuß, T. (2016). Instrumente für das Flächensparen: Aktionsplan und Planspiele. Flächennutzungsmonitoring VIII, 23.
Privitera, R., Palermo, V., Martinico, F., Fichera, A., and La Rosa, D. (2018). Towards lower carbon cities: urban morphology contribution in climate change adaptation strategies. Eur. Plan. Stud. 26 (4), 812–837. doi:10.1080/09654313.2018.1426735
Pro Bahn (2012). Kreis Bergstraße - Strukturschwaches Zonenrandgebiet in Sandwichlage. Available at: https://www.pro-bahn.de/starkenburg/archiv-Dateien/.1009
Ravetz, J., Neuvonen, A., and Mäntysalo, R. (2021). “The new normative: synergistic scenario planning for carbon-neutral cities and regions,” in Planning regional futures (Routledge), 288–314.
Ritzinger, A. (2018). Flächensparen zwischen Anspruch und Wirklichkeit. Zur Rolle von Akteuren und Steuerungsinstrumenten in Dorferneuerungsprozessen. Raumforschung und Raumordnung| Spatial Res. Plan. 76 (5), 395–406. doi:10.1007/s13147-018-0539-y
Rosni, N. A., and Noor, N. M. (2016). A review of literature on urban sprawl: assessment of factors and causes. J. Archit. Plan. Constr. Manag. (JAPCM) 6 (1). doi:10.31436/japcm.v6i1.193
Ruiz-Alejos, C., and Prats, V. (2022). In quest of implementing degrowth in local urban planning policies. Local Environ. 27 (4), 423–439. doi:10.1080/13549839.2021.1983789
Schaffert, M. (2011). “GIS-basiertes Leerstandsmanagement für ländliche Wohngebäude. Szenarien im Spannungsfeld öffentlicher und privater Interessen,” in Core-themes of land use politics. Editor E. Hepperle 349–362.
Schaffert, M., Becker, T., and Steensen, T. (2021). Spatial information supporting a collaborative landscape-based place branding. FIG Peer Rev. J., 1–17.
Schaffert, M., Böhm, K., and Neis, P. (2023). Einfamilienhausgebiete im Umbruch–Auf dem Weg zu einem Monitoring von alternden Quartieren. ZfV-Zeitschrift für Geodäsie. Geoinformation Landmanagement 6/2023, 354–363. doi:10.12902/zfv-0421-2023
Schaffert, M., and Höcht, V. (2018). Geokodierte Meldedaten als Basis bedarfsgerechter Planungen in ländlichen Gemeinden und Regionen. Raumforschung und Raumordnung| Spatial Res. Plan. 76, 421–435. doi:10.1007/s13147-018-0555-y
Schaffert, M., and Sahinkaya, C. (2024). “Mit Geovisualisierungen zum Flächensparen? Eine Ideenskizze,” in Flächennutzungsmonitoring XVI - Flächenpolitik – Flächenanalysen – Methoden und Werkzeuge. Editors G. Meinel, and M. Behnisch (Dresden).
Schaffert, M., Warch, D., and Müller, H. (2024). A planning support system for monitoring aging neighborhoods in Germany. Geomatics 4 (1), 66–80. doi:10.3390/geomatics4010004
Schiefenhövel, J. (2022). “Bürgerbegehren wegen Baugebiet,” in Wohnungen oder alte Obstbäume, Frankfurter Allgemeine Zeitung, 04.05. Available at: https://www.faz.net/aktuell/rhein-main/buergerbegehren-in-kelkheim-wegen-baugebiet-streit-um-eine-streuobstwiese-18003152.html.
Schiller, G., and Siedentop, S. (2005). Infrastrukturfolgekosten der Siedlungsentwicklung unter Schrumpfungsbedingungen. disP-The Plan. Rev. 41 (160), 83–93. doi:10.1080/02513625.2005.10556910
Schlegel, I. (2023). A holistic workflow for semi-automated object extraction from large-scale historical maps. KN-Journal Cartogr. Geogr. Inf. 73 (1), 3–18. doi:10.1007/s42489-023-00131-z
Schlesinger, J. (2015). Using crowd-sourced data to quantify the complex urban fabric—OpenStreetMap and the urban–rural index. Openstreetmap GIScience Exp. Res. Appl., 295–315.
Schmidt, G., and Petry, D. (2005). “Möglichkeiten und Grenzen der Bodenfunktionsbewertung bei der Umsetzung von Bodenschutzzielen,” in GIS-gestützte Bewertung von Bodenfunktionen–Datengrundlagen und Lösungsansätze. Heidelberg: Wichmann, 147–160.
Scholz, I., Keijzer, N., and Richerzhagen, C. (2016). Promoting the sustainable development goals in Germany. Discuss. 13/2016.
Schröder, T., Huck, J., and de Haan, G. (2011). “Nachhaltigkeitsproblem Flächenverbrauch,” in Transfer sozialer Innovationen: Eine zukunftsorientierte Fallstudie zur nachhaltigen Siedlungsentwicklung, 39–49.
Shao, Z., Sumari, N. S., Portnov, A., Ujoh, F., Musakwa, W., and Mandela, P. J. (2021). Urban sprawl and its impact on sustainable urban development: a combination of remote sensing and social media data. Geo-Spatial Inf. Sci. 24 (2), 241–255. doi:10.1080/10095020.2020.1787800
Siedentop, S. (2006). Regionale Flächeninformationssysteme als Bestandteile des Regionalen Flächenmanagements–Entwicklungsstand und Perspektiven. Flächenmanagement. Grundlagen für eine Nachhalt. Siedlungsentwicklung mit Fallbeispielen aus Bayern. Hann. Akad. für Raumforsch. Landesplan. Arbeitsmaterial (322), 67–83.
Siedentop, S., and Fina, S. (2010). Urban sprawl beyond growth: the effect of demographic change on infrastructure costs. Flux, 90–100.
Siedentop, S., and Meinel, G. (2020). 30-Hektar-Ziel erreicht? Wie flächensparend haben sich deutsche Stadtregionen entwickelt? IÖR Schriften 85.
Siedentop, S., Schmidt, S., and Dunlop, A. (2022). Managing urban growth at the regional level: a review of the International Literature. Raumforschung und Raumordnung/Spatial Res. Plan. 80 (6), 659–677. doi:10.14512/rur.1653
Simkin, R. D., Seto, K. C., McDonald, R. I., and Jetz, W. (2022). Biodiversity impacts and conservation implications of urban land expansion projected to 2050. Proc. Natl. Acad. Sci. 119 (12), e2117297119. doi:10.1073/pnas.2117297119
Simon-Philipp, C., and Korbel, J. (2017). Einfamilienhausgebiete als Gegenstand der Stadtentwicklung und Stadtforschung. disP-The Plan. Rev. 53 (1), 106–113. doi:10.1080/02513625.2017.1316579
Smiraglia, D., Salvati, L., Egidi, G., Salvia, R., Giménez-Morera, A., and Halbac-Cotoara-Zamfir, R. (2021). Toward a new urban cycle? A closer look to sprawl, demographic transitions and the environment in Europe. Land 10 (2), 127. doi:10.3390/land10020127
Statistisches Bundesamt (2024). in Gemeindeverzeichnis-Informationssystem GV-ISys. Fürth, Hessen: Statistisches Bundesamt. Available at: https://www.destatis.de/DE/Themen/Laender-Regionen/Regionales/Gemeindeverzeichnis/_inhalt.html#124272.
Svatoňová, H. (2017). Reading satellite images, aerial photos and maps: development of cartographic and visual literacy. Curr. Top. Czech Central Eur. Geogr. Educ., 187–208. doi:10.1007/978-3-319-43614-2_11
Tan, J., Zheng, Y., Tang, X., Guo, C., Li, L., Song, G., et al. (2010). The urban heat island and its impact on heat waves and human health in Shanghai. Int. J. Biometeorol. 54, 75–84. doi:10.1007/s00484-009-0256-x
Thoenes, H. W., Lazar, S., Huck, S., and Miehlich, G. (2004). Bodenbewusstsein–Wahrnehmung. Geschichte und Initiativen. Bodenschutz, ergänzbares Handb. 41.
Thünen-Landatlas (2024). Thünen-Typen ländlicher Räume. Available at: https://karten.landatlas.de/.
Trubka, R., Newman, P., and Bilsborough, D. (2010). The costs of urban sprawl–Infrastructure and transportation. Environ. Des. guide, 1–6. Available at: https://www.jstor.org/stable/26150800?seq=1.
Turowski, G. (2002). Spatial planning in Germany: structures and concepts (No. 1). Stud. Spatial Dev.
UBA - Umweltbundesamt (2009). Flächenverbrauch einschränken–jetzt handeln. Empfehlungen der Kommission Bodenschutz beim Umweltbundesamt. Dessau-Roßlau Umweltbundesamt. Available at: https://www.umweltbundesamt.de/sites/default/files/medien/479/publikationen/e6e82d01.pdf.
Ulfarsson, G. F., and Carruthers, J. I. (2006). The cycle of fragmentation and sprawl: a conceptual framework and empirical model. Environ. Plan. B Plan. Des. 33, 767–788. doi:10.1068/b30104
Umweltbundesamt (2024). Siedlungs-und Verkehrsfläche. Available at: https://www.umweltbundesamt.de/daten/flaeche-boden-land-oekosysteme/flaeche/siedlungs-verkehrsflaeche#anhaltender-flachenverbrauch-fur-siedlungs-und-verkehrszwecke.
van Nes, A. (2019). “Various morphological analyses methods applied in teaching on BSc and MSc level,” in Proceedings of the 12th international space syntax symposium (Beijing: Beijing Jiao Tong University).
Voß, W., and Schröder, J. (2020). Die Große Transformation: Gesellschaftliche Herausforderungen zwischen Stadt und Land. Unimagazin 3/4, 8–11.
Wahrhusen, N. (2021). Governance einer flächensparenden Siedlungsentwicklung durch die Regionalplanung–Eine Analyse in städtisch und ländlich geprägten Regionen. Technische Universität Kaiserslautern. [Doctoral dissertation, Kaiserslautern].
Weymouth, R., Hartz-Karp, J., and Marinova, D. (2020). Repairing political trust for practical sustainability. Sustainability 12 (17), 7055. doi:10.3390/su12177055
Winkler, M. (2018). Das Phänomen» Flächenverbrauch «in der zweiten Hälfte des 20. Jahrhunderts: Indikatorengestützte GIS-Analysen acht europäischer Städte und kartographische Vermittlungsansätze [Doctoral dissertation, Dresden].
Wissen, U. (2009). Virtuelle Landschaften zur partizipativen Planung: Optimierung von 3D-Landschaftsvisualisierungen zur Informationsvermittlung, 5. Zürich: vdf Hochschulverlag AG.
Xue, J. (2022). Urban planning and degrowth: a missing dialogue. Local Environ. 27 (4), 404–422. doi:10.1080/13549839.2020.1867840
Keywords: geovizualisation, geospatial data, urban sprawl, spatial transformation, urban and rural planning
Citation: Schaffert M, Sahinkaya C and Wolff C (2025) Visualizing urban sprawl to raise local awareness. Front. Environ. Sci. 13:1456772. doi: 10.3389/fenvs.2025.1456772
Received: 29 June 2024; Accepted: 21 January 2025;
Published: 05 March 2025.
Edited by:
Nalini Rao, Electric Power Research Institute (EPRI), United StatesReviewed by:
George Pomeroy, Shippensburg University, United StatesCopyright © 2025 Schaffert, Sahinkaya and Wolff. This is an open-access article distributed under the terms of the Creative Commons Attribution License (CC BY). The use, distribution or reproduction in other forums is permitted, provided the original author(s) and the copyright owner(s) are credited and that the original publication in this journal is cited, in accordance with accepted academic practice. No use, distribution or reproduction is permitted which does not comply with these terms.
*Correspondence: Markus Schaffert, bWFya3VzLnNjaGFmZmVydEBocy1tYWluei5kZQ==
Disclaimer: All claims expressed in this article are solely those of the authors and do not necessarily represent those of their affiliated organizations, or those of the publisher, the editors and the reviewers. Any product that may be evaluated in this article or claim that may be made by its manufacturer is not guaranteed or endorsed by the publisher.
Research integrity at Frontiers
Learn more about the work of our research integrity team to safeguard the quality of each article we publish.