 Xiaoyu Chen
 Haohan Wang
 Xingyuan Zhu2
95% of researchers rate our articles as excellent or good
Learn more about the work of our research integrity team to safeguard the quality of each article we publish.
Find out more
ORIGINAL RESEARCH article
Front. Environ. Sci. , 31 January 2025
Sec. Environmental Economics and Management
Volume 13 - 2025 | https://doi.org/10.3389/fenvs.2025.1437018
Strengthening Agricultural Economic Resilience (AER) has become a crucial approach to ensuring food security and promoting sustainable social development, particularly in light of supply shocks such as limited resources, environmental pressures, stagnating agricultural profitability, and diminishing demographic advantages. This study examines AER across 31 Chinese provinces from 2008 to 2020, analyzing its temporal evolution and spatial distribution characteristics. Additionally, it assesses the spatial spillover effects of key driving factors using the Spatial Durbin Model (SDM). The results indicate that China’s average AER rose from 0.167 to 0.266 during the study period, showing a marked upward trend and a gradual reduction in regional disparities. Furthermore, AER exhibits a strong positive spatial correlation, with higher concentrations in the eastern and central regions, while the northeastern and western areas show lower levels. Key factors such as market scale, agricultural GDP, agricultural inputs, research and development, environmental conditions, and urbanization all shape AER. The influence of these factors on regional AER highlights the presence of spatial spillover effects. Notably, the regression coefficient for urbanization on AER is −0.001, significant at the 5% level, indicating a negative spillover effect. In contrast, Market Scale, Agriculture GDP, Agricultural Factor Inputs, and Environmental factors exhibit significant positive spillover effects, all at 5%. The positive spillover effects of other driving factors are not significant. Furthermore, these findings provide practical knowledge for policy adjustments and enhancing interregional coordination to boost AER.
The world today is experiencing unprecedented changes, including more frequent severe weather events, rising trade protectionism, and other factors that have intensified economic instability and unpredictability. Consequently, many countries have seen varying levels of economic recession (Jia et al., 2023). The United Nations’ World Economic Situation and Prospects 2021 report predicted a global economic contraction of 4.3% in 2020, with developed economies shrinking by 5.6% and developing nations by 2.5%. In 2020, the U.S. and Japan experienced negative growth rates of 3.5% and 5.3%, respectively. In contrast, China’s economy grew by 2.3% in 2020, making it the only major economy to achieve positive growth during this period. This highlights the remarkable resilience of China’s economy. In this context, it has become increasingly urgent for scholars and policymakers to identify strategies that enhance the economy’s capacity to withstand repeated “black rhinoceros” events and maintain stable growth. Agriculture plays a key role in the national economy, and boosting its resilience helps unlock the potential of the agricultural economic system. Strengthening agriculture’s resilience will improve its quality, efficiency, and competitiveness, which is crucial for promoting stable development and sustained economic growth (Berry et al., 2022).
As a predominantly agricultural nation, China relies heavily on its agricultural sector, which is the backbone of its economy, playing a crucial role in ensuring social stability and fostering economic growth. However, the rising frequency of natural disasters, the ongoing effects of the COVID-19 pandemic, escalating global climate change, and the complexities of international agricultural trade have heightened the risks and uncertainties surrounding agricultural development (Berry et al., 2022). To ensure sustainable agricultural development, China urgently requires innovative strategies to address the challenges posed by external environmental factors and internal structural shifts. Therefore, developing strategies to mitigate the negative impacts of these unpredictable risks, prevent food security crises exacerbated by the COVID-19 pandemic, enhance the Agricultural Economic Resilience (AER) of China, and ensure food security is both theoretically and practically vital. These efforts are also crucial for revitalizing the rural economy and advancing agricultural modernization (He and Yang, 2021; Hao and Tan, 2020).
Resilience as a concept originated in engineering, but in 1973, Holling expanded its use to the field of ecology. Since then, the study of resilience has broadened significantly across various disciplines. Resilience has evolved with characteristics seen in engineering resilience, ecological resilience, and evolutionary resilience (Chen, 2017; Zhu et al., 2021). Reggiani pioneered the study of spatial economic systems through the lens of resilience. Over time, resilience has become increasingly prominent in economic geography and regional economics (Reggiani et al., 2002). Briguglio et al. (2009) developed a composite index for economic resilience based on four dimensions: market efficiency, governance efficiency, social development, and economic stability. Building on this, Gong et al. (2022) created a resilience evaluation index for urban clusters, emphasizing three key dimensions: risk resistance, adaptability, and innovation and transformation capacity. He et al. (2019) and Luo et al. (2023) employed geographic analysis to explore the heterogeneity of trade resilience. Additionally, Zhu et al. (2021) examined the resilience of industrial clusters by assessing their resistance and adaptability and analyzing the factors that influence them. Through extensive research, the understanding of economic resilience has been refined, providing a solid theoretical foundation for future studies.
With the advancement of economic resilience research, resilience has become increasingly significant in agricultural economics. Agricultural resilience, as described by Folke (2006) and the Resilience Alliance, refers to an agricultural system’s capability to cope with and adapt to external disruptions while preserving its core characteristics and essential functions. Previous research on agricultural resilience has largely concentrated on examining the vulnerability of agricultural production at the ecosystem level. Researchers have developed evaluation indicators to measure this vulnerability (Guo et al., 2021). Additionally, some scholars studied the resilience of agricultural water resources and their dynamic features in Central Asia, using a weighted average method based on multiple indicators (Yu et al., 2021). Yu and Zhang. (2019) assessed provincial AER through its resistance dimension. This analysis provided the foundation for constructing the evaluation index system for AER used in this paper. However, these studies overlooked adaptability and reconstruction, which are vital elements of AER. In summary, these studies primarily addressed the theoretical and practical aspects of agricultural development transformation. However, there remains a notable gap in theoretical and empirical research on AER.
The study of factors influencing economic resilience can be divided into two main categories: one focusing on regional economic resilience, analyzing both internal production characteristics and the external production environment. Research on regional economic resilience emphasizes the important role of internal production features, including social capital (Crespo et al., 2014), creative spirit and culture (Huggins and Thompson, 2015), industrial structure (Xu and Deng, 2020), and total factor productivity (Liu et al., 2021). On the other hand, studies examining the external production environment emphasize various external factors that influence regional economic resilience. These factors include economic agglomeration (Feng et al., 2023), financial support (Cui, 2021), transportation access (Chacon-Hurtado et al., 2020), and urban-rural integration (Li et al., 2021a). Lu et al. (2021) mapped the temporal and spatial patterns of industrial resilience and underscored the key role industrial structure plays in enhancing resilience. Lu et al. (2021) mapped the temporal and spatial patterns of industrial resilience and underscored the key role industrial structure plays in enhancing resilience. Li et al. (2021b) also emphasize that business model innovation is crucial for helping services withstand and recover from shocks. However, research on the factors influencing AER remains limited.
Despite the growing attention to AER in the literature, several research gaps remain. First, many studies have focused on static analyses, neglecting the dynamic changes in agricultural policies, ecological conditions, and technological advancements across regions. This paper fills this gap by examining the spatial spillover effects of AER dynamically, uncovering the mechanisms through which policies and technological advancements in the eastern regions affect AER in the central and western regions, thereby emphasizing the need for coordinated regional development. Second, prior research has often concentrated on a single dimension, such as agricultural output or climate adaptability, overlooking the combined effects of multiple factors. This paper introduces a multidimensional evaluation framework that integrates market size, technological progress, and policy support, broadening the depth and scope of AER research. Additionally, this study investigates the effects of environmental regulation and digital finance on AER. Although these factors have not demonstrated significant short-term effects, they offer potential for future policy interventions. This analysis provides forward-looking insights into emerging policy areas.
The marginal contributions of this study are reflected in the following aspects. First, this study addresses the gap in AER research by thoroughly analyzing the spatial variations in AER across provinces and regions. Additionally, it constructs a scientifically sound AER index system for China and performs accurate calculations. Second, we use Exploratory Spatial Data Analysis (ESDA) to reveal the spatiotemporal evolution characteristics of AER. Using tools such as Moran’s I, this study accurately distinguishes between intra-regional and inter-regional differences in AER, providing empirical support for the coordinated development of regional agricultural economies and filling a gap in the spatiotemporal analysis of AER. Third, this study considers spatial effects in its analysis of driving factors, investigating the spatial spillover effects of various factors on AER using an SDM. The study’s findings are used to decompose the direct and indirect spatial influences, offering guidance for the coordinated and integrated development of AER across various regions. Sustainable agricultural development in China requires consideration of interregional industrial linkages and the spillover effects of key influencing factors, given the unique characteristics of the agricultural sector.
The remaining parts of this study are organized as follows. Section 2 provides a concise overview of the existing literature. Section 3 provides a detailed description of the models and methods employed. The methods part includes entropy weighting, spatial autocorrelation testing, and Spatial Econometric Model. The data part contains calculations of AER, the selection of driving factors, and relevant data sources. Section 4 analyzes the spatial-temporal characteristics of AER and the results of the SDM model. Section 5 provides the conclusions and policy implications based on the results of this study.
We compared regional differences by calculating AER. A spatial weight matrix, based on the distance between provincial geographic centers, was used to verify the spatial correlation characteristics of interregional AER. Using the SDM, we assessed the spatial spillover effects of various drivers on AER, laying a solid foundation for promoting the synergistic development of AER across provinces. The detailed technical research framework is illustrated in Figure 1.
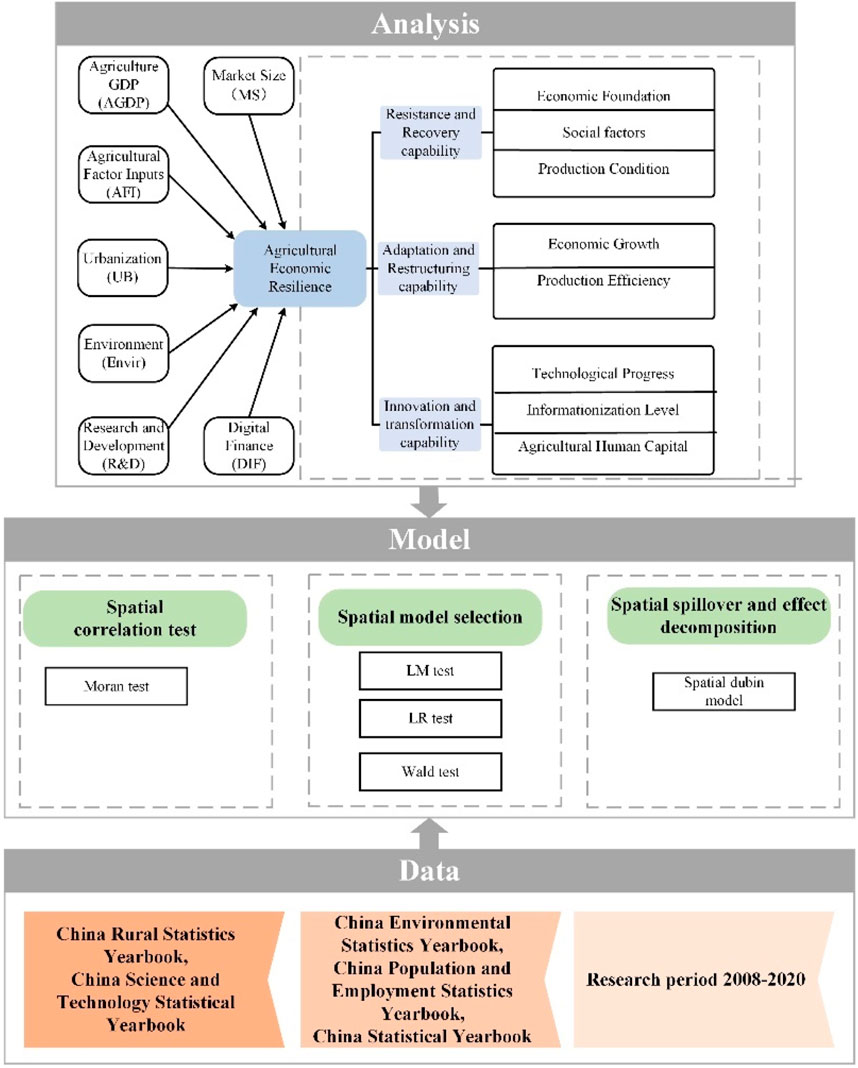
Figure 1. Technical research framework.
Currently, research on measuring AER remains relatively limited. In this paper, we significantly optimize and innovate the indicator system, building on the frameworks of Zhang and Hui (2022) and Jiang et al. (2022). First, based on the “adaptation” and “transformation” dimensions of economic resilience theory (Martin et al., 2016; Cannon and Müller-Mahn, 2010; Sun and Sun, 2017; Zhang et al., 2020; Wang and Wang, 2019), we categorize AER into four levels: resistance, recovery, adaptability, and innovation capacity. This layered structure is more systematic and offers a comprehensive reflection of the agricultural economy’s capability to respond to shocks through multiple dimensions. Second, considering the close practical relationship between resistance and recovery, we merged these two dimensions into one, reducing redundancy in the selection of indicators and improving the practicality of resilience measurement. Thus, AER can be classified into three dimensions: resistance and recovery capability, adaptation and restructuring capability, and innovation and transformation capability. Additionally, we optimized the selection of indicators by including factors such as the number of rural residents receiving minimum living security and government expenditures on agriculture, forestry, and water resources. These additions ensure that the indicator system better aligns with the unique characteristics of China’s agricultural economy. The specific indicators selected are detailed below.
Within this context, resistance and recovery capability refers to the agricultural economic system’s capability to withstand and recover from sudden and disruptive events. To measure it, 11 indicators were selected, covering three dimensions: Economic Foundation, Social Factors, and Production Conditions (Ge et al., 2022; Zhang and Hui, 2022). Adaptation and restructuring capability refers to the agricultural economic system’s ability to adjust to stressful disturbances. These disturbances can influence the economic, social, and daily lives of farmers over a certain period. Therefore, six indicators related to Economic Growth and Production Efficiency were chosen for evaluation. Innovation and Transformation Capability refers to actions taken by governments, society, enterprises, or farmers to mitigate, sustain, or restore the agricultural economic system. Accordingly, we focus on 7 indicators classified into three dimensions: Technological Progress, Information Level, and Agricultural Human Capital. The specific indicators are detailed in Table 1.
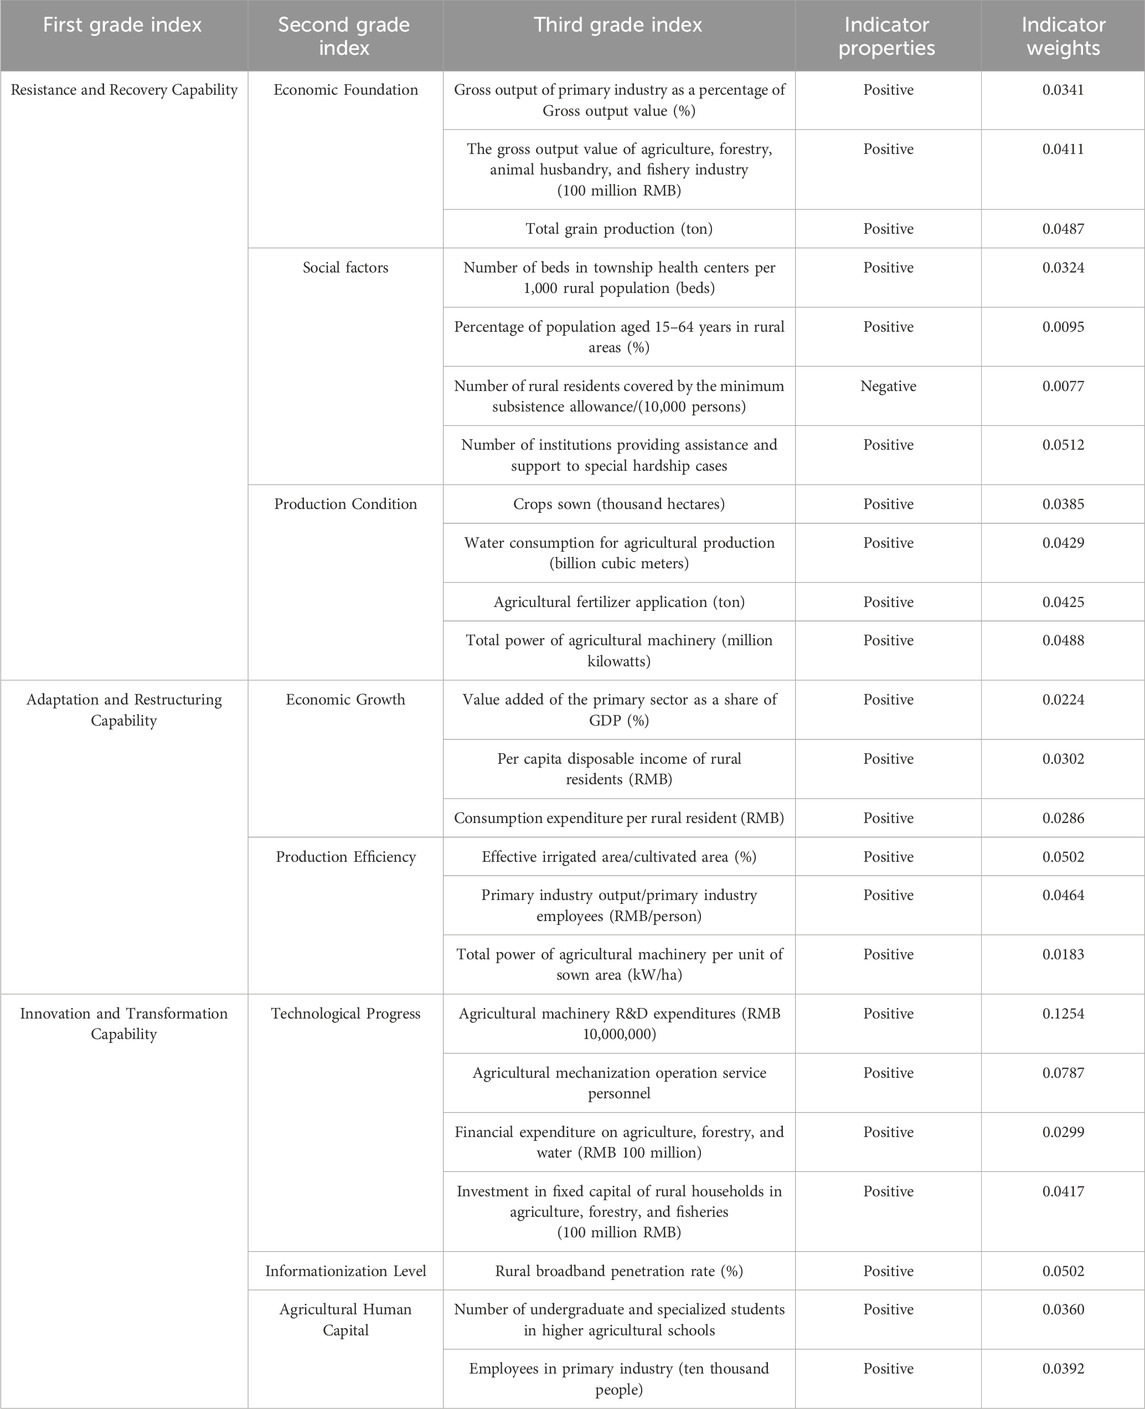
Table 1. Index system of rating for AER.
The entropy evaluation method, developed by Shannon (1948) and rooted in information theory, assigns relative weights to indicators by assessing their variability within a system. Indicators with greater variability hold stronger explanatory power and are thus assigned higher weights. The method is highly regarded for its objectivity, as it removes subjective bias, ensuring both scientific accuracy and fairness in evaluations. The entropy method has been extensively used in multidimensional assessments, such as economic resilience (Ding et al., 2021) and financial resilience (Cao et al., 2021) In this paper, since the AER indicators cover multiple dimensions with varying units and scales, a dimensionless processing step was applied before using the entropy method. This process ensures accurate comparison and evaluation of the indicators, improving the rationality of the weight distribution. The specific steps are as follows.
Firstly, Calculate the information entropy with the following formula:
where
Secondly, Calculate the coefficient of variation between indicators with the following formula:
Where
Thirdly, Obtain the indicator weights. The formula is as follows:
Finally, the calculation of the composite score:
The spatial econometric model originates from Tobler’s (1970) “First Law of Geography,” which states that “everything is related to everything else, but near things are more related than distant things.” Given the regional characteristics of agricultural economic systems, AER is influenced not only by internal factors such as local economic and social conditions but also by the spillover effects from neighboring regions. This model can uncover the direct effects of driving factors on AER within a region, while also capturing their indirect effects on surrounding regions. Therefore, when analyzing AER, it is essential to first test for significant spatial correlation between regions, as this is critical for understanding the subsequent spatial spillover effects (Kelejian and Prucha, 2010). The Global Moran’s I statistic, which ranges from −1 to 1, is a reliable measure of global autocorrelation. It can be used to assess the spatial correlation and overall distributional characteristics of AER across provinces. When the value is below 0, there exists a negative spatial connection in the AER between regions. AER increases as the value decreases, indicating a higher level of decentralization. When the value is over 0, there is a positive spatial correlation in the AER among provinces. As the value increases, the correlation between AER among regions becomes tighter. When the value is 0, there is no interdependence or spatial relationship between the levels of AER among provinces. Global Moran’s I statistics are shown in Equation 6:
where
To examine the effects of spatial spillovers, researchers commonly employ LM, LR, and Wald tests as preliminary evaluations to identify the spatial econometric model that best matches what has been seen. Anselin (2013) proposed two spatial autocorrelation models, the Spatial Lag Model (SLM) and the Spatial Error Model (SEM). The SLM model focuses on whether there is diffusion of variables within the same region, and the SEM model focuses on the effect of errors in dependent variables within neighboring regions on regional observations. In 2009, Lesage, J. et al. constructed a Spatial Durbin Model (SDM) based on Anselin’s research. The transformation between models is shown in Figure 2. In Particular, the SDM contains lagged terms for both dependent and explanatory variables, which helps to reduce bias due to the omission of variables from the empirical analysis. Based on this, this study constructs an SDM to test the spatial spillover effects of driving factors on AER. LR and Wald tests determine whether the model can be reduced to SLM and SEM. The formulation of SDM is shown in Equation 8:
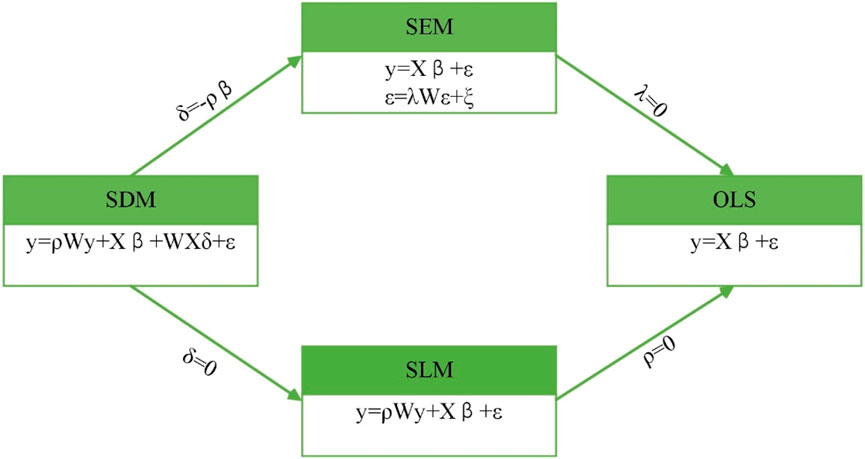
Figure 2. Transfer among spatial econometric models.
where
AER refers to the capability of a regional agricultural economic system to resist and recover from external disruptions. It is influenced by various factors, including economic conditions, scientific and technological advancements, input factors, and the natural environment. Through a systematic review of existing literature (Martin R et al., 2016; Jiang et al., 2022; Zhang and Hui, 2022; Du and Liu, 2010; Zhang et al., 2012) and guided by the principles of scientific rigor and data operability, this study identifies and selects eight indicators as the driving factors.
(1)Market Scale. Expanding markets can stimulate regional economies, increase consumption and investment, and promote structural changes in agriculture, all of which contribute to improving AER (Zhang and Hui, 2022). (2) Agriculture GDP. Regions with larger agricultural sectors tend to have stable economic foundations, favorable production conditions, and higher levels of agricultural modernization, leading to stronger AER. We use the gross agricultural product per farm as a measure of Agriculture GDP. (3) Agricultural Factor Inputs. Land and capital are key inputs in agriculture, and regions with higher levels of both often develop large-scale production, enhancing AER. We measure Agricultural Factor Inputs using the average agricultural acreage sown. (4) Urbanization. The migration of farmers to urban areas and non-agricultural industries, as part of urbanization, impacts the agricultural economy both positively and negatively. In this study, we use the urbanization rate as the indicator for Urbanization (Yang and Li, 2020). (5) Regulation. A healthy natural environment is vital for agriculture, and stricter environmental regulations can improve production conditions while promoting sustainable growth. We measure Regulation using the Total Investment in Environmental Pollution Control. (6) Environment. A favorable ecological environment contributes to improving AER. We use the forest cover rate as the indicator for Environment. (7) Research and Development. Science and technology play a crucial role in boosting economic resilience. We use the intensity of R&D investment to measure Research and Development. (8) Digital Finance. Digital finance is a key driver of modern financial development and plays an important role in enhancing AER. We use the Peking University Digital Inclusive Finance Index to measure digital finance (Ren and Yin, 2022). See Table 2 for specific variable definitions.
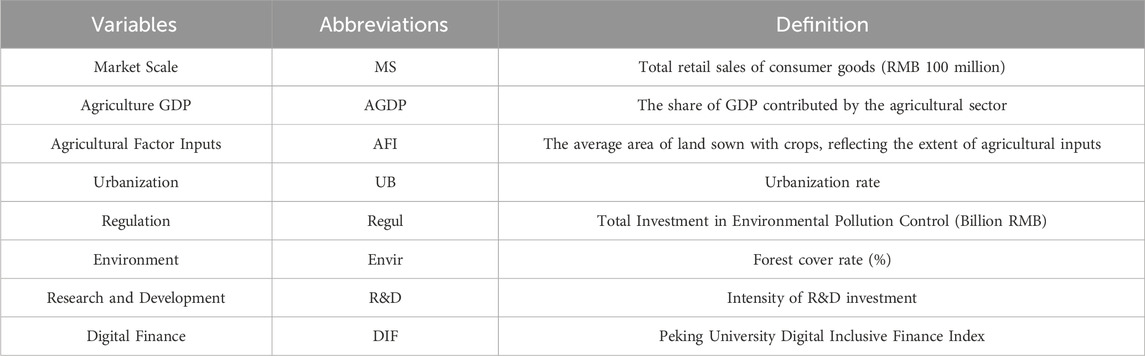
Table 2. Definition of variables affecting AER.
The selected variables were combined into Equation 8 to determine the final SDM as shown in Equation 9.
This study focused on 31 provinces in China (excluding Hong Kong, Macao, and Taiwan). A comprehensive evaluation was made to identify the AER, including an analysis of the regional variability within it and the spatial spillover effects of the driving factors. The data used in this study are sourced from the 2008–2020 releases of the China Rural Statistics Yearbook, China Science and Technology Statistics Yearbook, China Environment Statistics Yearbook, China Statistics Yearbook, and China Population and Employment Statistics Yearbook. Linear interpolation was used to fill in the missing data points.
Based on Formulas 1–5, the AER in China from 2008 to 2020 was calculated (Figure 3). During this period, the AER of China’s provinces exhibited a general upward trend, indicating a steady improvement in the agricultural sector’s capability to withstand and recover from external risks. This result supports the theory of regional economic resilience, indicating that economic systems can recover and adapt through policy support and internal adjustments when faced with external shocks (Martin et al., 2016). As the national economic environment improved and agricultural policies were reinforced, AER exhibited a pronounced positive trend throughout the study period. At the regional level, the AER in the eastern and central provinces significantly surpassed the national average and far outpaced other regions. This is consistent with the theory of regional economic disparities, as the eastern and central provinces, situated in the lower reaches of the Yangtze River Plain, benefit from advantageous natural conditions and geographic positioning, fostering a more conducive agricultural production environment (Li and Liu et al., 2021). Moreover, rapid economic development and land reforms in these regions have catalyzed the advancement of agricultural mechanization, further amplifying AER. This not only substantiates the theory of regional economic disparity but also underscores the critical role of mechanization in augmenting AER.
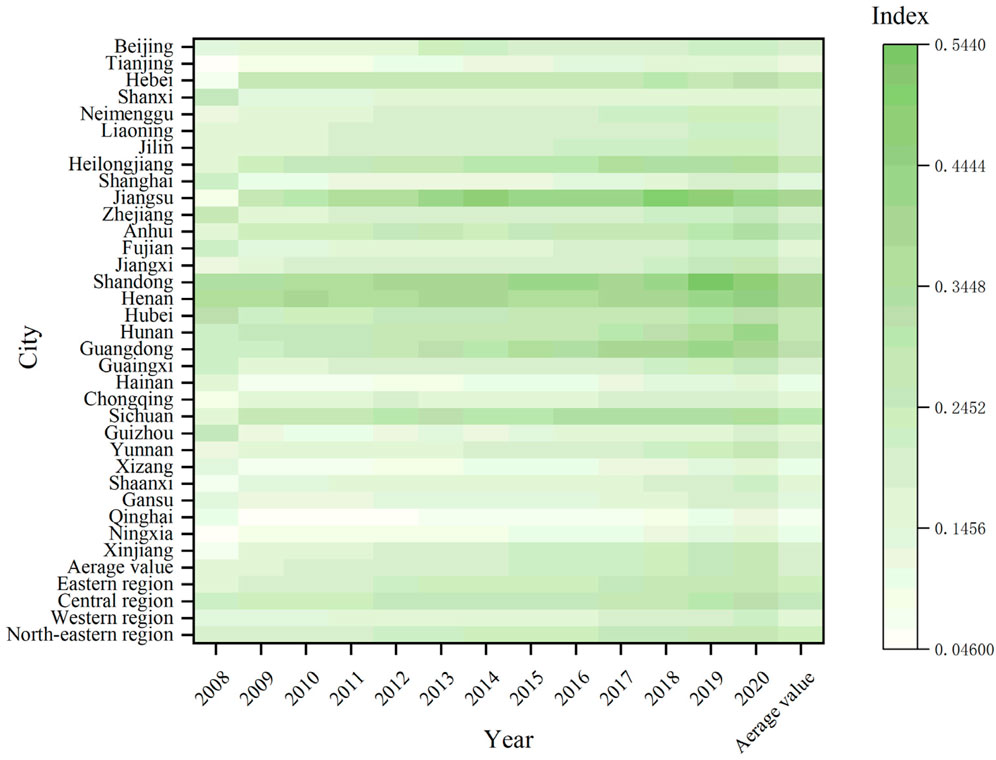
Figure 3. Evaluation of the AER from 2008 to 2020.
Specifically, the average AER values for Shandong, Henan, and Jiangsu are 0.406, 0.386, and 0.385, respectively, significantly higher than other provinces. These provinces have recently optimized their agricultural supply chains, increased brand value, and established agricultural demonstration zones, fostering modern agricultural systems that emphasize innovation, sustainability, and efficiency. These efforts not only enhance AER but also play a pivotal role in safeguarding national food security. These findings provide practical evidence of the significant impact of agricultural policy innovation on improving regional AER. Conversely, the average AER values for Qinghai and Ningxia are 0.076 and 0.099, respectively, far below the national average. The harsh geographic conditions and lagging economic development in these areas contribute to weaker AER. This observation corroborates the theoretical framework of regional economic resilience, which suggests that regions with constrained economic resources exhibit diminished recovery capacity when confronted with external shocks (Cannon and Müller-Mahn, 2010). Moreover, cities like Beijing, Tianjin, and Shanghai, despite their overall economic strength, demonstrate low AER. In these highly urbanized cities, agriculture contributes minimally to the local economy, and high land and living costs undermine the competitiveness of agricultural production, resulting in reduced agricultural labor and weakened resilience. This highlights the inherent challenges in achieving sustainable agricultural development within densely urbanized regions.
Using the Natural Breaks (Jenks) method, the level of the AER in each province was categorized into four categories: higher value (>0.334), high value (0.196–0.333), medium value (0.096–0.195), low value (<0.095). Due to page limitations, the results for 2008 and 2020 were selected to map the evolution of the Spatial and temporal distribution of China’s AER (Figure 4).
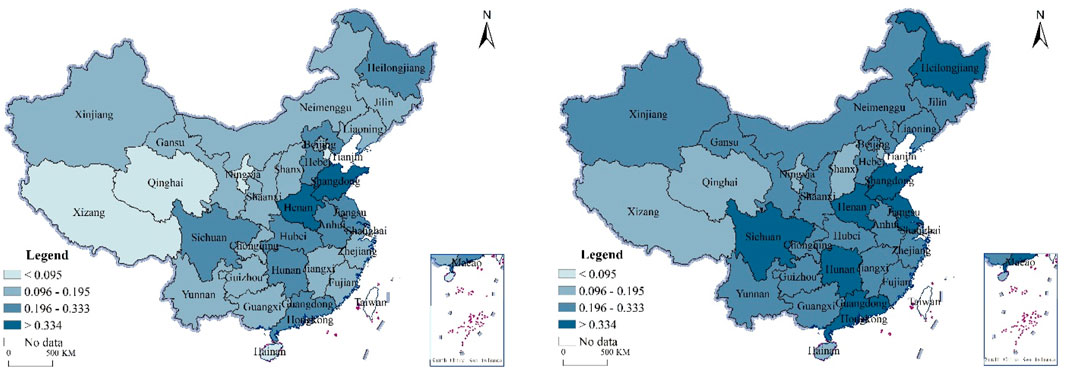
Figure 4. Spatial and temporal distribution of AER China; the graphs represent 2008 (left) and 2020 (right), respectively.
Overall, from 2008 to 2020, China’s AER improved markedly, with the eastern coastal regions surpassing the central and western areas, demonstrating notable regional disparities. Among them, the number of moderately high-value regions increased from 0 in 2008 to 7 in 2020, while the number of high-value regions increased from 13 to 16, with a growth rate of approximately 23.08%. The number of medium-value regions remained relatively stable, while low-value regions gradually disappeared, decreasing from 4 to 0. This trend demonstrates a significant improvement in AER across the country, with the regional gap narrowing. The eastern coastal regions, benefiting from stronger economic foundations, policy support, and technological advancements, have greatly enhanced their agricultural systems’ resilience and recovery capacity.
In 2008, the spatial distribution of AER exhibited a low-level pattern extending from the northeast to the southwest, with greater resilience concentrated in the eastern regions (with some provincial exceptions). This reflects a more established economic base, advanced infrastructure, and strong policy support. Conversely, the AER in the central and western regions was notably weaker, especially in provinces such as Xinjiang, Tibet, Qinghai, Heilongjiang, Shanxi, Shaanxi, Yunnan, Gansu, and Guizhou, where adverse natural conditions, insufficient infrastructure, and technological delays presented considerable obstacles. This observation aligns with regional economic development theory, which asserts that economically advanced regions, leveraging resource optimization, technological adoption, and policy support, possess a greater capability to withstand external shocks (Martin and Sunley, 2015). By 2020, the improvement in AER became particularly pronounced, with a notable increase in the number of provinces falling within the high and medium resilience categories, while low-resilience areas declined significantly. This advancement can be attributed to several key factors, including policy interventions, technological progress in agriculture, and improved infrastructure, which collectively have been instrumental in enhancing AER across the nation (Yuan et al., 2024), particularly in the central and western regions. The spatial distribution of AER underscores the critical importance of policy support and technological advancements in narrowing regional disparities and bolstering resilience in these regions.
Figure 5 illustrates the global autocorrelation coefficients. It is obvious that the p-value is positive in most years and satisfies the significance level test of 0.05. It indicates a positive spatial correlation of AER between provinces.
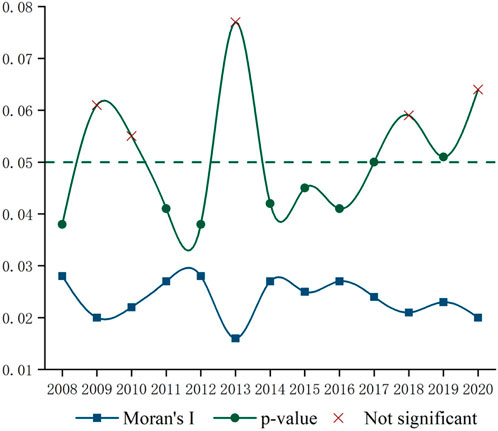
Figure 5. Autocorrelation test results.
The analysis of regional AER suggests that spatial econometric models are better suited for examining the driving factors. This study conducts a series of model selection tests to identify the most appropriate spatial econometric models for analyzing the geographical influence of MS, GDP, AFI, UB, Regul, Envir, R&D, and DIF on AER. The results of these tests are presented in Table 3. After completing the autocorrelation test, the LM test was utilized to determine whether the OLS model or the spatial econometric model was more appropriate. The LM test results indicate that the p-values are statistically significant at the 1% level. Consequently, the OLS model is rejected in favor of the spatial econometric model.
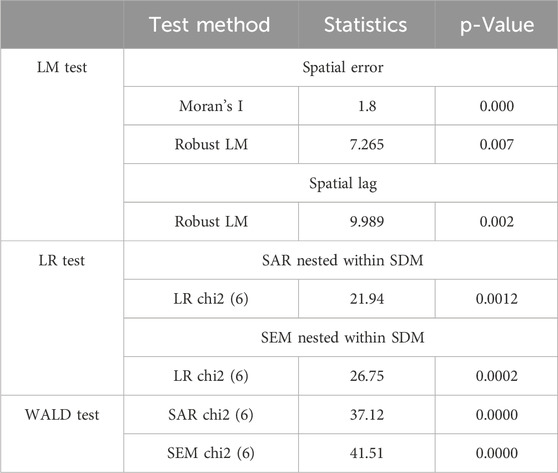
Table 3. The LM, LR, and WALD test results.
In selecting the appropriate spatial econometric model, we assume that the SDM is the most suitable for verifying and analyzing spatial effects. This is because the SDM not only accounts for the spatial lag of the dependent variable but also captures the spatial spillover effects of the explanatory variables (LeSage and Pace, 2009). In comparison, the SLM addresses the spatial dependence of the dependent variable but overlooks the spillover effects of the explanatory variables. The SEM focuses solely on correcting spatial autocorrelation in the error term and cannot directly capture the spatial spillover effects between variables. Therefore, the SDM provides a more comprehensive representation of the complex spatial transmission mechanisms affecting regional AER. Subsequently, the LR test is employed to evaluate whether the SDM may be simplified to SEM or SLM. Table 3 displays the results of the LR test. The null hypothesis can be rejected due to the significant test results at the 1% level, indicating that the SDM is not transforming into SEM or SLM. The results shown in Table 3 indicate that both the Wald and LR tests have rejected the null hypothesis with a significance level of 1%, supporting the validity of the SDM as the optimal model. In summary, the SDM offers significant advantages over the SLM and SEM, as it more accurately captures spatial dependence and spillover effects in the study. Additionally, it passed a series of model tests, making the SDM model the most suitable choice for this research.
Drawing on the results of the preceding spatial correlation and spatial model selection tests, this study analyzed the impact of MS, AGDP, AFI, and other driving factors on AER. The analysis was conducted using the SDM formulated in Equation 8, and the results, presented in Table 4, show the outcomes of the fixed effects SDM estimations. The results of the three fixed effects models used in this study demonstrate robustness, with the spatial and temporal fixed effects models being more precisely constructed. Therefore, this study focuses exclusively on the results of the SDM two-way fixed effects model, while the results of the other models are used for reference purposes only.
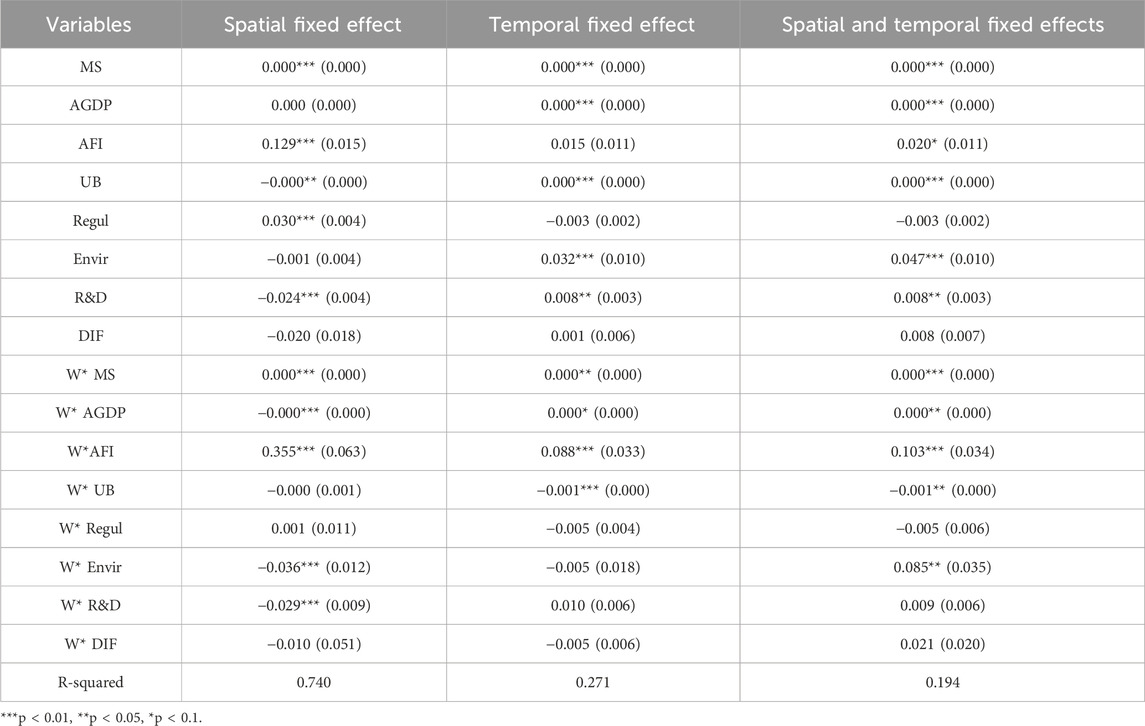
Table 4. Fixed-effect space Durman panel model estimation results.
In particular, the influence of MS, AGDP, UB, and Envir on AER is significantly positive at the 1% level, indicating that these factors had a substantial impact on AER’s capacity to withstand and recover from challenges during the study period. Facing the increasing economic challenges, agriculture must rely on a substantial market for support, as robust consumer demand effectively stimulates the growth of the agricultural economy. Simultaneously, agriculture must rely on a substantial market for support, as robust consumer demand effectively stimulates the growth of the agricultural economy. A favorable ecological environment is essential for the sustainable production and development of agriculture (Yuan et al., 2022). Therefore, expanding large-scale agricultural development or enhancing the ecological environment will significantly advance AER. The impact of AFI and R&D on AER is also significantly positive. This is due to the limited availability of arable land, making the efficient use of resources like pesticides, fertilizers, and plastic films essential for controlling pests and diseases while increasing crop yields per unit area. Furthermore, reliance on scientific and technological advancements has boosted productivity through the introduction of modern facilities, agricultural machinery, and the modernization of irrigation and farming techniques. These advancements have facilitated agricultural modernization, thereby reinforcing AER. Notably, the intensity of Regul and DIF in China did not pass statistical significance tests. This suggests that policies related to “environmental regulation” and “digital finance” in China have not had a significant effect on AER.
Table 5 exhibits the results of the decomposition of the spatial spillover effects of driving factors on the AER. Direct effects refer to the direct influence that driving factors from the province have on the AER in the region. Indirect effects refer to the indirect effects that the driving factors have on the AER of the surrounding region. The AER is affected, to a certain degree, by the driving factors of the surrounding provinces.
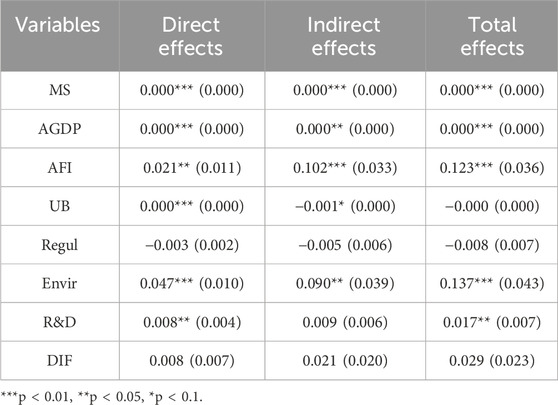
Table 5. Spatial spillover effect decomposition of spatiotemporal fixed-effect SDM model coefficients.
The coefficients for the direct effect, indirect effect, and total impact of MS have all passed the significance test. This indicates that a favorable market environment positively influences the enhancement of a region’s AER, and expanding the market scale can strengthen both the region’s AER and that of its surrounding regions. Expanding the market scale accelerates agricultural modernization, aiming to increase farmers’ incomes by enhancing production efficiency, upgrading product quality, and offering more employment opportunities and financial support. Surrounding regions, due to their geographical proximity, will benefit from priority in trade exchanges and gain access to advanced technology and knowledge, which in turn enhances their AER (Liu and Kong, 2021).
The statistical analysis indicates that AGDP in the region exerts a positive influence on AER. This was evidenced by significant direct, indirect, and total effects. Additionally, the AER in surrounding regions has also experienced improvement. The primary driver of this trend is the implementation of policies such as “Western Development,” “Northeast Revitalization,” and “Central Rise,” which have contributed to continuous development across various regions in China, thereby reducing inter-regional disparities. As a result, AER in China is considerably stronger compared to other industries, displaying a more balanced distribution across regions and benefiting from economies of scale.
The statistical significance test confirmed the presence of direct, indirect, and total impacts of AFI. The evidence indicates that both the quantity and quality of agricultural resources exert a significant influence on AER in the region and neighboring areas. Moreover, this influence is becoming increasingly pronounced over time. The long-term success of China’s agricultural modernization hinges on a sufficient level of AER, which directly impacts the productivity of agricultural factors and the extent of regional disparities.
The direct effect coefficient of UB is 0.000, and the indirect effect coefficient is −0.001, both statistically significant, leading to a total effect coefficient of −0.000. This indicates that within a region, the increase in UB significantly enhances agricultural mechanization and technology adoption, improving production conditions and advancing agricultural modernization, thus positively influencing Agricultural Economic Resilience (AER) within the region (Hu et al., 2018). However, UB exerts a significant negative spatial spillover effect on the AER of surrounding areas. As per the “siphon effect” theory, developed regions experience rapid growth by drawing essential production factors, such as labor, capital, and technology, from neighboring areas (Arauzo-Carod and Viladecans-Marsal, 2009). While this concentration of resources enhances urban economic vitality in the short term, it depletes resources and investment opportunities in surrounding regions. The outflow of talent and capital diminishes the efficiency of agricultural resource allocation, impeding agricultural production capacity in adjacent regions and ultimately weakening their AER (Su et al., 2015). Additionally, environmental pollution from UB and encroachment on agricultural land may exacerbate the decline in agricultural production in neighboring regions. Thus, while UB strengthens AER within regions, its negative spillover effects hinder the sustainable development of agriculture in surrounding areas.
The statistical significance tests verified the presence of direct, indirect, and total effects of Envir. This suggests that a favorable environment can significantly boost AER, both within the region and in surrounding regions. ‘Mountains and rivers green are mountains of silver and gold.’ The region’s high forest cover rate reflects its commitment to prioritizing ecological preservation and restoration. This approach will enhance the region’s AER (Yang et al., 2019).
The direct and total effects of R&D were positive and significant, and the indirect effect was not significant. This indicates that investing in R&D positively impacts long-term AER. These results support the view that scientific innovation is a key driver of long-term AER. This finding supports the view that scientific innovation is a key driver of long-term AER.
Although the impact of Regul in this study was not significant, its potential mechanisms are worth further exploration. Stringent environmental regulations may inhibit AER through several channels. First, strict Regul increase compliance costs for businesses and agricultural producers, who must invest more to meet environmental standards. These costs include upgrading environmental protection equipment and handling pollutants (Zhang and Qiao, 2021). For small-scale farmers or medium and small agricultural enterprises with limited resources, these additional burdens can reduce production efficiency, negatively affecting AER. Additionally, inconsistent regional enforcement of Regul may lead to the relocation of high-pollution industries to areas with more lenient regulations, a phenomenon known as the “pollution haven effect” (Copeland and Taylor, 2004). This shift exacerbates environmental pressure in affected regions, deteriorating local agricultural production conditions and weakening sustainability. Although this effect was not significant in the current study, it may be attributed to the relatively short implementation period of Regul, which may not yet have produced long-term impacts, or to uneven enforcement across regions, leading to inconsistent outcomes.
The impact of DIF on China’s AER is not significant. P Provinces with a strong emphasis on agriculture may experience lower utilization of DIF, resulting in a less significant effect on AER and a diminished role in promoting it.
Strengthening AER, the foundational industry supporting national livelihoods is crucial for the modernization and advancement of agriculture. This study examines the temporal and spatial characteristics of AER across 31 provinces in China from 2008 to 2020. Furthermore, it utilizes the SDM to analyze the spatial spillover effects of various driving factors on AER. The main conclusions are as follows.
Firstly, China’s AER has exhibited overall fluctuating growth. T The evolution of AER can be divided into three distinct phases: From 2008 to 2013, AER growth accelerated, reaching its first peak of 0.209 in 2013, though the overall level remained suboptimal. Between 2013 and 2016, AER growth slowed. From 2016 to 2020, AER experienced a period of stable growth, with a positive trend emerging despite a consistent overall pattern. Since 2016, China has seen significant growth in AER, largely driven by its increased openness to the international market. Regionally, AER is stronger in the eastern coastal provinces, while it remains weaker in the central-western and northeastern regions. Consequently, AER development within these regions is marked by imbalances and inconsistencies. Throughout the study period, AER has increased notably in most regions, especially in those that were previously less resilient. These areas have seen rapid development, gradually closing the gap with more developed regions.
Secondly, the factors of MS, AGDP, AFI, UB, Envir, and R&D all positively influence AER levels. Additionally, a province’s AER is influenced by the AER of neighboring provinces. This implies that a province’s AER can be affected by the driving factors in surrounding provinces. Notably, UB exerts a significant negative spatial spillover effect, as the “siphon effect” concentrates labor factors from other provinces and cities in one region, leaving surrounding regions with “empty nests.” Consequently, rapid urbanization in one region may weaken the AER of surrounding regions. Regul and DIF did not have a significant impact. Aside from that, the other driving factors reflect impacts similar to their direct effects.
Firstly, considering the varying levels of AER development across eastern, central, and western China, it is crucial to enhance cooperation and technology exchange between regions to mitigate disparities. A key approach is to establish mechanisms that facilitate the transfer of advanced agricultural technology and management practices from the more developed eastern regions to the west. For instance, initiatives such as the East-West support program can transfer modern agricultural equipment and techniques to the West, building on the success of the “Western Development Strategy,” which has notably enhanced agricultural productivity. For instance, initiatives such as the East-West support program can transfer modern agricultural equipment and techniques to the West, building on the success of the “Western Development Strategy,” which has notably enhanced agricultural productivity. Although funding may pose challenges, targeted loans, and long-term support mechanisms can offer the necessary resources to ensure the sustainable growth of these entities. Additionally, fostering agricultural markets in the West and reducing trade barriers is vital for regional integration. Initiatives like organizing regional expos and promoting the integration of agricultural products between eastern and western regions can contribute to this goal. Drawing on the success of the Western Development Strategy, coordinating regional policies, and enhancing market integration will further help reduce regional disparities.
Secondly, provinces should capitalize on economic and technological factors to improve AER both locally and in neighboring regions. For example, Jiangxi’s “High-Standard Farmland” project has effectively improved agricultural production efficiency and can serve as a model for other regions. Promoting agricultural technology innovation is another crucial step. Establishing a specialized technology fund can drive the development of organic and ecological farming, reducing dependency on pesticides and fertilizers. Providing subsidies and policy incentives, as evidenced by Jiangxi’s successful “Ecological Agriculture” model, can promote the adoption of green agricultural technologies. Finally, fostering ecological civilization through policies supporting organic farming, crop rotation, and fallow systems is essential for minimizing agriculture’s environmental impact. Strengthening water and soil conservation efforts, inspired by the success of Jiangxi’s ecological agricultural initiatives, can effectively promote sustainable agricultural development.
The raw data supporting the conclusions of this article will be made available by the authors, without undue reservation.
XC: Data curation, Investigation, Methodology, Software, Supervision, Validation, Visualization, Writing–original draft, Writing–review and editing. HW: Conceptualization, Formal Analysis, Funding acquisition, Project administration, Resources, Supervision, Writing–review and editing. XnZ: Validation, Software, Writing - review and editing. XaZ: Project administration, Validation, Funding acquisition, Resources, Writing - review and editing.
The author(s) declare that financial support was received for the research, authorship, and/or publication of this article. This study was supported by The National Natural Science Foundation of China (Grant No. 72373078), and Zhejiang Soft Science Research Program (Grant No. 2024C35G1121094).
The authors declare that the research was conducted in the absence of any commercial or financial relationships that could be construed as a potential conflict of interest.
All claims expressed in this article are solely those of the authors and do not necessarily represent those of their affiliated organizations, or those of the publisher, the editors and the reviewers. Any product that may be evaluated in this article, or claim that may be made by its manufacturer, is not guaranteed or endorsed by the publisher.
Arauzo-Carod, J. M., and Viladecans-Marsal, E. (2009). Industrial location at the intra-metropolitan level: the role of agglomeration economies. Reg. Stud. 43 (4), 545–558. doi:10.1080/00343400701874172
Berry, R., Vigani, M., and Urquhart, J. (2022). Economic resilience of agriculture in England and Wales: a spatial analysis. J. Maps 18 (1), 70–78. doi:10.1080/17445647.2022.2072242
Briguglio, L., Cordina, G., Farrugia, N., and Vella, S. (2014). Economic vulnerability and resilience: concepts and measurements, in Oxford Development Studies, 37 (3), 229–247. doi:10.1080/13600810903089893
Cannon, T., and Müller-Mahn, D. (2010). Vulnerability, resilience and development discourses in context of climate change. Nat. hazards 55, 621–635. doi:10.1007/s11069-010-9499-4
Cao, Q., Yang, X. Q., and Tian, S. Y. (2021). Financial resilience, additive effects and its correlation with business cycles. Finance & Econ. (06), 12–25. (in chinese).
Chacon-Hurtado, D., Kumar, I., Gkritza, K., Fricker, J. D., and Beaulieu, L. J. (2020). The role of transportation accessibility in regional economic resilience. J. Transp. Geogr. 84, 102695. doi:10.1016/j.jtrangeo.2020.102695
Chen, M. (2017). Progress in research on international regional economic resilience-Introduction to a theoretical analysis framework based on evolution theory. Prog. Geogr. 36 (11), 1435–1444. (in chinese).
Copeland, B. R., and Taylor, M. S. (2004). Trade, growth, and the environment. J. Econ. literature 42 (1), 7–71. doi:10.1257/002205104773558047
Crespo, J., Suire, R., and Vicente, J. (2014). Lock-in or lock-out? How structural properties of knowledge networks affect regional resilience. J. Econ. Geogr. 14 (1), 199–219. doi:10.1093/jeg/lbt006
Cui, G. (2021). Can digital finance enhance China's economic resilience. J. Shanxi Univ. Finance Econ. 43 (12), 29–41. doi:10.13781/j.cnki.1007-9556.2021.12.003
Ding, J. J., Wang, Z., Yu, F., and Liu, Y. (2021). Targeted poverty alleviation drives the process and mechanism of rural reconstruction: a case study of Shibadong Village. Acta Geogr. Sin. 76 (10), 2568. doi:10.11821/dlxb202110016
Du, J., and Liu, Y. (2010). Analysis of factors contributing to the agricultural economic growth: physical capital, human capital, or foreign trade? Nankai Econ. Stud. 3, 73–89. doi:10.14116/j.nkes.2010.03.007
Feng, Y., Lee, C. C., and Peng, D. (2023). Does regional integration improve economic resilience? Evidence from urban agglomerations in China. Sustain. Cities Soc. 88, 104273. doi:10.1016/j.scs.2022.104273
Folke, C. (2006). Resilience: the emergence of a perspective for social–ecological systems analyses. Glob. Environ. change 16 (3), 253–267. doi:10.1016/j.gloenvcha.2006.04.002
Ge, M., Yu, K., Ding, A., and Liu, G. (2022). Input-output efficiency of water-energy-food and its driving forces: spatial-temporal heterogeneity of Yangtze River Economic Belt, China. Int. J. Environ. Res. Public Health 19 (3), 1340. doi:10.3390/ijerph19031340
Gong, C., Zhang, X., and Xu, C. (2022). Research on the spatiotemporal evolution and synergistic improvement of economic resilience in China's three major urban agglomerations. Soft Sci. 36 (5), 38–46. doi:10.13956/j.ss.1001.8409.2022.05.06
Guo, H., Chen, J., and Pan, C. (2021). Assessment on agricultural drought vulnerability and spatial heterogeneity study in China. Int. J. Environ. Res. Public Health 18 (9), 4449. doi:10.3390/ijerph18094449
Hao, A. M., and Tan, J. Y. (2020). The mchanism and effect measure of rural industrial integration enabling agricultural resilience. Agric. Econ., 1–20. doi:10.13246/j.cnki.jae.20220418.002
He, C., Xia, X., and Li, M. (2019). Spatial difference and mechanisms of China’s export trade regional resilience. Prog. Geogr. 38 (10), 1558–1570. (in chinese). doi:10.18306/dlkxjz.2019.10.011
He, Y. L., and Yang, S. C. (2021). Study on the ductile forging of agricultural industry chain under the “dual circulation”. Issues Agric. Econ. 10, 78–89. doi:10.13246/j.cnki.iae.20210714.001
Hu, D. L., Du, Z. P., Li, R., and Wu, H. Y. (2018). The evolution of spatial and size distribution in the quantity of Chinese urban enterprises. J. Central China Normal Univ. Sci. 52 (03), 393–399. doi:10.19603/j.cnki.1000-1190.2018.03.016
Huggins, R., and Thompson, P. (2015). Local entrepreneurial resilience and culture: the role of social values in fostering economic recovery. Camb. J. Regions, Econ. Soc. 8 (2), 313–330. doi:10.1093/cjres/rsu035
Jia, F., Shahzadi, G., Bourlakis, M., and John, A. (2023). Promoting resilient and sustainable food systems: a systematic literature review on short food supply chains. J. Clean. Prod. 435, 140364. doi:10.1016/j.jclepro.2023.140364
Jiang, H., Zhang, C., and Jiang, H. P. (2022). Study on effect and mechanism of China’s agricultural economic resilience on agricultural high-quality development. Agric. Econ. Manag. 1, 20–32. doi:10.3969/j.issn.1674-9189.2022.01.003
Kelejian, H. H., and Prucha, I. R. (2010). Specification and estimation of spatial autoregressive models with autoregressive and heteroskedastic disturbances. J. Econ. 157 (1), 53–67. doi:10.1016/j.jeconom.2009.10.025
Li, B., Zhong, Y., Zhang, T., and Hua, N. (2021b). Transcending the COVID-19 crisis: business resilience and innovation of the restaurant industry in China. J. Hosp. Tour. Manag. 49, 44–53. doi:10.1016/j.jhtm.2021.08.024
Li, L. B., and Liu, R. (2021). Producer services agglomeration and the resilience of urban manufacturing industry. Finance & Econ. 11, 64–79. doi:10.3969/j.issn.1000-8306.2021.11.006
Li, Y., Huang, H., and Wang, S. (2021a). Path of urban-rural integrated development in traditional agricultural zones based on rural economic resilience: the study of typical counties of Hebei Province. Econ. Geogr. 41, 28. doi:10.15957/j.cnki.jjdl.2021.08.004
Liu, X. X., Zhang, X., and Li, S. W. (2021). Measurement of China’s macroeconomic resilience: a systemic risk perspective. Soc. Sci. China 1, 12–32.(in chinese).
Liu, Z., and Kong, L. (2021). From segmentation to integration: the resistance and countermeasures to promote the construction of a unified domestic market. China Ind. Econ. 8, 20–36. doi:10.19581/j.cnki.ciejournal.2021.08.002
Lu, F. Y., Yin, W. H., and Liu, N. N. (2021). The spatio-temporal evolution of industrial resilience and its driving factors in the Yangtze River Delta Urban Agglomeration. World Reg. Stud. 30 (3), 589. doi:10.3969/j.issn.1004-9479.2021.03.2019717
Luo, W., He, L., Yang, Z., Zhang, S., Wang, Y., and Liu, D. (2023). Spatio-temporal heterogeneity in the international trade resilience during COVID-19. Applied Geography 154, 102923.
Martin, R., and Sunley, P. (2015). On the notion of regional economic resilience: conceptualization and explanation. J. Econ. Geogr. 15 (1), 1–42. doi:10.1093/jeg/lbu015
Martin, R., Sunley, P., Gardiner, B., and Tyler, P. (2016). How regions react to recessions: resilience and the role of economic structure. Reg. Stud. 50 (4), 561–585. doi:10.1080/00343404.2015.1136410
Reggiani, A., De Graaff, T., and Nijkamp, P. (2002). Resilience: an evolutionary approach to spatial economic systems. Netw. Spatial Econ. 2, 211–229. doi:10.1023/a:1015377515690
Ren, T. Z., and Yin, Z. G. (2022). Digital financial inclusion and inclusive growth of Chinese economy: theoretical analysis and empirical evidence. J. Manag. 35, 23–35. doi:10.19808/j.cnki.41-1408/F.2022.0003
Shannon, C. E. (1948). A mathematical theory of communication. Bell Syst. Tech. J. 27 (3), 379–423. doi:10.1002/j.1538-7305.1948.tb01338.x
Su, C. W., Liu, T. Y., Chang, H. L., and Jiang, X. Z. (2015). Is urbanization narrowing the urban-rural income gap? A cross-regional study of China. Habitat Int. 48, 79–86. doi:10.1016/j.habitatint.2015.03.002
Sun, J., and Sun, X. (2017). Research progress of regional economic resilience and exploration of its application in China. Econ. Geogr. 37, 1–9. doi:10.15957/j.cnki.jjdl.2017.10.001
Wang, X., and Li, M. (2019). The spatiotemporal characteristic of carbon emissions from China’s power sector and its determinants: a spatial econometric analysis. Pol. J. Environ. Stud. 28 (5), 3919–3927. doi:10.15244/pjoes/94843
Wang, Z. Y., and Wang, Y. X. (2019). Spatial and temporal differentiation and influencing factors of the marine economy resilience in China. Econ. Geogr. 39 (2), 139–145. doi:10.15957/j.cnki.jjdl.2019.02.017
Xu, Y., and Deng, H. Y. (2020). Diversification, innovation capability and urban economic resilience. Econ. Perspect. 8, 88–104. (in chinese).
Yang, H. J., and Li, Y. K. (2020). Path choice and optimization of ecological civilization construction in poverty stricken minority areas. Resour. Environ. Yangtze Basin 29 (05), 1095–1109. doi:10.11870/cjlyzyyhj202005005
Yang, Q., Wang, J., Li, C., and Liu, X. P. (2019). The spatial differentiation of agricultural green total factor productivity and its driving factor recognition in China. J. Quantitative & Technol. Econ. 36 (10), 21–37. doi:10.13653/j.cnki.jqte.2019.10.002
Yu, S., Huang, F. R., and Li, L. H. (2021). Analysis of agricultural water resource vulnerability and its variable characteristics in Central Asia.
Yu, W., and Zhang, P. (2019). Study on the spatial-temporal differentiation characteristics and influencing factors of agricultural development resilience in China. Geogr. Geo-Information Sci. 35 (01), 102–108. doi:10.3969/j.issn.1672-0504.2019.01.016
Yuan, L., Li, R., He, W., Wu, X., Kong, Y., Degefu, D. M., et al. (2022). Coordination of the industrial-ecological economy in the Yangtze River economic belt, China. Front. Environ. Sci. 10, 882221. doi:10.3389/fenvs.2022.882221
Yuan, L., Qi, Y., He, W., Wu, X., Kong, Y., Ramsey, T. S., et al. (2024). A differential game of water pollution management in the trans-jurisdictional river basin. J. Clean. Prod. 438, 140823. doi:10.1016/j.jclepro.2024.140823
Zhang, M. D., and Hui, L. W. (2022). Spatial disparities and identification of influencing factors on agricultural economic resilience in China. World Agric. 1, 36–50. doi:10.13856/j.cn11-1097/s.2022.01.004
Zhang, S. H., Chen, J. C., Zhang, L. Z., and Zhang, X. W. (2012). An analysis of agricultural economic growth and its influencing factors based on CCA taking Shanxi province as an example. Econ. Problems (05), 85–88+92. doi:10.16011/j.cnki.jjwt.2012.05.009
Zhang, Y. Z., and Qiao, Y. H. (2021). Study on the spatial effects of different types of environmental regulations on industrial structure upgrading: an empirical study based on spatial Durbin model analysis. Ecol. Econ. 37 (6), 66–73. doi:10.16011/j.cnki.jjwt.2023.07.004
Zhang, Z., Zhao, R. Y., and Yang, S. Y. (2020). Research on spatial spillover effect of industrial structure and regional economic resilience in northeast China. Sci. Technol. Prog. Policy 37, 37–46.
Keywords: agricultural economic resilience, spatial-temporal characteristics, driving factors, spatial spillover effects, sustainable agricultural development
Citation: Chen X, Wang H, Zhu X and Zhang X (2025) Spatial-temporal characteristics of agricultural economic resilience and spatial spillover effects of driving factors: evidence from provincial panel data in China. Front. Environ. Sci. 13:1437018. doi: 10.3389/fenvs.2025.1437018
Received: 23 May 2024; Accepted: 10 January 2025;
Published: 31 January 2025.
Edited by:
Nawab Khan, Shandong Agricultural University, ChinaReviewed by:
Liang Yuan, China Three Gorges University, ChinaCopyright © 2025 Chen, Wang, Zhu and Zhang. This is an open-access article distributed under the terms of the Creative Commons Attribution License (CC BY). The use, distribution or reproduction in other forums is permitted, provided the original author(s) and the copyright owner(s) are credited and that the original publication in this journal is cited, in accordance with accepted academic practice. No use, distribution or reproduction is permitted which does not comply with these terms.
*Correspondence: Haohan Wang, d2FuZ2hhb2hhbkBuYnUuZWR1LmNu
Disclaimer: All claims expressed in this article are solely those of the authors and do not necessarily represent those of their affiliated organizations, or those of the publisher, the editors and the reviewers. Any product that may be evaluated in this article or claim that may be made by its manufacturer is not guaranteed or endorsed by the publisher.
Research integrity at Frontiers
Learn more about the work of our research integrity team to safeguard the quality of each article we publish.